 Xiaohui Liu
 Xin Gui
 Xue Qiu1
 You Wang
95% of researchers rate our articles as excellent or good
Learn more about the work of our research integrity team to safeguard the quality of each article we publish.
Find out more
ORIGINAL RESEARCH article
Front. Earth Sci. , 11 May 2023
Sec. Environmental Informatics and Remote Sensing
Volume 11 - 2023 | https://doi.org/10.3389/feart.2023.1187864
This article is part of the Research Topic Advances in Geo-Resources and Geo-Energy Extraction and Exploitation: Theories, Technologies, and Numerical Simulation View all 10 articles
Introduction: Precisely determining the characteristic stress value of a rock progressive failure process has important theoretical and practical significance for reasonably defining the rock deformation and failure stage, mechanical mechanism, and design parameters.
Methods: Based on the energy characteristics in the process of rock deformation and failure, this paper proposes a new method of rock characteristic stress (EGR) around the index of elastic energy storage capacity, elastic energy growth rate, and dissipative energy growth rate. First, the rationality of the new method is verified by the indoor uniaxial and triaxial loading test data of coal and marble. Second, five different determination methods, namely, lateral strain method, lateral strain difference method, crack strain method, energy dissipation rate method, and volumetric strain method, are compared to further verify the scientific nature of the new method. Finally, the method is applied to the conventional triaxial unloading confining pressure test and true triaxial loading and unloading test of marble, and the new method is fully extended to verify its universality.
Results: The results show that the theoretical basis of the EGR characteristic stress determination method is rigorous and sufficient, and the value process is objective and reasonable. Compared with different methods, the EGR method can accurately define the process of rock asymptotic failure, and its corresponding characteristic stress level is well-consistent and in a reasonable range.
Discussion: The EGR method is applicable to the conventional triaxial unloading confining pressure test and true triaxial loading and unloading test and has good universality.
In energy exploitation and underground engineering construction, there is often an asymptotic failure process of rock. There are many phenomena such as spalling failure of surrounding rock and formation of a damage zone, which fail to reach the ultimate strength of rock. These phenomena play a vital role in the safety and stability of the project. Therefore, the study of the rock asymptotic failure process and the accurate acquisition of rock characteristic stress are the basis for establishing reasonable, scientific and universal rock fracture strength criteria and failure strength criteria. It is a key parameter in predicting the extent and scope of surrounding rock failure (Cai et al., 2004) and has important engineering guiding significance.
In the past 50 years, the progressive failure process of rock has received extensive attention from scholars. Based on the laboratory test research, Bieniawski, (1967); Brown, (1981) divided the progressive failure process of rock into five stages: crack compaction, linear elastic deformation, crack initiation and stable propagation, specimen damage and crack unstable propagation, and specimen failure and post-peak deformation. Cai et al. (2004); Peng et al. (2015); Wang et al. (2011); Peng et al. (2013); Li et al. (2022); Tkalich et al. (2016); Kong et al. (2023); Li et al. (2023) expounded the necessity of dividing the stages of asymptotic failure from the perspective of experiment and theory. The corresponding strength eigenvalues of each stage were compaction stress σcc, crack initiation stress σci, crack damage stress σcd, peak stress σf, and residual stress σr, respectively.
Subsequently, scholars discussed how to accurately determine the asymptotic failure characteristic stress. Some research methods with their contents, advantages, and disadvantages are shown in Table 1. The characteristic stress value was usually determined from the stress–strain aspect by volume strain (Brown, 1981), transverse strain (Lajtai et al., 1990), crack strain (Martin and Chandler, 1994), and moving point regression (Eberhardt et al., 1998).However, such methods were generally subjective and cannot accurately determine the compaction stress σcc and cracking stress σci, which would bring hidden dangers to prevent engineering instability.
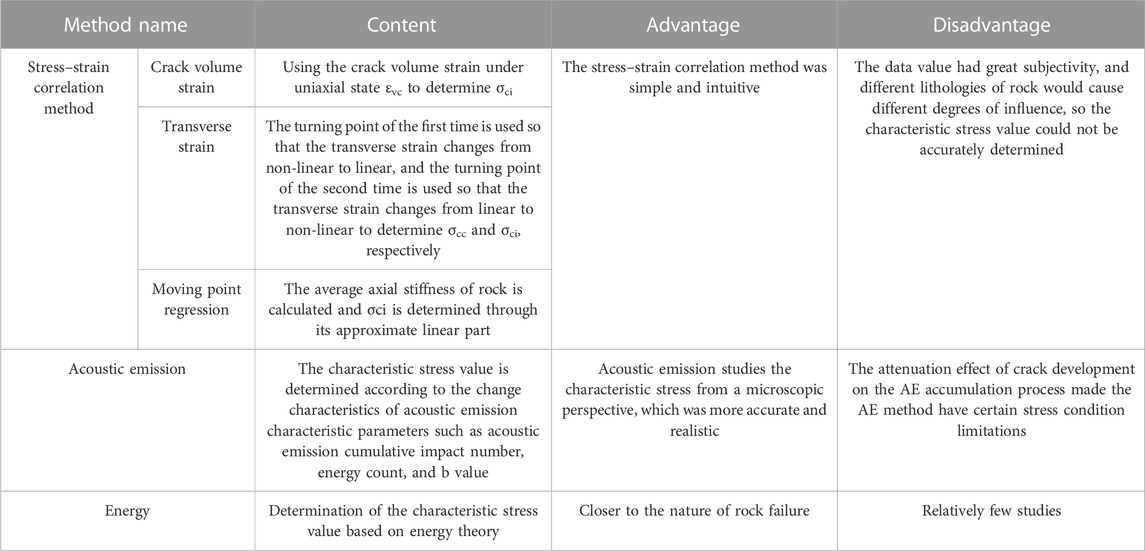
TABLE 1. Contents, advantages, and disadvantages of common methods for determining characteristic stress.
Therefore, according to the change characteristics of AE characteristic parameters such as AE cumulative impact number, energy count, and b value, it was more advantageous to study different characteristic stresses from a microscopic perspective (Kim et al., 2015; Xie et al., 2023). However, the attenuation effect of crack development on the accumulation process of acoustic emission provided the acoustic emission method with certain limitations of stress conditions.
Therefore, according to the law of energy conversion and conservation, energy conversion is a basic feature in the physical process of matter. As an aggregate of various minerals, rock is also an open system that can receive, store, and release energy (Zhao and Xie, 2008; Xie et al., 2004; Liu et al., 2023). The nature of rock cracking and failure is an energy-driven state instability phenomenon. Energy theory was used to determine that the characteristic stress of rock is bound to be closer to the nature of rock failure (Liu et al., 2022). Griffith (1921) proved the energy theory through a rock tensile test, and Yang et al. (2015) constructed a damage model based on energy dissipation and determined the compaction stress and cracking stress. Jin et al. (2004) calculated the dissipation energy based on cyclic loading, defined the damage variable of materials from the perspective of energy dissipation, and determined the theoretical calculation formula and damage threshold of the damage variable. Xie et al. (2005a) studied the internal relationship between energy dissipation, energy release, rock strength, and overall failure during rock deformation and failure, and based on the strength loss criterion of energy dissipation and the global failure criterion of releasable strain energy, the critical stress of rock global failure was determined. Ning et al. (2018) studied the energy dissipation law of brittle coal and rock under different confining pressures and proposed to determine the crack initiation stress σci and damage stress σcd, based on the elastic strain energy rate and dissipation energy rate. Liu et al. (2020) expressed the energy dissipation process of coal and rock by introducing the dissipation energy rate and proposed a method to determine the fracture closure stress point and damage stress point of coal and rock using the energy dissipation rate curve.
The content, advantages, and disadvantages of commonly used methods for determining characteristic stress are given in Table 1. At present, there are often subjective inaccuracies or limitations in the application of stress–strain correlation methods and acoustic emission methods. Adopting the ability theory method is closer to the essence of rock failure, providing a more precise and versatile determination of rock characteristic stress. To sum up, a new method is proposed to determine the crack closure stress σcc, crack initiation stress σci, damage stress σcd, and instability stress σpr. It comprehensively considers the process of energy transformation, release, and dissipation from the characteristics of energy evolution in the process of rock asymptotic failure. The rationality, scientificity, and universality of the method are discussed and verified. A new approach is proposed to accurately determine the asymptotic failure process of rocks and effectively prevent the instability and failure of underground engineering.
The failure process of rock under load is essentially a state instability phenomenon driven by energy. Assuming that the rock mechanics test is a thermodynamically closed system, it can be observed from the relationship between work and energy that the work performed by the external to the rock sample W equals the change in the internal energy of the rock sample U0 during the test process. The energy transformation in marble includes elastic energy, plastic energy, radiation energy, thermal energy, and kinetic energy (Zhao and Xie. 2008; Xie et al., 2005; Xie et al., 2008), among which elastic energy is the energy stored and released by elastic deformation of rock, and plastic energy is the energy consumed by micro-crack propagation and friction between crack surfaces in rock. Radiation energy, heat energy, and kinetic energy are different forms of energy consumption caused by rock fracture propagation, but the proportion is relatively small, the monitoring is complex, and the cost is high. Therefore, in the subsequent analysis, plastic energy, radiation energy, heat energy, and kinetic energy are attributed to dissipative energy, that is, in the transformation of work and energy in marble, the total absorption energy U is composed of the dissipative energy Ud of the released elastic strain energy Ue stored in unit volume. So, the total energy of the rock (Xie et al., 2005) sample is
The total absorption energy is
In the aforementioned equation, σ1, σ2, and σ3 are the maximum principal stress, medium principal stress, and minimum principal stress, respectively, and ε1, ε2, and ε3 are the strains in the directions of the maximum principal stress, medium principal stress, and minimum principal stress, respectively.
The elastic energy is calculated as follows:
where uei is the elastic energy of each principal stress (Xie et al., 2008):
where
Substituting Eq. 5 into Eq. 4, replacing
By substituting Eq. 6 into Eq. 3, the elastic energy can be obtained:
This paper aimed to explore the accurate determination of the rock characteristic stress value. Considering that both the closure and initiation of rock fractures affect the ability of rock to store elastic energy, this paper will deduce the change trend in the rock’s ability to store elastic energy in the process of progressive failure from the perspective of elastic property.
The increase of elastic energy of the rock under load comes from the absorption of elastic energy by the rock during axial contraction. Combining with Eq. 7, it can be seen that elastic energy is essentially a quadratic function of the elastic strain of the rock under load. Assuming that the proportion of axial elastic strain in axial strain at a certain moment is α, then
The elastic modulus and Poisson’s ratio in the calculation formula of elastic energy are constant values, which can transform the elastic energy into a quadratic function containing parameters α, ε1, σ2, and σ3 which can transform the elastic energy into a quadratic function containing four parameters:
Therefore, the second derivative of elastic energy with respect to axial strain can be defined as the rock elastic energy storage capacity index Ab, which can be expressed as follows:
The elastic energy storage capacity index Ab of rock is a function without axial stress and axial strain and represents the elastic energy storage capacity of rock under load after unit strain at a certain time.
The elastic energy storage capacity index Ab can be used to analyze the energy storage capacity of marble at each moment for the reasonable and accurate determination of rock characteristic stresses. However, in practice, due to comprehensive factors such as rock anisotropy, heterogeneity, internal defects, and unavoidable test equipment errors in laboratory tests, the data after taking the second derivative of the test data have great volatility, which makes them difficult to observe. Therefore, only the first derivative of axial strain ε1 is taken in this paper, and the first derivative of elastic energy Ue with respect to axial strain ε1 is defined as the elastic energy growth rate κe, expressed as follows:
The growth rate of the elastic energy κe–axial strain ε1 curve can be used to analyze the elastic energy storage index Ab of marble under various axial displacements.
It is worth observing that the elastic energy storage capacity curve has obvious changes during the crack closure and initiation. However, both the rock crack expansion and damage stage show a downward trend, which makes it difficult to determine the rock damage stress value. Therefore, considering that the energy dissipation of the loaded rock comes from the development of internal fractures of the rock, the trend of fracture expansion during the progressive failure of the rock will be analyzed from the perspective of energy dissipation.
The stress generated inside the rock under load can be divided into spheric stress p, which causes elastic shrinkage, and deviator stress q, which causes plastic deformation. By the physical meaning of energy, the marble in the process of gradual damage dissipation mainly comes from rock fracture initiation, development, and expansion caused by plastic deformation produced by energy dissipation. The energy dissipation of rock is closely related to increase in deviatoric stress q in the process of loading, so the dissipative energy growth rate κd for dissipation can be defined and predominate the Ud derivative of deviatoric stress q, and the expression is
According to the variation of dissipated energy κd in the process of rock deformation and failure, the fracture damage of the rock under load at each time can be analyzed, and the characteristic stresses of the rock can be determined reasonably and accurately combined with the growth rate of elastic energy.
Assuming that rock deformation and failure is a continuous process, this subsection, which is from the perspective of mathematical analysis and applied mathematics, will combine the elastic energy storage capacity index Ab, the growth rate of elastic energy κe, and dissipative energy κd to determine the threshold (characteristic stresses) of each stage of rock deformation and failure. The process and thinking are as follows:
1) Compaction stage (crack closure stress σcc)
In this stage, the original pores inside the rock are continuously compressed, the rock performance is improved, and the rock energy storage capacity is strengthened. The growth rate curve of elastic energy is concave, and the elastic energy storage capacity index Ab increases. At the same time, the rock has no damage. At this stage, the dissipated energy does not increase from the rock deformation, and the growth rate of dissipated energy is close to “0.” At the end of this stage, the growth curve of rock elastic energy follows a linear trend, and the elastic energy storage capacity index Ab enters the horizontal stage. The corresponding stress threshold of this stage is the closure stress σcc.
The crack closure stress is the junction point of the compaction stage and linear elastic stage, which on the left side of elastic energy growth, follows a “concave” shape, elastic energy storage capability index Ab shows a growing trend, and on the right side of elastic energy growth for the linear function, the elastic energy storage capability index Ab is constant at the same time because the pressure dense phase and the linear elastic stage did not produce rock fracture damage. Therefore, the growth rate of dissipated energy is close to the “0” line at both ends of the point without any change. The closure stress is the stress value corresponding to point A on the curve of the elastic energy growth rate, elastic energy storage capacity index, and dissipative energy growth rate (Figure 1).
2) Linear elastic stage (crack initiation stress σci)
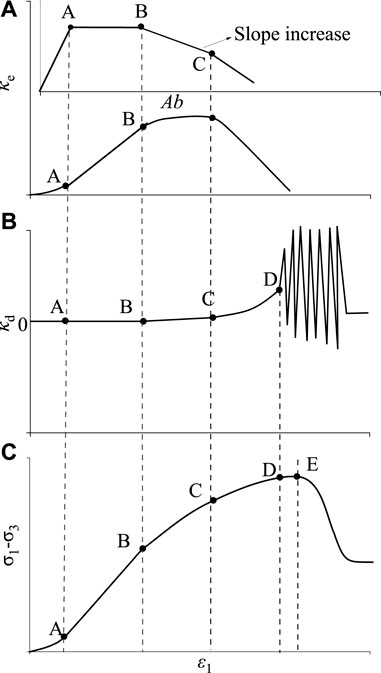
FIGURE 1. Schematic diagram of the determining method of characteristic stresses at each stage:(A) elastic energy storage capacity index Ab and elastic energy growth rate κe curve; (B) dissipation energy growth rate κe curve; and (C) axial stress–strain curve.
At this stage, the original pores in the rock have been compressed, and the stress in the rock is not sufficient for pore expansion and generation of new fractures. The rock shows elastic material characteristics, the growth curve of elastic energy increases linearly, and the elastic energy storage capacity index Ab shows a horizontal line. The growth rate of dissipated energy is still close to “0,” and the corresponding stage stress threshold is the crack initiation stress σci.
The crack initiation stress is the boundary point of the linear elastic stage and plastic expansion stage. In the growth curve of elastic energy, it is the point that changes to non-linear growth; in the curve of elastic energy storage capacity index Ab, it is the point that deviates from the level; in the growth curve of dissipated energy, it is the point that changes to linear growth, which is marked by point B in Figure 1.
3) Plastic expansion stage (damage stress σcd)
At this stage, due to the heterogeneity of rock, the internal stress of the rock reaches the condition of local crack initiation and expansion, the rock begins to produce plastic deformation, and the elastic energy storage capacity begins to decline. The growth rate curve of elastic energy is “convex,” and the elastic energy storage capacity index begins to decline. At the same time, due to the occurrence of crack damage, the rock begins to produce energy dissipation, and the growth rate of dissipated energy begins to increase. The stress threshold at this stage is the damage stress σcd.
Damage stress is the cutoff point from fracture damage to rapid development, but this point is difficult to be accurately determined by the change in the elastic energy growth rate and elastic energy storage capacity index. However, as the sudden increase of the crack growth rate will change the growth trend of the dissipated energy growth rate, the damage stress can be accurately determined according to the turning point of the dissipated energy growth rate curve that linearly transforms into a “downward convex type,” marked by point C in Figure 1.
4) Accelerated crack expansion stage (instability stress σpr)
In this stage, the micro-cracks in the rock accelerate to expand and converge into large cracks, the growth rate of elastic energy and elastic energy storage capacity index decreases, and the energy dissipation of the rock intensifies. The growth rate of dissipative energy accelerates in a “convex” shape, and the corresponding stress threshold is the instability stress σpr.
Instability stress is the cutoff point between the generation of large cracks and the beginning of the development of large cracks. It cannot be determined in the growth curve of elastic energy and the energy storage capacity index of elastic energy but can be determined by the point with violent fluctuations in the growth curve of dissipated energy, marked by point D in Figure 1.
5) Fracture instability through stage (peak stress σf)
At this stage, the large cracks formed in the accelerated fracture expansion stage begin to break through. As the breaking through of large cracks and the development of cracks alternate in this stage, the dissipative energy growth rate curve presents high-amplitude and high-frequency fluctuation. At the end of this stage, the bearing capacity of the sample reaches its maximum.
The peak stress is the end point of this stage. As the energy dissipation of rock continues after the peak stress point, there is no obvious defining feature on the dissipative energy growth rate curve. However, as the maximum point on the stress–strain curve, the peak stress can be easily identified on the stress–strain curve, as shown in point E in Figure 1.
This experiment consists of two kinds of rocks, coal and marble. A uniaxial compression test and conventional triaxial compression test are used to verify this method. The uniaxial compression test and conventional triaxial compression test are based on the MTS815 Flex Test GT rock mechanics test system, Key Laboratory of Deep Earth Science and Engineering of Ministry of Education, Sichuan University, and the test equipment is shown in Figure 2. Coal rock and marble were collected from the Furong Baijiao Coal Mine and Jinping II Hydropower Station auxiliary diversion 1 # construction adit, respectively. The sample taken from Furong Baijiao coal is ash-rich and sulfur-rich anthracite. The Jinping grade II marble sample is thick and extremely thick-layered fine-grained or coarse-grained marble. The physical parameters of the sample are shown in Table 2.
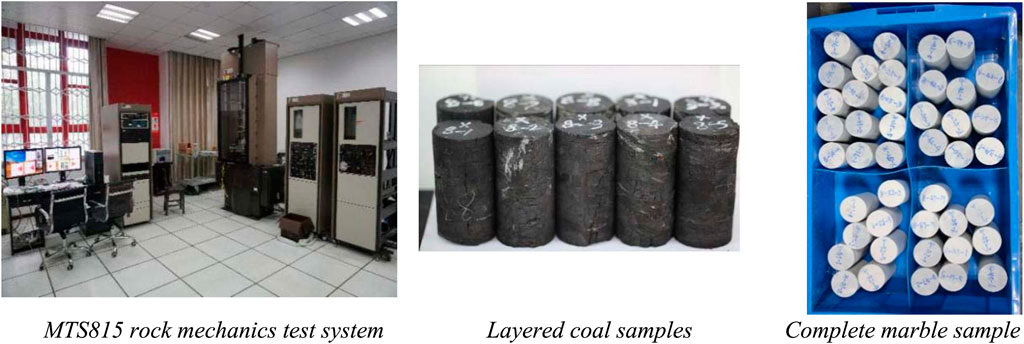
FIGURE 2. Test equipment and rock samples.

TABLE 2. Physical parameters of samples.
This paper intends to design a uniaxial compression test and triaxial compression test. The uniaxial loading test and conventional triaxial test under 25 MPa confining pressure were carried out on coal and marble, respectively. The tests were all carried out at a 10−5s−1 strain rate. The strain control loading was realized using a linear variable differential transformer (LVDT) during the test.
According to Eqs 11, 12, the growth rate curve of elastic energy and dissipated energy of single triaxial coal rock and single triaxial marble is plotted as shown in Figure 3. The energy storage capacity curve can be inferred from the elastic energy growth rate curve. According to Figure 3, the growth rate curve of elastic energy shows three stages: 1) upper concave non-linear stage, 2) linear growth stage, and 3) concave non-linear stage; according to the elastic energy growth rate curve, the first-order derivative elastic energy storage capacity index shows a rising–horizontal–downward trend. The growth rate curve of dissipated energy shows four stages: 1) near-straight section, 2) linear rising section, 3) upper concave non-linear stage, and 4) rapid fluctuation section. It follows that the three curve evolution processes are consistent with the determination ideas described in Section 2.2.
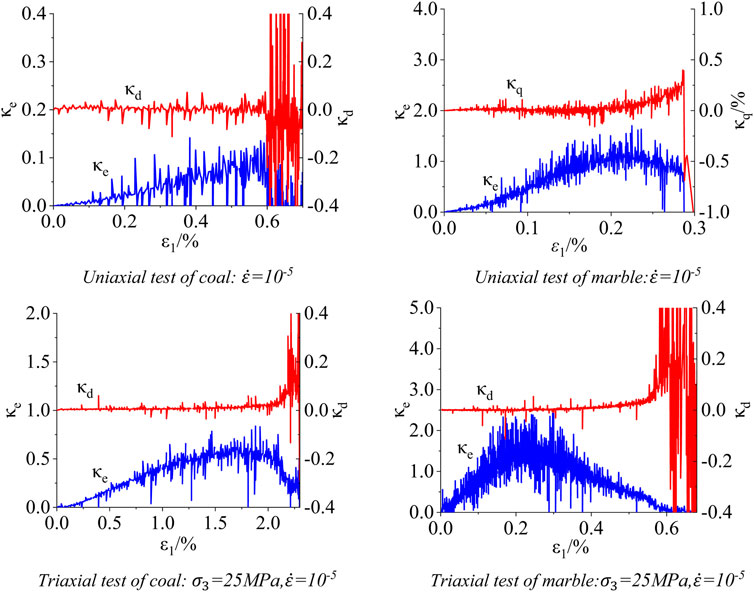
FIGURE 3. Growth rate curve of elastic energy and dissipative energy.
Many scholars have found that the energy evolution in the process of rock deformation and failure has obvious stage characteristics (Liu et al., 2019; Wang et al., 2019; Zhang et al., 2020). Therefore, this paper chooses to use the first derivative of the energy evolution curve to determine the strength threshold of each stage of rock and find the characteristic stress value of rock. Using energy evolution characteristics to determine characteristic stress, as was first proposed by Ning et al. (2018), helps analyze the evolution law of elastic energy and dissipated energy of coal rock under different confining pressures. It is proposed that the characteristic stress value of coal rock is determined by the ratio of elastic energy and dissipative energy in the total strain energy–elastic energy rate α and dissipative energy rate β. The feasibility of this method is analyzed and verified. According to the law of energy conversion and conservation, energy conversion is a basic feature in the physical process of matter, and the destruction of matter is a state instability phenomenon driven by energy. In the process of rock deformation and failure, the internal energy of rock will inevitably change, leading to continuous evolution of micro-fractures in the rock, from disorderly micro-fractures to macro-cracks that can expand and connect. With the connection and extension of macro-cracks, large cracks will eventually be integrated along a certain direction to cause rock failure. Therefore, it is reasonable and feasible to explain the evolution of fractures and determine the characteristic stress from the perspective of energy growth rate, which has a theoretical background.
In this paper, the energy growth rate curve has certain volatility when determining the strength characteristic value of the sample at each stage of deformation and failure. On one hand, anisotropy and heterogeneity are caused by random distribution of cracks, cavities, and internal defects in the rock. As a result, rock deformation is irregular and anisotropic, resulting in large and irregular fluctuations in energy growth rate, and this part of the fluctuation is an inevitable, objective existence. On the other hand, system error, test equipment error, and point error will cause fluctuations in the energy growth rate curve. Therefore, it is reasonable for the energy growth rate curve to show certain volatility, and the overall trend and characteristics can reflect the process of crack closure–initiation–propagation–convergence–penetration. Therefore, it is reasonable and feasible to use this method to determine the closure stress σcc, crack initiation stress σci, damage stress σcd, and instability stress σpr.
The energy growth rate curve of the laboratory test results has certain volatility, but the characteristics are obvious, and it is easy to find the characteristic stress value of each stage. Taking the energy growth rate curve of coal and rock under conventional triaxial compression of 25 MPa confining pressure as an example (as shown in Figure 4), the following characteristic stress values are determined:
1) Closure stress: The elastic energy growth rate at stage I is a concave curve. It can be inferred that the elastic energy storage capacity Ab at this stage shows an upward trend and the growth rate of dissipated energy is close to 0, same as the characteristic description of the compaction stage in Section 2.2. Therefore, stage I corresponds to the compaction stage, and the right end point is closure stress.
2) Crack initiation stress: The elastic energy growth rate at stage II is linear. It can be inferred that the elastic energy storage capacity Ab at this stage shows a horizontal trend and the growth rate of dissipated energy remains 0, which is the same as the characteristic description of the elastic stage. Therefore, stage II corresponds to the elastic stage, and the right end point is crack initiation stress.
3) Damage stress: The elastic energy growth rate at stage III is concave. It can be inferred that the elastic energy storage capacity Ab began to decline at this stage and the growth rate of dissipated energy starts to break away from 0, showing a slow linear growth trend, which is the same as the characteristic description of the plastic expansion stage. Therefore, stage III corresponds to the plastic growth stage, and the right end point is the damage stress.
4) Instability stress: In stage IV, the growth rate of elastic energy began to decline. It can be inferred that the elastic energy storage capacity Ab at this stage is negative and continues to decline, and the growth rate of dissipated energy shows increases rapidly non-linearly, which is the same as the characteristic description of the rapid expansion stage of fracture. Therefore, stage IV corresponds to the rapid expansion stage of the crack, and the right end point is the instability stress.
5) Peak stress: The fluctuation of the elastic energy growth rate in stage V is intensified and continues to decline. It can be inferred that the elastic energy storage capacity Ab will continue to decline at this stage and the growth rate of dissipated energy fluctuates with high amplitude and high frequency, which is the same as the characteristic description of fracture instability and penetration stage. Therefore, stage V corresponds to the rapid expansion stage of the crack, and the right end point is the peak stress.
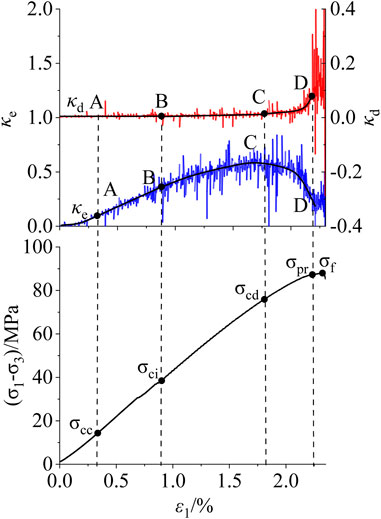
FIGURE 4. Example of the determination of characteristic stress: conventional triaxial compression coal rock,
It can be seen that the closure stress, crack initiation stress, damage stress, and instability stress are determined by using the elastic energy storage capacity index, elastic energy growth rate, and plastic energy growth rate. The accuracy of this determination method will be discussed as follows.
1) Closure stress and crack initiation stress
This study adopts the lateral strain method considering lateral deformation (Lajtai et al., 1990) and the lateral strain difference method (Zhao et al., 2015). The crack strain method (Martin and Chandler, 1994) and the energy dissipation rate method (Liu et al., 2020), which are also based on the energy principle, are used to verify the closure stress and crack initiation stress determined by the energy growth rate method in this study. The closure stress values of coal and marble under different methods is given in Table 3, and the fracture initiation stress value is given in Table 4.
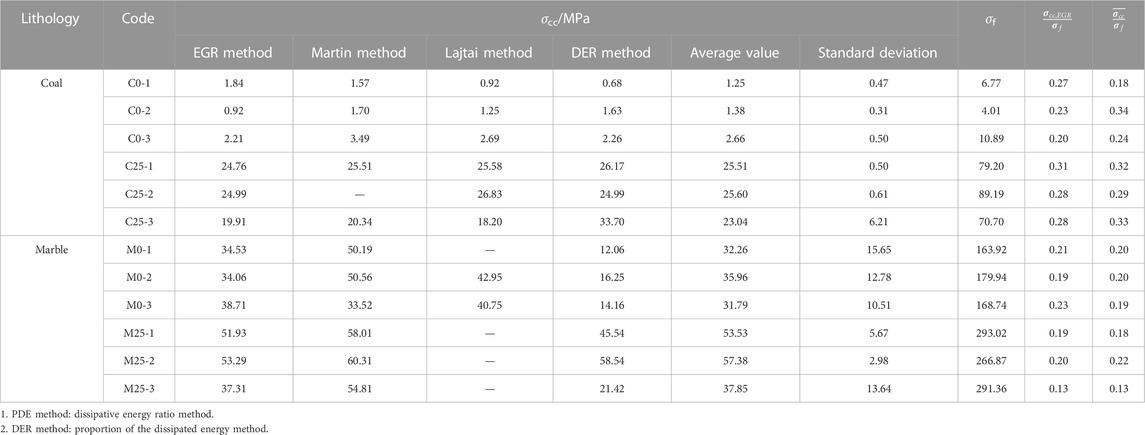
TABLE 3. Crack closure stress.
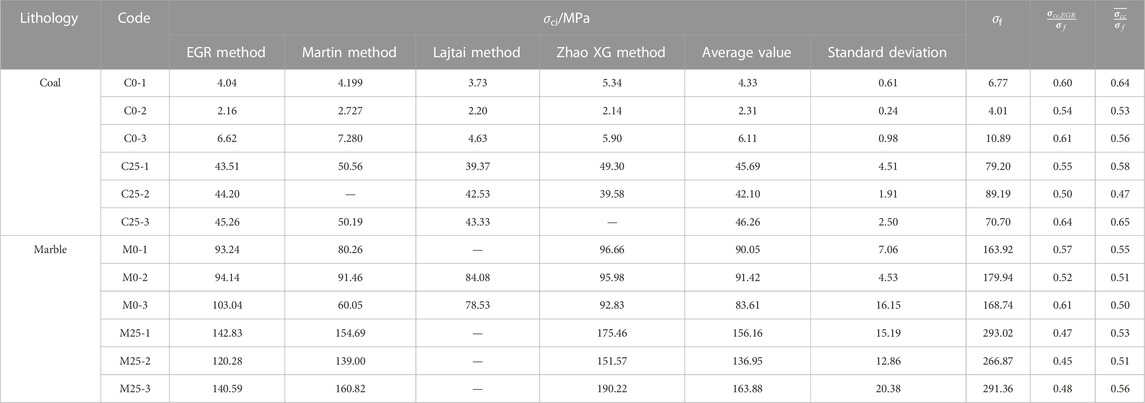
TABLE 4. Crack initiation stress.
It can be seen from Tables 3, 4 that the crack initiation stress level (ratio of crack initiation stress to ultimate strength) of bedded coal and rock determined by the energy growth rate method is 0.54–0.64, and the reasonable range of the stress level of the crack initiation stress of the bedded rock is 0.5–0.6 (Cai et al., 2004), which basically conforms to the range. At the same time, it can be seen that the crack initiation stress level of this method is also basically consistent with the stress level of 0.47–0.65 of the mean value of the crack initiation stress determined by the four methods.
The stress level of marble crack initiation stress is 0.45–0.57, basically in line with the current statistics that the reasonable range of the stress level of complete rock crack initiation stress is 0.4–0.5 (Cai et al., 2004). However, there are some differences which are caused by different lithology, sample conditions, and stress paths. Zhou Hui pointed out that the fracture initiation stress level of marble is 0.47–0.64, through uniaxial and triaxial loading of marble (Zhou et al., 2015), and the value determined by this method is also in this range. At the same time, it can be seen that the crack initiation stress level of this method is also basically consistent with the stress level of 0.51–0.56 of the mean value of the crack initiation stress determined by the four methods, indicating that the determination of the crack initiation stress of this method is more accurate.
The closure stress level of marble determined by this method is 0.13–0.21, which is basically consistent with that obtained by most scholars (Martin and Chandler, 1994; Zhou et al., 2015), and is also consistent with the stress level of 0.13–0.22 of the mean closure stress determined by the four methods. The closure stress level of bedded coal and rock is 0.20–0.31, which is significantly higher than that of marble. This is due to the fact that the bedding coal rock is a heterogeneous sedimentary rock with primary fracture development, and its original pore development degree is far greater than that of marble. Therefore, it is in line with the actual situation that a higher stress level is required for the original crack compaction closure, and this method can accurately reflect the actual size of the closure stress. On the other hand, the closure stress level of bedding coal and rock determined by this method is highly consistent with the mean value of 0.18–0.33 determined by the four methods, which also proves that this method is more accurate in determining the closure stress of coal and rock.
2) Damage stress
The damage stress is compared with the determined value of the energy growth rate method in this paper by the volume strain method, which is widely used at present, and the energy dissipation rate method, which also uses the energy principle. The damage stress level of coal and marble under the three value methods is given in Table 5. It can be seen from Table 5 that the damage stress level of bedded coal and rock determined by the energy growth rate method is 0.84–0.93, and it basically conforms to the reasonable range of 0.9–1.0 for bedded rocks (Cai et al., 2004). At the same time, it can be seen that the damage stress level of this method is basically consistent with the stress level of 0.77–0.91 of the average damage stress determined by the three methods.
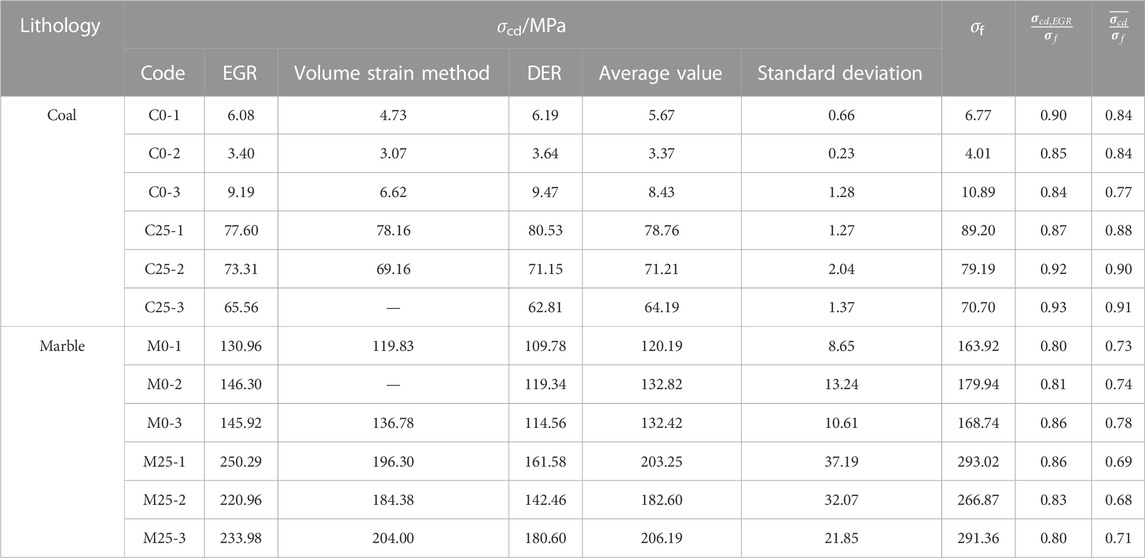
TABLE 5. Damage stress.
The damage stress level of marble is 0.80–0.86, which conforms to the reasonable range of 0.8–0.9 for complete rock (Cai et al., 2004; Zhou et al., 2015). The difference between the stress level of 0.68–0.73 and the mean value of damage stress determined by the three methods is large, mainly due to the large difference between the damage stress values determined by the energy dissipation rate method. Considering that the energy dissipation rate method is proposed for coal and rock, the lithologies of marble and coal and rock are quite different. This method may not be suitable for dense high-confining pressure triaxial marble, and it can be seen that the value difference between the volumetric strain method and this method is small. Moreover, the damage stress level of this method is closer to 0.8–0.9, which indicates that the value of this method is in line with the actual situation. It can be seen that this method is more accurate in determining the damage stress of bedded coal and marble.
3) Instability stress
The instability stress of the rock fracture precursor point determined by the EGR method is shown in Table 6. It can be seen from the table that under the triaxial stress condition, the EGR method can not only determine three traditional characteristic stresses but also find the precursor stress of rock instability failure–instability stress. In addition to three-dimensional stress conditions, the instability stress of coal and rock can also be determined by this method under uniaxial conditions. However, marble is obviously hard and brittle under uniaxial conditions, and under this path, the internal cracks of marble will be directly damaged when they start to connect, and the bearing capacity will decrease suddenly. It is impossible to determine the damage precursor through the point where the cracks penetrate.
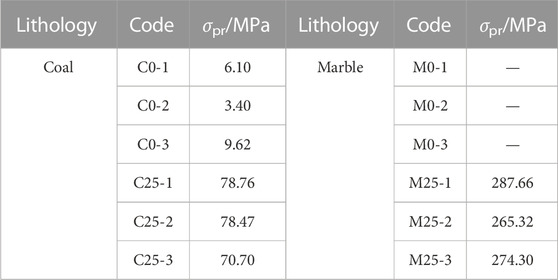
TABLE 6. Instability stress.
The EGR method has good applicability in determining the instability stress under triaxial conditions. However, the applicability under uniaxial conditions is determined by lithology, and it is necessary to determine whether this method can be used to establish through tests.
It can be seen that the EGR method can accurately determine the compaction, crack initiation, and damage stress at the same time. In addition, this method can find the precursor point of rock fracture, which provides a reference for early warning of rock failure and instability. It can be seen that the EGR method is applicable to the two kinds of rocks with large lithological difference between bedded coal and marble. At the same time, it is also applicable to uniaxial compression and conventional triaxial compression paths, which shows that the EGR method has certain universality. This method is now introduced into the unloading path and the true three-axis loading and unloading path for universal verification.
1) Unloading path
The initial confining pressure of the conventional triaxial unloading confining pressure test is 25 MPa, and the unloading stress level is 80% of the ultimate strength. Test data are from the literature (Gui, 2022). Figure 5 shows the typical elastic energy growth rate curve and dissipation energy growth rate curve under the unloading path. It can be seen that this method can also be used to determine the stress eigenvalue under this path. At the same time, it can be seen that under the conditions of rock unloading and surrounding rock testing, the growth rate curve of dissipated energy during the stage of fracture instability and connection fluctuates significantly, forming a “red block.” This indicates that under the condition of unloading confining pressure, the development of fracture connection becomes more intense during the stage of fracture instability and connection in rocks. The characteristic stress values are shown in Table 7. It can be seen that the EGR method is also applicable under the unloading path. The stress level ranges of the crack closure stress, crack initiation stress, and damage stress are 0.12–0.15, 0.45–0.52, and 0.76–0.81, respectively, which are consistent with the reasonable stress level ranges of marble. At the same time, it can be seen that under the condition of triaxial unloading of confining pressure marble, this method is also applicable to the determination of failure precursors.
2) True three-axis loading and unloading paths
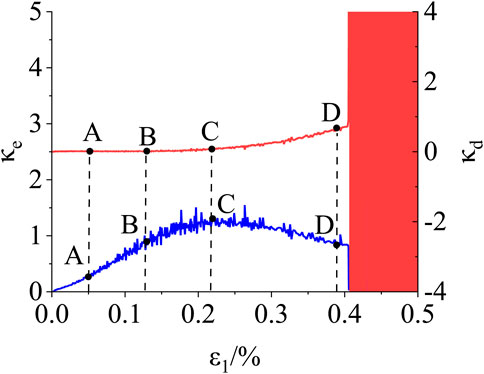
FIGURE 5. Typical elastic energy growth rate curve and dissipated energy growth rate curve of the unloading path.

TABLE 7. Characteristic stresses of unloaded marble.
Three kinds of initial lateral stresses are designed for the true triaxial loading and unloading test, which are 41/25, 56/40, and 66/50 (initial middle principal stress/initial minimum principal stress). It includes two stress paths: true triaxial loading and true triaxial loading with maximum principal stress simultaneously unloading minimum principal stress. Test data are obtained from the literature (Gui, 2022).
Figure 6 shows the typical elastic energy growth rate curve and dissipation energy growth rate curve of the true triaxial path. It can be seen that under the true triaxial loading and unloading path, the characteristics of the rock energy growth rate curve are also obvious, and only the characteristics of the first stage do not appear. This is because in the numerical test, the marble model has no original micro-defects, so there is no compaction process. Therefore, the EGR determination method is applicable under the true three-axis path. The characteristic stress values under the true triaxial loading and unloading paths are given in Table 8. The stress level range of crack initiation stress and damage stress under the loading path is 0.57–0.6 and 0.85–0.9, respectively, which conforms to the reasonable stress level range of complete marble. The stress level range of crack initiation stress and damage stress under unloading path is 0.65–0.68 and 0.94–0.96, respectively, which is slightly higher than the reasonable stress level range of complete marble. This is because the peak strength of the unloading test is lower than that of the loading path, so it is reasonable to slightly increase the stress level of the characteristic stress. At the same time, it can be seen that under the condition of true triaxial loading and unloading, this method is also applicable for the determination of instability precursor instability stress.
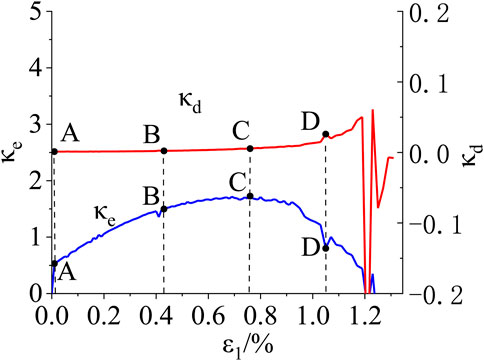
FIGURE 6. Typical elastic energy growth rate curve and dissipative energy growth rate curve of the true triaxial path.
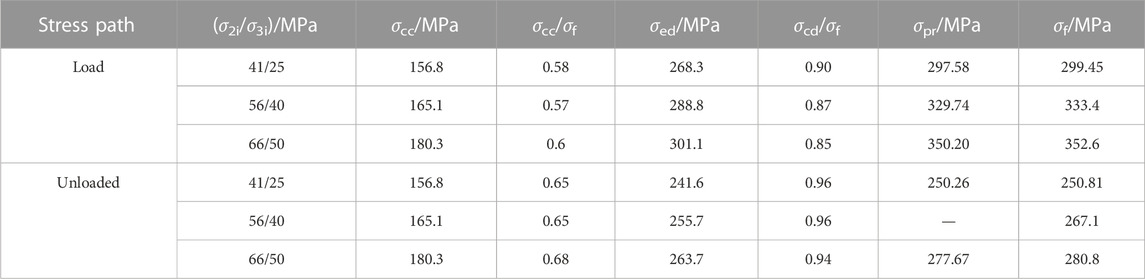
TABLE 8. Characteristic stresses under the true triaxial path.
The rationality, accuracy, and universality of the EGR method were discussed previously. This section compares this method with the five commonly used methods mentioned in this article and discusses the advantages and disadvantages of this method.
The Martin method determines the crack closure stress and crack initiation stress according to the two turning points of the crack volume strain εvc before and after the zero value. This method is significantly affected by the value of Poisson’s ratio, and the change of Poisson’s ratio ±5% will cause a change in crack initiation stress ±40%.
Both the Lajtai method and Zhao XG method consider transverse strain to be more sensitive to crack propagation. Lajtai determined that the turning point of transverse strain from non-linear to linear for the first time is σcc, and the turning point from linear to non-linear is σci. However, the transformation of the transverse strain curve is not obvious in this method, and it is difficult to observe in marble samples. As shown in Figure 7, in the transverse strain curve of the marble sample, there is no linear growth curve. Zhao X G selected the transverse strain data from the beginning of the test to the damage stress point and connected the starting point with the damage stress point determined by the energy dissipation method as the reference line, determined by the maximum value of the transverse strain difference ∆LSR under the same axial stress σci. Compared with the Lajtai method, this method has obvious characteristics and is easy to determine. However, due to the influence of damage stress determination, it is necessary to determine the damage stress first with other determination methods.
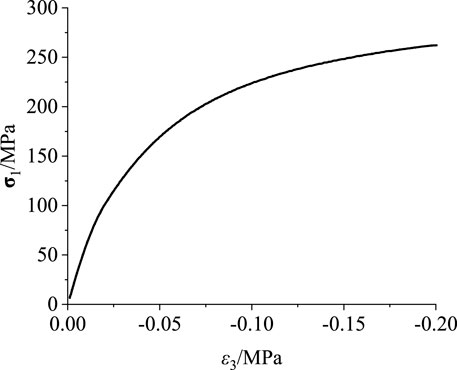
FIGURE 7. Axial stress–transverse strain curve under the failure of the Lajtai method (rock sample: M25-1).
The volume strain method is the most commonly used method to determine the damage stress at present. The turning point at which the volume strain begins to decrease is the damage stress. However, this method can only determine the damage stress and needs to be combined with other methods to determine the characteristic stress value. On the other hand, the method also fails under certain test conditions, as shown in Figure 8. There is no turning point of volume reduction in triaxial coal and rock during failure.
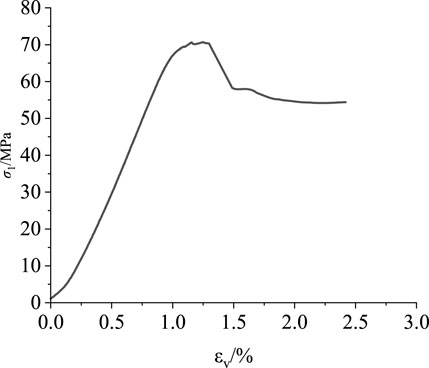
FIGURE 8. Axial stress–volumetric strain curve under the failure of the volume strain method (rock sample: C25-3).
The DER method is proposed based on the uniaxial coal and rock test. As shown in Table 4 and Table 6, the closure stress and damage stress of marble determined by this method are relatively small, especially the closure stress, which is only 40% of the average value determined by various methods. Obviously, this method is significantly affected by lithology and is more suitable for coal and rock.
The EGR method proposed in this paper is based on further deduction of the rock energy dissipation theory proposed by Xie et al. (2005) and the reasonable explanation of the value process, which has a rigorous and sufficient theoretical basis. Compared with the current determination method, this method can independently determine the three characteristic stresses of closure, crack initiation, and damage and does not need to be combined with other methods. This method can also determine the failure precursor point of the instability stress at the same time, reducing the workload of determining the characteristic stress and the failure precursor point. Combined with the accuracy analysis and universality analysis in this paper, this method is applicable to the uniaxial, conventional triaxial, and true triaxial loading and unloading tests of coal and marble with different lithologies, and the determined characteristic stress is accurate and reasonable. Therefore, it can be considered that this method has certain advantages in determining closure stress, crack initiation stress, damage stress, and instability stress. However, when the method is used to determine the instability stress in the uniaxial test, it will be affected by the lithology. It is necessary to determine whether the method can be used to determine the failure precursor instability stress through the test.
Rock failure is a complex process, consisting of different forms of energy conversion and transfer, that is, rock failure is the result of energy conversion, release, and dissipation. Therefore, this paper analyzes the progressive failure process of loaded rock from the perspective of energy, defines the growth rate of elastic energy κe and dissipation energy κd to analyze the progressive failure process of loaded rock, proposes a new method to determine the stress characteristic value of the energy growth rate (EGR), and uses the conventional loading test of the uniaxial triaxial coal rock and uniaxial triaxial marble to verify. The conclusion is as follows:
1) A method is proposed to determine the crack initiation stress and closure stress by the elastic energy growth rate curve and the elastic energy storage capacity index curve and to determine the damage stress and instability stress by the dissipated energy growth rate curve, which are combined to determine the strength characteristic values of each stage of rock progressive failure
2) The determination method of the EGR characteristic stress value is based on rigorous and sufficient theory, and the evaluation process is objective and reasonable. Meanwhile, the characteristic stress value is determined by a variety of methods. Compared with the reasonable range of stress levels of each characteristic stress, the rationality and accuracy of the determination of characteristic stress values by the EGR method were verified.
3) This method is extended to the conventional triaxial unloading confining pressure test and true triaxial loading and unloading test. This method is also applicable to the aforementioned conditions. It shows that the determination method of the EGR characteristic stress value has good universality, and this method can provide a new idea for the determination of rock strength characteristic values.
4) The rock shows different stress–strain relationships at each stage of progressive failure. Therefore, in the subsequent research, it is necessary to consider how to combine the determination method of characteristic stress with the construction of a rock constitutive model to establish a constitutive model closer to the true stress–strain relationship of rock.
The original contributions presented in the study are included in the article/Supplementary Material; further inquiries can be directed to the corresponding author.
XL contributed to the conception of the study; XG, YZ, and YX performed the experiment; XL, XG, YW, and XQ contributed significantly to analysis and manuscript preparation; XG performed the data analyses and wrote the manuscript. All authors contributed to the article and approved the submitted version.
This research was funded by the General Project of the Sichuan Natural Science Foundation (Grant No. 2022NSFSC0279), the Key Scientific Research Fund of Xihua University (Grant No. Z17113), and the Graduate Innovation Fund of Xihua University (Grant No. YCJJ2021056).
Author XG was employed by Design & Research Co., LTD. YX was employed by CHN Energy Dadu River Hydropower Development Co. Ltd.
The remaining authors claim that the study was conducted without any commercial or financial relationship, which may be interpreted as a potential conflict of interest.
All claims expressed in this article are solely those of the authors and do not necessarily represent those of their affiliated organizations, or those of the publisher, the editors, and the reviewers. Any product that may be evaluated in this article, or claim that may be made by its manufacturer, is not guaranteed or endorsed by the publisher.
Bieniawski, Z. T. (1967). Mechanism of brittle fracture of rock: Part I—theory of the fracture process[J]. Int. J. Rock Mech. Min. Sci. Geomechanics Abstr. 4 (4), 395–406.
Brown, E. T. (1981). Rock characterisation, testing and monitoring. ISRM suggested methods[M]. Oxford: Pergamon Press.
Cai, M., Kaiser, P. K., Tasaka, Y., Maejima, T., Morioka, H., and Minami, M. (2004). Generalized crack initiation and crack damage stress thresholds of brittle rock masses near underground excavations. Int. J. Rock Mech. Min. Sci. 41 (5), 833–847. doi:10.1016/j.ijrmms.2004.02.001
Eberhardt, E., Stead, D., Stimpson, B., and Read, R. S. (1998). Identifying crack initiation and propagation thresholds in brittle rock. Can. geotechnical J. 35 (02), 222–233. doi:10.1139/t97-091
Griffith, A. (1921). The phenomena of rupture and flow in solids [J]. Philos. Trans. R. Soc. Lond 221 (A), 163–198. doi:10.1098/rsta.1921.0006
Gui, X. (2022). Study on energy characteristics and fracture mechanism of deep marble under true triaxial loading and unloading. Chengdu: Xihua University.
Jin, F. N., Jiang, M. R., and Gao, X. L. (2004). Method of defining damage variable based on energy dissipation [J]. J. rock Mech. Eng. 2004 (12), 1976–1980.
Kim, J. S., Lee, K. S., Cho, W. J., Choi, H. J., and Cho, G. C. (2015). A comparative evaluation of stress–strain and acoustic emission methods for quantitative damage assessments of brittle rock. Rock Mech. Rock Eng. 48 (2), 495–508. doi:10.1007/s00603-014-0590-0
Kong, L. W., Xie, H. P., and Li, C. B. (2023). Coupled microplane and micromechanics model for describing the damage and plasticity evolution of quasi-brittle material. Int. J. Plasticity 162, 103549. doi:10.1016/j.ijplas.2023.103549
Lajtai, E. Z., Carter, B. J., and Ayari, M. L. (1990). Criteria for brittle fracture in compression. Eng. Fract. Mech. 37 (1), 59–74. doi:10.1016/0013-7944(90)90331-a
Li, C. B., Yang, D. C., Xie, H. P., Ren, L., and Wang, J. (2023). Size effect of fracture characteristics for anisotropic quasi-brittle geomaterials. Int. J. Min. Sci. Technol. 33 (2), 201–213. doi:10.1016/j.ijmst.2022.11.004
Li, S. N., Liu, X. X., and Li, Y. (2022). Study on deformation characteristics and damage evolution of carbonaceous mudstone during progressive failure [J]. J. China Highw. 35 (04), 99–107. doi:10.19721/j.cnki.1001-7372.2022.04.007
Liu, W., Zhang, S., and Sun, B. (2019). Energy evolution of rock under different stress paths and establishment of A statistical damage model. KSCE J. Civ. Eng. 23 (10), 4274–4287. doi:10.1007/s12205-019-0590-4
Liu, X. H., Hao, Q. J., and Hu, A. K. (2020). Study on determination method of characteristic stress of uniaxial coal and rock under quasi-static strain rate. J] J. Rock Mech. Eng. 39 (10), 2038–2046. doi:10.13722/j.cnki.jrme.2020.0321
Liu, X. H., Xue, Y., and Zheng, Y. (2022). Research on failure precursor based on characteristics of energy dissipation rate for rock[J]. Front. Earth Sci. 2022, 812438. doi:10.3389/feart.2021.812438
Liu, Z. X., Meng, X. R., and Zhao, G. M. (2023). Energy and damage analysis of sandstone under true triaxial compression [J]. J. rock Mech. Eng. 42 (02), 327–341. doi:10.13722/j.cnki.jrme.2022.0256
Martin, C. D., and Chandler, N. A. (1994). The progressive fracture of Lac du Bonnet granite. Int. J. Rock Mech. Min. Sci. Geomechanics Abstr. 31 (6), 643–659. doi:10.1016/0148-9062(94)90005-1
Ning, J., Wang, J., Jiang, J., Hu, S., Jiang, L., and Liu, X. (2018). Estimation of crack initiation and propagation thresholds of confined brittle coal specimens based on energy dissipation theory. J]. Rock Mech. Rock Eng. 51 (1), 119–134. doi:10.1007/s00603-017-1317-9
Peng, J., Rong, G., Cai, M., and Zhou, C. B. (2015). A model for characterizing crack closure effect of rocks. Eng. Geol. 189, 48–57. doi:10.1016/j.enggeo.2015.02.004
Peng, J., Rong, G., and Zhou, C. B. (2013). Experimental study on the effect of water pressure on the progressive fracture process of rock [J]. Geotech. Mech. 34 (04), 941–946+954. doi:10.16285/j.rsm.2013.04.024
Tkalich, D., Fourmeau, M., Kane, A., and Cailletaud, G. (2016). Experimental and numerical study of Kuru granite under confined compression and indentation. Int. J. Rock Mech. Min. Sci. 87, 55–68. doi:10.1016/j.ijrmms.2016.05.012
Wang, C., He, B., Hou, X., Li, J., and Liu, L. (2019). Stress–energy mechanism for rock failure evolution based on damage mechanics in hard rock. Rock Mech. Rock Eng. 53 (3), 1021–1037. doi:10.1007/s00603-019-01953-y
Wang, H. L., Fan, P. X., and Wang, M. Y. (2011). Effect of strain rate on progressive failure process and characteristic stress of red sandstone [J]. Geotech. Mech. 32 (05), 1340–1346. doi:10.16285/j.rsm.2011.05.008
Xie, H. P., Gu, Y., and Li, L. Y. (2008). Energy mechanism of rock mass deformation and failure process [J]. J. Rock Mech. Eng. 2008 (09), 1729–1740. doi:10.3321/j.issn:1000-6915.2008.09.001
Xie, H. P., Ju, Y., and Li, L. Y. (2005b). Rock strength and overall failure criteria based on energy dissipation and release principle [J]. J. rock Mech. Eng. 2005 (17), 3003–3010. doi:10.3321/j.issn:1000-6915.2005.17.001
Xie, H. P., Peng, R. D., and Gu, Y. (2005a). Preliminary study on energy analysis of rock failure [J]. J. Rock Mech. Eng. 2005 (15), 2603–2608. doi:10.3321/j.issn:1000-6915.2005.15.001
Xie, H. P., Peng, R. D., and Ju, Y. (2004). Analysis of energy dissipation during rock deformation and failure [J]. J. rock Mech. Eng. 2004 (21), 3565–3570. doi:10.3321/j.issn:1000-6915.2004.21.001
Xie, Y. C., Michael, Z. H., and Li, C. B. (2023). Anisotropic characteristics of acoustic emission and the corresponding multifractal spectrum during progressive failure of shale under cyclic loading. Int. J. Rock Mech. Min. Sci. 165, 105364. doi:10.1016/j.ijrmms.2023.105364
Yang, S., Xu, P., and Ranjith, P. G. (2015). Damage model of coal under creep and triaxial compression. Int. J. Rock Mech. Min. Sci. 80, 337–345. doi:10.1016/j.ijrmms.2015.10.006
Zhang, J., Song, Z., and Wang, S. (2020). Experimental investigation on permeability and energy evolution characteristics of deep sandstone along a three-stage loading path[J]. Bull. Eng. Geol. Environ. 80. (prepublish).
Zhao, X. G., Cai, M., Wang, J., Li, P. F., and Ma, L. K. (2015). Objective determination of crack initiation stress of brittle rocks under compression using AE measurement. Rock Mech. Rock Eng. 48 (6), 2473–2484. doi:10.1007/s00603-014-0703-9
Zhao, Z. H., and Xie, H. P. (2008). Study on energy transfer and dissipation during rock deformation and failure. J. Sichuan Univ. Eng. Sci. Ed. 2008 (02), 26–31. doi:10.15961/j.jsuese.2008.02.01
Keywords: asymptotic failure, characteristic stresses, elastic energy storage capacity index, elastic energy growth rate, dissipative energy growth rate
Citation: Liu X, Gui X, Qiu X, Wang Y, Xue Y and Zheng Y (2023) Determination method of rock characteristic stresses based on the energy growth rate. Front. Earth Sci. 11:1187864. doi: 10.3389/feart.2023.1187864
Received: 16 March 2023; Accepted: 24 April 2023;
Published: 11 May 2023.
Edited by:
Yingfeng Sun, University of Science and Technology Beijing, ChinaReviewed by:
Li Ren, Sichuan University, ChinaCopyright © 2023 Liu, Gui, Qiu, Wang, Xue and Zheng. This is an open-access article distributed under the terms of the Creative Commons Attribution License (CC BY). The use, distribution or reproduction in other forums is permitted, provided the original author(s) and the copyright owner(s) are credited and that the original publication in this journal is cited, in accordance with accepted academic practice. No use, distribution or reproduction is permitted which does not comply with these terms.
*Correspondence: Xin Gui, Z3gxOTk0X3pqQDE2My5jb20=
Disclaimer: All claims expressed in this article are solely those of the authors and do not necessarily represent those of their affiliated organizations, or those of the publisher, the editors and the reviewers. Any product that may be evaluated in this article or claim that may be made by its manufacturer is not guaranteed or endorsed by the publisher.
Research integrity at Frontiers
Learn more about the work of our research integrity team to safeguard the quality of each article we publish.