
95% of researchers rate our articles as excellent or good
Learn more about the work of our research integrity team to safeguard the quality of each article we publish.
Find out more
ORIGINAL RESEARCH article
Front. Earth Sci. , 11 April 2023
Sec. Hydrosphere
Volume 11 - 2023 | https://doi.org/10.3389/feart.2023.1187032
This article is part of the Research Topic Risk Assessment and Management of Water Conservancy Projects View all 16 articles
 Hongyang Zhang1,2Xuan Li1Jianlong Liu3Pengju Han1Yige Yang1
 Zelin Ding1,2*Liwei Han1,2Xianqi Zhang1,2Shunsheng Wang1,2
The wetting deformation of coarse-grained materials can seriously affect the safety of earth and rock dams during initial water storage. The wetting model formulas are expressed in various forms and have complex parameters. Only a small amount of test data is fitted by mathematical statistics, and the universality of the obtained wetting model is unknown. Duncan-Chang E-B constitutive model cannot accurately reflect the wetting deformation characteristics of coarse-grained materials. Through the double-line wetting test of coarse-grained materials, the wetting model proposed by predecessors was verified and analyzed. Based on the indoor wetting test data, the parameters of each wetting model were fitted to analyze the accuracy of each wetting model in describing the wetting deformation characteristics. According to the P-Z model in the elastic-plastic theory and the wetting model formula, the P-Z wetting model is established, and the BP artificial neural network is introduced to establish the artificial neural network wetting deformation prediction model based on the P-Z model. The results show that the relationship between wetting axial strain and wetting stress level is best expressed by the exponential function. The relationship between wetting volumetric strain and wetting stress level is best described by Cheng’s linear function. The relative errors between the predicted and experimental values of the proposed neural network prediction model are all within 6%. The relationship between wetting axial strain and wetting stress level is exponential function, and the relationship between wetting volumetric strain and wetting stress level is linear function. The P-Z wetting model proposed in this research can better reflect the wetting deformation characteristics of coarse-grained materials under complex stress paths. The artificial neural network prediction model based on P-Z wetting model is more reliable and accurate, which can meet the prediction requirements of actual engineering for wetting deformation of coarse-grained materials.
The wetting and deformation of coarse-grained materials can lead to uneven settlement, cracks, and collapse of the dam during impoundment periods (Jia et al., 2020; Zhang et al., 2022), rainfall infiltration, and other processes. Severe wetting and deformation can increase the risk of dam failure (Ge et al, 2020; Wang et al, 2022), with serious implications for the safe operation of the dam as well as downstream areas (Wu et al, 2021; Ge et al, 2022; Wang et al, 2023). For example, when the Pubugou Rockfill Dam (Lin et al., 2017) was impounded to a high water level, When Laos sangpian reservoir (Xu, 2018) was impounded to a high water level, and when the Guanyinyan Composite Dam (Jia et al., 2018) was impounded for the first time, the coarse-grained materials both underwent significant wetting, resulting in uneven settlement and cracks in the dam (Jie et al., 2019), so it is especially important to research the wetting deformation of earth-rock dams. Cheng et al. (2010), Chi and Zhou (2017), Chen, (2019), and Zhou et al. (2019) fitted the empirical formula of the wetting model based on the test data on the basis of the triaxial wetting test. The functional relationship between wetting axial strain and wetting stress level is mainly summarized as an exponential, hyperbolic and linear function, while the functional relationship between wetting volumetric strain and wetting axial strain is basically a linear function. Wei and Zhu (2007) investigated the wetting stress-strain relationship of coarse-grained soils through a modified triaxial apparatus and suggested a double-line method test. In terms of the constitutive model, Ding and Qian (2022) proposed an improved wetting deformation model by the Duncan-Chang E-B model. Since the Duncan-Chang E-B model cannot reflect the complex stress path and the influence of stress on deformation, the fitting effect with the test results is not good. The P-Z model based on the generalized plastic model can well reflect the complex stress path correlation of the wetting deformation of coarse-grained materials (Zou et al., 2013), and more accurately simulate the wetting deformation law of coarse-grained materials.
However, the wetting models proposed by predecessors are different, and they are basically fitted by a small amount of data through mathematical statistics on the basis of some coarse-grained material experiments, which have problems such as low model accuracy, too many fitted parameters and complex expressions, and significant differences in results.
In this research, based on the wetting test data, the parameters of each wetting model are fitted and the wetting deformation is compared and analyzed to determine a more universal wetting strain model. The P-Z principal constitutive model is also combined with BP neural network to establish an artificial neural network wetting deformation prediction model based on the P-Z model, overcoming the problems of complex and heavy workload in the triaxial wetting test process and the inaccuracy of wetting deformation data due to the uncertainty in the test and numerical simulation stages.
According to the standard of the geotechnical test method, the actual dry density of the materials used in the test was calculated to be 1.58×10³ kg/m3, and the relative density is 0.56. The content of each particle size group is shown in Table 1, and the gradation curve is shown in Figure 1.

TABLE 1. Content of each particle size group.

FIGURE 1. Original grading and test grading curves.
The test was set under three confining pressure conditions of 800kPa, 1,600kPa, and 2,400 kPa, and five wetting stress levels of 0, 0.2, 0.40, 0.60, and 0.80 were set at each group of confining pressure. The wetting stress level is the ratio of the peak deviatoric stress in the wetting stage to the peak deviatoric stress in the conventional triaxial test, i.e.,
The results of the conventional triaxial test and wetting triaxial test of coarse-grained materials are shown in Figures 2, 3. The test values of wetting axial strain and wetting volumetric strain corresponding to the wetting deformation test are listed in Table 2.
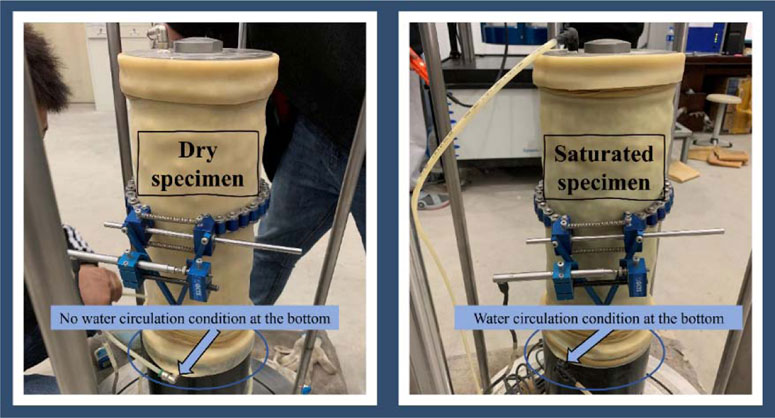
FIGURE 2. Comparison of dry and saturated specimens.
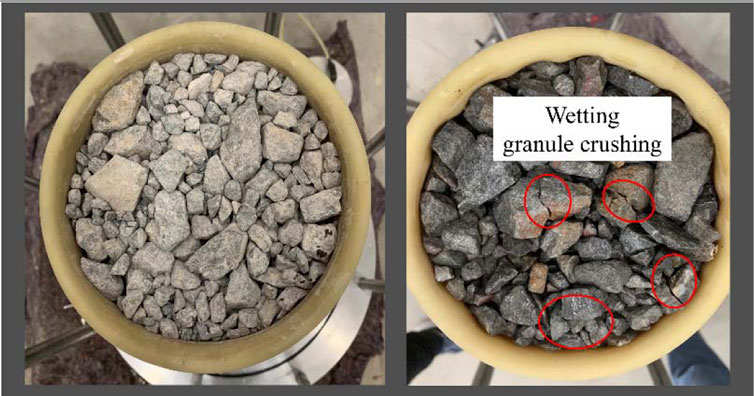
FIGURE 3. Comparison of coarse-grained materials in the dry state and saturated state.
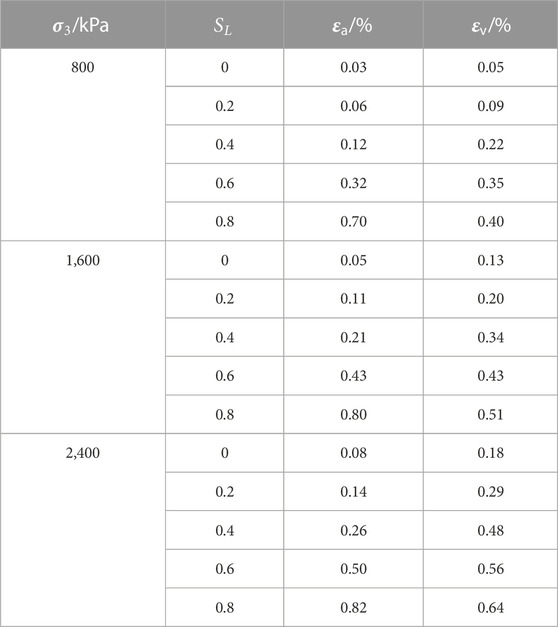
TABLE 2. Wetting deformation of coarse-grained materials.
At present, the functional relationship between wetting axial strain and wetting stress level is mainly hyperbolic function, exponential function, and linear function (Sun et al., 2023). To investigate the extent to which the level of wetting stress and the confining pressure affect the wetting axial strain and to compare the suitability of each wetting model to the test data. In this research, based on the results of the triaxial wetting test, the parameter fitting and wetting axial strain calculation of exponential function type, hyperbolic function type, and linear function type proposed by predecessors are carried out, respectively, and the best adaptation function is determined according to the results of comparative analysis.
(1) Expression for the exponential function relationship I (Cheng, et al., 2010):
Where:
(2) Expression for the exponential function relationship II (Niu, 2020):
Where:
(3) Expression for the hyperbolic function relationship (Chi and Zhou, 2017):
Where:
(4) Expression for the linear functional relationship (Chen, 2019).
Where:
According to the triaxial wetting test data, the parameters of the above four function types are fitted. The fitting of each function model parameters and the determination coefficient of fitting
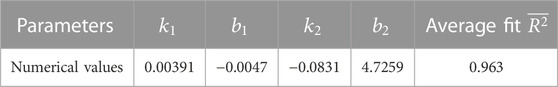
TABLE 3. Fitting parameters of exponential function type I.
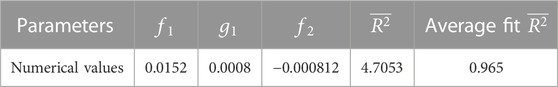
TABLE 4. Fitting parameters of exponential function type II.
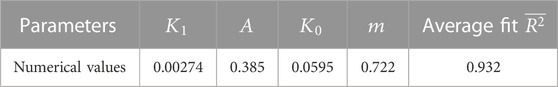
TABLE 5. Fitting parameters of hyperbolic functions.
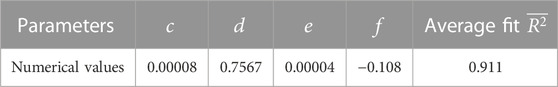
TABLE 6. Fitting parameters of linear functions.
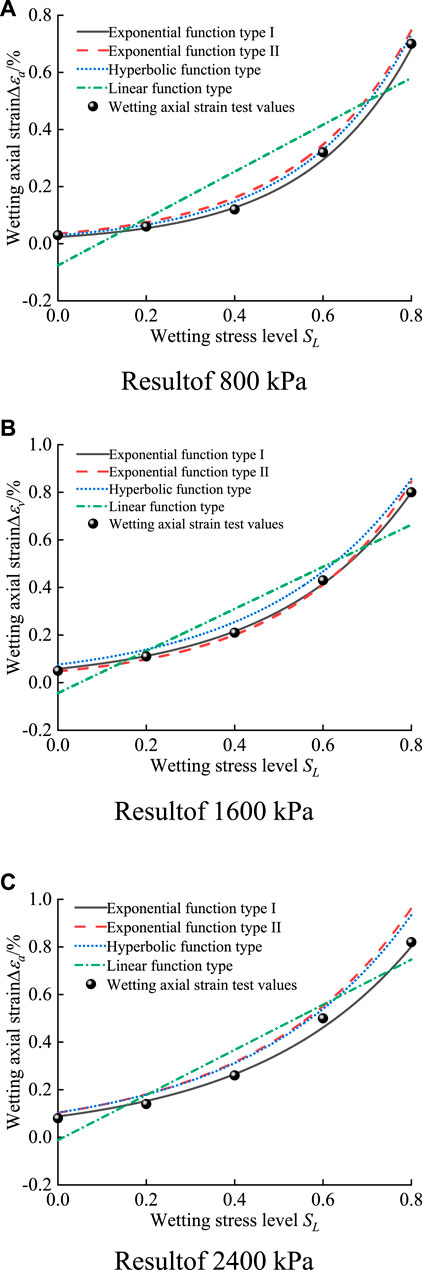
FIGURE 4. Comparison of simulation and test results of four wetting axial strain models. (A) Result of 800 kPa (B) Result of 1,600 kPa (C) Result of 2,400 kPa.
Zuo and Shen (1989) thought that the wetting volumetric strain was not related to the wetting stress level in the early stage, but was close to the hyperbolic relationship with the test confining pressure. With the progress of test instruments and research results, it is found that the wetting deformation of coarse aggregate under different stress paths is not the same, so there is a correlation between wetting volumetric strain and confining pressure and stress level. Cheng et al. (2010) considered that the wetting volumetric strain tends to vary linearly with the wetting stress level, and the relationship between wetting volumetric strain and wetting stress level was fitted by linear function expression (4 parameters):
Where:
Zhou et al. (2019) introduced the average principal stress
Where:
Peng et al. (2010) believed that the wetting volumetric strain is caused by spherical stress and partial stress, respectively. The relationship between the wetting volumetric strain caused by spherical stress and the confining pressure can be expressed by a hyperbola. The relationship between the wetting volumetric deformation caused by partial stress and the wetting stress level is fitted by linear and exponential functions. The wetting volumetric strain formula 6 parameters) is summarized as follows:
Where:
According to the triaxial wetting test data, the parameters of the wetting volumetric strain model of the above three function types are fitted. The fitting of each function model parameters and the determination coefficient of fitting
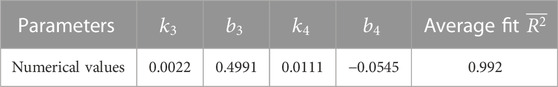
TABLE 7. Parameter fitting values of Cheng’s linear model.

TABLE 8. Parameter fitting values of Zhou’s linear model.

TABLE 9. Parameter fitting values of Peng’s linear model.
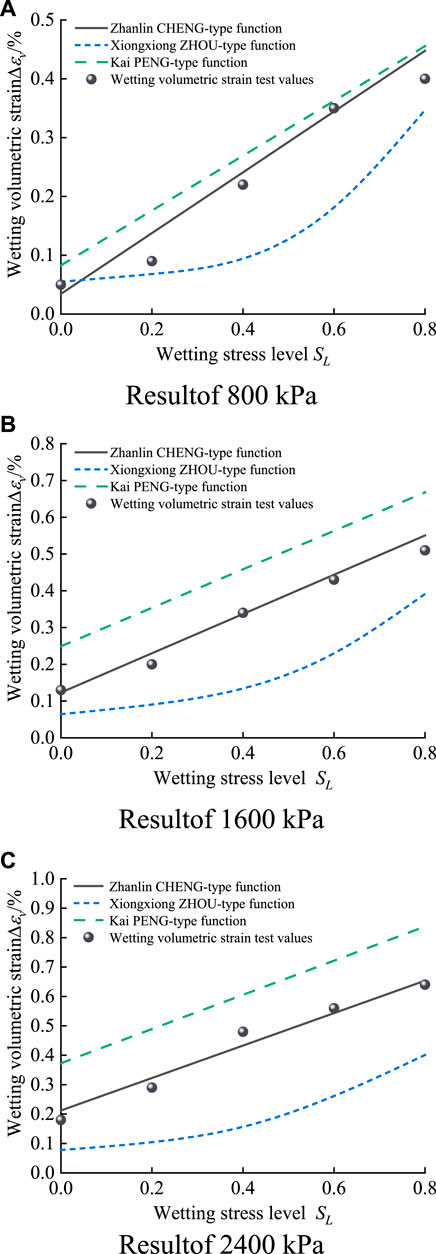
FIGURE 5. Comparison of simulation results and test results of three wetting volumetric strain models. (A) Result of 800 kPa (B) Result of 1,600 kPa (C) Result of 2,400 kPa.
Zienkiewicz and Pastor proposed the generalized plasticity theory in 1985, then Pastor and Zienkiewicz extended their basic framework and on which they developed the constitutive model of soil, the Pastor-Zienkiewicz model (Pastor et al., 1985; Pastor et al., 1987) (hereafter referred to as the P-Z model).
The expression of the generalized plastic matrix of the P-Z model is:
Where:
In the P-Z model, for each homogeneous material, the elastic matrix is determined by the bulk and shear modulus, which varies linearly with the mean stress.
Where:
The relationship curves of wetting stress level with wetting axial strain and wetting volumetric strain under different confining pressures are drawn by the wetting axial strain calculation model and the wetting volumetric strain calculation model determined in Section 2. In finite element numerical simulation, the corresponding confining pressure and stress level are calculated from the stress state of Gauss points of each element; through the interpolation calculation of the current confining pressure and stress level in the wetting calculation model, the wetting axial strain and wetting volumetric strain of each unit are obtained. The wetting deformation calculated by each unit is distributed to each strain component of the total strain of the current load step. The wetting deformation corresponding to each submerged unit is transformed into an equivalent nodal force applied to the sample, and the additional deformation is calculated as the wetting deformation.
The finite element numerical simulation of the P-Z intrinsic model used in this research are carried out in the GEHOMadrid finite element program. The P-Z model framework is clear and easy to implement in finite element programs. The static and dynamic analysis process of soil structures can be completed with a set of parameters. According to Formula (8), Formula (9) and literature (Pastor et al., 1985; Pastor et al., 1987), there are 12 parameters in the P-Z constitutive model of coarse-grained materials, including eight dimensionless parameters:
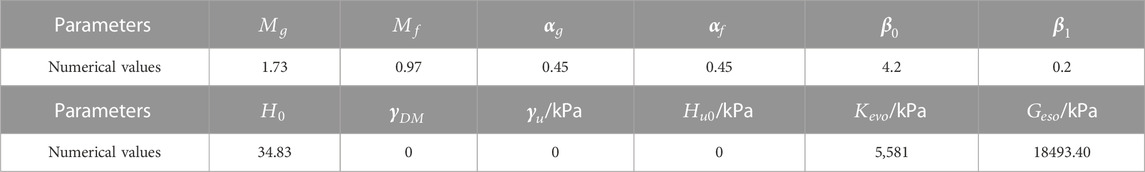
TABLE 10. Parameters of the P-Z constitutive model for coarse-grained materials.
The GEHOMadrid finite element program was used to carry out numerical simulations of the wetting deformation of coarse-grained materials. A cylindrical specimen with an internal diameter of 150 mm and a height of 300 mm was used in the triaxial wetting test. The finite element model of the specimen is shown in Figure 6, with a total of 1760 elements and 1983 nodes generated. Based on the P-Z wetting model, finite element simulations of triaxial compression tests are carried out on the specimens. The simulation results are compared and analyzed with the triaxial test results to verify the rationality of the P-Z wetting procedure.
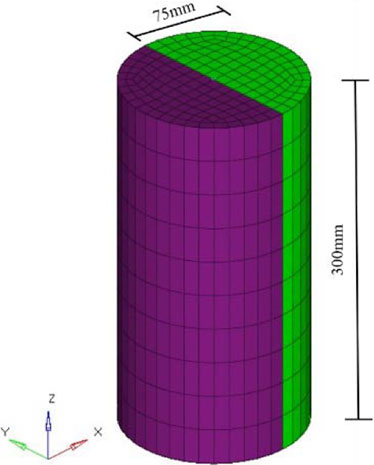
FIGURE 6. Simulation diagram of actual specimen for triaxial tests.
According to the standard for geotechnical test methods, when the axial strain of the specimen reaches 15% of the specimen height, it is considered a shear failure. The P-Z wetting program was used to numerically simulate three types of confining pressure conditions at 800kPa, 1600kPa, and 2400kPa, respectively. The calculated results of the simulated triaxial wetting test are shown in Figures 7, 8 shows the comparison between the triaxial wetting test and the numerical simulation results.
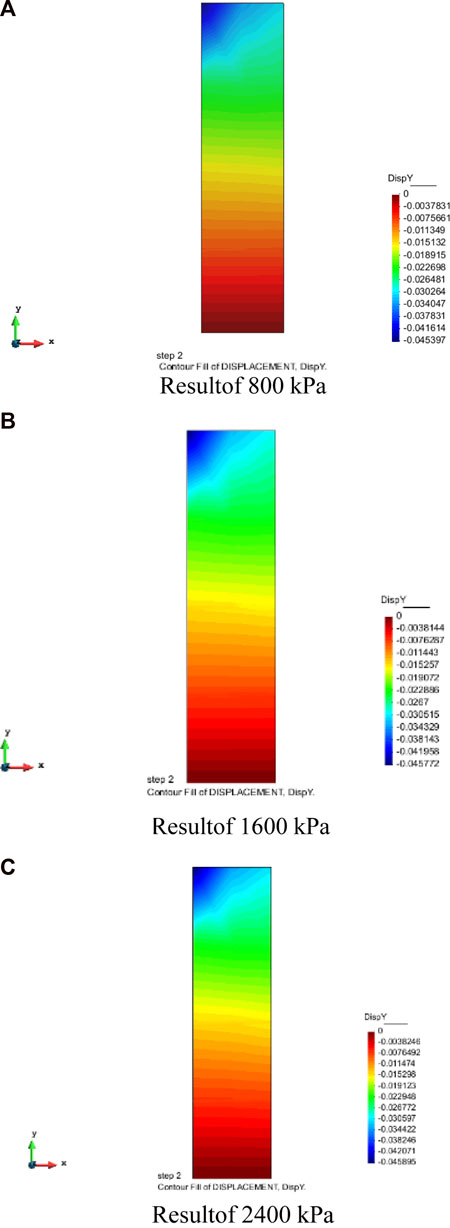
FIGURE 7. Simulation diagram of P-Z wetting model (A) Result of 800 kPa (B) Result of 1,600 kPa (C) Result of 2,400 kPa.
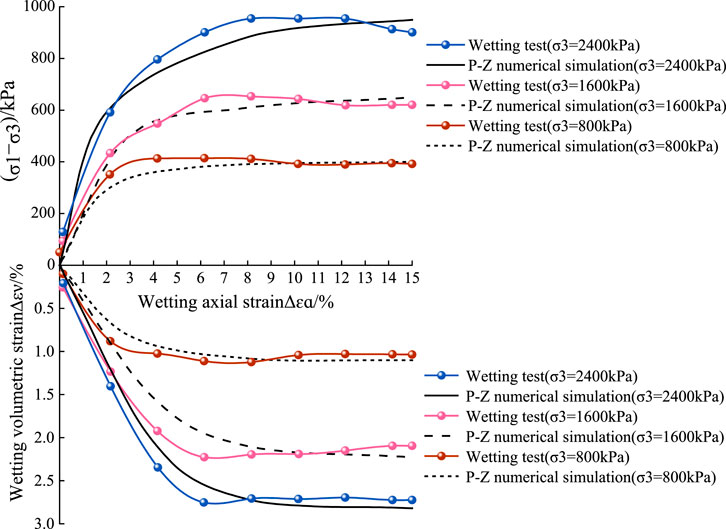
FIGURE 8. Comparison of simulation results and test results of the P-Z wetting Model.
The comparison results show that the maximum axial strain error at 800 kPa is 9.5% and the maximum volumetric strain error is 8.6%; the maximum axial strain error at 1,600 kPa is 7.7%, and the maximum volumetric strain error is 9.1%; the maximum axial strain error at 2,400 kPa is 9.5%, and maximum volumetric strain error is 7.4%. With the increase of confining pressure, the error decreases gradually. The main reason is that before the axial strain reaches 10%, the deformation of the sample during the test is greatly affected by the factors such as rubber membrane embedding, which leads to the error of the data, but the error is in the range of 7.4%–9.5%, which is less than 10%. It shows that the P-Z model shows good adaptability to the stress-related properties of coarse-grained materials under complex stress paths and can better simulate the wetting deformation pattern of coarse-grained materials.
Based on the P-Z wetting model of coarse granular material, BP neural network is introduced to train the wetting test deformation and establish an artificial neural network (Zhang et al., 2021; Ju et al., 2005) wetting deformation model based on the P-Z model, which enables a better mapping of the non-linear relationship between wetting deformation of earth-rock dams and its influencing factors. It reduces the influence of systematic and chance errors in wetting deformation analysis. A three-layer BP neural network is selected, relying on increasing the number of nodes in the hidden layer to obtain a lower error. The input layer corresponds to the confining pressure and the wetting stress level, and the output layer corresponds to the wetting deformation. An empirical formula is used to determine the optimal number of nodes in the hidden layer, as shown in Formula (10). The topology and flow chart of the neural network wetting deformation model is shown in Figures 9, 10.
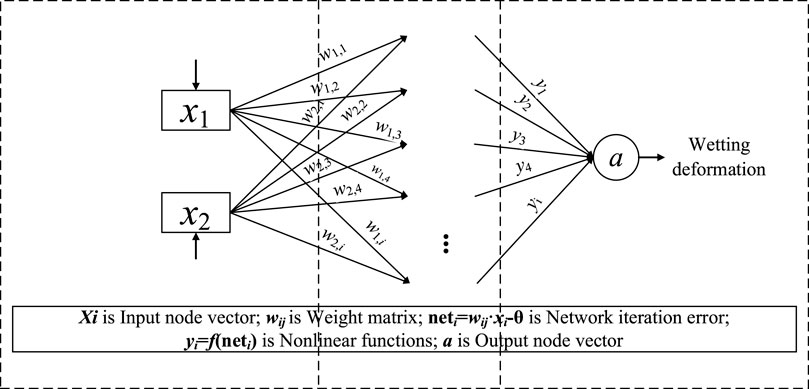
FIGURE 9. BP neural network topology.
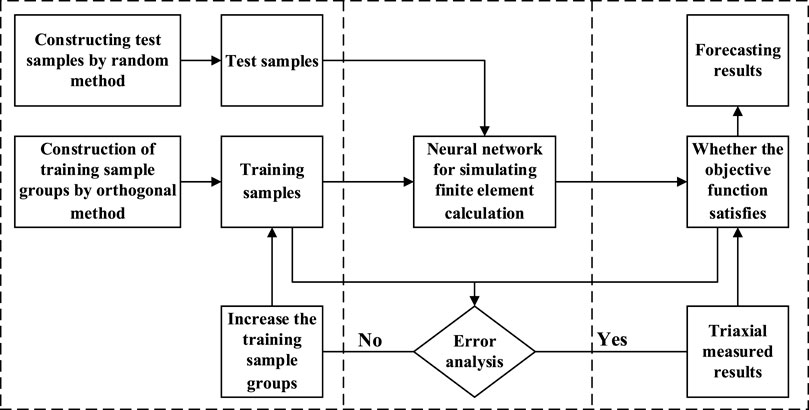
FIGURE 10. Analysis method of wetting deformation prediction model of BP neural network.
Where:
Based on the P-Z wetting model, a total of 60 sets of wetting axial strain and wetting volumetric strain data at five wetting stress levels of 0,0.2,0.4,0.6 and 0.8 under 12 confining pressure conditions of 200 kPa, 400 kPa, 600 kPa, 800 kPa, 1,000 kPa, 1,200 kPa, 1,400 kPa, 1,600 kPa, 1800 kPa, 2000 kPa, 2,200 kPa and 2,400 kPa are used as training samples. The first 50 groups are used as the training set and the last 10 groups are used as the testing set. When the network training is iterated 95 and 98 times, the error cost function is satisfied, and the convergence process at the end of training is shown in Figure 11.
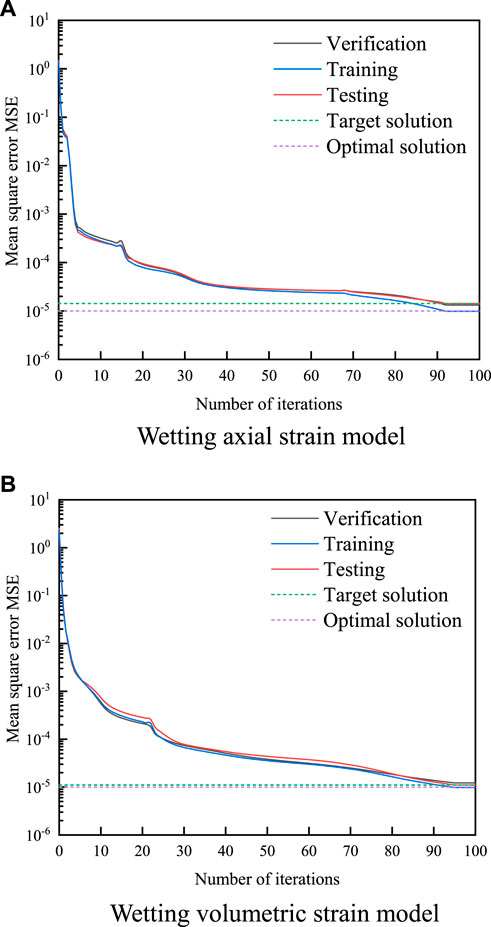
FIGURE 11. Iterative process of wetting prediction model. (A) Wetting axial strain model (B) Wetting volumetric strain model.
Figure 12 is the comparison between the experimental values and the predicted values of wetting deformation under five wetting stress levels with different confining pressures and the relative error of the prediction model. From Figure 12, it can be seen that the absolute error of the wetting axial strain prediction is in the range of 0.00086%–0.033%, with an average error of 0.011%, and the relative error is controlled within 1.041%–6.980%, with an average relative error of 4.094%, which are basically control within7%. The absolute error in the prediction of wetting volumetric strain ranged from 0.0029%–0.0115%, with an average error of 0.0122%, and the relative error is basically controlled within 0.5800%–5.872%, with an average relative error of 3.671%, which are basically controlled within 6%. This is due to the fact that the initial weights of the neural network are randomly given, and the number of training sessions and the final weights will be slightly different each time, as well as the fact that there are human errors in the finite element numerical simulation and test conditions and test methods based on the P-Z model, resulting in differences between the prediction results and the test results. The relative error of the prediction model in this paper is basically controlled within 6%, so it can be considered that the neural network model is more reliable and accurate, which can meet the accuracy requirements for the prediction of wetting deformation.
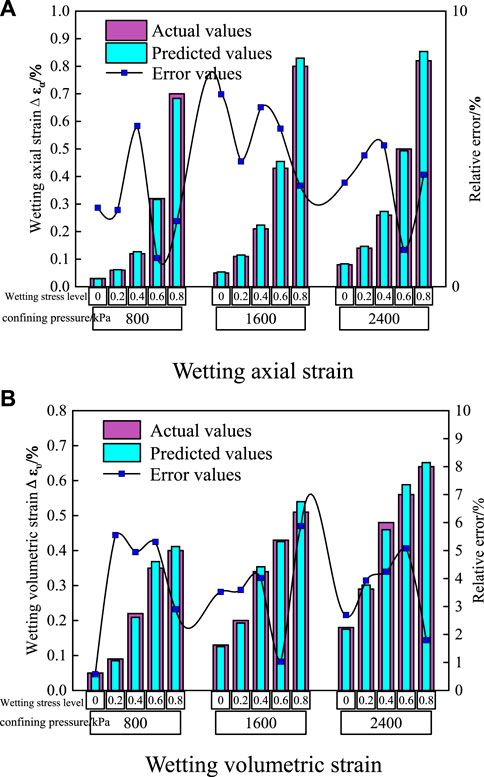
FIGURE 12. Comparison of predicted and measured values of wetting deformation. (A) Wetting axial strain (B) Wetting volumetric strain.
In this research, based on the previous research results of wetting deformation, the model parameters are fitted by triaxial wetting test data, and the wetting deformation of each model is calculated and compared with the test data. The proposed wetting axial strain model and wetting volumetric strain model are verified and analyzed. The P-Z model is improved by using the empirical formula of the wetting model. Based on the P-Z wetting model, the BP neural network is introduced to train the deformation of the wetting test, and the artificial neural network wetting deformation prediction model based on the P-Z model is established. Finally, the following conclusions are drawn.
(1) The experimental data are used to fit the parameters to the wetting model proposed by the previous authors and to calculate the wetting deformation, and the results showed that: The relationship between wetting axial strain and wetting stress level is best fitted by exponential function I (Formula 1); The relationship between the wetting volumetric strain and the wetting stress level is best fitted by the linear function expression of Cheng (Formula 5).
(2) The results of the finite element numerical simulation based on the P-Z wetting model are compared with the results of the triaxial wetting test to verify the accuracy of the P-Z wetting model in simulating the wetting deformation law of coarse-grained materials, indicating that the P-Z model can better reflect the wetting deformation characteristics of coarse-grained materials under complex stress paths, providing a basis for the application of the P-Z model in practical engineering.
(3) In the proposed BP neural network wetting deformation prediction model, the relative error between the predicted and tested values are controlled within 6%, indicating that the prediction model is more reliable and accurate, and can meet the accuracy requirements for wetting deformation prediction.
The original contributions presented in the study are included in the article/supplementary material further inquiries can be directed to the corresponding author.
HZ: Funding acquisition, Investigation, Content conception, Data analysis and Resource; XL, PH, and YY: Experimental protocol design,Operation, Data processing; XL: Writing, Forming the first draft, and Further analysis. JL, ZD, and LH: Software, Supervision, and Validation; XZ and SW: Reviewed the text and revised the draft.
This study was supported by the National Natural Science Foundation of China (No. 51609087, 52079051), Key Scientific Research Projects of Colleges and Universities in Henan Province (No.21A570001, 22A570004, 23A570006) and Collaborative Innovation Center for Efficient Utilization of Water Resources in Yellow River Basin.
The authors declare that the research was conducted in the absence of any commercial or financial relationships that could be construed as a potential conflict of interest.
All claims expressed in this article are solely those of the authors and do not necessarily represent those of their affiliated organizations, or those of the publisher, the editors and the reviewers. Any product that may be evaluated in this article, or claim that may be made by its manufacturer, is not guaranteed or endorsed by the publisher.
Chen, J. (2019). Study on wetting deformation characteristics of low permeability gravel soil core wall material. J. Yangtze River Sci. Res. Inst. 2019, 1. doi:10.26982/d.cnki.gcjky.2019.000001
Cheng, Z. L., Zuo, Y. Z., Ding, H. S., Jiang, J. S., and Kong, X. Y. (2010). Wetting characteristics of coarse-grained materials. Chin. J. Geotech. Eng. 32 (02), 243–247.
Chi, S. C., and Zhou, X. X. (2017). Slaking deformation model for rockfill materials. Chin. J. Geotech. Eng. 39 (01), 48–55. doi:10.11779/CJGE201701002
Ding, Y. H., and Qian, X. X. (2022). Study on the numerical model and computational method of wetting deformation of rockfill materials. Water Resour Hydropower Eng 53 (S1), 455–462. doi:10.13928/j.cnki.wrahe.2022.S1.076
Ge, W., Qin, Y. P., Li, Z. K., Zhang, H. X., Gao, W. X., Guo, X. Y., et al. (2020). Aninnovative methodology for establishing societal life risk criteria for dams: A case study to reservoir dam failure events in China. Int. J. Disaster Risk Reduct. 49, 101663. doi:10.1016/j.ijdrr.2020.101663
Ge, W., Jiao, Y. T., Wu, M. M., Li, Z. K., Wang, T., Li, W., et al. (2022). Estimating loss of life caused by dam breaches based on the simulation of floods routing and evacuation potential of population at risk. J. Hydrol. 612, 128059. doi:10.1016/j.jhydrol.2022.128059
Jia, Y. F., Xu, B., Desai, C. S., Chi, S. C., and Xiang, B. (2020). Rockfill particle breakage generated by wetting deformation under the complex stress path. Int. J. Geomech. 20(10), 4020166. doi:10.1061/(ASCE)GM.1943-5622.0001789
Jia, Y. F., Xu, B., Chi, S. C., Xiang, B., Xiao, D., and Zhou, Y. (2018). Joint back analysis of the creep deformation and wetting deformation parameters of soil used in the Guanyinyan composite dam. Comput. Geotech. 96, 167–177. doi:10.1016/j.compgeo.2017.10.018
Jia, Y. F., Xu, B., Chi, S. C., Xiang, B., Xiao, D., and Zhou, Y. (2019). Particle breakage of rockfill material during triaxial tests under complex stress paths. Int. J. Geomech. 19 (12), 04019124. doi:10.1061/(ASCE)GM.1943-5622.0001517
Jie, Y. X., Zhang, Y. Y., and Yang, G. H. (2019). Discussion on calculation method of wetting deformation of earth-rock materials. Rock Soil Mech. 40 (S1), 11–20. doi:10.16285/j.rsm.2019.0276
Ju, S. Q., Gu, C. S., and Hou, Y. C. (2005). Settlement model for earth-rock dams based on artificial neural networks. Water Resour Power 1 (01), 76–78+94. doi:10.3969/j.issn.1000-7709.2005.01.025
Lin, D. T., Zhu, S., Wu, M. K., Chen, X. H., and Ying, J. T. (2017). Cause analysis of crest cracking of Pubugou rockfill dam with a central gravelly soil core during first reservoir impounding. Hydroelectr. Power 43 (10), 56–61. doi:10.3969/j.issn.0559-9342.2017.10.015
Miao, L. Q. (2018). Experimental study on evaluation of loess subsidence in southern hebei area based on single and double-oedometer methods. J. Hebei GEO Univ. 41 (05), 44–47. doi:10.13937/j.cnki.hbdzdxxb.2018.05.006
Niu, A. (2020). Experimental study on wet deformation of coarse-grained aggregates in earth-rock dams. Zhengzhou: North China University of Water Resources and Electric Power.
Pastor, M., Zienkiewicz, O. C., and Chan, A. (1987). A generalized plasticity continuous loading model for geomaterials. State of New Jersey: Engineering, Theory and Application.
Pastor, M., Zienkiewicz, O. C., and Leung, K. H. (1985). Simple model for transient soil loading in earthquake analysis. II. Non-associative models for sands. Int. J. Numer. Anal. Meth. Geomech. 9, 477–498. doi:10.1002/nag.1610090506
Peng, K., Zhu, J. G., and Wang, G. Q. (2010). Study on slaking deformation of rockfill materials by triaxial test. J. Cent. South Univ. Sci. Technol.) 41 (05), 1953–1960. doi:10.3969/j.issn.1000-7598.2007.08.015
Sun, X. J., Pan, J. J., Zhou, Y. F., and Zuo, Y. Z. (2023). A comparative study of the wetting deformation model of the single-line method of damming coarse grain. J. Yangtze River Sci. Res. Inst. 40 (1), 146–152+160. doi:10.11988/ckyyb.20210869
Wang, T., Li, Z. K., Ge, W., Zhang, Y. D., Jiao, Y. T., Sun, H. Q., et al. (2022). Calculation of dam risk probability of cascade reservoirs considering risk transmission and superposition. J. Hydrol. 609, 127768. doi:10.1016/J.JHYDROL.2022.127768
Wang, T., Li, Z. K., Ge, W., Zhang, H., Zhang, Y. D., Sun, H. Q., et al. (2023). Risk consequence assessment of dam breach in cascade reservoirs considering risk transmission and superposition. Energy 265, 126315. doi:10.1016/J.ENERGY.2022.126315
Wei, S., and Zhu, J. G. (2007). Study on the wetting behavior of coarse-grained soil in triaxial test. Rock Soil Mech. 08, 1609–1614. doi:10.16285/j.rsm.2007.08.017
Wu, M. M., Wu, Z. N., Ge, W., Wang, H. L., Shen, Y. X., Jiang, M. M., et al. (2021). Identification of sensitivity indicators of urban rainstorm flood disasters: A case study in China. J. Hydrol. 599, 126393. doi:10.1016/J.JHYDROL.2021.126393
Xu, Z. P. (2018). Laos-preliminary analysis and thinking on the dam failure of sang nam nei hydropower station. Express Water Resour. Hydropower Inf. 39 (08), 6–10. doi:10.15974/j.cnki.slsdkb.2018.08.001
Zhang, H. Y., Han, P. J., He, Q., Sun, Y. D., Song, Z. Y., Ding, Z. L., et al. (2022). Research on wetting deformation model of coarse-grained materials of earthrock dam. Arab. J. Geoscci 15 (4), 350. doi:10.1007/s12517-022-09619-w
Zhang, H. Y., Song, Z. Y., Peng, P., Sun, Y. D., Ding, Z. L., and Zhang, X. Q. (2021). Research on seepage field of concrete dam foundation based on artificial neural network. Alex Eng. J. 60 (1), 1–14. doi:10.1016/j.aej.2020.03.041
Zhang, H. Y., Zhang, W. X., Ding, Z. L., Li, S., and Ge, W. (2019). Parameter optimization method for the pastor-zienkiewicz model based on empirical mode decomposition and cloud theory. J. Eng. Sci. Technol. Rev. 12 (6), 44–53. doi:10.25103/jestr.126.06
Zhou, X. X., Chi, S. C., and Jia, Y. F. (2019). Wetting deformation characteristics of coarse granular materials. Chin. J. Geotech. Eng. 41 (10), 1943–1948. doi:10.11779/CJGE201910020
Zou, D. G., Fu, M., Liu, J. M., and Kong, X. J. (2013). Study of adaptability of a generalized plastic model of coarse-grained soil under various stress paths. J. Dalian Univ. Technol. 53 (05), 702–709. doi:10.7511/dllgxb201305014
Keywords: coarse-grained materials, triaxial wetting test, wetting deformation model, P-Z model, BP neural network
Citation: Zhang H, Li X, Liu J, Han P, Yang Y, Ding Z, Han L, Zhang X and Wang S (2023) Study on wetting deformation model of coarse-grained materials based on P-Z model and BP neural network. Front. Earth Sci. 11:1187032. doi: 10.3389/feart.2023.1187032
Received: 15 March 2023; Accepted: 27 March 2023;
Published: 11 April 2023.
Edited by:
Xihui Gu, China University of Geosciences Wuhan, ChinaReviewed by:
Bo Li, Changjiang River Scientific Research Institute (CRSRI), ChinaCopyright © 2023 Zhang, Li, Liu, Han, Yang, Ding, Han, Zhang and Wang. This is an open-access article distributed under the terms of the Creative Commons Attribution License (CC BY). The use, distribution or reproduction in other forums is permitted, provided the original author(s) and the copyright owner(s) are credited and that the original publication in this journal is cited, in accordance with accepted academic practice. No use, distribution or reproduction is permitted which does not comply with these terms.
*Correspondence: Zelin Ding, enpzdGFyX25jd3VfaHNAMTYzLmNvbQ==
Disclaimer: All claims expressed in this article are solely those of the authors and do not necessarily represent those of their affiliated organizations, or those of the publisher, the editors and the reviewers. Any product that may be evaluated in this article or claim that may be made by its manufacturer is not guaranteed or endorsed by the publisher.
Research integrity at Frontiers
Learn more about the work of our research integrity team to safeguard the quality of each article we publish.