 Binglei Li1
 Jianing Li
- 1Zijin School of Geology and Mining, Fuzhou University, Fuzhou, China
- 2School of Resource Engineering, Longyan University, Longyan, China
In the natural geological environment, there are many joints, faults and cavities. These natural defects will have an impact on the stability of tunnels. This paper investigates different conditions of surrounding rock: intact surrounding rock, surrounding rock with open-flaw and surrounding rock with filled-flaw under the true triaxial test. The effect of different surrounding rock conditions on the internal failure characteristics of tunnel under true triaxial conditions is explored. According to the characteristics of energy evolution and chaos theory, the failure characteristics inside the tunnel is divided into stages. The results show that: 1) The failure characteristics in the tunnel are different for different surrounding rock conditions. The failure characteristics do not represent the stability of the surrounding rock of the tunnel; 2) The trend of energy dissipation is different under different surrounding rock conditions. The elastic stage of the surrounding rock is shortened and the dissipation energy shows an earlier upward trend as its integrity declines. 3) When analysing the tunnel, chaos theory can give early warnings about the instability of the surrounding rock, but it can not give early warning of particle spray and spalling inside the tunnel.
1 Introduction
At present, the geological environment around the tunnel excavation is becoming more and more complex, and there are many natural defects such as faults and cavities around the tunnel. These defects can have unpredictable consequences for the failure of surrounding rock.
Many scholars have explored the influence of these natural defects on surrounding rock, by carrying out laboratory tests (Wang H. et al., 2020; Li et al., 2021; Li et al., 2022; Yang et al., 2022; Zhang et al., 2022; Xue et al., 2023b). Prefabricated flaws usually include open flaws, filled flaws and a combination of prefabricated flaws and holes. For open cracks, (Zhang et al., 2020), studied the influence of prefabricated flaws on rock fracture toughness and provided a reference for the accurate measurement of limestone fracture toughness through experiment and numerical analysis. (Chen et al., 2022).studied the influence of prefabricated flaw size on mode I crack propagation of rock, and clarified the influence of prefabricated flaws on the directional crack propagation mechanism. (Liu X. X. et al., 2021). carried out shear tests on rock samples with prefabricated flaws, taking into account the influence of the existence of cracks on crack propagation when rock shear failure occurs.
Natural rock joints are usually filled with materials such as sand, clay and broken rock fragments as weak bonds. For filled-flaw, (Zhang and Zhu, 2020), studied the influence of such filled flaws on the mechanical strength and failure characteristics of the rock mass and calibrated the parameters of various types of samples based on the uniaxial compression test (Zhou et al., 2021). monitored the degree of damage to rock by acoustic emission through defects with different filling materials. In addition, the qualitative analysis of crack behaviour was carried out by acoustic emission (AE) and photographic capturing technologies, which provide a theoretical memory for fracture behaviour and damage assessment of cracks (Sharafisafa et al., 2019). studied the influence of filling materials on the deformation and failure behaviour of 3D-printed rock-like Brazilian disk specimens with defects by static compression load and digital image correlation (DIC) technology. They found that the filling of the material can significantly increase the peak stress of the sample.
Natural geological conditions are usually not single fractures but are a combination of many fractures. Scholars have studied different fracture combinations. For combined fracture, (Wang et al., 2020d), studied the energy evolution and failure characteristics of combined cracks under fatigue load. The influence of stress amplitude on rock fatigue is investigated by 3D CT (Li and Cai, 2021). studied a specimen with open holes in the cross joint and explored the energy evolution process of the joint in the process of crack initiation (Mehranpour et al., 2018). extended the existing rock mass strength criteria. The 284 numerical simulation results of multi-axial, triaxial and biaxial compression tests of jointed rock blocks with one or two joint groups by PFC3D software were analysed, and two new three-dimensional rock mass strength criteria were established.
Scholars usually use AE (Worley et al., 2019; Zafar et al., 2020), DIC (Fakhimi et al., 2018; Afrazi et al., 2022; Xue et al., 2023a) and energy evolution (Chen et al., 2019; Wang et al., 2020c; Wang et al., 2022) to facilitate the study of crack propagation. The energy evolution analysis of rock is based on the assumption that there is no heat exchange in this process after the external work is done on the rock, and the deformation of the rock is converted into elastic energy and dissipated energy (Xie et al., 2005). The energy evolution analysis enables scholars to better understand the propagation of internal cracks in the compression stage of rock (Meng et al., 2019). studied the energy evolution law of lithology and loading rate on the whole process from deformation to failure. They then analysed the micro-mechanism of accumulation and dissipation of rock energy, and proposed a non-linear evolution model (Logistic equation) to provide theoretical support for an early warning system for engineering disasters (Wang C. L. et al., 2020). analysed the energy dissipation, energy conversion mode and stress-energy mechanism of rock failure induced by cyclic loading and unloading, and demonstrated the laws of stress release and energy dissipation during rock failure from the energy perspective (Liu G. L. et al., 2021). summarised the damage evolution model of rock, revealed the failure and instability mechanism of rock under load, analysed the relationship between crack development, damage evolution and energy evolution, and proposed a more specific understanding of the rock failure process.
At present, researchers paid more attention to the crack extension in rocks under different stress circumstances, and less attention is paid to the overall stability of the tunnel induced by the crack extension. There were few studies establishing the correlation of energy evolution with the failure at tunnel wall. In this paper, using a true triaxial experimental machine to simulate the underground stress environment, and use an embedded micro camera to capture the failure inside the tunnel, which can better obtain the crack propagation. Then the failure behavior inside the tunnel and energy evolution characteristic are correlated. Combining chaos theory with the energy evolution process clarifies the advantages and disadvantages of applying chaos theory to evaluate tunnel stability, and it provides further theoretical support for understanding the internal failure of tunnels from the perspective of energy evolution.
The innovation of this article is highlighted as follows: 1) Under true triaxial conditions, failure characteristics at the tunnel wall and energy evolution are correlated, and 2) Combined chaos theory with the energy evolution process, and use it to evaluate the damage degree inside the tunnel.
2 True triaxial tests on sandstone samples with tunnel
2.1 Specimens preparation
True triaxial tests of rock specimens with the tunnel were done by cutting out cubic specimens from the centre with a high-pressure water jet. The dimensions of the specimens were 100 mm × 100 mm × 100 mm, which was suggested by the ISRM (Muralha et al., 2014). The dimensions of the horseshoe-shaped tunnel and the surrounding rock conditions of the specimens are shown Figure 1. The uniaxial compressive strength (UCS) of sandstone is 73.52 MPa, elastic modulus is 5.6 GPa and Poisson’s ratio is 0.12. The prefabricated flaw was made to penetrate the entire cubic specimen along the x-axial direction (Figure 1A). And the flaws were filled with gypsum, with a water to gypsum ratio of 1:5 and The UCS was 7.5 MPa. In terms of surrounding rock integrity, Group Intact displayed more integrity than Group Filled-flaw.
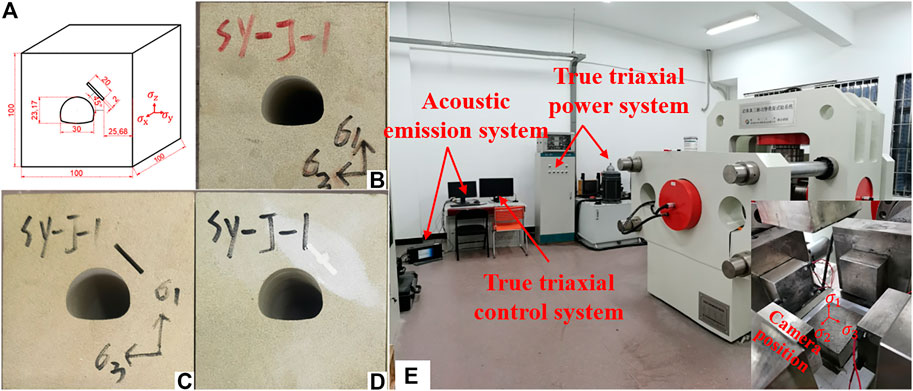
FIGURE 1. Test specimens: (A) distribution of tunnel and flaws; (B) intact specimens; (C) open-flaw specimens; (D) filled-flaw specimens; (E) QKX-ZSZ-4000 test equipment.
2.2 Stress path
The QKX-ZSZ-4000 rigid servo loading system was used in this research. In this system, the maximum vertical load can reach 4,000 kN and the maximum lateral load can reach 2,400 kN. The stress path in this test is shown in Figure 2. The stress path has two stages: an initial stage and a step stage. The initial stress for this test is the burial depth of 500 m and step loading is used to simulate the tunnel excavation process. Before arriving the initial pressure, the σx, σy, and σz loading rate was 0.5 kN/s. When the stress in all three directions reached 11.5 MPa, the directions of X and Y continued to be loaded at a rate of 0.5 kN/s, while σZ remained unchanged. When σX and σY reached 17 MPa, the direction of X continued to be loaded at a rate of 0.5 kN/s, while σY and σZ remained unchanged. When σX reached 29 MPa, σX was maintained for 30 s when the stress reached the initial pressure (σx=29 MPa; σy=17 MPa; σz=11.5 MPa), the loading method changed to 0.1 mm/min. In the step-loading stage, the σZ was maintained 60 s for every 10 MPa increase. For example, when σZ was 11.5 MPa at the beginning, it was loaded to 21.5 MPa at a loading rate of 0.1 mm/min, and maintained the resulting stress for 60 s. When σZ decreased to 90% of the peak stress, the experiment was terminated.
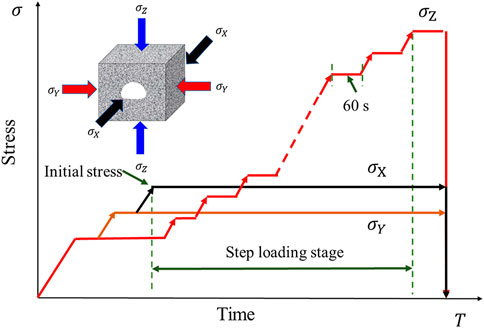
FIGURE 2. Stress path used in the test.
To ensure that the sample was not damaged during the unloading, it was done in stages unloading was employed. First, σx and σy stresses remained unchanged, while σz was decreased to 29 MPa. Then σy remained unchanged while reducing σx and σz stress to 17 MPa. Finally, the three stress were unloaded to 0 at the same time.
2.3 Test results
The triaxial test results of the three specimens are shown in Figure 3. The peak stress of specimens with intact surrounding rock was 89.63 MPa, with open-flaw it was 81.05 MPa and with filled-flaw it was 85.59 MPa. Peak stress decreased continuously due to defects in the surrounding rocks.
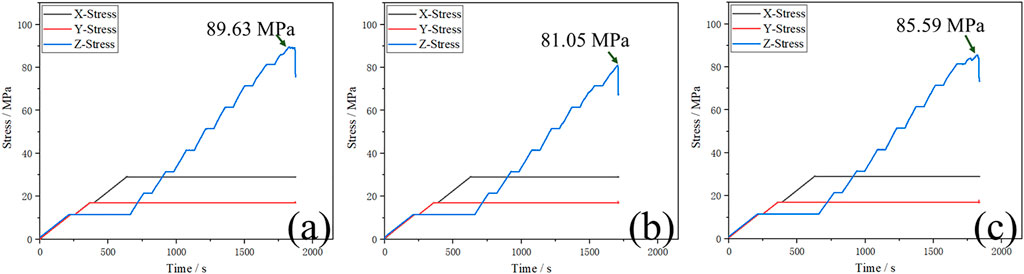
FIGURE 3. Test results: (A) intact specimens; (B) open-flaw specimens; (C) filled-flaw specimens.
Figure 4 shows the failed tunnel under true triaxial loading. Symmetrical V-shaped grooves appear on both sides of the intact specimens. In open-flaw specimens, the open-flaw appears at the upper right of the tunnel, and the V-shaped grooves on the right become a particle spray line. In the filled-flaw specimens, the V-shaped grooves on the right are bigger than on the left. This phenomenon means that the surrounding rock conditions affects the stability of tunnel.
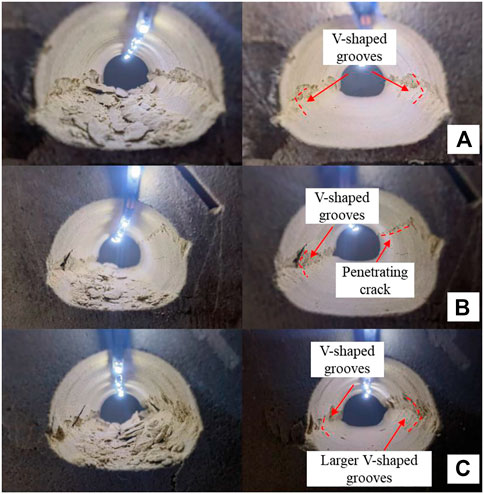
FIGURE 4. Internal images of the tunnel before and after debris cleaning: (A) intact specimens; (B) open-flaw specimens; (C) filled-flaw specimens.
3 Bifurcation and chaotic characteristics of rock energy evolution
3.1 Chaos theory and logistic system
Chaos theory implies that systems evolve from an ordered state to a disordered state and outlines the mechanism of the formation of random processes in a deterministic system. Logistic systems are simple chaotic systems (Zhang and Gao, 2012; Zhang, 2021). The Logistic equation is as follows:
The different form is obtained by continuous time discretisation.
Where
Figure 5 is a diagram of the Logistic equation. It shows that this equation divides the process into stability area, Bifurcation and chaos through
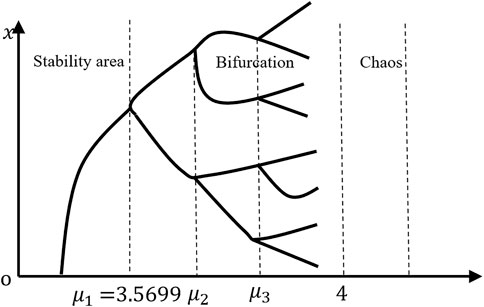
FIGURE 5. Solution graph of Logistic equation.
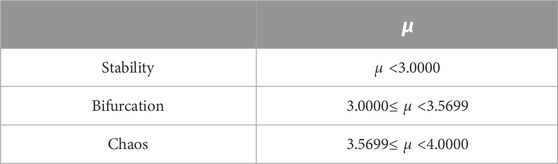
TABLE 1. Critical value of each area.
3.2 Chaos theory and stress
This research explores the relationship between maximum principal stress and energy density. We can write Eq. 1 in the following formula (Zhang, 2021):
Where
Figure 6 shows the relationship between the iterative growth factor
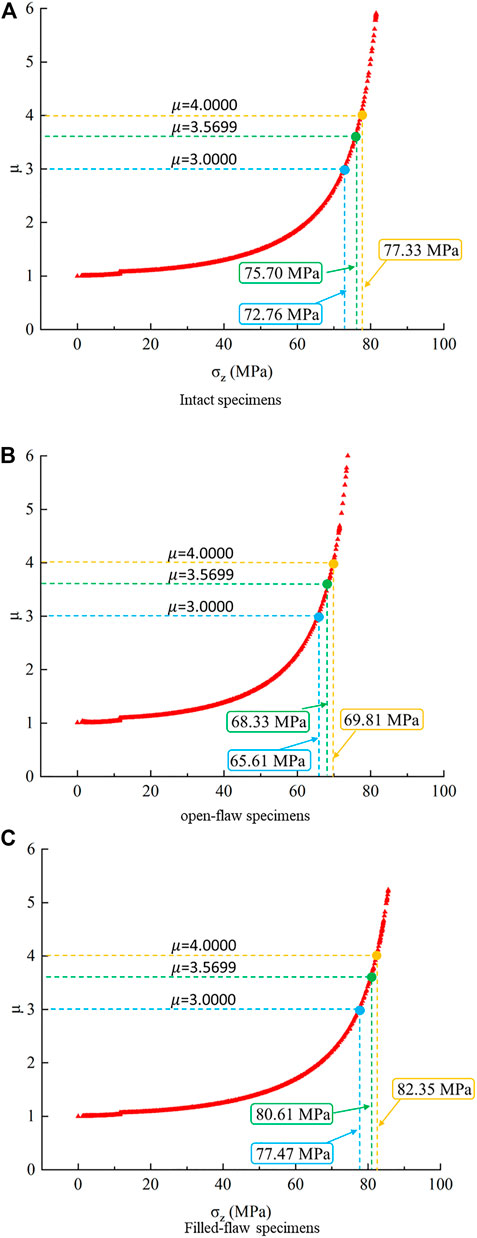
FIGURE 6. Variation of
Comparing the intact specimens, the open-flaw specimens and the filled-flaw specimens showed that the decrease in the surrounding rock integrity does not directly affect the crack initiation stress of the surrounding rock. The crack initiation stress of intact specimens, open-flaw specimens and filled-flaw specimens are 72.76, 65.61, and 77.47 MPa respectively.
4 Energy evolution characteristics in the rock deformation process
4.1 Energy calculation principle
In the process of rock compression, the deformation of rock usually includes elastic deformation and plastic deformation. The process of energy transformation can also be divided into elastic strain energy and dissipated energy. Elastic strain energy is stored in the rock mass and energy is dissipated by damage to the rock mass. In the true triaxial test, the specimen is deformed due to compression. Assuming that there is no heat exchange in the process (Xie et al., 2009), the energy input by external work is the total energy
Where
But a true triaxial test would consider not only the maximum principal stress acting on the rock but also the confining pressure applying energy to the rock. So, the total energy
Where
Where
According to Eqs 6–8, the elastic strain energy is:
Where
4.2 Analysis of energy evolution characteristics
The loading plate was modified to observe the crack development in the tunnel. The loading plate in the axial direction of the tunnel is grooved, and a micro camera was placed in the loading plate to record the crack propagation in the tunnel (Figure 7). The resolution of the micro camera is 3,840 × 2,160 pixels, capture 30 photos per second. The diameter of the observation hole of the micro camera is 20 mm, which is smaller than the diameter of the opening in the sample. The effects of the observation hole of the micro camera on the stress calculation are not incorporated in the current study.
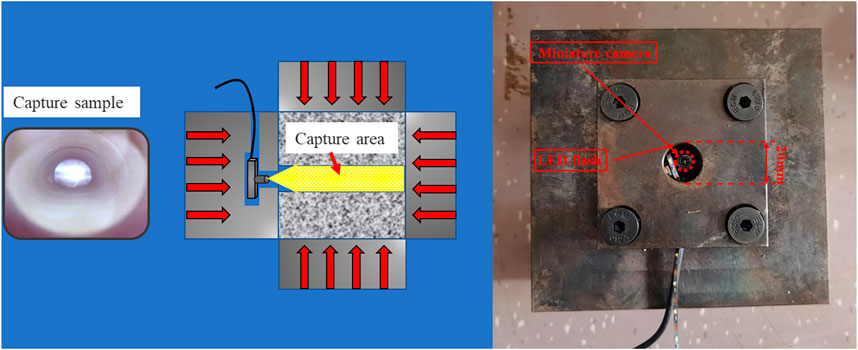
FIGURE 7. Micro cameras and capture sample.
Figure 8 shows the relationship between energy evolution and stress, and the captured image shows the crack propagation state in the tunnel at different periods.
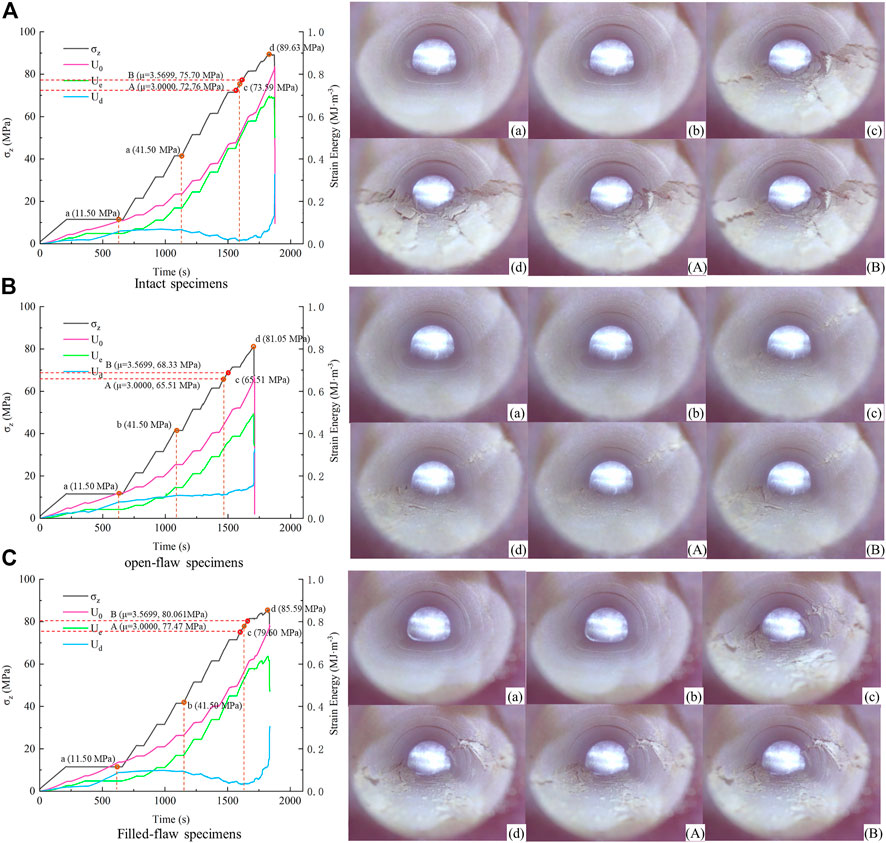
FIGURE 8. Energy evolution characteristics under the three surrounding rock conditions: (A) intact specimens; (B) open-flaw specimens; (C) filled-flaw specimens.
Energy evolution means the elastic energy stored in the rock is transformed into dissipated energy. The accumulation rate of energy in the surrounding rock is correlated with the loading rate. It is also obviously related to the structure of the surrounding rock (Figure 8). Furthermore, there are also many factors affecting the energy evolution in rocks.
In this research, the elastic energy under the three surrounding rock conditions has the same trend. Before the initial stage of loading, the surrounding rock is in the stage of pore compaction. The storage speed of elastic energy is slow. With the increase of stress, energy is continuously accumulated in the surrounding rock. At the same time, because the pores in the surrounding rock are compacted, a little elastic energy is transformed into dissipated energy. When the surrounding rock enters the elastic stage, the trend of energy accumulation is consistent with the trend of stress loading. It shows that elastic energy increases rapidly. However, with the rapid drop of stress, the elastic energy also decreases rapidly.
Dissipated energy shows some differences under different surrounding rock conditions. The dissipated energy increases slowly with the increase of stress at the initial stage. As the rock enters the elastic stage, the dissipated energy decreases slightly. The dissipated energy rises rapidly at the moment before the surrounding rock becomes unstable. There are some differences in the evolution characteristics of dissipative energy. When the rock enters the elastic stage, there is only a small decrease of dissipated energy in Group Open-flaw, which means that the open-flaw group continues to fail when the surrounding rock enters the elastic stage.
Internal images of some feature points are captured to better observe crack propagation in tunnels, which are divided into stages according to the level of dissipated energy. Point a represents the end of the first rise of dissipated energy, Point b represents the end of the linear segment after the dissipation energy first reaches the peak, and Point c represents the turning point where the dissipated energy rises again. At Point A (
Compare the images captured at each feature point and observe the image features at each stage. Point a and Point b are in the stable period (before Point A). In the characteristic point, no obvious damage is found in the surrounding rock but there is damage in the surrounding rock at Point A. This phenomenon is caused by the work that was done outside the surrounding rock, and energy is stored in the rock. The deformation of the surrounding rock concentrates the stress to a certain point in the tunnel. Point b shows the surrounding rock that is always between Point A and Point B. At Point c, the surrounding rock is damaged, and the damage at this stage is spalling. After Point B, the surrounding rock enters the chaos stage, and the damage becomes buckling failure.
So, the next step in the tunnel is particle injection. Before the surrounding rock enters the bifurcation process, the particle ejection phenomenon will occur inside the tunnel. When the surrounding rock enters the bifurcation process, there will be a spalling failure in the tunnel. V-shaped grooves on both sides of the tunnel are characteristic of spalling damage. Large buckling deformation of the tunnel occurs when the surrounding rock is in the chaos stage.
Compare captured images under different surrounding rock conditions. There is no crack generation at Point a or Point b in the stability stage. The surrounding rock is often damaged close to Point A, which represents the surrounding rock entering the bifurcation process. It is obvious that the damage of Group Intact and Group Filled-flaw in the bifurcation process seems to be more serious but the dissipative energy of the two groups in the bifurcation process is in a lower value. The dissipative energy of Group Open-flaw rises continuously. This means that the surrounding rock of Group Intact and Group Filled-flaw in the bifurcation process is stable but the surrounding rock of Group Open-flaw may be unstable in the bifurcation process.
In addition, the dissipative energy at the bottom (Point c) is always between Point A and Point B. This phenomenon can prove that the bifurcation process is a continuation of the previous stage. It belongs to the process in which the surrounding rock is in the stage of stability and failure. This is the same as the stage after Point B. After Point B, the dissipative energy will increase rapidly.
In this work, the energy limit of Group Intact is 0.697 MJ/m3, Group Filled-flaw is 0.635 MJ/m3 and Group Open-flaw is 0.486 MJ/m3. As the integrity of the surrounding rock decreases, the energy stored in the surrounding rock also decreases significantly.
4.3 Dissipated energy ratio under the three surrounding rock conditions
Figure 9 shows the evolution of the dissipated energy ratio. The dissipated energy rate is the ratio of dissipated energy to total energy. This ratio can reflect the rate at which elastic energy is transformed into dissipated energy at each moment. When the dissipated energy ratio rises, more damage occurs to the surrounding rock.
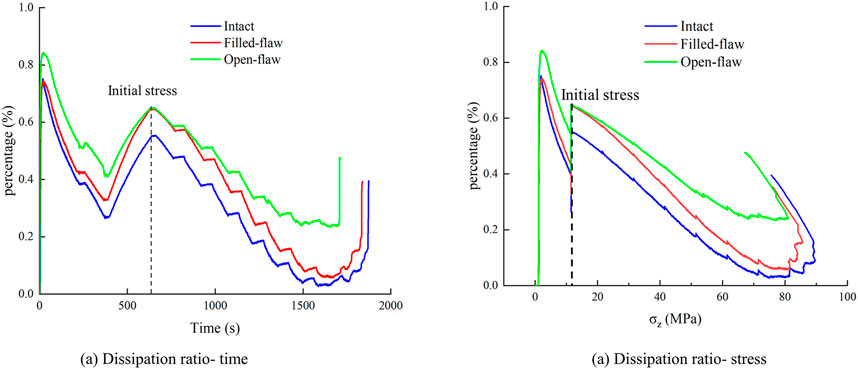
FIGURE 9. Dissipated energy ratio under the three surrounding rock conditions.
Before the initial stress, the rock is in the stage of pore compaction, and a large number of pores are compacted with a high dissipated energy ratio (Figure 9) but a low dissipation energy value (Figure 6). In this step-loading process, loose pores in the surrounding rock have compacted. After the initial stress, with the increase in stress, the energy dissipation gradually decreases in a linear phase with different slopes under different surrounding rock conditions. It was found that the integrity of the surrounding rock decreased with the higher dissipation energy ratio in the whole loading process.
Another interesting phenomenon is that the dissipated energy ratio of Group Filled-flaw (0.645 MJ/m3) near the initial stress is close to that of Group Open-flaw (0.648 MJ/m3). However, the dissipated energy ratio of Group Filled-flaw (0.064 MJ/m3) is closer to Group Intact (0.034 MJ/m3) at the later stage of loading. This may reflect that the damage to Group Filled-flaw was similar to that of Group open-flaw in the early stage (Figure 8 open-flaw specimens (c) and Figure 8 filled-flaw specimens (c)) and similar damage to Group intact in the later stage (Figure 3). The same particle ejection phenomenon occurs in Group Open-flaw and Group Filled-flaw in the early stage because of the prefabricated flaws in the surrounding rock. The flaws of Group Filled-flaw are filled with gypsum but gypsum is not very strong and there will always be some spaces between the gypsum and the surrounding rock. These can cause cracks extending from the prefabricated flaw to the inside of the tunnel. When the stress is about to reach peak value, the gypsum filled in the prefabricated flaw inhibits the further collapse of the prefabricated flaw, and new damage is generated in the tunnel. Filling the open flaw brings different forms of failure to the tunnel. This complex failure results in more fragments in the tunnel, but it also significantly increases the peak stress of the surrounding rock.
5 Discussion
The compression failure of rock is a complex process with a strong unpredictability (Hirata and Imoto, 1991; Zhang, 2021). Through chaos theory and energy evolution, the current stress state can be analysed, and the current state of the surrounding rock can be quickly and accurately predicted.
There are also different forms of failure inside the tunnel under different surrounding rock conditions. When open flaws appear around the tunnel, only particle spray failure occurs in the tunnel, but the surrounding rock may be close to instability damage. When open flaws are filled, spraying particles and spalling fragments in the tunnel will increase, but the peak stress will rise.
Figure 10 shows the characteristic strain energy under different surrounding rock conditions. The characteristic strain energy of different groups is significantly different. As the integrity of surrounding rock increases, the total elastic strain energy (0.660 MJ m-3, 0.778 MJ m-3, 0.834 MJ m-3) and elastic strain energy (0.486 MJ m-3, 0.635 MJ m-3, 0.697 MJ m-3) increase. However, there is no significant difference in the dissipative energy (0.312 MJ m-3, 0.306 MJ m-3, 0.328 MJ m-3) by surrounding rock during final failure.
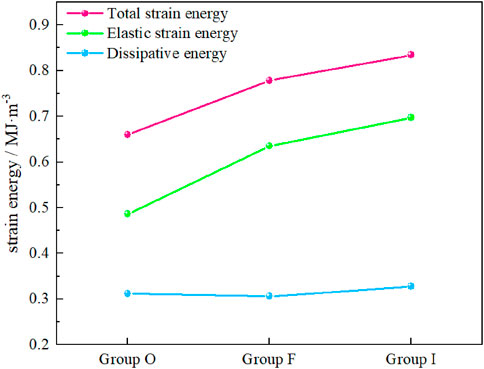
FIGURE 10. Comparative analysis of characteristic strain energy.
These phenomena indicates that the fracture of tunnel surrounding rock mainly affects the elastic strain energy accumulated in the surrounding rock. The dissipative energy after the ultimate failure of the surrounding rock is not affected by these fractures. But the rate of energy dissipation is different during the elastic process. Group F and Group I showed a downward trend and Group O showed a slow upward trend during the elastic process (Figure 8). It indicates that the main function of fracture filled is to suppress the deformation of surrounding rock and improve the ability of surrounding rock to store energy. Then, it explains the impact of fractures around tunnels on the stability of tunnel surrounding rocks from the energy perspective.
The application of chaos theory to rock is still being explored. In this study, chaos theory has been verified as able to determine whether the surrounding rock is stable or unstable, but it cannot accurately predict particle spray and spalling failure. In this research, we use chaos theory to analyse the damage inside the tunnel. The surrounding rock is in a stable stage, which does not mean that there is no failure in the tunnel. It only means that the surrounding rock will not lose stability, but the particle spray and spalling failure will still occur. However, we can use shotcrete support and other methods to prevent spray and spalling failure. When the surrounding rock is in the bifurcation process (
It should be noted that the failure characteristics in the tunnel analysed in this paper are generated under conditions of increasing maximum principal stress, which may be different from practical engineering. However, analysing the current state of the tunnel and the surrounding rock by energy evolution and chaos theory is a reliable way to understand the failure characteristics of the surrounding rock.
6 Conclusion
In this paper, the true triaxial load is applied to a tunnel with a four-centre arch, and the internal failure characteristics of the tunnel are analysed from the perspective of energy evolution.
In this research, we changed the conditions of the rock surrounding the sample tunnel. Surrounding rock conditions include intact surrounding rock, open-flaw surrounding rock and filled-flaw surrounding rock. We found that the peak stress of the surrounding rock of the tunnel increased significantly after filling the open flaw, but it was slightly lower than that of the intact surrounding rock.
There are remarkable differences between the failure characteristics and mechanisms for the surrounding rock under different conditions. The different conditions of the surrounding rock also affected the process of energy evolution. As the integrity of surrounding rock increases, the dissipation energy of surrounding rock in the elastic stage becomes lower and led to the increases in the energy stored in the surrounding rock (0.486 MJ/m3, 0.635 MJ/m3 and 0.697 MJ/m3).
The energy dissipation ratio can reflect the process of failure. The same failure behaviour has the same energy dissipation ratio. At the initial stage of step loading, the dissipated energy ratio of Group Filled-flaw (0.645 MJ/m3) and Group Open-fl0.697aw (0.648 MJ/m3) was similar and both had the same trends in failure. In addition, both Group Filled-flaw (0.064 MJ/m3) and Group Open-flaw (0.034 MJ/m3) have V-shaped grooves on both sides of the final failure characteristic.
Data availability statement
The original contributions presented in the study are included in the article/Supplementary Materials, further inquiries can be directed to the corresponding author.
Author contributions
BL: Funding acquisition, methodology, writing—review and editing. JL: Methodology, investigation, data curation, writinig—original draft. HH: Conceptualization, methodology, writing—review and editing. JG: Investigation, data curation. TL: Methodology, writing—review and editing.
Funding
We would also like to thank the Fujian Provincial Natural Science Foundation to sponsor this research, and the funding Number is 2022J01567 and 2019J01791.
Conflict of interest
The authors declare that the research was conducted in the absence of any commercial or financial relationships that could be construed as a potential conflict of interest.
Publisher’s note
All claims expressed in this article are solely those of the authors and do not necessarily represent those of their affiliated organizations, or those of the publisher, the editors and the reviewers. Any product that may be evaluated in this article, or claim that may be made by its manufacturer, is not guaranteed or endorsed by the publisher.
References
Afrazi, M., Lin, Q., and Fakhimi, A. (2022). Physical and numerical evaluation of mode II fracture of quasi-brittle materials. Int. J. Civ. Eng. 20, 993–1007. doi:10.1007/s40999-022-00718-z
Chen, L., Guo, W., Zhang, D., and Zhao, T. (2022). Experimental study on the influence of prefabricated fissure size on the directional propagation law of rock type-I crack. Int. J. Rock Mech. Min. Sci. 160, 105274. doi:10.1016/j.ijrmms.2022.105274
Chen, Z. Q., He, C., Ma, G. Y., Xu, G. W., and Ma, C. C. (2019). Energy damage evolution mechanism of rock and its application to brittleness evaluation. Rock Mech. Rock Eng. 52, 1265–1274. doi:10.1007/s00603-018-1681-0
Fakhimi, A., Lin, Q., and Labuz, J. F. (2018). Insights on rock fracture from digital imaging and numerical modeling. Int. J. Rock Mech. Min. Sci. 107, 201–207. doi:10.1016/j.ijrmms.2018.05.002
Hirata, T., and Imoto, M. (1991). Multifractal analysis of spatial distribution of microearthquakes in the Kanto region. Geophys. J. Int. 107, 155–162. doi:10.1111/j.1365-246X.1991.tb01163.x
Li, P., and Cai, M. F. (2021). Energy evolution mechanism and failure criteria of jointed surrounding rock under uniaxial compression. J. Cent. S. Univ. 28, 1857–1874. doi:10.1007/s11771-021-4735-5
Li, Y., Liu, B., Wang, X., Shao, Y., Li, L., Wei, J., et al. (2021). The effect of a prefabricated crack on the crack growth in ceramics during quenching. Ceram. Int. 47, 3643–3648. doi:10.1016/j.ceramint.2020.09.215
Li, Z., Wang, L., and Li, W. (2022). Mechanical behavior and fracture characteristics of rock with prefabricated crack under different triaxial stress conditions. Miner 12, 673. doi:10.3390/min12060673
Liu, G. L., Chen, Y. L., Du, X., Xiao, P., Liao, S. M., and Azzam, R. (2021a). Investigation of microcrack propagation and energy evolution in brittle rocks based on the voronoi model. Mater 14, 2108. doi:10.3390/ma14092108
Liu, X. X., Wu, L. X., Zhang, Y. B., Wang, S. Z., Yao, X. L., and Wu, X. Z. (2021b). The characteristics of crack existence and development during rock shear fracturing evolution. Bull. Eng. Geol. Environ. 80, 1671–1682. doi:10.1007/s10064-020-01997-3
Mehranpour, M. H., Kulatilake, P., Ma, X. G., and He, M. C. (2018). Development of new three-dimensional rock mass strength criteria. Rock Mech. Rock Eng. 51, 3537–3561. doi:10.1007/s00603-018-1538-6
Meng, Q. B., Zhang, M. W., Zhang, Z. Z., Han, L. J., and Pu, H. (2019). Research on non-linear characteristics of rock energy evolution under uniaxial cyclic loading and unloading conditions. Environ. Earth Sci. 78, 650. doi:10.1007/s12665-019-8638-9
Muralha, J., Grasselli, G., Tatone, B., Blümel, M., Chryssanthakis, P., and Yujing, J. (2014). ISRM suggested method for laboratory determination of the shear strength of rock joints: Revised version. Rock Mech. Rock Eng. 47, 291–302. doi:10.1007/s00603-013-0519-z
Sharafisafa, M., Shen, L. M., Zheng, Y. G., and Xiao, J. Z. (2019). The effect of flaw filling material on the compressive behaviour of 3D printed rock-like discs. Int. J. Rock Mech. Min. Sci. 117, 105–117. doi:10.1016/j.ijrmms.2019.03.031
Wang, C. L., He, B. B., Hou, X. L., Li, J. Y., and Liu, L. (2020a). Stress-energy mechanism for rock failure evolution based on damage mechanics in hard rock. Rock Mech. Rock Eng. 53, 1021–1037. doi:10.1007/s00603-019-01953-y
Wang, C. L., Zhou, B. K., Li, C. F., Cao, C., Sui, Q. R., Zhao, G. M., et al. (2022). Experimental investigation on the spatio-temporal-energy evolution pattern of limestone fracture using acoustic emission monitoring. J. Appl. Geophys. 206, 104787. doi:10.1016/j.jappgeo.2022.104787
Wang, H., Li, Y., Cao, S., Pan, R., Yang, H., Zhang, K., et al. (2020b). Brazilian splitting test study on crack propagation process and macroscopic failure mode of pre-cracked black shale. Chin. Rock Mech. Rock Eng. 39, 912–926. doi:10.13722/j.cnki.jrme.2019.0839
Wang, Y., Feng, W. K., and Li, C. H. (2020c). On anisotropic fracture and energy evolution of marble subjected to triaxial fatigue cyclic-confining pressure unloading conditions. Int. J. Fatigue 134, 105524. doi:10.1016/j.ijfatigue.2020.105524
Wang, Y., Li, C. H., and Han, J. Q. (2020d). On the effect of stress amplitude on fracture and energy evolution of pre-flawed granite under uniaxial increasing-amplitude fatigue loads. Eng. Fract. Mech. 240, 107366. doi:10.1016/j.engfracmech.2020.107366
Worley, R., Dewoolkar, M. M., Xia, T., Farrell, R., Orfeo, D., Burns, D., et al. (2019). Acoustic emission sensing for crack monitoring in prefabricated and prestressed reinforced concrete bridge girders. J. Bridge Eng. 24. doi:10.1061/(ASCE)BE.1943-5592.0001377
Xie, H., Ju, Y., and Li, L. (2005). Criteria for strength and structural failure of rocks based on energy dissipation and energy release principles. Chin. J. Rock Mech. Eng. 24, 3003–3010.
Xie, H., Li, L., Peng, R., and Ju, Y. (2009). Energy analysis and criteria for structural failure of rocks. J. Rock Mech. Geotech. Eng. 1, 11–20. doi:10.3724/SP.J.1235.2009.00011
Xue, Y., Liu, S., Chai, J., Liu, J., Ranjith, P. G., Cai, C., et al. (2023a). Effect of water-cooling shock on fracture initiation and morphology of high-temperature granite: Application of hydraulic fracturing to enhanced geothermal systems. Appl. Energy 337, 120858. doi:10.1016/j.apenergy.2023.120858
Xue, Y., Ranjith, P. G., Gao, F., Zhang, Z., and Wang, S. (2023b). Experimental investigations on effects of gas pressure on mechanical behaviors and failure characteristic of coals. J. Rock Mech. Geotech. Eng. 15, 412–428. doi:10.1016/j.jrmge.2022.05.013
Yang, H., Lin, H., Chen, Y., Wang, Y., Zhao, Y., Yong, W., et al. (2022). Influence of wing crack propagation on the failure process and strength of fractured specimens. Bull. Eng. Geol. Environ. 81, 71. doi:10.1007/s10064-021-02550-6
Zafar, S., Hedayat, A., and Moradian, O. (2020). Evaluation of crack initiation and damage in intact barre granite rocks using acoustic emission. Int. J. Geotech. Earthq. Eng., 399–408.
Zhang, Z., and Gao, F. (2012). Experimental research on energy evolution of red sandstone samples under uniaxial compression. Chin. J. Rock Mech. Eng. 31, 953–962. doi:10.3969/j.issn.1000-6915.2012.05.012
Zhang, L., Yu, Meng, Wang, Fanzhen, Zhang, Zaiquan, PengGao, Su, and Zhang, P. (2021). Energy evolution analysis and failure criteria for rock under different stress paths. Acta Geotech. 16, 569–580. doi:10.1007/s11440-020-01028-1
Zhang, L. Y., and Zhu, J. M. (2020). Analysis of mechanical strength and failure morphology of prefabricated closed cracked rock mass under uniaxial compression. Geotech. Geol. Eng. 38, 4905–4915. doi:10.1007/s10706-020-01335-0
Zhang, S., Wang, L., and Gao, M. (2020). Experimental and numerical study of the influence of prefabricated crack width on the fracture toughness of NSCB specimens. Rock Mech. Rock Eng. 53, 5133–5154. doi:10.1007/s00603-020-02211-2
Zhang, T., Liu, B., Wei, Z., Jiao, Z., Song, Z., and Zhang, H. (2022). Dynamic mechanical responses and crack evolution of burst-prone coal with a single prefabricated fissure. Theor. Appl. Fract. Mech. 121, 103494. doi:10.1016/j.tafmec.2022.103494
Zhang, Z. X., Kou, S. Q., Jiang, L. G., and Lindqvist, P. A. (2000). Effects of loading rate on rock fracture: Fracture characteristics and energy partitioning. Int. J. Rock Mech. Min. Sci. 37, 745–762. doi:10.1016/s1365-1609(00)00008-3
Zhou, X. P., Niu, Y., Cheng, H., and Berto, F. (2021). Cracking behaviors and chaotic characteristics of sandstone with unfilled and filled dentate flaw. Theor. Appl. Fract. Mech. 112, 102876. doi:10.1016/j.tafmec.2020.102876
Keywords: surrounding rock condition, energy evolution, tunnel, chaos theory, flaw
Citation: Li B, Li J, Hu H, Gong J and Luo T (2023) Experimental studies of instability process and energy evolution of tunnels under true triaxial stresses: The role of pre-existed flaws. Front. Earth Sci. 11:1184589. doi: 10.3389/feart.2023.1184589
Received: 12 March 2023; Accepted: 03 April 2023;
Published: 19 April 2023.
Edited by:
Xu Chang, Huaqiao University, ChinaReviewed by:
Yi Xue, Xi’an University of Technology, ChinaLianchong Li, Northeastern University, China
Copyright © 2023 Li, Li, Hu, Gong and Luo. This is an open-access article distributed under the terms of the Creative Commons Attribution License (CC BY). The use, distribution or reproduction in other forums is permitted, provided the original author(s) and the copyright owner(s) are credited and that the original publication in this journal is cited, in accordance with accepted academic practice. No use, distribution or reproduction is permitted which does not comply with these terms.
*Correspondence: Tao Luo, MTM2ODg0NEBxcS5jb20=