 Abdeslam Baiddah1
 Samira Krimissa1Sonia Hajji1Maryem Ismaili1
 Kamal Abdelrahman2Meryem El Bouzekraoui1Hasna Eloudi3Abdenbi Elaloui1Abdellah Khouz4,5
 Nasem Badreldin6
 Mustapha Namous1*
- 1Data Science for Sustainable Earth Laboratory (Data4Earth), Sultan Moulay Slimane University, Beni Mellal, Morocco
- 2Department of Geology and Geophysics, College of Science, King Saud University, Riyadh, Saudi Arabia
- 3Applied Geology and Geoenvironment Laboratory, Faculty of Sciences, Ibn Zohr University, Agadir, Morocco
- 4Laboratory of Applied Sciences for the Environment and Sus-tainable Development (SAEDD), Higher School of Technology Essaouira, Cadi Ayyad University, Marrakech, Morocco
- 5Centre of Geographical Studies, Institute of Geography and Spatial Planning, Universidade de Lisboa, Lisbon, Portugal
- 6Department of Soil Science, University of Manitoba, Winnipeg, MB, Canada
Gully erosion has been identified in recent decades as a global threat to people and property. This problem also affects the socioeconomic stability of societies and therefore limits their sustainable development, as it impacts a nonrenewable resource on a human scale, namely, soil. The focus of this study is to evaluate the prediction performance of four machine learning (ML) models: Logistic Regression (LR), classification and regression tree (CART), Linear Discriminate Analysis (LDA), and the k-Nearest Neighbors (kNN), which are novel approaches in gully erosion modeling research, particularly in semi-arid regions with a mountainous character. 204 samples of erosion areas and 204 samples of non-erosion areas were collected through field surveys and high-resolution satellite images, and 17 significant factors were considered. The dataset cells of samples (70% for training and 30% for testing) were randomly prepared to assess the robustness of the different models. The functional relevance between soil erosion and effective factors was computed using the ML models. The ML models were evaluated using different metrics, including accuracy, the kappa coefficient. kNN is the ideal model for this study. The value of the AUC from ROC considering the testing datasets of KNN is 0.93; the remaining models are associated to ideal AUC and are similar to kNN in terms of values. The AUC values from ROC of GLM, LDA, and CART for testing datasets are 0.90, 0.91, and 0.84, respectively. The value of accuracy considering the validation datasets of LDA, CART, KNN, and GLM are 0.85, 0.82, 0.89, 0.84 respectively. The values of Kappa of LDA, CART, and GLM for testing datasets are 0.70, 0.65, and 0.68, respectively. ML models, in particular KNN, GLM, and LDA, have achieved outstanding results in terms of creating soil erosion susceptibility maps. The maps created with the most reliable models could be a useful tool for sustainable management, watershed conservation and prevention of soil and water losses.
1 Introduction
Soil represents among the most important natural resources that need to be carefully preserved to ensure the sustainability of ecosystems and human civilization (Daba, 2003; Saha et al., 2020b; Pal et al., 2022) Un-fortunately, one of the important issues in current societies over the last 10 years has been natural resource degradation particularly Water and soil (Magliulo, 2012). Gully erosion is the most common form of water-induced soil erosion, among the greatest widespread processes on the Earth’s surface (Daba, 2003). The effects of gully erosion significantly contribute to the onset of soil degradation issues, reduce agricultural production capacity and cause pollution from soil loss (Wade and Heady, 1978). This has significant implications because the soil is a non-renewable natural resource over the human timescale, and it is estimated that approximately six million fertile hectares of agricultural land worldwide are continuing to lose production capacity due to land deterioration induced by soil erosion (Lal et al., 1989; Daba, 2003).
Morocco is one of the nations in the Mediterranean most prone to climate change impacts and land degradation. In some parts of Morocco, 70% of the land is reportedly utilized. Collaboratively by local populations and communities, as well as land disputes over access to plants and water, are common contributing systems significantly to continuing degradation and frequent land use (Jazouli et al., 2019; Lamane et al., 2022). In addition, the extent and severity of this phenomenon are rising because of the climate changes that this country and the Mediterranean region, in general, are experiencing, coupled with the human pressures exerted on this resource (e.g., drought, deforestation, intensive agriculture, and overgrazing). Due to these factors, it has become crucial to monitor and assess water erosion, particularly in regions where the quantitative estimation of losses remains laborious and expensive due to the terrain’s vastness and roughness. However, despite the fact that soil degradation mechanisms are dynamic, it is challenging to comprehend their ongoing expansion (Fitzjohn et al., 2002; Daba, 2003; Magliulo, 2012; Pourghasemi et al., 2017).
A gully’s susceptibility for erosion (GES) assessment is the initial step in identifying the hazard and risk for carrying out soil sustainability initiatives (Rahmati et al., 2017; Saha et al., 2020b). The relation be-tween geo-environmental gully conditioning elements and gully occurrence is used to create a gully erosion susceptibility map (GESM) (Hosseinalizadeh et al., 2019). In addition, soil erosion quantification models are useful for measuring runoff rates and soil loss from agricultural land, planning land use regulations, and developing indicators of relative soil loss. In addition to guiding government policy and strategy on soil and water conservation (Smith, 1999; Lamane et al., 2022). To determine the susceptibility of gully erosion, several models have been utilized (GES), such as the European Soil Erosion Model (EUROSEM) (Morgan et al., 1998), the Universal Soil Loss Equation (USLE) (Daba, 2003; Phama et al., 2018), the Potential Erosion Process (PEP), the Modified Southwest Interagency Committee Model (MPSIAC), and the Water Erosion Project (WEEP) (Althuwaynee et al., 2013). Furthermore, the use of remote sensing data, GIS, and statistical models to predict gully susceptibility has increased greatly over the last decades (Rahman et al., 2018; Nhu et al., 2020a). Among these techniques are the Analytical Hierarchy Processes (AHP) (Roy and Saha, 2018), Weights-of-Evidence (WoE) (Ding et al., 2017; Gayen and Saha, 2017; Rahmati et al., 2017), Logistic Regression (LR) (Conoscenti et al., 2014; Saha et al., 2020b), Frequency Ratio (FR) (Conoscenti et al., 2014; Gayen et al., 2020; Rahmati et al., 2016b), Information Value (IV) (Khouz et al., 2022), bi-variate statistical models (Conforti et al., 2011; Rahmati et al., 2016a), and Maximum Entropy (ME) (Pourghasemi et al., 2017). Moreover, Deep Learning (DL) and Machine Learning (ML) techniques have been demonstrated to be useful tool for evaluating and mapping gully erosion (Ali et al., 2015; Pourghasemi et al., 2017; Gayen and Saha, 2017; Saha et al., 2020b). These algorithms are a special case of the artificial intelligence discipline based on the idea that systems can learn from inventory and model input data without operator interaction (Anaya-Romero et al., 2005; Ali et al., 2015; Rahmati et al., 2017; Saha et al., 2020b; Chowdhuri et al., 2021). Nowadays, the huge application of ML and DL is becoming increasingly popular, particularly in the mapping and monitoring natural hazards because they produce high-accuracy results in data processing, classification, and prediction (Saha et al., 2020b). The utilization of these techniques enables the creation of predictive maps for soil erosion by analyzing the spatial distribution of existing gully erosion forms alongside various conditioning factors such as geological and environmental factors. The selection of an appropriate spatial resolution of DEM data is a vital step in creating effective conditioning factor maps, as highlighted by Chowdhuri et al. (2021).
Recent years have seen a significant increase in the use of ML algorithms for the spatial prediction of a variety of natural hazards, including flooding, landslides (Moradi et al., 2019), wildfires (Watson et al., 2019), etc. GES mapping has been done by several studies throughout the world utilizing ML and statistical methods. Frequency ratio (Arabameri et al., 2018b), logistic regression (Dube et al., 2014; Tien Bui et al., 2019), weight of evidence (WoE) (Zabihi et al., 2019), index of entropy (IoE) (Roy et al., 2020), and others are some of the statistical techniques that are frequently used to predict GES. Various machine learning (ML) algorithms, such as artificial neural networks (ANN), support vector machines (SVM) (Dube et al., 2014; Gayen and Saha, 2017; Gayen et al., 2019; Roy et al., 2022), random forests (RF), multi-layer perception (MLPC) approaches (Yunkai et al., 2010; Ruidas et al., 2022a; Ruidas et al., 2022b), classification and regression trees (CART) (Yunkai et al., 2010), boosted regression tree (BRT) (Tairi et al., 2021) particle swarm optimization (PSO) (Pourghasemi et al., 2017), multi-variate adaptive regression spline (MARS) (Wade and Heady, 1978; Saha et al., 2020a), and maximum entropy (Pourghasemi et al., 2017) have also been widely used to predict GES mapping. Due to its reliability and performances, ensemble models have also been employed extensively in the thorough examination of GES mapping (Simonneaux et al., 2015; Avand et al., 2019). The RF model provided the best prediction performance among the investigated models, according to the literature. The revised universal soil loss equation (RUSLE) was used by Tairi et al. (2021) to calculate soil erosion in the Moroccan watershed of Tifnout Askaoun. These efforts produced a crucial tool for the long-term land management of the surrounding area. It is crucial to do soil erosion research in this setting to add to the body of knowledge and help local governments create appropriate strategies for managing soil and land, watersheds, and infrastructure.
However, there is not much information in the literature about gully erosion in Morocco (Arabameri et al., 2020b; Arabameri et al., 2019a). Azedou et al. (2021) projected the spatial distribution of gully erosion in the Souss-Massa watershed, Morocco, using frequency ratio (FR), logistic regression (LR), and random forest (RF).
This study makes a significant contribution by utilizing a range of machine learning (ML) models, such as LR, CART, LDA, and kNN, as well as experimenting with high-resolution scale effects of digital elevation model, to predict the location of soil erosion in the complex topographical, geological, and anthropogenic characteristics of the Chichaoua watershed. The application of these models in predicting soil erosion is not commonly found in the current literature and their effectiveness has not been sufficiently tested. In contrast, many previous studies in the field of GES have employed simple approaches. The unique aspect of this study is the integration of different ML models, high-resolution datasets, and extensive field surveys to produce an accurate gully susceptibility map. The resulting map will provide decision-makers and managers with a useful and effective tool for implementing sustainable management practices in soil conservation.
The main objective of this study is to develop and compare 4 ML algorithms for predicting gully erosion susceptibility in the Chichaoua region, Morocco. The algorithms that will be utilized include Linear Discriminate Analysis (LDA), classification and regression tree (CART), Logistic Regression (LR), and K-Nearest Neighbors (KNN). In order to achieve this objective, the study will follow a series of steps. First, the study will define the areas of erosion and non-erosion through field surveys and high-resolution satellite images. Second, the study will identify 17 geo-environmental factors that could potentially contribute to gully development in the study area. Third, the study will assess the linearity of these factors using Multi-collinearity analysis within given VIF and TOL limits. Fourth, the four ML approaches will be applied to create spatial susceptibility maps, which will be classified into five classes ranging from very low to very high. Finally, the study will validate the gully erosion susceptibility maps using kappa index, Receiver Operating Characteristic ROC, Area Under the Curve (AUC), and cross-validation methods with the testing dataset.
2 Materials and methods
2.1 Study area
The Chichaoua watershed is situated southwest of Marrakech city, between 8°40′0″ and 9°0′0″ and 31°00′00″ and 31°40′00″ north latitude, and has a 2,600 km2 area, see Figure 1. The watershed is drained by Oued de Chichaoua. From a climate viewpoint, the research area is classified as a semi-arid continental zone, with a yearly average precipitation of approximately 181 mm, a maximum of 395 mm, and a minimum of 110 mm. Geomorphologically, the region consists of three geomorphological units: the high highlands, the piedmont, and El Haouz plain, with heights ranging from 218 to 3,387 m. What concerns lithology, the area of study includes a variety of lithologies, with quaternary recent alluvium dominating downstream and paleozoic schists (Combro-Ordovicien) dominating upstream. Due to these characteristics, the Chichaoua watershed can operate as a pilot unit for erosive process investigation.
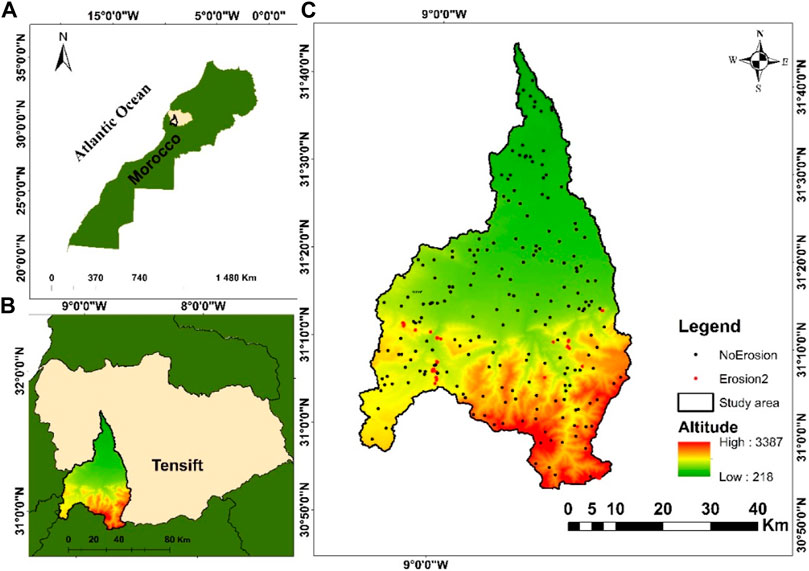
FIGURE 1. Geographical location of the study area at the Moroccan scale (A), the Tensift basin scale (B) and the watershed DEM (C); 406 of soil erosion observations; 202 of NoErosion and 204 Erosion.
In this region, gullies are located essentially in the South-East and South-West parts of the catchment area and most are active. The reasons for the study of erosion problems in the Chichaoua catchment area are multiple and aim to identify the areas that provide the most sediment to plug the Boualouane dam and prevent its silting up. Thus, watershed management is based on the logic that it is not only a question of preserving the water resource for the population downstream of this dam, but also of fighting against the degradation of the land upstream. This degradation generally has an impact on soil fertility, which has repercussions on productivity and therefore on the living standards of farmers. Management must therefore take care to combat this soil degradation through various actions, both mechanical and biological, accompanied by social actions aimed at improving the standard of living of the population. These actions are often costly and it is not possible to generalise them throughout the basin. It is therefore essential to determine priority intervention areas in order to rationalise actions and expenditure.
2.2 Methodology
The flowchart contains specifics about this study’s approach (Figure 2). The following are the primary steps.
(i) Preparation of gully inventory and conditioning factors datasets.
(ii) Multicollinearity analysis among the gully erosion factors using the Variance Inflation Factor (VIF) and Tolerance (TOL).
(iii) A frequency ratio (FR) technique determined the geographic relationship between gully frequency and conditioning factors.
(iv) LDA, CART, GLM, and KNN models were applied for mapping gully erosion. Then, several statistical parameters were applied to verify the efficiency of the model’s application result.
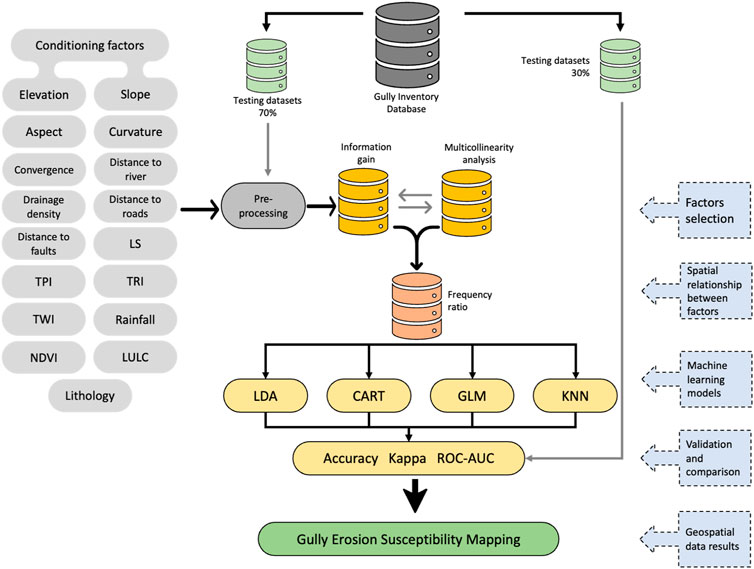
FIGURE 2. A comprehensive illustration chart provides a clear roadmap of research methodology.
This study employed a GIS environment, statistics tools, and R packages to apply various ML algorithms and database management.
2.2.1 Gully inventory
The GEM must be created using the gully erosion inventory (GEI) map. The geographic location of gullies is represented on the GEI map. The probability of gully erosion in the future can be anticipated based on the distribution of gullies in the past and present (Tairi et al., 2021). During a field survey, a map of gully erosion was created (i.e., GPS points), and high-resolution google Earth images analysis, wherein 408 gully erosion and no-erosion sites were observed. The non-erosion points were generated randomly, as suggested by most researchers in the literature. Two training and validation datasets were randomly selected from the gully erosion inventory map. Several of the mapped gully hotspots in the study area are shown in Figure 3. The 286 point locations (70% of the total) were used to train the previously mentioned models. The remaining 122 gully locations (about 30% of the total) were used to test the models. An equal number of locations were chosen and evaluated because the models chosen for this study belong to a family that predicts whether a phenomenon would occur or not (122 no gully locations for validation and 286 no gully locations for calibration data) (Pourghasemi et al., 2017). It should be noted that the geomorphological features continue to disagree over whether balanced or unbalanced datasets should be established prior to a susceptibility study, which results in the creation of a balanced dataset for the future analyses.
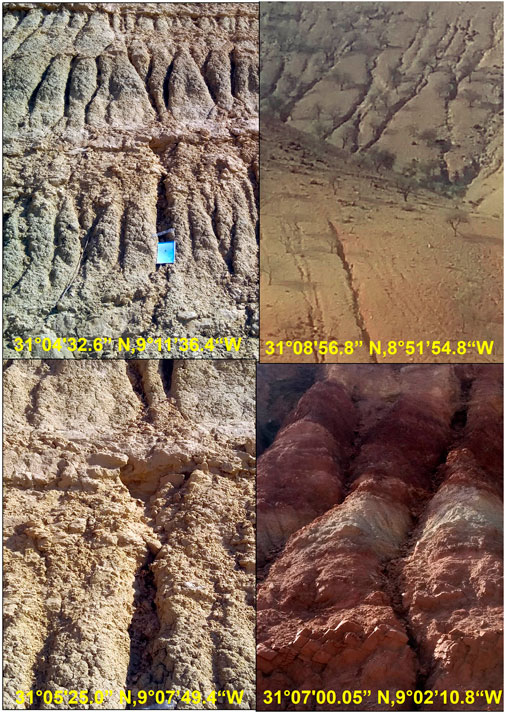
FIGURE 3. Photos of gully erosion in the Chichaoua watershed. According to the photos taken in the field, the Chichaoua catchment area shows two types of erosion. A strong erosion which characterizes the zones with friable materials stripped of vegetation with a very strong slope, they are located essentially in the South-East and South-West parts of the catchment area. Gully erosion is a widespread phenomenon in this part of the catchment area, the gullies are mainly located on friable Neogene phosphate marl, clays, and tertiary deposits. Low erosion in the rest of the study area These are largely areas of rocky outcrops which are highly resistant to erosion, and include flat land with a very gentle slope and land protected by a fairly high degree of vegetation cover. These areas, which are an integral part of the Hercynian basement, are essentially made up of rocks formed by schists, graywackes, limestone bars and volcanic matrix of primary age (Cambro-Ordovician) and detrital rocks of Quaternary age. Sheet erosion and debris flows are common in this part of the Chichaoua watershed.
2.2.2 Conditioning factors analysis
Various geo-environmental elements, including climatic, hydrological, topographic, geological, and environmental, are crucial criteria for GESM. Seventeen useful factors were chosen based on a prior literature analysis (Zabihi et al., 2018; Arabameri et al., 2019a, Arabameri et al., 2019b). The following factors were noted: elevation, slope, aspect, curvature, convergence, LS factor, distance to rivers, distance to roads, distance to fault, drainage density, normalized difference vegetation index (NDVI), topographic wetness index (TWI), topographic position index (TPI), topographic rugged-ness index (TRI), rainfall, land use/land cover (LULC), and lithology. To drive topography-related attributes we used the USGS Earth Explorer wich has a spatial resolution of 12.5 m (Table 1). The average annual rainfall of the study area was calculated from 3 rainfall stations from 1989 to 2020. Finally lithology was from the geological survey of Marrakech Tensift watershed Basin Agency. The scale was 1: 50,000.

TABLE 1. The predictive factors used in the modeling of soil erosion pin of the study area.
2.2.2.1 Topographic factors
Hydrological conditions are greatly influenced by topographic factors (Namous et al., 2021). Eight topographic parameters were considered in this study: slope length, aspect, curvature, convergence, topographic wetness index (TWI), and terrain roughness index (TRI) (LS). These topographical factors are displayed in (Figure 4).
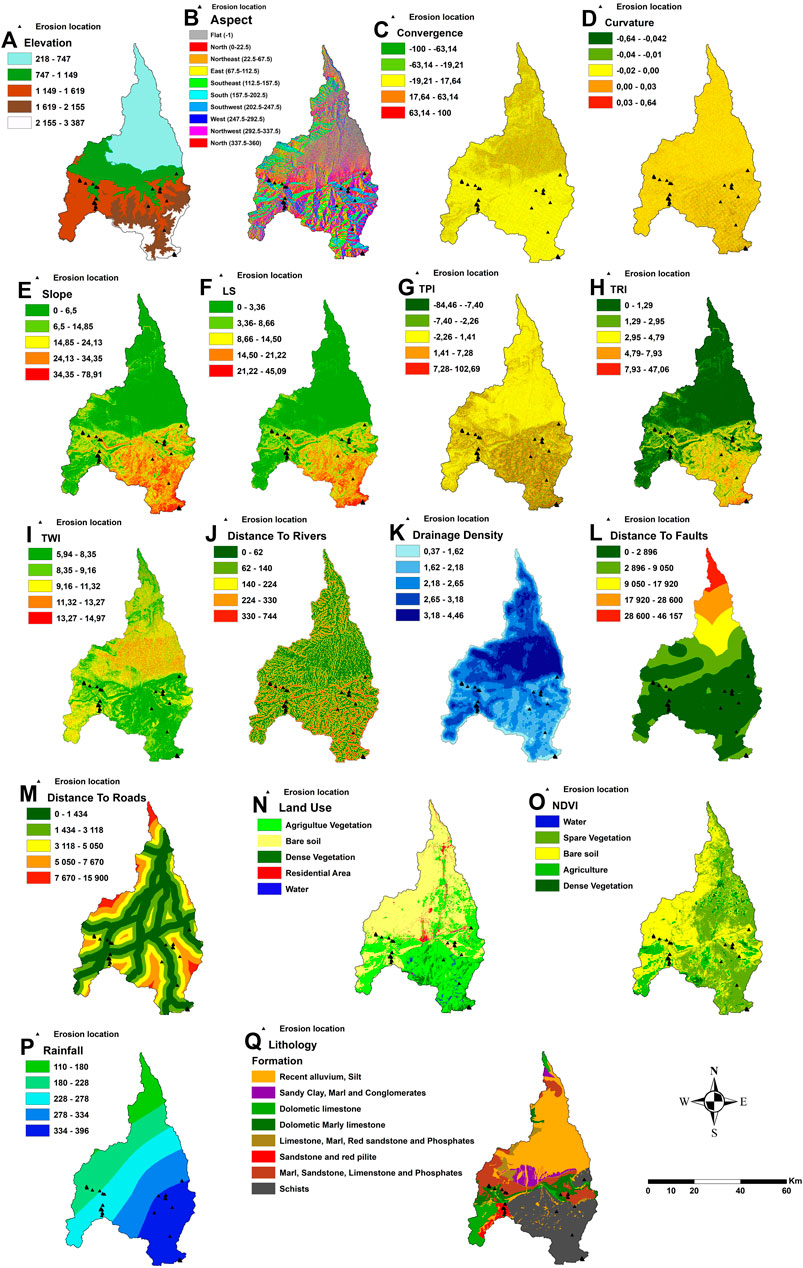
FIGURE 4. Gully erosion conditioning factors (A) elevation(m), (B) aspect, (C) convergence, (D) curvature, (E) slope (%), (F) LS(m), (G) TPI, (H) TRI, (I) TWI, (J) distance to river(m), (K) drainage density, (L) distance to faults (m/year), (M) distance to roads(m), (N) land use, (O) NDVI, (P) rainfall (mm/year) and (Q) lithology.
The elevation is a principal source for extracting topographic factors. As a result of its impact on climatic and vegetation variability, it is regarded by many researchers as one of the most significant reasons for gully erosion vulnerability (Conoscenti et al., 2013). The surface of runoff infiltration, water flow speed, and soil particle detachment are all significantly influenced by slope (Lei et al., 2020). The slope aspect represents the slope’s surface’s direction, indirectly affecting erosion by changing vegetation cover, the incidence of sunlight, and wetness. Ten classes were used to categorize the aspect map. The slope perpendicular to the slope angle, which determines the curvature, influences the convergence and divergence of water flow across the surface. The convergence index (CI) represents the morphology of the terrain and the impacts that this may have on flows (Arabameri et al., 2019a). The topographic wetness index (TWI) illustrates how soil moisture, erosion, and wetness conditions are distributed spatially. TWI is described by Eq. 1:
Where
LS is a parameter used in the USLE and RUSLE to quantify soil erosion rates (Gayen et al., 2019). Moore and Burch (1986) provided a formula for calculating the LS factor as follows:
TRI, determines the convexity and concavity of a slope. In the digital elevation model, TRI represents the magnitude of elevation difference between adjacent cells (DEM). The following equation was used to determine the TRI: (3) (Moreno-Ibarra et al., 2011):
Where
2.2.2.2 Climatic factors
The climate is a significant factor directly affecting gully erosion. Soil erosion occurs when rainfall water penetrates into the fractures in the ground and causes the gully to grow (Azareh et al., 2019; Lei et al., 2020). In the study area, annual rainfall data were obtained from four climatic stations (Chichaoua, Imintanout, Sidi Bouathman, and Iloudjane). The rainfall map shows that the annual average range is between 352.1 and 167.2 mm/year. The highest average of precipitation values is located in the Sidi Bouathman station (Figure 4I).
2.2.2.3 Hydrological factors
The selected hydrological factors are drainage density and distance to rivers. The drainage density has a major influence on erosion occurrence; in the region with lower infiltration and greater runoff, higher drainage densities are associated and vice versa (Arabameri et al., 2020a). The drainage density maps illustrate the stream distribution in the research area. (Figure 4J). The distance from river maps was calculated by the Euclidean distance method in GIS software in order to determine the distance of the gully from the drainage system (Figure 4K).
2.2.2.4 Geological factors
The selected geological factors in this study are lithology and distance to fault. Lithology is another important factor in gulling (Nhu et al., 2020a). For the current study, nine types of lithology units were found using 1/500,000 geological map of Morocco. The distance to fault represents a weak, extremely permeable zone with lower resistance. Also, faults influence slope stability and promote soil degradation (Gayen et al., 2019). The distance to faults is shown in Figure 4M.
2.2.2.5 Environmental factors
Three environmental factors have been prepared: LULC, NDVI, and distance to roads. The Landsat Operational Land Imager (OLI) satellite image is obtained from the USGS Earth Explorer website (accessed on 6 July 2020), with a pixel size of 12.512.5 m. This area’s LULC map is created using supervised classification and a maximum likelihood method in a GIS environment. There were five classes on the LULC map; water, sparse vegetation, bare soil, agricultural areas, and dense vegetation (Figure 4N). Distance to roads can also affect gully erosion, as they concentrate and intercept runoff water (Frankl et al., 2012; Nhu et al., 2020b). The distance to road maps is shown in Figure 4O.
Determine the biomass of the vegetation using the NDVI. Eq. 4 was used in conjunction with Landsat 8 OLI/TIRS images in a GIS context to produce the NDVI map:
where the value of the near-infrared band’s spectral reflectance is indicated by NIR and Red denotes the value of the red spectral reflectance. NDVI ranges from −0.12 to 0.58 in this study.
2.2.3 Collinearity test
In statistics, multicollinearity analysis was used to identify information redundancy between the parameter that could affect the model’s performance and the linearity between the conditioning variables of a certain phenomenon (Namous et al., 2021) When there is a significant degree of correlation between multiple variables and the result’s accuracy is reduced, this is known as multicollinearity. High multicollinearity factors must be eliminated from the analysis to get better results. Numerous researchers have used various techniques to detect multicollinearity in ML models (i.e., in gully erosion susceptibility mapping, landslides, and flood susceptibility mapping. Etc. Eqs 5 and 6 showed that multicollinearity for the gully erosion influencing factors was found utilizing the confusion matrix, VIF, and TOL:
Were
When VIF≥10 there are linear relationships between conditioning factors.
2.2.4 Spatial correlation
To provide each class of factor before the modeling phase, several studies advise adopting the frequency ratio (FR) method (Namous et al., 2021). The dependent variable gullies and the independent variables’ conditioning factors were mapped out spatially using frequency ratio approaches. Each factor is divided into multiple classes, and the frequency ratio is determined for each class using the following Eq. 7:
where:
The study found that each type of contributing factor and the areas of gully erosion are related. The FR has been converted into normalized values (FRN) from 0.01 to 0.99 to give various factors the same weight and facilitate the final analysis. The FRN values were then utilized to categorize all conditioning factors for gully erosion susceptibility mapping. The FRN for each class is determined using the following Eq. 8:
2.2.5 Modelling of gully erosion susceptibility
2.2.5.1 Linear Discriminate Analysis (LDA)
LDA is a widely used ML technique for high-accuracy task classification (Wang et al., 2020). This model is reliable, simple to apply, and highly predictive, and the factor predictors remain stable when the classes can be clearly distinguished (Youssef and Pourghasemi, 2021).
LDA identifies the linear combination of many groups of causal factors, such as K = V + m. (m is constant). The estimated (k) values with appropriate coefficients can identify a case set the best when determined by a linear combination (Wang et al., 2020). The discriminant coefficients are numbers that lengthen the separation between each cluster’s vector of mean values (Youssef and Pourghasemi, 2021), to reduce dimensionality in machine-learning models, this step is necessary for data pre-processing (Wang et al., 2020).
2.2.5.2 Classification and regression tree (CART)
One of the most used methods for data classification is the CART method. It does not require a normal variable distribution and is robust to missing data. This method of binary recursive partitioning was created by Stone (1974), Friedman et al. (1975), Breiman (1984) and Elmahdy et al. (2020). The technique has been successfully applied in several fields. Regression trees are used to predict the value of an independent variable when it is continuous, as opposed to classification trees, which are used to categorize independent variables (Elmahdy et al., 2020).
The CART is built by repeatedly dividing subgroups of the dataset by creating two child nodes utilizing all predictor variables. The ultimate goal is to produce a subset of the dataset that is as similar as possible concerning the objective variable (Chen et al., 2017).
2.2.5.3 Logistic regression (via generalized linear model or GLM)
Nelder and Wedderburn initially introduced the GLM, 1972 (Avand et al., 2022). Based on the logistic connection function (logistic regression) that has been widely used for modeling binary data sets utilizing a logistic model to determine based on presence/absence data (Avand et al., 2022).
The best regression model for predicting many events is created by the GLM, which is built from multiple linear models (Yousefi et al., 2020). Generally, this technique employs multiple regression to improve the precision and quality of the results because the relationship between the dependent and independent variables is so clearly defined (Yousefi et al., 2020).
2.2.5.4 k-Nearest Neighbors (kNN)
The K-Nearest Neighbor (KNN) classification method is widely employed in data mining applications (Shahabi et al., 2020). It is a slow, nonparametric learning approach that is independent of prior knowledge about the main dataset (Shahabi et al., 2020). In the classification mode, the algorithm calculates the distance between the target point and the closest points based on the value provided for k and the highest number of votes received for these nearby points compared to all of the points (Avand et al., 2019) according to an empirical rule of thumb proposed by Dude, K is equal to the square root of the number of samples; this makes parameter adjustment challenging for a variety of applications (Shahabi et al., 2020). The KNN algorithm assumes that pixels next to one another in the trait space should belong to the same class by going directly to the decision rule and skipping the density subordinate (Avand et al., 2019).
2.2.6 Validation of results
An important phase in evaluating the susceptibility of gully erosion is the validation of gully erosion susceptibility maps. The accuracy methodology, kappa index, Receiver Operating Characteristic ROC, Area Under the Curve (AUC), and cross-validation method are utilized in the current research to assess the effectiveness of the LDA, CART, GLM, and KNN ML models with the testing dataset.
2.2.6.1 ROC-AUC
ROC curve is a frequently employed approach for quantitatively assessing the diagnostic ability of a test (Gayen and Pourghasemi, 2019). This technique has been widely used to assess how accurate various natural hazard susceptibility maps are (Arabameri et al., 2020a). An X-axis for sensitivity based on false positive rates and a Y-axis for 1-specificity based on true positive rates are both present on the two-dimensional ROC curve (Arabameri et al., 2020a). Using the following equations:
The area under the curve (AUC) indicates the capability and uncertainty of the models under study (Amiri et al., 2019).
Where: P is the total number of gullies and N is the total number of non-gullies.
The values of AUC range from 0.5 to 1 (Park et al., 2011). The best model has the highest value. Generally, AUC values of 0.9–1, 0.8–0.9, 0.7–0.8, 0.6–0.7, and 0.5–0.6 suggest excellent, good, moderate, and low classes, respectively (Amiri et al., 2019; Ismaili et al., 2023).
2.2.6.2 Accuracy
The accuracy is the proportion of precisely calculated or defined units that is as high as possible (Saha et al., 2020b), it is calculated as follows:
Where:
2.2.6.3 Kappa
The Kappa coefficient (K) reveals how effectively the used models distinguish gully pixels (Rahmati et al., 2017), and is determined as the percentage of the observed agreement that exceeds what would be predicted by chance (Rahmati et al., 2017). The metric is computed as follows:
Where:
The Kappa coefficient can be used to categorize the model performance as follows: 0 (poor), 0–0.2 (slight), 0.2–0.4 (fair), 0.4–0.6 (moderate), 0.6–0.8 (considerable), and 0.8–1 (almost excellent) (Rahmati et al., 2017).
Positive Predictive Value (PPV) is a statistical measure of the accuracy of a binary classification test. It is defined as the proportion of positive test results that are true positives. PPV is calculated as the number of true positive results divided by the number of all positive results (i.e., true positives + false positives) (Ait Naceur et al., 2022; Ismaili et al., 2023), given:
While the negative Predictive Value (NPV) is a statistical measure of the accuracy of a binary classification test. It is defined as the proportion of negative test results that are actually true negatives. NPV is calculated as the number of true negative results divided by the number of all negative results (i.e., true negatives + false negatives) (Ait Naceur et al., 2022; Ismaili et al., 2023), given:
3 Results
The obtained results of this study included the development and comparison of four ML algorithms LDA, CART, LR, and KNN - for predicting gully erosion susceptibility in the Chichaoua region of Morocco. To achieve this, the study followed several steps: i) the areas of erosion and non-erosion were defined through field surveys and high-resolution satellite images; ii) 17 geo-environmental factors that could contribute to gully development in the study area were identified; iii) the linearity of these factors was assessed using Multi-collinearity analysis; iv) the four ML approaches were applied to create spatial susceptibility maps, which were classified into five classes ranging from very low to very high; and v) the gully erosion susceptibility maps were validated using kappa index, Receiver Operating Characteristic ROC, Area Under the Curve (AUC), and cross-validation methods with the testing dataset.
3.1 Preparing the Gully Inventory Map (GIM)
The locations and dimensions of the gullies were first determined using the remotely sensed data obtained through Google Earth to create the Gully Inventory Map (GIM). The data was then updated and verified in the research region by conducting a field investigation. Using a mobile GPS, gully locations were geolocated. In the study region, 204 gullies in total were found. The remaining 30 gullies were employed for model testing, and 70% of the 204 gullies were randomly chosen for model training (Figure 1) based on prior research. Typical gully pictures are displayed in (Figure 3).
3.2 Factors analysis
Within the given VIF and TOL limits, a significant variety of factors, including elevation, aspect, convergence, curvature, slope, LS, TPI, TRI, TWI, distance to a river, drainage density, lithology, distance to faults, distance to roads, land use, NDVI and rainfall (Figure 4), were used to predict gully erosion. In this study, elevation, aspect, convergence, curvature, slope, LS, TPI, TRI, TWI, distance to a river, drainage density, distance to faults, distance to roads, and rainfall were categorized into five subcategories using the Network-Based Method (NBM) in GIS, where they were employed as numerical variables. The aspect, lithology, land use and NDVI were used as categorical variables. The target variables were the presence and absence of gullies.
VIF and TOL evaluations were utilized to eliminate elements strongly correlated with others, as shown in Figure 5. Highly associated variables will have comparable effects on soil erosion; hence, removing them can increase the accuracy of predictive models. The minimum VIF value required for removal is 10 (Ismaili et al., 2023). Analysis showed that all variables other than slope (VIF=9.83, TOL=6.47) had VIF values below 10. As a result, the slope factor in this study was removed from the modelling process, see Table 2.
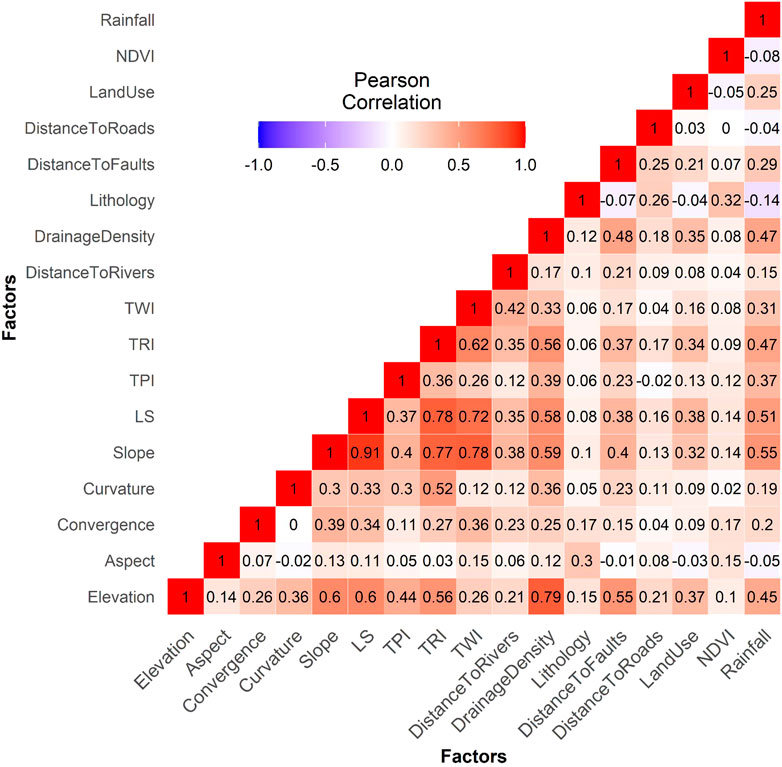
FIGURE 5. Multi-collinearity analysis to assess the independent variables’ linearity.
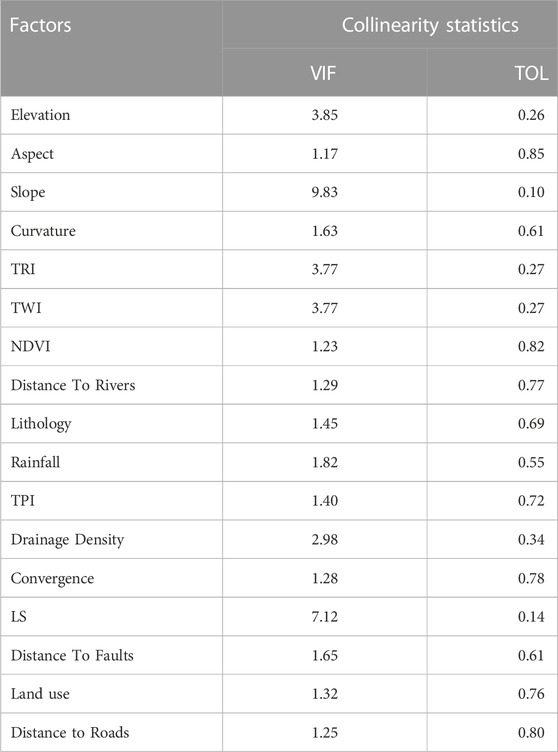
TABLE 2. Multi-collinearity analysis to assess the independent variables’ linearity.
Based on the RF model, the significance of variables for gully erosion mapping was carried out. As demonstrated in (Figure 6), elevation, lithology, distance to river, LS, distance to roads, distance to faults, NDVI, TRI, and TWI were the factors that were most important for gully erosion susceptibility mapping, with relative significance of 30.92, 30.08, 29.41, 26.08, 24.28, 20.36, 20.29, 15.11, 15.05 whereas TPI (5.96), convergence (3.96), curvature (2.22), had minimal significance.
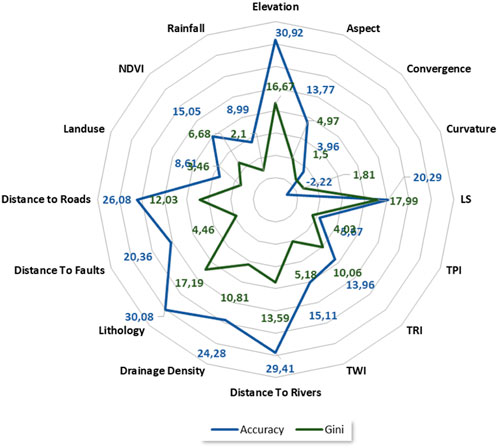
FIGURE 6. Conditioning factors’ importance using RF model. The most influential factors on gully development in the study area are elevation, lithology, distance to rivers and LS, based on the mean decrease in accuracy. However, using the mean decrease of GINI, the factors are altitude, lithology, elevation and distance to rivers respectively.
3.3 Soil erosion susceptibility prediction
The models’ classes were used to visualize better and prioritize locations of erosion predictions, were identified on a map, and categorized as very low, low, moderate, high, and very high. As shown in Table 3; Figure 7. These were segmented via the GIS natural break algorithm environment (Talukdar et al., 2020; Yousefi et al., 2020). The percentages of the watershed divided into the five classes of soil-erosion susceptibility were determined for each of the four methods (Figure 7). The GLM model results show that the regional coverage of gully erosion susceptibility for very low, low, moderate, high, and very high areas are 1678.47, 196.72, 140.53, 110.55, and 405.60 km2, respectively. Based on the GES map of the GLM model, the majority of the area comprises very low (66.29%) to very high (16.02%) susceptibility classes. In comparison, low (7.77%), moderate (5.55%), and high (4.37%) Classes on susceptibility include the remainder of the area under study (Figure 7B). In this model, the southern and southeastern regions are primarily concentrated with the very high, high, and moderate susceptibility areas portions of the watershed. This watershed is divided into zones with extremely low to low GES.
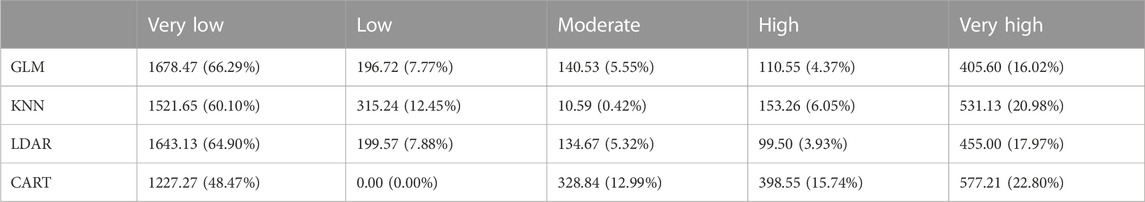
TABLE 3. The prediction of gully erosion Susceptible areas in square kilometres.
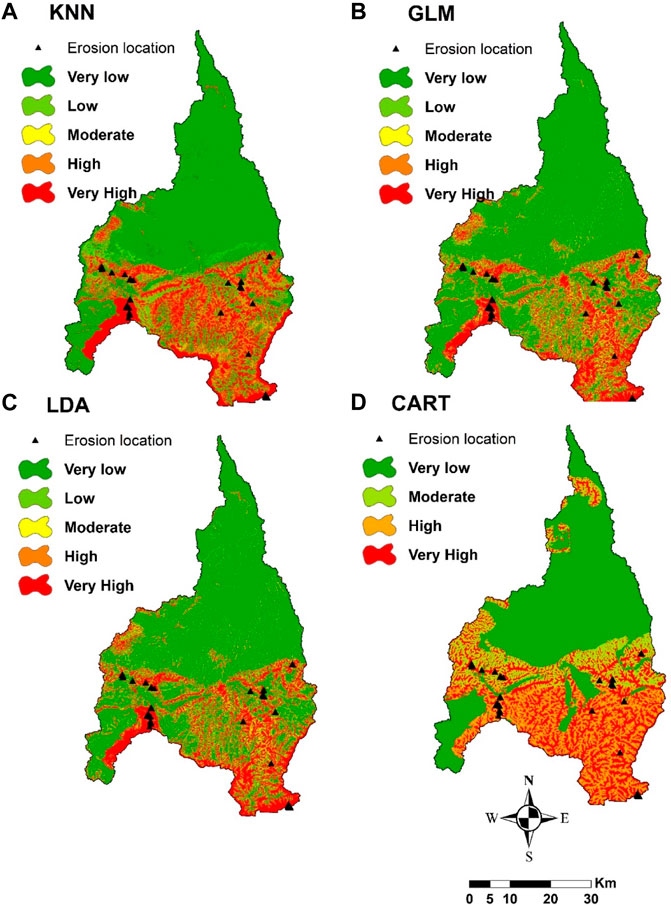
FIGURE 7. The four models are used to create a head-cut gully erosion map. (A) GLM; (B) KNN; (C) LDR; (D) CART.
The areal coverage for very low, low, moderate, high, and very high gully erosion susceptibility zones for KNN results are 1521.65 (60.10%), 315.24 (12.45%), 10.59 (0.42%), 153.26 (6.05%), and 531.13 km2 (20.98%), respectively. The KNN model’s GES map shows that the majority of the land is covered by very low (60.10.10%) to very high (20.98%) susceptibility classes, while low (12.45%), high (6.05%), and moderate (0.42%) Classes on susceptibility cover the remainder of the study area. This model’s very high, high, and moderate susceptibility areas are primarily found in the watershed’s southern and south-eastern regions (Figure 7A). This watershed is divided into zones with extremely low to low GES.
In the instance of the LDAR model, the areal coverage for very low, low, moderate, high, and very high gully erosion susceptibility zones are 1643.13 (64.90%), 199.57 (7.88%), 134.67 (5.32%), 99.50 (3.93%), and 455 km2 (17.97%), respectively. According to the GES map, most of the area comprises very low (64.90%) to very high (17.97%) susceptibility classes. In comparison, in low (7.88%), moderate (5.32%), and high (3.93%) susceptibility classes, the remainder of the study area is occupied. The very high to moderate susceptibility zones in this model is primarily centered in the southern and southeastern parts of the watershed. In contrast, the remaining portions are linked to very low to low susceptibility zones (Figure 7C).
The CART model’s area coverage for the very low, low, moderate, high, and very high gully erosion susceptibility zones are 12227.27 (48.47%), 0.00 (0.00%), 328.84 (12.99%), 398.55(15.74%), and 577.21 (22.80%) km2, respectively. The CART model’s GES map shows that the majority of the land is covered by very low (48.47%) to very high (22.80%) susceptibility classes, while high (15.74%), moderate (12.99%), and low (0.00%) The remaining portion of the study area is covered by the respective susceptibility classes. The southern, south-eastern, and eastern portions of the watershed are mostly associated to very high, high, and moderate gully erosion susceptibility zones, while the remaining portions are associated to very low to low susceptibility zones (Figure 7D).
3.4 Validation of the models
KNN is the ideal model for this study. The value of the AUC from ROC considering the testing datasets of KNN is 0.93; the remaining models are associated to ideal AUC and are similar to KNN in terms of values. Model; the AUC values from ROC of GLM, LDA, and CART for testing datasets are 0.90, 0.91, and 0.84, respectively (Figure 8). Similar values are observed for the training datasets in KNN, GLM, LDA, and CART with 0.98, 0.96, 0.96, and 0.89, respectively. The value of accuracy considering the validation datasets of LDA, CART, KNN and GLM are 0.85,0.82,0.89,0.84; the same values in LDA, CART, KNN and GLM training datasets are 0.89,0.81,0.91,0.91. The values of Kappa of LDA, CART, and GLM for testing datasets are 0.70, 0.65, and 0.68, respectively (Figure 9). The values of Kappa in LDA, CART, KNN, and GLM for training datasets are 0.78, 0.62, 0.82, and 0.82, respectively. Nearly the same values were found in the validation datasets in LDA, CART, KNN, and GLM 0.70, 0.65, 0.78, and 0.68, respectively.
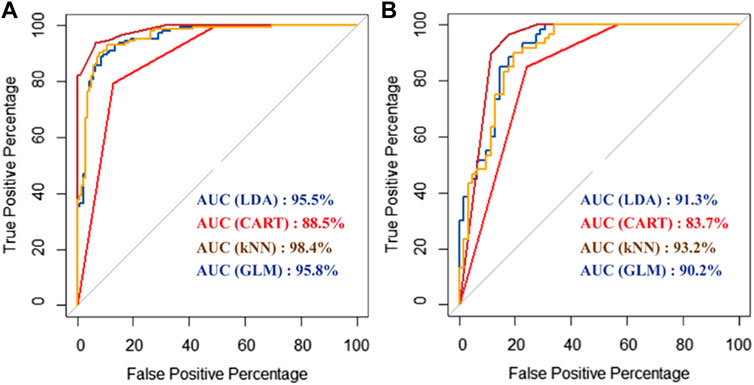
FIGURE 8. Receiver operating characteristic (ROC/AUC) analysis for four head-cut gully erosion models using the training (A) and testing (B) dataset.
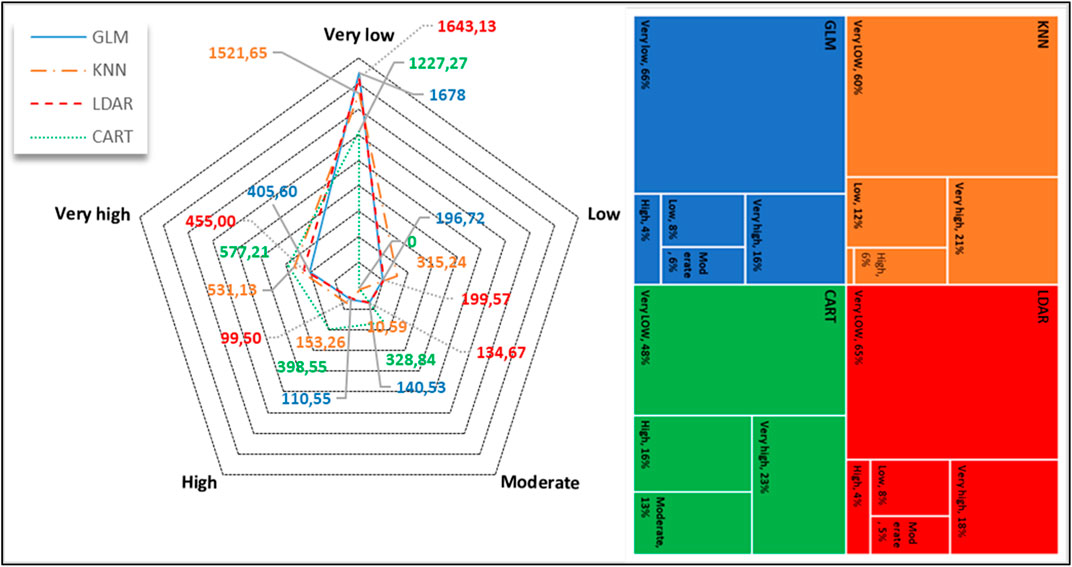
FIGURE 9. Areas and percentage of gully erosion susceptibility classes.
ML models of lDA (accuracy = 0.86, Kappa = 0.73) KNN (accuracy = 0.86, Kappa = 0.72) and GLM (accuracy = 0.85, Kappa = 0.70) displayed better performances than the CART (accuracy = 0.79, Kappa= 0.59) model that has previously been used in this field (Figure 10).
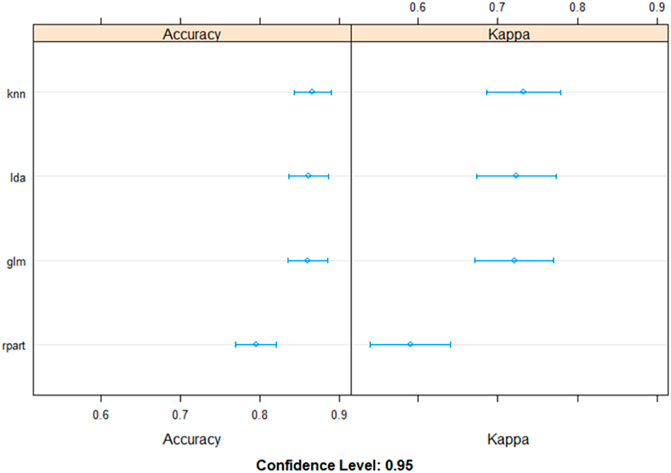
FIGURE 10. Accuracy and Kappa analysis of KNN, IDA GLM, and CART models.
As illustrated by Figure 11, According to the examination of the model’s performance, there is a good correlation of accuracy between the two models GLM, and LDA, also a medium correlation between GLM and LDA with KNN; nevertheless, on the other hand, we see that there is the low correlation of accuracy between the tree models KNN, GLM and LDA with CART.
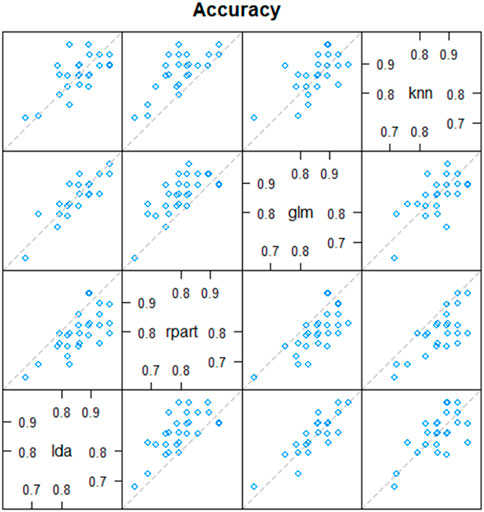
FIGURE 11. The comparison and correlation between KNN, GLM, CART, and IDA models.
In addition, many statistical indicators were considered for determining the best capacity of all the models for GES modeling. The sensitivity values in LDA, CART, KNN, and GLM for training datasets are 0.87, 0.83, 0.88, and 0.89, respectively. Similar values for the validation datasets in LDA, CART, KNN, and GLM are 0.83, 0.85, 0.90, and 0.85, respectively. The training datasets’ specificity values in LDA, CART, KNN, and GLM are 0.91, 0.78, 0.94, and 0.92, respectively. Regarding validation datasets, the specificity values in LDA, CART, KNN, and GLM are 0.86, 0.80, 0.87, and 0.83, respectively. The values of PPV for training datasets in LDA, CART, KNN, and GLM are 0.91, 0.80, 0.94, and 0.93, respectively. When considering the validation datasets, the PPV values in LDA, CART, KNN, and GLM are 0.83, 0.78, 0.86, and 0.81 (Table 4). In LDA, CART, KNN, and he NPV values for the training datasets for GLM models are 0.86, 0.81, 0.88, and 0.89, respectively. The NPV values in LDA, CART, KNN, and GLM for validation datasets are 0.86, 0.86, 0.92, and 0.87, respectively.
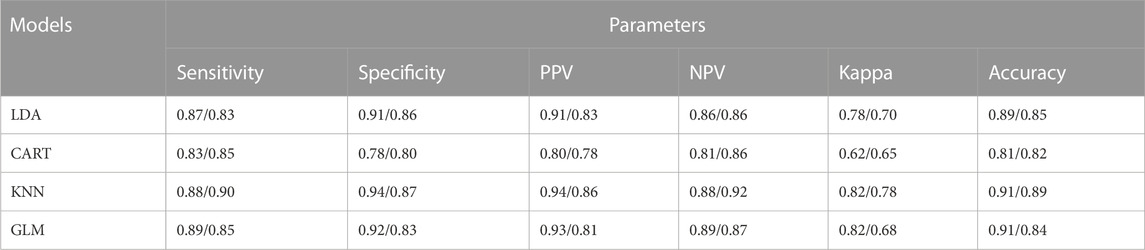
TABLE 4. The performances of the models using the training/validation.
In this study, KNN is the best model because it provides the highest accuracy correlated with high Kappa values. The values of the remaining models are almost identical to those of the KNN model and are also associated with optimal accuracy. The evaluation of the machine learning (ML) models used in this study generally showed that all the ML models performed well. However, the models’ performances were evaluated as follows in terms of accuracy and kappa values: IDA > GLM > KNN >CART.
4 Discussion
Land degradation is a phenomenon caused mainly by soil erosion, the combined effects of climate, topography, vegetation covers, and anthropogenic actions, leading to serious problems, such as reduction of arable land, a decrease in agricultural production, pollution of rivers, siltation of dams, drought, poverty etc.
Research on water erosion has been known for several centuries in the Mediterranean basin, whereas in Africa, research has only developed in recent decades. The problems of erosion in this old continent were noted by Harroy as early as 1944. Still, the research did not begin until 1950, when several studies were carried out on erosive phenomena as a function of the diversity of ecosystems, climates, relief, crops and population density. Roose (1977) suggests that erosion can be defined as a set of variable processes in time and space, depending on ecological conditions and poor land management by human influence. In 1977, and according to an FAO study, 12.6 million hectares of cropland and rangeland in Morocco were threatened by water erosion and two-thirds of the cropland required extensive conservation measures.
Erosion, in general, results from the interaction of various factors, the most important of which are climatic aggressiveness, The combined effects of the degree of erodibility, land usage, and slope length. Determining these parameters allows for knowing the soil losses on the slopes and their spatial distribution.
Machine learning algorithms are reliable methods for reducing and regulating the impact of gully erosion in many parts of the world. Nine publications from around the world that were published between 2019 and 2021 were chosen based on the Web of Science (WoS) database and using the common keywords “gully erosion susceptibility” and “machine learning techniques”. The results are shown in Table 5. RF can handle large datasets and enable rapid classifications based on various features, which allows it to produce models with higher accuracy than other methods. Additionally, RF is frequently used to evaluate each variable’s significance in calculating a multi-classifier, as well as its correctness and applicability for various applications. (Garosi et al., 2019).
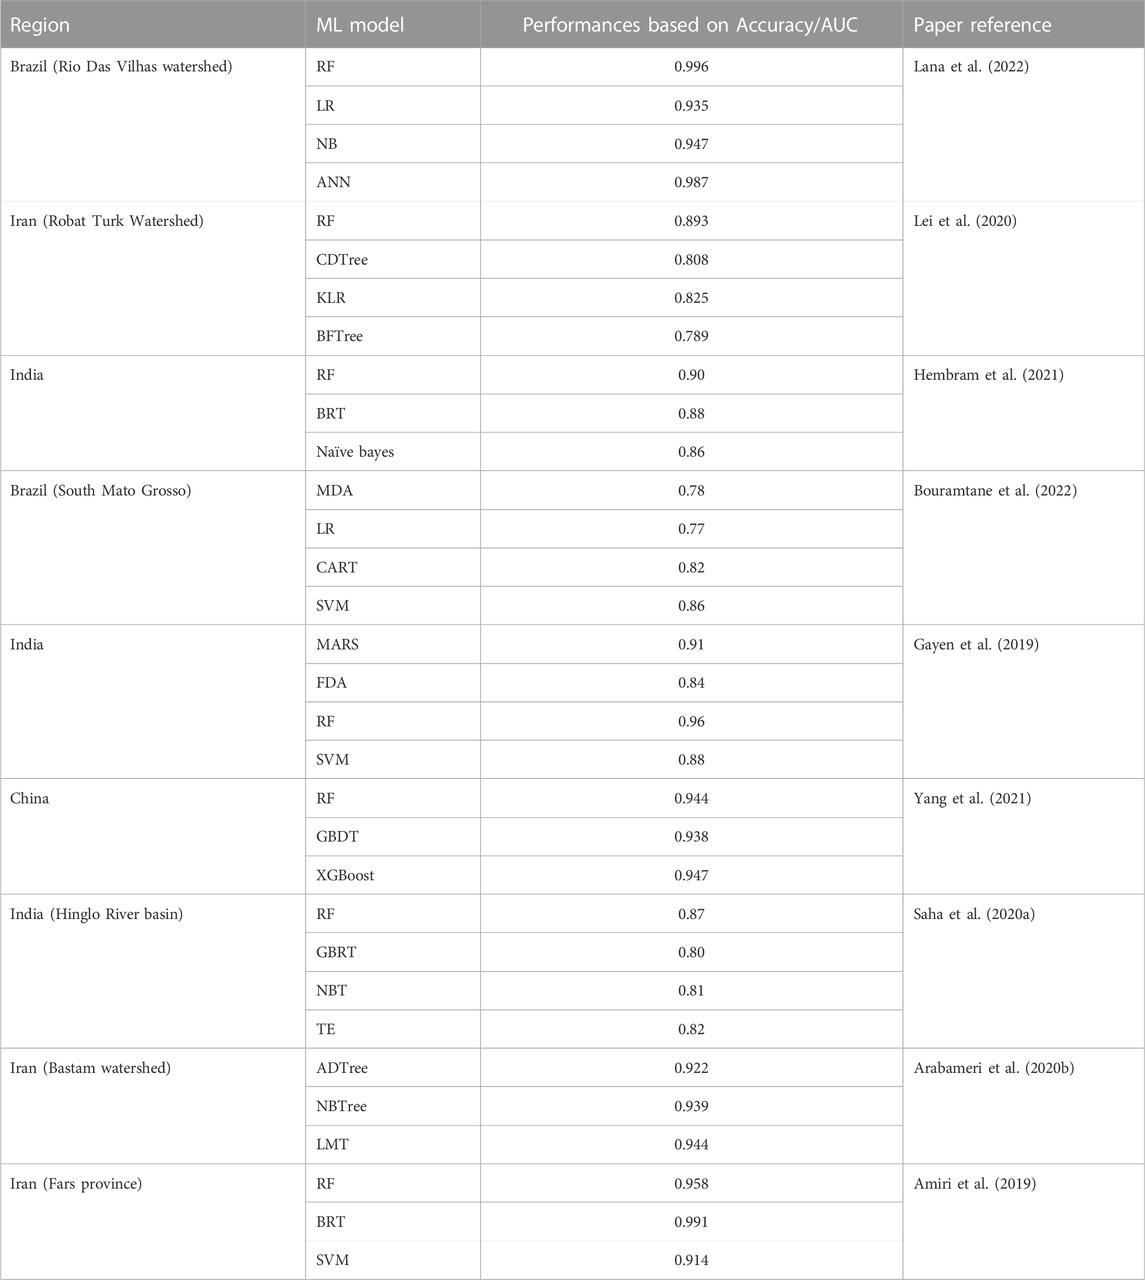
TABLE 5. Based on accuracy/AUC, the ML model’s performance on the GE mapping. Abbreviations include random forest (RF), logistic regression (LR), naive Bayes (NB), artificial neural network (ANN), best-first decision tree (BFTree), boosted regression tree (BRT), multivariate discriminant analysis (MDA), classification and regression tree (CART), gradient boosted decision trees (GBDT), extreme gradient boosting (XGBoost), multivariate additive regression splines (MARS), and flexible discriminant analysis (LMT).
Regarding the relationship between the causes of gully erosion and its occurrence, the patterns highlighted by the four models (KNN, GBM, LDA and CART) appeared geomorphologically sound and realistic. The initial contributors to the gully corresponded to morphological parameters such as elevation, slope length and the lithology parameter. The elevation varies between 151 m at the level of the Tensift River to 3,329 m at the High Atlas summits. In this Chichaoua catchment, outcrops of Cretaceous formations and Tertiary formations dominate. It is a succession of synclines, of which the one called Boabout Synclinal ends with a Cretaceous and Eocene anticline ridge (phosphate marl and limestone marl). Combined impact of the erosive power of flowing water (power index of the current) and the ability to conduct and keep this water in the designated location. Topographic humidity index determines the gullying circumstances under climate-stress conditions (rain). Knowing how to create such detailed conceptual diagrams is central to any research investigating causal relations between variables and gullies. Susceptibility maps can indicate areas where action should be taken to stop or minimize gully erosion. However, determining which system attributes should be addressed requires knowing which ones are important. Given these subsets of pertinent parameters, the prior interpretive system can be expanded to account for specific morphometric exposure under low precipitation regimes. Additionally, there is some, but sparse, vegetation. A complete lack of vegetation typically accompanies rocky outcrops with extremely low erosion rates because of the rock’s unique material characteristics. On the other hand, places with little to moderate vegetation are frequently associated with soil that is not covered by leaves or supported by roots. Our findings demonstrated that the performance of the models could provide useful data for regional planners. It is extra important to have accurate and reliable models to support decision-making because the arid to semi-arid environment in Morocco can change quite rapidly from one catchment to another, whether it be in terms of temperatures or precipitation re-gimes, or simply in the land scape arrangement. Therefore, greater model flexibility can support choosing one method over another. We added measures (Cohen’s Kappa and True Skill Statistics) that better describe the classification of positives and negatives to the standard performance assessment (area under the ROC curve). But all three measurements came to the same result. Because of this, even if we cannot generalize, the AUC alone would have been sufficient in the current situation, supporting its adoption over any other metrics in the literature (Arabameri et al., 2020a; Arabameri et al., 2020b).
An examination of the literature suggests that conditioning factors for gully erosion are area-specific and cannot be reliably extrapolated to other regions. For example, (Rahmati et al., 2016a), identified land-use as the most important factor in their study areas, wherias, (Avand et al., 2019) reported that distance from rivers is the most important factor in their studies. Furthermore, the slope factor, which we and ranked as a relatively unimportant factor, was among the most effective factors identified by Zabihi et al. (2018). These differences call for further research on controls of gully erosion in different landscapes.
There have been several studies done to estimate soil loss. In various subbasins in the Tensift basin. At the level of various sub-basins in the Tensift basin. The Chichaoua sub-basin was not among the sub-basins studied. Average annual soil losses in the Tensift watershed are 25.93, 31.09, and 44.03 t/ha/year in 1984, 2000, and 2014, respectively. In the Haouz plain and the High Atlas region of the watershed, the average annual soil losses in 2014 were 10.52 t/ha and 132.25 t/ha.
This indicates that, in contrast to the High Atlas, which is extremely fragile, the Haouz plain is only modestly exposed to soil erosion (Meliho et al., 2016; Meliho et al., 2020). Additionally, and in accordance with a thorough field survey, the regions with a lot of in situ soil loss correlate to the areas in our predicted maps with a high sensitivity to erosion.
This demonstrates the models’ great effectiveness in identifying vulnerable locations on SES maps. Identify locations in danger of soil erosion by water by creating soil erosion susceptibility (SES) maps, even if models find it difficult to discern between map errors and sensitive locations where erosion has not yet occurred. The errors, however, do not necessarily indicate that the actually eroded regions are highly or generally susceptible. They have demonstrated that these regions have the right conditions for the emergence and development of soil erosion but that this has not yet happened, suggesting that these regions may be at risk of soil erosion (Gutiérrez et al., 2009; Garosi et al., 2019).
Finally, the methodology employed in this study showed that a proper evaluation of erosion impacts could be achieved by carefully choosing efficient water-based erosion factors and employing data-based techniques. Its key flaw was that sampling and data collecting on input factors were not done simultaneously. Not all samples were taken at the same scale. Despite these limitations, the approach taken in this study, which is based on ML algorithms, may be a useful tool for predicting and mapping soil erosion in other situations. Additionally, it is crucial for decision-makers to propose appropriate strategies to prevent soil loss in the Chichaoua basin based on the results of this study.
5 Conclusion
With the development of the Internet of Things (IoT), several studies are beginning to focus on the application of ML algorithms for environmental hazard modeling. For the study area, the association between gully erosion occurrence and various environmental factors was examined. Four ML models—LDA, CART, KNN, and GLM—have been developed for mapping the vulnerability of gullies to erosion as part of this work.
This study focuses on developing a simple and cost-effective method based on the combination of data collected, remotely sensed data, and machine learning (ML) algorithms to identify areas susceptible to gully erosion in a semiarid region. To this purpose, 17 geo-environmental factors were mapped and identified as potential drivers to gully development in the study area. Four ML approaches were utilized to assess spatial susceptibility during the modeling phase. The findings reveal that all the models performed well and robustly in determining prone areas for gullies. However, although the methods have shown excellent success in this context, it is important to note that limitations may impact their performance in other contexts. Firstly, the database collected from the field must represent quality and quantity. Secondly, the causative factors may vary from one area to another, so the method must be adapted to the geo-environmental conditions of each case. Thirdly, the chosen algorithms have been optimized according to the available data, and in the case of applications in other locations, they require further optimization according to the available data. In summary The method for mapping gully erosion suggested in this work can be used in locations affected by similar environmental and human activity, such as, for example, variable rainfall, steep slopes, and weak geology units. Researchers are urged to use the four models mentioned above to address new problems and research objectives while developing new studies. Deep learning techniques may be used in gully erosion mapping from local to regional scale locations in future studies.
Finally, this study can serve as a guide for all stakeholders involved in the management and preservation of natural resources in general and soil, especially in regions where climate and human activity are exerting an increasing amount of pressure on these resources and where field data are scarce and difficult to obtain.
Data availability statement
The raw data supporting the conclusion of this article will be made available by the authors, without undue reservation.
Author contributions
The main content was written by AB, who also carried out the data analysis, prepared the figures, and validate the results with field survey. SK, KA, NB, and MN; funding acquisition, KA; resources, KA; contributed to the conceptualization and results validation. All authors contributed to the article and approved the submitted version.
Acknowledgments
Deep thanks and gratitude to the Researchers Supporting Project number (RSP2023R351), King Saud University, Riyadh, Saudi Arabia for funding this re-search article.
Conflict of interest
The authors declare that the research was conducted in the absence of any commercial or financial relationships that could be construed as a potential conflict of interest.
Publisher’s note
All claims expressed in this article are solely those of the authors and do not necessarily represent those of their affiliated organizations, or those of the publisher, the editors and the reviewers. Any product that may be evaluated in this article, or claim that may be made by its manufacturer, is not guaranteed or endorsed by the publisher.
References
Ait Naceur, H., Igmoulan, B., Namous, M., Amrhar, M., Bourouay, O., Ouayah, M., et al. (2022). A comparative study of different machine learning methods coupled with GIS for landslide susceptibility assessment: A case study of N’fis basin, marrakesh high Atlas (Morocco). Arabian J. Geosciences 15, 1100. doi:10.1007/s12517-022-10349-2
Ali, I., Greifeneder, F., Stamenkovic, J., Neumann, M., and Notarnicola, C. (2015). Review of machine learning approaches for biomass and soil moisture retrievals from remote sensing data. Remote Sens. 7, 16398–16421. doi:10.3390/rs71215841
Althuwaynee, O. F., Pradhan, B., Park, H. J., and Lee, J. H. (2013). A novel ensemble bivariate statistical evidential belief function with knowledge-based analytical hierarchy process and multivariate statistical logistic regression for landslide susceptibility mapping. Catena 114, 21–36. doi:10.1016/j.catena.2013.10.011
Amiri, M., Pourghasemi, H. R., Ghanbarian, G. A., and Afzali, S. F. (2019). Assessment of the importance of gully erosion effective FactorsUsing boruta algorithm and its spatial modeling and mapping using three machine learning algorithms. Geoderma 340, 55–69. doi:10.1016/j.geoderma.2018.12.042
Anaya-Romero, M., Abd-Elmabod, S. K., Muñoz-Rojas, M., Castellano, G., Ceacero, C. J., Alvarez, S., et al. (2005). Evaluating soil threats under climate change scenarios in the andalusia region, southern Spain. Land Degrad. Dev. 26, 441–449. doi:10.1002/ldr.2363
Arabameri, A., Pradhan, B., Rezaei, K., Yamani, M., Pourghasemi, H. R., and Lombardo, L. (2018a). Spatial modelling of gully erosion using evidential belief function, logistic regression, and a new ensemble of evidential belief function-logistic regression algorithm. Land Degrad. Dev. 29, 4035–4049. doi:10.1002/ldr.3151
Arabameri, A., Rezaei, K., Pourghasemi, H. R., Lee, S., and Yamani, M. (2018b). GIS-based gully erosion susceptibility mapping: A comparison among three data-driven models and AHP knowledge-based technique. Environ. Earth Sci. 77, 628–722. doi:10.1007/s12665-018-7808-5
Arabameri, A., Pradhan, B., and Lombardo, L. (2019a). Comparative assessment using boosted regression trees, binary logistic regression, frequency ratio and numerical risk factor for gully erosion susceptibility modelling. Catena 183, 104223. doi:10.1016/j.catena.2019.104223
Arabameri, A., Pradhan, B., and Rezaei, K. (2019b). Gully erosion zonation mapping using integrated geographically weighted regression with certainty factor and random forest models in GIS. J. Environ. Manag. GIS 232, 928–942. doi:10.1016/j.jenvman.2018.11.110
Arabameri, A., Chen, W., Loche, M., Zhao, X., Li, Y., Lombardo, L., et al. (2020a). Comparison of machine learning models for gully erosion susceptibility mapping. Geosci. Front. 11, 1609–1620. doi:10.1016/j.gsf.2019.11.009
Arabameri, A., Saha, S., Roy, J., Chen, W., Blaschke, T., and Bui, D. T. (2020b). Landslide susceptibility evaluation and management using different machine learning methods in the gallicash river watershed, Iran. Iran. Remote Sens. 12 (3), 475. doi:10.3390/rs12030475
Avand, M., Janizadeh, S., Naghibi, S. A., Pourghasemi, H. R., Khosrobeigi Bozchaloei, S., and Blaschke, T. (2019). A comparative assessment of random forest and k-nearest neighbor classifiers for gully erosion susceptibility mapping. Water 11, 2076. doi:10.3390/w11102076
Avand, M., Kuriqi, A., Khazaei, M., and Ghorbanzadehd, O. (2022). DEM resolution effects on machine learning performance for flood probability mapping. J. Hydro-environment Res. 40, 1–16. doi:10.1016/j.jher.2021.10.002
Azareh, A., Rahmati, O., Rafiei-Sardooi, E., Sankey, B. J., Lee, S., et al. (2019). Modelling gully-erosion susceptibility in a semi-arid region, Iran: Investigation of applicability of certainty factor and maximum entropy models. Sci. Total Environ. 655, 684–696. doi:10.1016/j.scitotenv.2018.11.235
Azedou, A., Lahssini, S., Khattabi, A., Meliho, M., and Rifai, N. (2021). A methodological comparison of three models for gully erosion susceptibility mapping in the rural municipality of El faid (Morocco). Sustainability 13, 682. doi:10.3390/su13020682
Bouramtane, T., Hilal, H., Rezende-Filho, A. T., Bouramtane, K., Barbiero, L., Abraham, S., et al. (2022). Mapping gully erosion variability and susceptibility using remote sensing, multivariate statistical analysis, and machine learning in south mato grosso, Brazil. Geosciences 12, 235. doi:10.3390/geosciences12060235
Chen, W., Pourghasemi, H. ,R., Kornejady, A., and Zhanga, N. (2017). Landslide spatial modeling: Introducing new ensembles of ANN, MaxEnt, and SVM machine learning techniques. Geoderma 305, 314–327. doi:10.1016/j.geoderma.2017.06.020
Chen, W., Li, H., Hou, E., Wang, S., Wang, G., Panahi, , et al. (2018). GIS-based groundwater potential analysis using novel ensemble weights-of-evidence with logistic regression and functional tree models. Sci. Total Environ. 634, 853–867. doi:10.1016/j.scitotenv.2018.04.055
Chowdhuri, I., Pal, S. C., Saha, A., Chakrabortty, R., and Roy, P. (2021). Evaluation of different DEMs for gully erosion susceptibility mapping using in-situ field measurement and validation. Ecol. Inf. 65, 101425. doi:10.1016/j.ecoinf.2021.101425
Conforti, M., Aucelli, P. P. C., Robustelli, G., and Scarciglia, F. (2011). Geomorphology and GIS analysis for mapping gully erosion susceptibility in the Turbolo stream catchment (Northern Calabria, Italy). Nat. Hazards 56, 881–898. doi:10.1007/s11069-010-9598-2
Conoscenti, C., Agnesi, V., Angileri, S., Cappadonia, C., Rotigliano, E., and Märker, M. (2013). A GIS-based approach for gully erosion susceptibility modelling: A test in sicily, Italy. Environ. Earth Sci. 70, 1179–1195. doi:10.1007/s12665-012-2205-y
Conoscenti, C., Angileri, S., Cappadonia, C., Rotigliano, E., Agnesi, V., and Märker, M. (2014). Gully erosion susceptibility assessment by means of GIS-based logistic regression: A case of sicily (Italy). Geomorphology 204, 399–411. doi:10.1016/j.geomorph.2013.08.021
Daba, S. (2003). An investigation of the physical and socioeconomic determinants of soil erosion in the Hararghe Highlands, eastern Ethiopia. Land Degrad. Dev. 14, 69–81. doi:10.1002/ldr.520
Ding, Q., Chen, W., and Hong, H. (2017). Application of frequency ratio, weights of evidence and evidential belief function models in landslide susceptibility mapping. Geocarto Int. 32, 1–21. doi:10.1080/10106049.2016.1165294
Dube, F., Nhapi, I., Murwira, A., Gumindoga, W., Goldin, J., and Mashauri, D. A. (2014). Potential of weight of evidence modelling for gully erosion hazard assessment in mbire district—Zimbabwe. J. Phys. Chem. Earth 67-69, 145–152. doi:10.1016/j.pce.2014.02.002
Elmahdy, S., Ali, T., and Mohamed, M. (2020). Flash flood susceptibility modeling and magnitude index using machine learning and geohydrological models: A modified hybrid approach. Remote Sens. 12 (17), 2695. doi:10.3390/rs12172695
Fitzjohn, C., Ternan, J. L., Williams, A. G., Perez-Gonzalez, A., and de Alba, S. (2002). Dealing with soil variability: Some insights from land degradation research in central Spain. Land Degrad. Dev. 13, 141–150. doi:10.1002/ldr.485
Frankl, A., Poesen, J., Deckers, J., Haile, M., and Nyssen, J. (2012). Gully head retreat rates in the semi-arid highlands of Northern Ethiopia. Geomorphol. (Amst). 173–174, 185–195. doi:10.1016/j.geomorph.2012.06.011
Friedman, J. H., Baskett, F., and Shustek, L. J. (1975). An algorithm for finding nearest neighbors. IEEE Trans. Comput. C-24, 1000–1006. doi:10.1109/t-c.1975.224110
Garosi, Y., Sheklabadi, M., Conoscenti, C., Pourghasemi, H. R., and Van Oost, K. (2019). Assessing the performance of gis-based machine learning models with different accuracy measures for determining susceptibility to gully erosion. Sci. Total Environ. 664, 1117–1132. doi:10.1016/j.scitotenv.2019.02.093
Gayen, A., and Pourghasemi, H. R. (2019). “Spatial modeling of gully erosion: A new ensemble of CART and GLM data-mining algorithms,” in Spatial modeling in GIS and R for earth and environmental sciences (Amsterdam: Elsevier), 653–669.
Gayen, A., and Saha, S. (2017). Application of weights-of-evidence (WoE) and evidential belief function (EBF) models for the delineation of soil erosion vulnerable zones: A study on pathro river basin, Jharkhand, India. Model. Earth Syst. Environ. 3, 1123–1139. doi:10.1007/s40808-017-0362-4
Gayen, A., Saha, S., and Pourghasemi, H. R. (2020). Soil erosion assessment using RUSLE model and its validation by FR probability model. Geocarto Int. 35, 1750–1768. doi:10.1080/10106049.2019.1581272
Gayen, A., Pourghasemi, H. R., Sahaa, S., Keesstrade, S., and Baib, Sh. (2019). Gully erosion susceptibility assessment and management of hazard-prone areas in India using different machine learning algorithms. Sci. Total Environ. 668, 124–138. doi:10.1016/j.scitotenv.2019.02.436
Ghorbanzadeh, O., Meena, S. R., Sorman Abadi, H. S., Piralilou, S. T., Lv, Z., and Blaschke, T. (2020). Landslide mapping using two main deep-learning convolution neural network streams combined by the dempster–shafer modele. IEEE J. Sel. Top. Appl. Earth Observation Remote Sens. 14, 452–463.
Gutiérrez, Á. G., Schnabel, S., and Contador, F. L. (2009). Gully erosion, land use and topographical thresholds during the last 60 years in a small rangeland catchment in SW Spain. LDD 20 (5), 535–550. doi:10.1002/ldr.931
Hembram, T. K., Saha, S., Pradhan, B., Abdul Maulud, K. N., and Alamri, A. M. (2021). Robustness analysis of machine learning classifiers in predicting spatial gully erosion susceptibility with altered training samples. Geomat. Nat. Hazards Risk 12, 794–828. doi:10.1080/19475705.2021.1890644
Hitouri, S., Varasano, A., Mohajane, M., Ijlil, S., Essahlaoui, N., Ali, S. K. A., et al. (2022). Hybrid machine learning approach for gully erosion mapping susceptibility at a watershed scale. Geo-Inf. 11, 401. doi:10.3390/ijgi11070401
Hosseinalizadeh, M., Kariminejad, N., Chen, W., Pourghasemi, H. R., Alinejad, M., Mohammadian Behbahani, A., et al. (2019). Gully headcut susceptibility modeling using functional trees, naïve Bayes tree, and random forest models. Geoderma 342, 1–11. doi:10.1016/j.geoderma.2019.01.050
Ismaili, M., Krimissa, S., Namous, M., Htitiou, A., Abdelrahman, K., Fnais, S., et al. (2023). Assessment of soil suitability using machine learning in arid and semi-arid regions. Agronomy 13 (1), 165. doi:10.3390/agronomy13010165
Jazouli, A. E., Barakat, A., Khellouk, R., Rais, J., and Baghdadi, M. E. (2019). Remote sensing and GIS techniques for prediction of land use land cover change effects on soil erosion in the high basin of the Oum Er Rbia River (Morocco). Remote Sens. Appl. Soc. Environ. 13, 361–374. doi:10.1016/j.rsase.2018.12.004
Khouz, A., Trindade, J., Oliveira, S. C., El Bchari, F., Bougadir, B., Garcia, R. A., et al. (2022). (Landslide susceptibility assessment in the rocky coast subsystem of Essaouira, Morocco. Nat. Hazards Earth Syst. Sci. 22 (11), 3793–3814. doi:10.5194/nhess-22-3793-2022
Lal, R., Hall, G. F., and Miller, F. P. (1989). Soil degradation: I. Basic processes. Land Degrad. Dev. 11, 51–69. doi:10.1002/ldr.3400010106
Lamane, H., Moussadek, R., Baghdad, B., Mouhir, L., Briak, H., Laghlimi, M., et al. (2022). Soil water erosion assessment in Morocco through modeling and fingerprinting applications: A review. Heliyon 8, e10209. doi:10.1016/j.heliyon.2022.e10209
Lana, J. C., Castro, P. D., and Lana, C. E. (2022). Assessing gully erosion susceptibility and its conditioning factors in southeastern BrazilUsing machine learning algorithms and bivariate statistical methods: A regional approach. Geomorphology 402, 108159. doi:10.1016/j.geomorph.2022.108159
Lei, X., Chen, W., Avand, M., Janizadeh, S., Kariminejad, N., Shahabi, H., et al. (2020). GIS-based machine learning algorithms for gully erosion susceptibility mapping in a semi-arid region of Iran. Remote Sens. 12, 2478. doi:10.3390/rs12152478
Lucas, B., Pelletier, C., Schmidt, D., Webb, G. I., and Petitjean, F. (2021). A Bayesian-inspired, deep learning-based, semi-supervised domain adaptation technique for land cover mapping. Berlin: Springer.
Magliulo, P. (2012). Assessing the susceptibility to water-induced soil erosion using a geomorphological, bivariate statistics-based approach. Environ. Earth Sci. 67, 1801–1820. doi:10.1007/s12665-012-1634-y
Meliho, M., Khattabi, A., Mhammdi, N., and Hongming Zhang, H. (2016). Cartographie des risques de L’erosion HydriquePar L’equation universelle revisee des pertes en sols, La teledetection et les sig dans le bassin versant de L’ourika (haut Atlas, maroc). Eur. Sci. J. 12, 32. doi:10.19044/esj.2016.v12n32p277
Meliho, M., Khattabi, A., and Mhammdi, N. (2020). Spatial assessment of soil erosion risk by integrating remote sensing and GIS techniques: A case of Tensift watershed in Morocco. Environ. Earth Sci. 79, 207. doi:10.1007/s12665-020-08955-y
Moradi, H. R., Avand, M. T., and Janizadeh, S. (2019). “Landslide susceptibility survey using modeling methods,” in Spatial modeling in gis and R for earth and environmental sciences (Amsterdam: Elsevier), 259–276.
Moore, I. D., and Burch, G. J. (1986). Physical basis of the length-slope factor in the universal soil loss equation. Soil Sci. Soc. Am. J. 50 (5), 1294–1298. doi:10.2136/sssaj1986.03615995005000050042x
Morgan, R. P. C., Quinton, J. N., Smith, R. E., Govers, G., Poesen, J. W. A., Auerswald, K., et al. (1998). The European soil erosion model (EUROSEM): A dynamic approach for predicting sediment transport from fields and small catchments. Earth Surf. Process. Landforms. 23, 527–544. doi:10.1002/(sici)1096-9837(199806)23:6<527:aid-esp868>3.0.co;2-5
Namous, M., Hssaisoune, M., Pradhan, B., WookLee, C., Alamri, A., Elaloui, A., et al. (2021). Spatial prediction of groundwater potentiality in large semi-arid and karstic mountainous region using machine learning models. Water 13 (16), 2273. doi:10.3390/w13162273
Nhu, V.-H., Janizadeh, S., Avand, M., Chen, W., Farzin, M., Omidvar, E., et al. (2020a). GIS-based gully erosion susceptibility mapping: A comparison of computational ensemble data mining models. Appl. Sci. 10, 2039. doi:10.3390/app10062039
Nhu, V. H., Shirzadi, A., Shahabi, H., Singh, S. K., Al-Ansari, N. J., Clague, J., et al. (2020b). Shallow landslide susceptibility mapping: A comparison between logistic model tree, logistic regression, naïve Bayes tree, artificial neural network, and support vector machine algorithms. Environ. Res. Public Health 17 (8), 2749. doi:10.3390/ijerph17082749
Pal, S. C., Chakrabortty, R., Arabameri, A., Santosh, M., Saha, A., Chowdhuri, I., et al. (2022). Chemical weathering and gully erosion causing land degradation in a complex river basin of eastern India: An integrated field, analytical and artificial intelligence approach. Nat. Hazards 110, 847–879. doi:10.1007/s11069-021-04971-8
Park, S., Oh, C., Jeon, S., Jung, H., and Choia, C. (2011). Soil erosion risk in Korean watersheds, assessed using the revised universal soil loss equation. J. Hydrology 399 (3–4), 263–273. doi:10.1016/j.jhydrol.2011.01.004
Peter, K. D., d’Oleire-Oltmanns, S., Ries, J. B., Marzolff, I., and Ait Hssaine, A. (2014). Soil erosion in gully catchments affected by LandLevelling measures in the Souss basin, Morocco, analysed by rainfall simulation and UAV remote sensing data. CATENA 113, 24–40. doi:10.1016/j.catena.2013.09.004
Phama, B. T., Son, L. H., Hoang, T. A., Nguyenc, D. M., and Buide, D. T. (2018). Prediction of shear strength of soft soil using machine learning methods. CATENA 166, 181–191. doi:10.1016/j.catena.2018.04.004
Phinzi, K., Holb, I., and Szabó, S. (2021). Mapping permanent gullies in an agricultural area using satellite images: Efficacy of machine learning algorithms. Agronomy 11 (2), 333. doi:10.3390/agronomy11020333
Pourghasemi, H. R., Yousefi, S., Kornejady, A., and Cerdà, A. (2017). Performance assessment of individual and ensemble data-mining techniques for gully erosion modeling. Sci. Total Environ. 609, 764–775. doi:10.1016/j.scitotenv.2017.07.198
Rahman, S. A. Z., Chandra Mitra, K., and Mohidul Islam, S. M. “Soil classification using machine learning methods and crop suggestion based on soil series,” in Presented at the 2018 21st International Conference of Computer and Information Technology (ICCIT), Dhaka, December 21-23, 2018, 1–4.
Rahmati, O., Haghizadeh, A., Pourghasemi, H. R., and Noormohamadi, F. (2016a). Gully erosion susceptibility mapping the role of GIS-based bivariate statistical models and their comparison. Nat. Hazards 82, 1231–1258. doi:10.1007/s11069-016-2239-7
Rahmati, O., Pourghasemi, H. R., and Zeinivand, H. (2016b). Flood susceptibility mapping using frequency ratio and weights-of-evidence models in the Golastan province, Iran. Geocarto Int. 31, 42–70. doi:10.1080/10106049.2015.1041559
Rahmati, O., Tahmasebipour, N., Haghizadeh, A., Pourghasemi, H. R., and Feizizadeh, B. (2017). Evaluation of different machine learning models for predicting and mapping the susceptibility of gully erosion. Geomorphology 298, 118–137. doi:10.1016/j.geomorph.2017.09.006
Roose, E. (1977). Adaptation des méthodes de conservation des sols aux conditions écologiques et socio-économiques de l'Afrique de l'Ouest. Agron. Trop. 32 (2), 132–140.
Roy, J., and Saha, S. (2018). Assessment of land suitability for the paddy cultivation using analytical hierarchical process (AHP): A study on hinglo river basin, eastern India. Earth Syst. Environ. 4, 601–618. doi:10.1007/s40808-018-0467-4
Roy, P., Chakrabortty, R., Chowdhuri, I., Malik, S., Das, B., and Pal, S. C. (2020). “Development of different machine learning ensemble classifier for gully erosion susceptibility in gandheswari watershed of West Bengal, India,” in Machine learning for intelligent decision science (Singapore: Springer), 1–26.
Roy, P., Pal, S. C., Janizadeh, S., Chakrabortty, R., Islam, A. R. M. T., Chowdhuri, I., et al. (2022). Evaluation of climate change impacts on future gully erosion using deep learning and soft computational approaches. Geocarto Int. 37, 12709–12745. doi:10.1080/10106049.2022.2071473
Ruidas, D., Chakrabortty, R., Islam, A. R. M. T., Saha, A., and Pal, S. C. (2022a). A novel hybrid of meta-optimization approach for flash flood-susceptibility assessment in a monsoon-dominated watershed, Eastern India. Environ. Earth Sci. 81 (5), 145. doi:10.1007/s12665-022-10269-0
Ruidas, D., Pal, S. C., Saha, A., Chowdhuri, I., and Shit, M. (2022b). Hydrogeochemical characterization based water resources vulnerability assessment in India's first Ramsar site of Chilka lake. Mar. Pollut. Bull. 184, 114107. doi:10.1016/j.marpolbul.2022.114107
Saha, A., Ghosh, M., and Pal, S. C. (2020a). “Understanding the morphology and development of a rill-gully: An empirical study of khoai badland, West Bengal, India,” in Gully erosion studies from India and surrounding regions (Cham: Springer), 147–161.
Saha, S., Roy, J., Arabameri, A., Blaschke, T., and Tien Bui, D. (2020b). Machine learning-based gully erosion susceptibility mapping: A case study of eastern India. Sensors 20, 1313. doi:10.3390/s20051313
Shahabi, H., Shirzadi, A., Ghaderi, K., Omidvar, E., Al-Ansari, N., Clague, J., et al. (2020). Flood detection and susceptibility mapping using sentinel-1 remote sensing data and a machine learning approach: Hybrid intelligence of bagging ensemble based on K-nearest neighbor classifier. Remote Sens. 12 (2), 266. doi:10.3390/rs12020266
Simonneaux, V., Cheggour, A., Deschamps, C., Mouillot, F., Cerdan, O., and Le Bissonnais, Y. (2015). Land use and climate change effects on soil erosion in a semi-arid mountainous watershed (high Atlas, Morocco). J. Arid. Environ. 122, 64–75. doi:10.1016/j.jaridenv.2015.06.002
Smith, H. J. (1999). Application of empirical soil loss models in southern Africa: A review. South Afr. J. Plant Soil 16, 158–163. doi:10.1080/02571862.1999.10635003
Stone, M. (1974). Cross-validatory choice and assessment of statistical predictions. J. R. Stat. Soc. Ser. A General. 36 (2), 111–133. doi:10.1111/j.2517-6161.1974.tb00994.x
Tairi, A., Elmouden, A., Bouchaou, L., and Aboulouafa, M. (2021). Mapping soil erosion–prone sites through GIS and remote sensing for the Tifnout askaoun watershed, southern Morocco. Arab. J. Geosci. 14, 811. doi:10.1007/s12517-021-07009-2
Talukdar, S., Singha, P., Mahato, S., Shahfahad, , Pal., S., Liou, Y. A., et al. (2020). Land-use land-cover classification by machine learning classifiers for satellite observations—a review. Remote Sens. 12 (7), 1135. doi:10.3390/rs12071135
Tien Bui, D., Shirzadi, A., Shahabi, H., Chapi, K., Omidavr, E., Pham, B. T., et al. (2019). A novel ensemble artificial intelligence approach for gully erosion mapping in a semi-arid watershed (Iran). Sensors 19, 2444. doi:10.3390/s19112444
Wade, J. C., and Heady, E. O. (1978). Measurement of sediment control impacts on agriculture. Water Resour. Res. 14, 1–8. doi:10.1029/wr014i001p00001
Wang, Z., Hong, T., and Piette, M. A. (2020). Building thermal load prediction through shallow machine learning and deep learning. Appl. Energy 263, 114683. doi:10.1016/j.apenergy.2020.114683
Watson, G. L., Telesca, D., Reid, C. E., Pfister, G. G., and Jerrett, M. (2019). Machine learning models accurately predict ozone exposure during wildfire events. Environ. Pollut. 254, 112792. doi:10.1016/j.envpol.2019.06.088
Yang, A., Wang, C., Pang, G., Long, Y., Wang, L., Cruse, R. M., et al. (2021). Gully erosion susceptibility mapping in highly complex terrain using machine learning models. ISPRS Int. J. Geo-Inf. 10, 680. doi:10.3390/ijgi10100680
Yousefi, S., Pourghasemi, H. R., Emami, S. N., Pouyan, S., Eskandari, S., and Tiefenbacher, J. P. (2020). A machine learning framework for multi-hazards modeling and mapping in a mountainous area. Sci. Rep. 10, 12144. doi:10.1038/s41598-020-69233-2
Youssef, A. M., and Pourghasemi, H. R. (2021). Landslide susceptibility mapping using machine learning algorithms and comparison of their performance at Abha Basin, Asir Region, Saudi Arabia. Saudi Arab. Geosci. Front. 12 (2), 639–655. doi:10.1016/j.gsf.2020.05.010
Yunkai, L., Yingjie, T., Zhiyun, O., Lingyan, W., Tingwu, X., Peiling, Y., et al. (2010). Analysis of soil erosion characteristics in small watersheds with particle swarm optimization, support vector machine, and artificial neuronal networks. Environ. Earth Sci. 60, 1559–1568. doi:10.1007/s12665-009-0292-1
Zabihi, M., Zabihi, F., Mirchoolia, A., Motevallia, A., Khaledi, A., Pourghasemib, H. R., et al. (2018). Spatial modelling of gully erosion in Mazandaran Province, northern Iran. Catena 161, 1–13. doi:10.1016/j.catena.2017.10.010
Zabihi, M., Pourghasemi, H. R., Motevalli, A., and Zakeri, M. A. (2019). “Gully erosion modeling using GIS-based data mining techniques in northern Iran: A comparison between boosted regression tree and multivariate adaptive regression spline,” in Natural hazards GIS-based spatial modeling using data mining techniques (Cham, Switzerland: Springer), 1–26.
Keywords: soil erosion, spatial prediction, vulnerability assessment, ML performance, semiarid area
Citation: Baiddah A, Krimissa S, Hajji S, Ismaili M, Abdelrahman K, El Bouzekraoui M, Eloudi H, Elaloui A, Khouz A, Badreldin N and Namous M (2023) Head-cut gully erosion susceptibility mapping in semi-arid region using machine learning methods: insight from the high atlas, Morocco. Front. Earth Sci. 11:1184038. doi: 10.3389/feart.2023.1184038
Received: 15 March 2023; Accepted: 15 May 2023;
Published: 30 May 2023.
Edited by:
Juergen Pilz, University of Klagenfurt, AustriaReviewed by:
Subodh Chandra Pal, University of Burdwan, IndiaHiman Shahabi, University of Kurdistan, Iran
Copyright © 2023 Baiddah, Krimissa, Hajji, Ismaili, Abdelrahman, El Bouzekraoui, Eloudi, Elaloui, Khouz, Badreldin and Namous. This is an open-access article distributed under the terms of the Creative Commons Attribution License (CC BY). The use, distribution or reproduction in other forums is permitted, provided the original author(s) and the copyright owner(s) are credited and that the original publication in this journal is cited, in accordance with accepted academic practice. No use, distribution or reproduction is permitted which does not comply with these terms.
*Correspondence: Mustapha Namous, bXVzdGFwaGEubmFtb3VzQHVzbXMubWE=