 Davide Mazza1
 Luigi Parente2*
 Daniele Cifaldi1
 Agostino Meo1
 Maria Rosaria Senatore1
 Francesco Maria Guadagno1
 Paola Revellino1
- 1Department of Science and Technology, University of Sannio, Benevento, Italy
- 2Department of Engineering “Enzo Ferrari”, University of Modena and Reggio Emilia, Modena, Italy
Recent technological advances are leading numerous researchers and professional users to the adoption of photogrammetric products for a wide range of geoscientific applications. Especially, drone-based Structure-from-Motion (SfM) photogrammetry is often applied as a high-resolution topographic modelling technique with advantages in terms of time and cost when compared to traditional surveying approaches. The aim of this work, carried out within the GeoArchaeo Sites Project, is to investigate the adaptability of drone-based surveys, even with a targetless approach, and to estimate bathymetrical accuracies in shallow waters. The approach was applied on an underwater site to show the potential for the digitalization and monitoring of an archaeological coastal geosystem in central Italy. Specifically, this work has compared the photogrammetric surveying capability of two drones including a Phantom 4 RTK (‘P4RTK’) and a low-cost Mavic Mini 2 (‘MM2’) and an Olympus TG-6 (underwater camera) for a site submerged with a maximum depth of ∼1.6 m. The assessment of the drone SfM-based products was performed through area-based and point-wise comparisons. Specifically, the area-based were assessed through an underwater photogrammetric survey obtained by acquiring images by an operator snorkeling along a portion of the site of interest. The point-wise comparison was performed using data acquired with a Global Navigation Satellite System (GNSS). This study demonstrates that coupling SfM-photogrammetry and UAS-based surveys have potential to define submerged topography. In particular, the imagery acquired with the P4RTK survey can produce dense 3D models of the underwater surface with high resolution (about 0.02 m) and bathymetric measurements with a vertical accuracy ranging between 0.06 and 0.29 m for the area-based and point-wise analysis, respectively. Thus, the approach adopted and tested involving the use of a P4RTK has the potential to reduce constraints and limitations in terms of GCPs distribution and measurement. Also, with such an approach the need for qualified operators for underwater photogrammetric workflow can be avoided.
1 Introduction
In recent years the adoption of area-based surveying techniques (such as Terrestrial Laser Scanner ‘TLS’ and Unmanned Aircraft Systems ‘UAS’ based photogrammetric technology) is increasing when compared to classical point-wise approaches such as Global Navigation Satellite System (GNSS) and Total Station-based surveys (e.g., Guerriero et al., 2019; Mazza et al., 2023). Furthermore, photogrammetry can be considered as a low-cost solution for many topographic applications even when working in difficult conditions such as in a submerged environment (Capra et al., 2015).
Photo-based investigation of the underwater environment has the advantage of leaving the benthos intact and causing minimal environmental disturbance. However, the interpretation of the merely photographic datasets is subjective and is not convenient when quantitative information is required. The photogrammetric Structure-from-Motion (SfM) technique, is a well-known non-destructive surveying techniques that is being increasingly used for underwater applications (Drap, 2012; Figueira et al., 2015; Capra et al., 2017; Mandlburger, 2019). The high accuracy achievable is pushing forward the research community to investigate such techniques for metric investigation of underwater objects. Dealing with large areas can be difficult and time consuming when adopting classical diver/snorkeler-based investigations (Llewellyn and Bainbridge, 2015). In shallow water environments, a quick and low-cost solution may be represented by the use of UAS. In the last years, several authors have used UAS-based SfM photogrammetry to derive both the three-dimensional underwater bedforms and bathymetric data. (Woodget et al., 2015; Casella et al., 2017; Dietrich, 2017; Mulsow et al., 2018; Agrafiotis et al., 2019). Although this technique has demonstrated to be a flexible and cost-effective solution for creating high resolution and accuracy topo-bathymetric datasets, the distribution of Ground Control Points (GCPs) in proximity of the area of interest remains a fundamental and time-consuming step to create accurate photogrammetric models (Westoby et al., 2012; Smith et al., 2016).
Currently, the use of UAS equipped with an onboard global navigation satellite system–real-time kinematic (GNSS–RTK) receiver is increasingly widespread (Štroner et al., 2020). This equipment allows overcoming GCPs installation and measurement and could represent an even more efficient solution also for underwater photogrammetric reconstruction. To the best of authors’ knowledge, works experimenting with this technique for bathymetry mapping are missing in the current scientific literature. Thereby, the aim of this work is to investigate a) the adaptability of RTK drone-based surveys to define topo-bathymetric information in shallow waters and b) assess the differences with a standard GCPs-based approach. Also, this study compares the photogrammetric surveying capability of two drones including a Phantom 4 RTK (‘P4RTK’) and a low-cost Mavic Mini 2 (‘MM2’) and an Olympus TG-6 (underwater camera). The approaches were applied on an archaeological underwater site (with a maximum depth of ∼1.6 m) situated in central Italy. The UAS SfM-based products were assessed through a) an area-based comparisons with the underwater photogrammetric survey and b) a point-based comparisons with the GNSS topographic survey.
2 Study area
The area where the photogrammetric survey was carried out is the roman fish tank of ‘Punta della Vipera’ (42° 02′ 55″ N; 11° 49′ 10″ E) which is located along the Tyrrhenian coast (Lazio Region, Central Italy) (Figure 1A), close to the village of Santa Marinella, and the ruins of the Castrum Novum Roman villa. The site, probably used for breeding fish or for farming mollusks (Evelpidou et al., 2012), is one of the sites of interest selected within the GeoArchaeo Sites (GAS) Project. Roman fish tanks or piscinae were built mainly along the Tyrrhenian coast of the Italian peninsula close to Roman villas (Schmiedt, 1972; Anzidei et al., 2014; Lambeck et al., 2018).
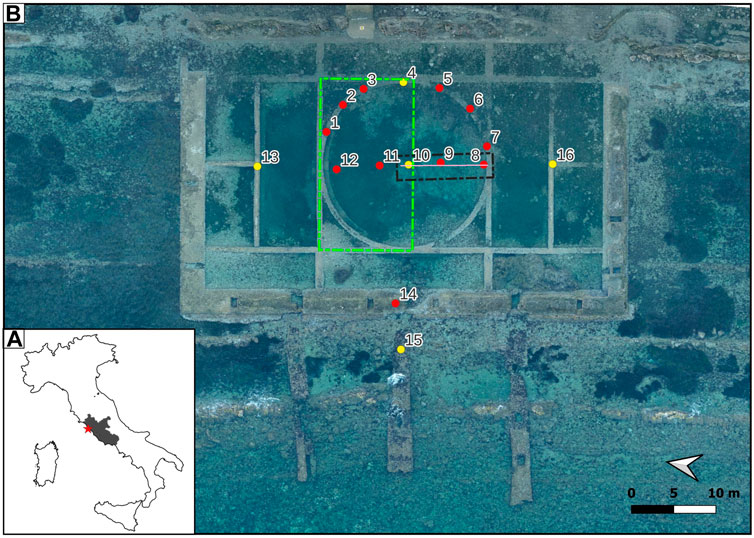
FIGURE 1. (A) Location of the study area on the Italian Tyrrhenian coast. (B) Orthophoto of the Punta della Vipera fish tank. The red and yellow dots show the distribution of the CPs and GCPs, respectively. The green rectangle and black rectangles point out the area of interests for UAS-based (AoI1) and underwater-based (AoI2) surveys, respectively. The pink line (between target 8 and 10) represents the cross-section from which the topo-bathymetric profiles were extracted. Note: the coastline is situated East (top of the figure).
The Punta della Vipera tank has a rectangular shape and is subdivided in multiple sectors. The centre is characterized by a large circular pool with a diameter of about 60 m; in this sector the depth ranges between 0.2 and 1.6 m. The tank is boarded on three sides by quay-like structures which protect it from the waves (Figure 1B). Three hollows, located on the bordering wall parallel to the coast, allow the seawater inlet (Caballero et al., 2020). The foundation of the Punta Vipera fish tank have the peculiarity to lie down on the lithoid outcropping layers of the “Pietraforte-Argilliti” formation belonging to the Meso-Cenozoic sequence (Civitelli and Corda, 1993).
3 Materials and methods
3.1 Surveying campaign
The surveying campaign was performed in 2 days (31st July - 1 August 2022) on the Punta della Vipera’s shore. Meteorological conditions were stable during the whole surveying campaign (e.g., clear sky, weak wind and calm sea) simplifying the on-site operations.
In agreement with the purpose of this work, a total of three different data collection approaches were adopted including the use of UAS, an underwater camera (snorkeler-based) and a GNSS receiver. A brief summary of the surveying campaign including number and types of techniques used is presented in Table 1.
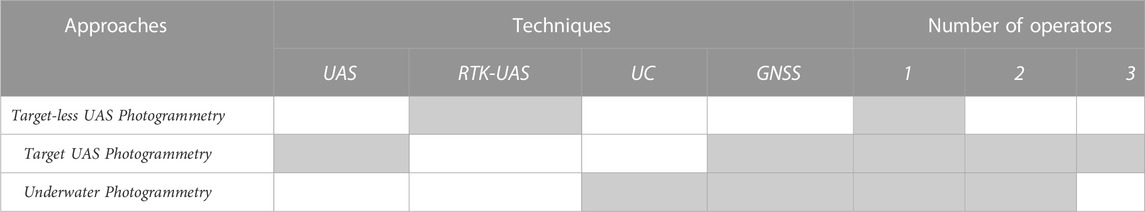
TABLE 1. Techniques and number of operators employed for each survey. UAS: Unmanned Aircraft Systems. RTK: Real Time Kinematic. UC: Underwater Camera. GNSS: Global Navigation Satellite System.
During the first day, a brief inspection of the coastal area and the old Romanian fish tank was conducted to plan the optimal strategy to acquire robust datasets with respect to the access points to the site and the local morphological context. Also, two main Area of Interests (AoIs) with different scales were defined (Figure 1B) to properly conduct the UAS and snorkeler-based surveys.
On the second day, the fieldwork started at approximately 5.30 a.m. to reduce external constraints (e.g., presence of bathers and boats) and to maintain stable conditions of temperature, humidity, and reduced phenomenon due to wind and wave motion.
3.2 UAS surveys
According to the scope of this paper, two UAS models were selected for the survey: a DJI Phantom 4 RTK (P4RTK) and a DJI Mavic Mini 2 (MM2). Their main specs have been summarised in Table 2.
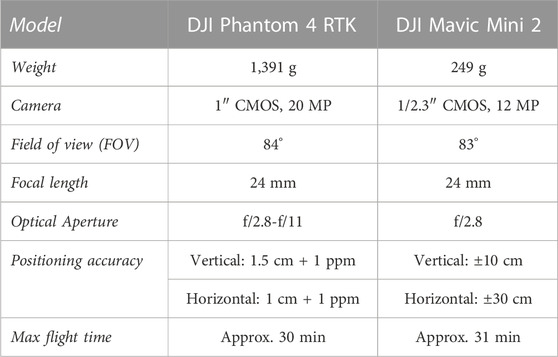
TABLE 2. UAS’s technical specifications (1 ppm indicates error with a 1 mm increase over 1 km of movement).
The total area photographed by the two UAS covered a surface of about 5,600 m2. The flying height was set to 25 m for the P4RTK and to 20 m for the MM2. With regard to the P4RTK, an operator performed the automated flights pre-planned in DJI GS Pro in about 6 min. The flight plan was set for the acquisition of nadiral images (drone’s camera with 90° angle to horizon). The Phantom shoots a total of 250 pictures, using the “timed shooting” mode and values of 70% of horizontal overlapping and 80% of vertical overlapping.
A second operator was in charge for the MM2 survey that was performed as a single manual flight, trying to recreate as much as possible the same conditions used for the Phantom’s flights. For the MM2 survey, the flight lasted about 10 min and was carried out taking nadiral images of the studied area.
The P4RTK and MM2 took off at the same time (starting at 6 a.m.) to acquire images with the same light and tide conditions. Also, the height variation allowed to capture images with a similar Ground Sample Distance (GSD) of approximately 7mm/pixel (Table 5).
For the Phantom 4 RTK drone, the acquisitions were carried out adopting the in-built RTK georeferencing technique. In particular, for the RTK georeferencing system, a D-RTK 2 high precision GNSS mobile station was used, mounted on a tripod support to guarantee stability during the acquisitions. The main specs have been reported in Table 3.
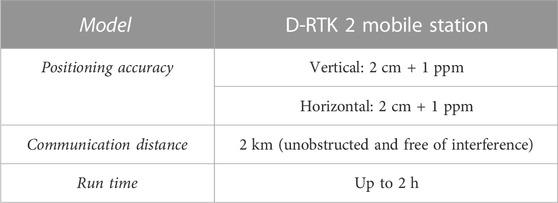
TABLE 3. D-RTK 2 mobile station’s specifications (ppm: for every 1 km increase in distance, the accuracy will be 1 mm less. For example, the horizontal accuracy is 1.1 when the receiving end is 1 km away from the base station).
3.3 Snorkeling survey and camera calibration
The underwater dataset was acquired subsequently the UAV-based surveys. An expert snorkeling operator performed the acquisition following different geometry schemas to include nadir and oblique images. The acquisition was conducted for a portion of the fish tank (indicated as “AoI2” in Figure 1B) partially interested by the presence of aquatic plants. The approximate dimensions of AoI2 are 12x3 m with depths varying from 0.90 to 1.6 m.
A total of 5 targets (targets ID: 8, 9, 10, 11, 12) were included as part of the underwater acquisition (see Figure 1B). These targets were considered as GCPs for georeferencing purposes as explained in Section 3.4.
An Olympus Tough TG-6 digital camera (see main camera specs in Table 4) was employed because of its technical characteristics, affordability and portability when compared to the use of higher performance Digital Single Lens Reflex (DSLR) enclosed in costly underwater housing. The TG-6 can operate until a maximum depth of 15 m and the absence of protective housing has a positive impact in terms of photogrammetric outputs because image residuals systematic patterns produced by housing ports are reduced (Menna et al., 2020). Another main advantage of using the TG-6 consists in the on-the-fly radiometric adjustment performed during underwater acquisition that reduce chromatic aberration avoiding the need for image enhancement procedure (Calantropio et al., 2021).

TABLE 4. Main technical specifications of the Olympus TG-6 camera.
Since the reduced effects of refractive phenomena (absence of a housing port) and the adoption of proper photos acquisition protocols, a standard self-calibration approach can be considered. However, for our specific study context, because of the presence of moving objects in the scene (e.g., aquatic plants under current and swell conditions), the research team opted for an in situ calibration of the Olympus. An in situ camera calibration can cope with high variability of operating conditions (Depth, temperature, salinity, illumination, refraction of optical beams) when working in underwater environments (Capra et al., 2017). For this reason, an underwater calibration pattern (Figure 2) was built using a rigid plastic panel with 0.90x1.00 m. At the end of the snorkeling survey, the calibration panel was submerged at the study site to acquire multiple images from varied orientations. The acquired images of the calibration pattern were processed using Agisoft Lens, a tool that models the internal orientation parameters of the camera. This procedure is a well-known approach adopted to prevent systematic bias in SfM-derived products (Kasprak et al., 2015; Rende et al., 2022).
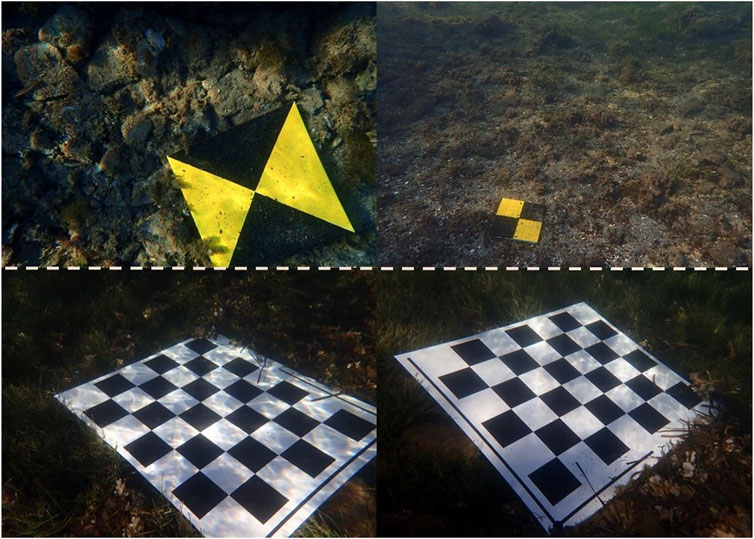
FIGURE 2. An example of the photos acquired during the snorkel-based survey. The top photos include two GCPs at different depths. The two bottom photos depict the conditions during acquisition of the calibration panel.
3.4 GCPs and topographic survey
Due to the difficulty to identify natural stable points under the sea level, a total of 16 artificial targets were built and distributed on the study site (Figure 1B). The targets 1, 2, 3, 5, 6, 7, 8, 9, 11, 12, 14 were used as CheckPoints (CPs).
The elaboration of the dense clouds was performed using different georeferencing techniques. The MM2 was tied up using 5 GCPs: the number 4, 10, 13, 15, 16. The P4RTK was georeferenced both using the same 5 GCPs previously mentioned and using the RTK technique (indicated as ‘targetless approach’).
For these purposes, a total of 16 squared tiles were painted. In particular, for the easiest underwater identification, a yellow and black triangles texture was created (Figure 2). These targets were distributed on the investigated area ensuring a stable and fixed position for the whole surveying campaign. Then, the targets’ coordinates were measured using a GNSS receiver mounted on a 2 m high pole. The receiver used is a “TopCon HIPER SR”, controlled by the FC-5000 tablet. In Table 5, the main specs of the GNSS receiver have been reported.
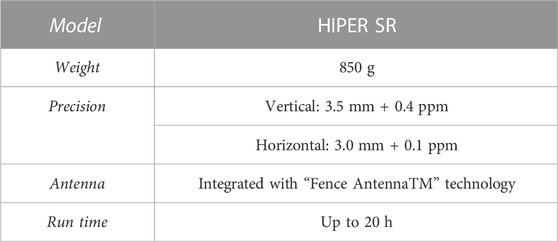
TABLE 5. GNSS receiver’s specifications.
The estimation of the target’s coordinates was conducted by two operators. An operator was in charge of diving to ensure the correct positioning of the lower end of the pole on the centre of the tiles’ triangles. The measurements were carried out through a local area correction acquiring a total of 10 epochs for each target.
3.5 Data processing and comparisons
Following field data collection (UAS-based image acquisitions and GNSS measurements) the well-established photogrammetric SfM-MVS workflow was performed. The imagery acquired at the study site was processed using Agisoft Metashape Professional (version 1.7.4—Windows 64 bit), a commercial SfM-photogrammetry package commonly used by the research community for a range of study contexts (Rossi et al., 2017; Moyano et al., 2020; Vecchi et al., 2021). This photogrammetric package allows to generate a range of digital outputs (e.g., dense point cloud, rasterized DTMs, orthomosaics, etc.) starting from the photographic datasets collected in the field. A summary of the photogrammetric datasets collected for this study is reported in Table 6.
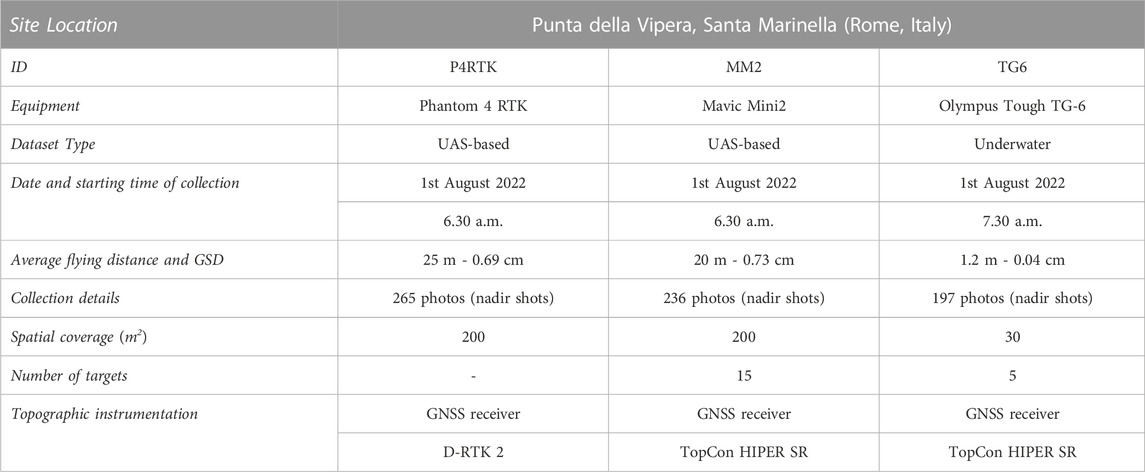
TABLE 6. Data collection information.
For each photogrammetric datasets the workflow and the parameters adopted were uniformized to reduce differences in the final outputs dependent on the operator. Specifically, key steps adopted in Metashape included image import, image alignment (identification of common points and generation of a sparse point cloud), georeferencing (using measured positions of the GCPs), optimization of image alignment (refinement of camera lens model and diminishment of geometric distortion) and generation of a higher density point cloud (with accurate scene geometry and RGB texture). The P4RTK dataset was re-processed with a slight variation of the previously described workflow (indicated as a ‘targetless approach’). Specifically, the GCPs were not considered for georeferencing purposes. The corrected camera position of each photo was considered instead.
It is worth noting that the P4RTK imagery has ellipsoidal elevation values. For this reason, the conversion to the geodetic elevation has been performed through the ConveRgo software using the ITALGEO-2005 grids (Barzaghi et al., 2007) distributed by Istituto Geografico Militare (IGM).
The Metashape package offers tools to manually filter out noise and automatically remove points with poor confidence. Specifically, the “filter by confidence” tool was adopted which allows to edit the dense point cloud achieving higher reconstruction accuracy and to create two well defined AoIs. Furthermore, the tool cross-section was used to create topo-bathymetrical profiles (see Figure 5).
Considering that the aim of this work is to assess the accuracy of drone-based surveys to estimate topo-bathimetrical measurements in shallow waters, a common methodology when dealing with point clouds is the comparison with a ground truth dataset. Towards this end, the outputs generated with the SfM-photogrammetry process listed in Table 6, were imported in CloudCompare (version 2.12.4—Windows 64 bit), a 3D modelling and processing software that include state-of-the-art algorithms for point cloud comparisons (Girardeau-Montaut, 2022). Specifically, CloudCompare was used to assess quantitatively the accuracy of the photogrammetric results obtained with the UAS-based approach when compared to the underwater outputs and checkpoints measured with the GNSS receiver (both considered as the ground truth datasets). A summary of the comparisons carried out is presented in Table 6. In particular, the UAS-derived measurements were compared with the underwater point clouds and the GNSS measurements, thus performing an area-based and a point-based approach. Such comparison was carried out using an established algorithm, namely, ‘Multiscale Model to Model Cloud Comparison’ (M3C2 - plugin available in CloudCompare) (Lague et al., 2013). The M3C2 algorithm is a popular comparison tool when comparing point clouds (Parente et al., 2019; 2021) as it generates statistics describing the 3D differences and is not influenced by different point density. Again, in order to minimize the operator input in the estimated M3C2 differences, the same parameters have been used for each comparison. Additionally, the topo-bathymetrical differences between the UAS 3D datasets and the ground truth was qualitatively assessed by comparing cross-section profiles. Results of such comparisons are presented and evaluated in the next section.
4 Results
The UAS-based datasets were regularly processed adopting the photogrammetric workflow available in Metashape. The photogrammetric processing allowed to generate three dense point clouds of the site using both, P4RTK and MM2 datasets. These UAS-based photogrammetric outputs represent key data for bathymetrical products generation such as DEMs (an example is shown in Figure 3).
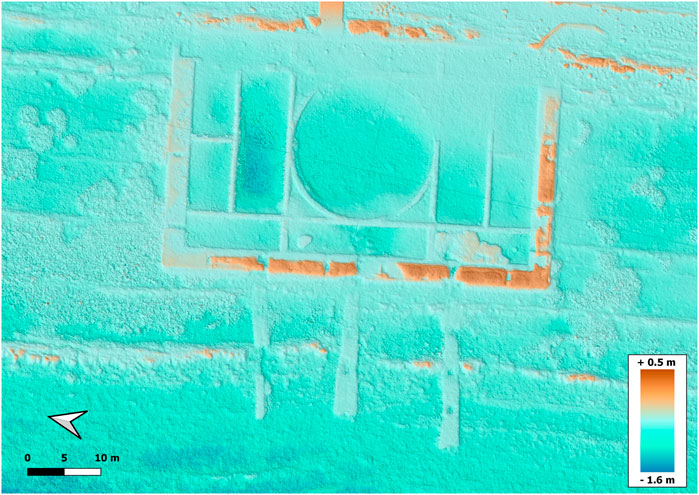
FIGURE 3. Bathymetry of the study site: DEM obtained from the P4RTK dataset.
The P4RTK dataset processed using a target and a target-less base approach produced similar 3D reconstructions. In Figure 4 are illustrated the main differences observed when comparing the P4RTK (target-based approach) and the MM2-based reconstructions. Such differences consist in the point cloud coverage (the P4RTK reconstruction is more homogenous, in fact fewer non-reconstructed areas are observed when compared to the MM2 counterpart), the average point density and their resolution. Considering common AoI1 of 10 x 20 m (Figure 1) the two dense point cloud have an average resolution of about 0.02 and 0.01 m and a total amount of about 12 and 22 million points for the P4RTK and MM2, respectively. For both UAS models, poorest reconstructions (qualitative observation in terms of decreased point density) are observed in correspondence to portions of the site characterised by the presence of aquatic plants on the bottom of the seafloor. However, the P4RTK survey appears to ensure major uniformity of the reconstruction. The chromatic differences observable in Figure 4 are solely due to different camera settings but have no influence on the metricity of the generated outputs.
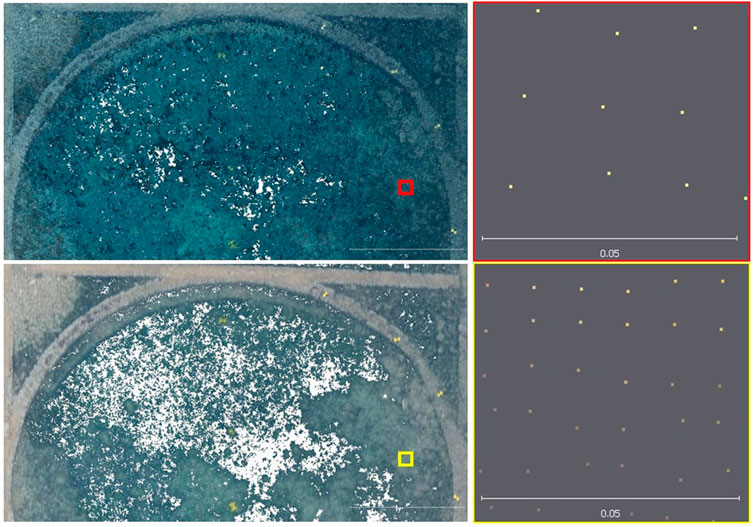
FIGURE 4. An example of the photogrammetric dense point clouds (in terms of spatial coverage and points resolution) generated with the P4RTK (top) and MM2 (bottom) UAS. The red and yellow squares indicate the common portion of point cloud considered to assess the points coverage.
During the TG6-based photogrammetric processing, 95 photos out of 197 collected were misaligned because of the presence of dynamic objects (e.g., moving plants and suspended sediment) covering the photographed underwater surface. As a consequence, the vegetated portion of the site was not properly reconstructed (area of missing points and noise). For this reason, the TG6-based point cloud was cropped to only consider the portion of the site regularly reconstructed (indicated as AoI2). Considering AoI2, the SfM-MSV workflow generated an underwater point cloud with very high resolution (about 37 million points). For the same AoI the UAS-based reconstructions produced point clouds with about 284 and 428 thousand for the P4RTK and MM2, respectively.
For qualitative comparison purposes, Figure 5 shows an alternative visual representation of the three UAS-based SfM photogrammetric models together with the ground-truth (TG-6 reconstruction). Specifically, the figure displays multiple topo-bathymetrical profiles, generated from a common cross-section (indicated in Figure 1) that traverses the center of the AoI2, including the presence of three targets and the natural condition of the sea-floor. As expected, each profile has a different level of smoothness caused by the different point density of the source point cloud. However, the general trends of the four profiles are comparable, moving upward from left to right. Considering the P4RTK (target approach) and MM2 profiles, the overestimation of the bathymetrical values tends to increase with higher depth. On the contrary, the 2D representation clearly shows that even for higher depth the P4RTK targetless approach tends to be closer to the ground-truth.
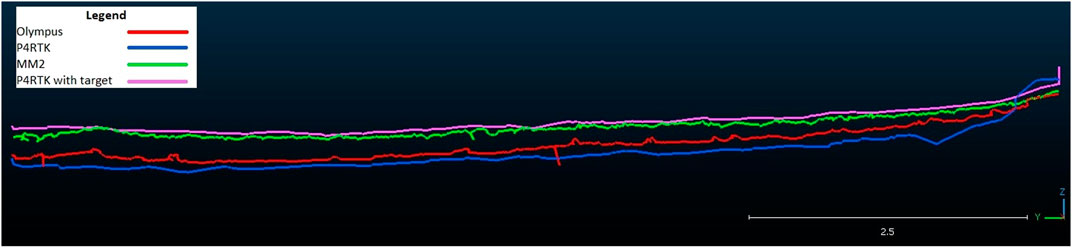
FIGURE 5. Cross sections–Differences between four topo-bathymetrical profiles (one for each photogrammetric reconstruction generated for AoI2). Note: scale bar unit is set to meters.
For a further investigation of the above-described behavior, area-based comparisons were generated using the M3C2 computation algorithm available in CloudCompare. For the UAS-RTK targetless approach the average M3C2 distance between the drone point cloud and the equivalent points in the TG6 cloud, averages to −0.060 m with a standard deviation of 0.101 m.
When adopting the standard photogrammetric surveying approach (adoption of well distributed GCPs), the UAS-based reconstructions returned lower accuracies in terms of differences to the ground-truth. Specifically, the differences between the P4RTK and the TG6 point cloud are in the order of 0.250 m (st.dev. = 0.082 m). Considering the MM2 3D model, the difference with the ground-truth averages at 0.179 m and has a standard deviation of 0.079 m.
For an initial interpretation of the measures of positioning accuracy, analysing the results in Figure 6 the vertical error of the three UAS-based approaches ranges between 0.001 and 0.453 m. As shown in Figure 6 the target-less approach achieves the highest errors when compared to the other approaches. Also, for the two targets-based approaches errors appear to increase with higher depths (from targets 9–12). This behavior is not observed for the targetless approach where the lower errors are estimated for the deeper targets.
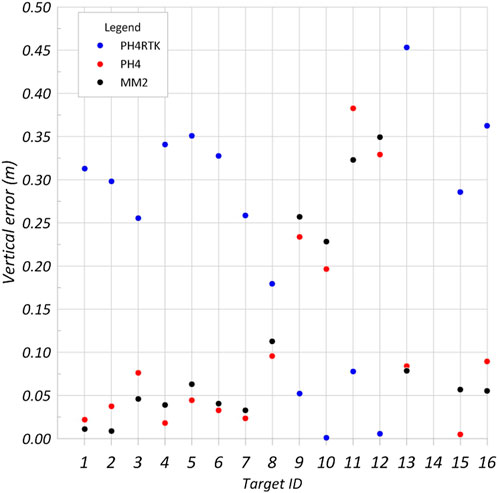
FIGURE 6. Photogrammetric UAS-based vertical error estimated for each underwater target surveyed with the GNSS station.
A further point-based analysis (Figure 7) focuses on the distribution of the UAS-based SfM bathymetrical errors in relation to the GCPs depths. The regression straight lines for each set of data are reported in Figure 7. In terms of vertical measurements less accurate results are estimated for the P4RTK targetless approach that achieves an average error of 0.29 m which differs by approximately 0.12 m compared to the GCPs-based approaches. Interestingly, when using targets, the vertical accuracy of both P4RTK and MM2 achieves a similar average error (approximately 0.17 m).
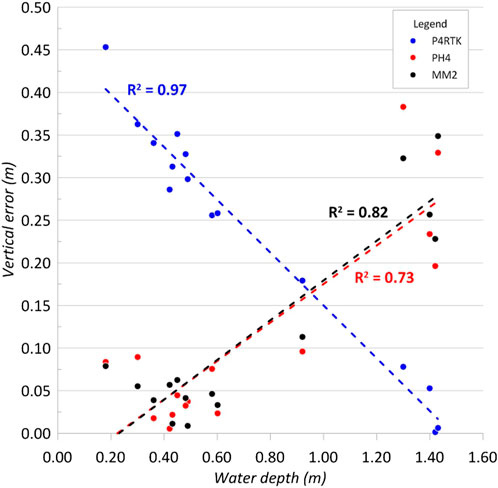
FIGURE 7. Relation between the vertical errors computed from UAS-based approaches at each target and relative water depth.
A summary of the results derived from areal-based and point-based comparisons is presented in Table 7.
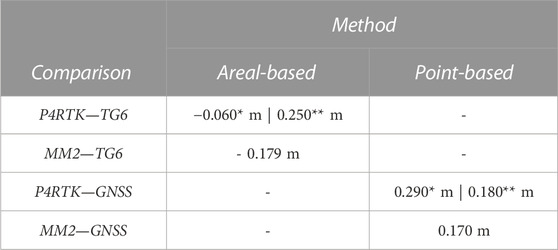
TABLE 7. Summary of the results obtained from the different comparisons. The values signed with * and ** refer to the target-less and target-based approach respectively.
5 Discussion
In accordance with similar studies (Woodget et al., 2015; Casella et al., 2017; Dietrich, 2017; Mulsow et al., 2018; Agrafiotis et al., 2019), our results show that the adoption of SfM photogrammetry coupled with a UAS-based approach can be an effective and robust solution for topo-bathymetrical investigation of underwater environments. Such approach represents a valid alternative to classical surveying techniques at different scales, from small (scuba or snorkeling surveys) to larger (airborne or satellite-based) sites (Hedley et al., 2016). The quality of the UAV-based photogrammetric outputs is influenced by the optimal flight conditions and the visibility of the underwater surfaces that depend on multiple factors including the depth of the investigated site, the clarity of water and the wave conditions on the day and time of data acquisition. Also, the complexity of the seafloor topography and the presence of vegetation must be considered as potential factors which may reduce the quality of the final output.
The UAS-based surveys managed to achieve an overall uniformity in the scene reconstruction when compared to the Olympus-based counterpart. The adoption of the snorkel-based approach and partially of the MM2 photographic acquisition demonstrated limitations to fully reconstruct the study area. This is a common issue when having areas with texture of low quality and the presence of non-static objects (e.g., water suspension and seagrass). However, the P4RTK approach showed to reduce such issues probably due to the acquisition of a higher number of images and the higher camera sensor performances. Similar UAV-based reconstructions of underwater environments were achieved when working in similar contexts and conditions (Casella et al., 2017; Agrafiotis et al., 2020). For future research activities, the photogrammetric reconstruction limitation due to the use of an underwater camera and the presence of dynamic objects (e.g., moving aquatic plants) in the scene can be reduced by acquiring images with a stereo-camera system (Guo et al., 2016; Capra et al., 2017). The adoption of LiDAR or multibeam systems (Kinzel et al., 2013; Madricardo et al., 2017) can further improve the reconstruction output but with significant increase in costs for data acquisition.
The small-scale dataset obtained in this study for AoI2 was influenced by the snorkeler-based survey. When compared to the UAS survey, the operator in the water had to swim slowly to capture sharp pictures following a certain acquisition geometry. The short acquisition distance between camera and object also influences the data collection procedure. This requires an expert operator and is often a time-consuming operation. For our study, the total time spent by the snorkeler for the underwater acquisition of AoI2 was about 30 min longer when compared to the UAS based approach.
Considering the UAS target-based results, in terms of topo-bathymetrical profiles (shown in Figure 5), an over prediction of the bathymetrical values is observed. This is a trend in agreement with similar studies using digital photogrammetry for through-water applications (Woodget et al., 2015). Such behavior appears to be disproved by the use of a P4RTK targetless approach that generated an under estimation of the underwater elevation when compared to the ground-truth. The differences observed along the topo-bathymetrical profiles are confirmed by the M3C2 comparisons. Interestingly, considering the M3C2 results obtained comparing the ground-truth to the two UAV-target-based surveys, the MM2 survey method achieved a higher accuracy. This behavior can be explained by the ability of the operator in the photogrammetric processing, in fact the center of the targets were more easily recognized during the georeferencing process (this was facilitated by the MM2 colour settings). Also, the improvement in radiometric resolution can improve the success of optical bathymetric mapping (Legleiter, 2013).
When dealing with bathymetrical errors, recent literature has shown significant improvements achievable with the application of a refraction correction procedure (Agrafiotis et al., 2020; He et al., 2021). In our study we found that the adoption of P4RTK targetless approach the effects of refraction can be considered negligible. Further research specifically testing the above result is required to explain it. These findings can probably be related to the adoption of different gravimetric models. In fact, when working with the GNSS station and the P4RTK drone, the models ITALGEO05 and EGM2008 were used respectively. The differences influenced by a different geoid ‘undulation’ produce different orthometric heights. Our findings are in line with the mean biases estimated by Tavasci et al. (2022). Such findings explain the differences observed when analyzing the point-wise vertical values shown in Figure 6. Thus, the observed differences are influenced by multiple factors including the photogrammetric processing, the refraction effects and the use of different geoid models.
The previous observation supports the explanation of the trend observed Figure 7 also. The dependency of the bathymetrical error to the increasing depths is well proven in this study when observing the results obtained with the UAS-target-based approach. However, the P4RTK targetless approach suggests that lower vertical errors are achieved for deeper surfaces. This suggests that along the investigated submerged area the geoid model of the orthometric datasets is closer to the ground-truth dataset.
However as suggested by (Štroner et al., 2020), when working with a RTK-UAS, the use of a small number of GCPs reduces the georeferencing vertical errors. Through this approach, our results even without water refraction correction is conform to the vertical accuracy standard (±25 cm), introduced by the International Hydrographic Organization (IHO) (Guenther et al., 2000) for shallow water hydrography (including tide areas). In addition, the generation of UAS-based DEMs enables to obtain a quick idea of the overall topo-bathymetrical condition of the site and can also allow for a rapid calculation of volumes of underwater objects of interest (e.g., aquatic plants, archaeological remains, corals, etc.).
6 Conclusion
We tested the use of a UAS-based SfM-photogrammetry approach, coupled with high accuracy measurements (RTK technology applied to aerial imagery) for quick bathymetry mapping in shallow water. This paper demonstrated that UAS-based through-water photogrammetry is capable of quick and reasonably accurate measurements of a submerged site when working with ideal conditions (e.g., clear water and limited water depth and surface roughness). The initial results of the current work highlighted that the surveying capabilities presented in this work obtained using UAS-based photogrammetric techniques are valid alternatives to costly and logistically challenging approaches used to study underwater sites.
We conveyed that for similar study contexts, the P4RTK has potential for digitizing and monitoring purposes. In fact, with multi-temporal drone-derived acquisitions, even when using quick and low-cost solutions (e.g., Mavic Mini 2), the SfM technique can offer a cost-effective alternative to monitor temporal changes in topographic complexity of underwater environments.
Also, our findings show that the MM2 can be considered as a practical (no need for a pilot’s license) and cost-effective solution when requiring quick and reasonable surveying results. However, the use of GCPs with well-known positions is required.
The findings presented in this paper encourage conducting analysis on different aspects of submerged geomorphological and archaeological features, or to investigate the status of reef ecology using consumer-grade UAS-based survey equipment. Furthermore, future research efforts must be addressed to estimate the influence of underwater key aspects (such as water depths and clarity, complexity of the seafloor topography, presence of non-static aquatic plants) on the final photogrammetric outputs.
Data availability statement
The raw data supporting the conclusions of this article will be made available by the authors, without undue reservation.
Author contributions
DM and LP contributed equally to the conception of the study. DM, LP, DC and AM performed data acquisition. DM and LP conducted data processing and analysis and wrote the first draft of the manuscript collecting contributions and experiences of all authors. PR contributed to the revision of the first draft. All authors contributed to the final manuscript revision and approved the submitted version.
Funding
This research was funded by GEO-Archaeo Project (PON “R&I" - 2014/2020 - Code: ARS01_01249 —CUP: B89C20000880005). Project Coordinator: MRS, University of Sannio–Benevento, Italy).
Conflict of interest
The authors declare that the research was conducted in the absence of any commercial or financial relationships that could be construed as a potential conflict of interest.
Publisher’s note
All claims expressed in this article are solely those of the authors and do not necessarily represent those of their affiliated organizations, or those of the publisher, the editors and the reviewers. Any product that may be evaluated in this article, or claim that may be made by its manufacturer, is not guaranteed or endorsed by the publisher.
Supplementary material
The Supplementary Material for this article can be found online at: https://www.frontiersin.org/articles/10.3389/feart.2023.1183982/full#supplementary-material
References
Agrafiotis, P., Skarlatos, D., Georgopoulos, A., and Karantzalos, K. (2019). Shallow water bathymetry mapping from uav imagery based on machine learning. https://arxiv.org/abs/1902.10733.
Agrafiotis, P., Karantzalos, K., Georgopoulos, A., and Skarlatos, D. (2020). Correcting image refraction: Towards accurate aerial image-based bathymetry mapping in shallow waters. Remote Sens. 12, 322. doi:10.3390/rs12020322
Anzidei, M., Lambeck, K., Antonioli, F., Furlani, S., Mastronuzzi, G., Serpelloni, E., et al. (2014). Coastal structure, sea-level changes and vertical motion of the land in the Mediterranean. Geol. Soc. Lond. Spec. Publ. 388, 453–479. doi:10.1144/SP388.20
Barzaghi, R., Borghi, A., Carrion, D., and Sona, G. (2007). Refining the estimate of the Italian quasi-geoid. Boll. Geod. Sci. affini 3, 146–157.
Caballero, F. J., Viñals, M. J., and Tormo, S. (2020). The effects of rising sea levels on the conservation of roman fish tanks in the western mediterranean basin. Int. Archives Photogrammetry Remote Sens. Spatial Inf. Sci. (Copernicus GmbH) 44, 659–666. doi:10.5194/isprs-archives-XLIV-M-1-2020-659-2020
Calantropio, A., Chiabrando, F., and Auriemma, R. (2021). Photogrammetric underwater and uas surveys of archaeological sites: The case study of the roman shipwreck of torre Santa sabina. Int. Archives Photogrammetry, Remote Sens. Spatial Inf. Sci. (Copernicus GmbH) 43, 643–650. doi:10.5194/isprs-archives-XLIII-B2-2021-643-2021
Capra, A., Castagnetti, C., Dubbini, M., Gruen, A., Guo, T., Mancini, F., et al. (2017). “High accuracy underwater photogrammetric surveying,” in Proceedings of the 3rd IMEKO International Conference on Metrology for Archeology and Cultural Heritage, Lecce, Italy, October 2017.
Capra, A., Dubbini, M., Bertacchini, E., Castagnetti, C., and Mancini, F. (2015). 3D reconstruction of an underwater archaelogical site: Comparison between low cost cameras. ISPRS - Int. Archives Photogrammetry, Remote Sens. Spatial Inf. Sci. XL-5/W5 42, 67–72. doi:10.5194/isprsarchives-XL-5-W5-67-2015
Casella, E., Collin, A., Harris, D., Ferse, S., Bejarano, S., Parravicini, V., et al. (2017). Mapping coral reefs using consumer-grade drones and structure from motion photogrammetry techniques. Coral Reefs 36, 269–275. doi:10.1007/s00338-016-1522-0
Civitelli, G., and Corda, L. (1993). Livelli marini pleistocenici e neotettonica fra Civitavecchia e Tarquinia (Italia Centrale). Quad. “La Ric. Scientifica” 11, 19–28.
Dietrich, J. T. (2017). Bathymetric structure-from-motion: Extracting shallow stream bathymetry from multi-view stereo photogrammetry. Earth Surf. Process. Landforms 42, 355–364. doi:10.1002/esp.4060
Drap, P. (2012). “Underwater photogrammetry for archaeology,” in Special applications of photogrammetry (London, UK: Daniel Carneiro da Silva), 111–136.
Evelpidou, N., Pirazzoli, P., Vassilopoulos, A., Spada, G., Ruggieri, G., and Tomasin, A. (2012). Late holocene sea level reconstructions based on observations of roman fish tanks, tyrrhenian coast of Italy. Geoarchaeology 27, 259–277. doi:10.1002/gea.21387
Figueira, W., Ferrari, R., Weatherby, E., Porter, A., Hawes, S., and Byrne, M. (2015). Accuracy and precision of habitat structural complexity metrics derived from underwater photogrammetry. Remote Sens. 7, 16883–16900. doi:10.3390/rs71215859
Girardeau-Montaut, D. (2022). CloudCompare. Available at: https://www.cloudcompare.org/(Accessed December 19, 2022).
Guenther, G., Cunningham, A. G., LaRocque, P., and Reid, R. (2000). Meeting the accuracy challenge in airborne bathymetry. Silver Spring, MD, USA: National Oceanic Atmospheric Administration/Nesdis.
Guerriero, L., Guadagno, F. M., and Revellino, P. (2019). Estimation of Earth-slide displacement from GPS-based surface-structure geometry reconstruction. Landslides 16, 425–430. doi:10.1007/s10346-018-1091-0
Guo, T., Capra, A., Troyer, M., Grün, A., Brooks, A. J., Hench, J. L., et al. (2016). Accuracy assessment of underwater photogrammetric three dimensional modelling for coral reefs. Int. Archives Photogrammetry, Remote Sens. Spatial Inf. Sci. (ISPRS) 41, 821–828. doi:10.5194/isprsarchives-XLI-B5-821-2016
He, J., Lin, J., Ma, M., and Liao, X. (2021). Mapping topo-bathymetry of transparent tufa lakes using UAV-based photogrammetry and RGB imagery. Geomorphology 389, 107832. doi:10.1016/j.geomorph.2021.107832
Hedley, J. D., Roelfsema, C. M., Chollett, I., Harborne, A. R., Heron, S. F., Weeks, S., et al. (2016). Remote sensing of coral reefs for monitoring and management: A review. Remote Sens. 8, 118. doi:10.3390/rs8020118
Kasprak, A., Wheaton, J. M., Ashmore, P. E., Hensleigh, J. W., and Peirce, S. (2015). The relationship between particle travel distance and channel morphology: Results from physical models of braided rivers. J. Geophys. Res. Earth Surf. 120, 55–74. doi:10.1002/2014JF003310
Kinzel, P. J., Legleiter, C. J., and Nelson, J. M. (2013). Mapping River bathymetry with a small footprint green LiDAR: Applications and challenges 1: Mapping river bathymetry with a small footprint green LiDAR: Applications and challenges. JAWRA J. Am. Water Resour. Assoc. 49, 183–204. doi:10.1111/jawr.12008
Lague, D., Brodu, N., and Leroux, J. (2013). Accurate 3D comparison of complex topography with terrestrial laser scanner: Application to the Rangitikei canyon (NZ). ISPRS J. Photogramm. Remote Sens. 82, 10–26.
Lambeck, K., Anzidei, M., Antonioli, F., Benini, A., and Verrubbi, V. (2018). Tyrrhenian sea level at 2000 BP: Evidence from roman age fish tanks and their geological calibration. Berlin, Germany: Springer.
Legleiter, C. J. (2013). Mapping River depth from publicly available aerial images. River Res. Appl. 29, 760–780. doi:10.1002/rra.2560
Llewellyn, L. E., and Bainbridge, S. J. (2015). “Getting up close and personal: The need to immerse autonomous vehicles in coral reefs,” in Proceedings of the OCEANS 2015 - MTS/IEEE Washington, Washington, DC, USA, August 2015, 1–9. doi:10.23919/OCEANS.2015.7401909
Madricardo, F., Foglini, F., Kruss, A., Ferrarin, C., Pizzeghello, N. M., Murri, C., et al. (2017). High resolution multibeam and hydrodynamic datasets of tidal channels and inlets of the Venice Lagoon. Sci. Data 4, 170121. doi:10.1038/sdata.2017.121
Mandlburger, G. (2019). Through-water dense image matching for shallow water bathymetry. Photogramm. Eng. remote Sens. 85, 445–455. doi:10.14358/PERS.85.6.445
Mazza, D., Cosentino, A., Romeo, S., Mazzanti, P., Guadagno, F. M., and Revellino, P. (2023). Remote sensing monitoring of the pietrafitta earth flows in southern Italy: An integrated approach based on multi-sensor data. Remote Sens. 15, 1138. doi:10.3390/rs15041138
Menna, F., Nocerino, E., Ural, S., and Gruen, A. (2020). Mitigating image residuals systematic patterns in underwater photogrammetry. Int. Archives Photogrammetry, Remote Sens. Spatial Inf. Sci. (Copernicus GmbH) 42, 977–984. doi:10.5194/isprs-archives-XLIII-B2-2020-977-2020
Moyano, J., Nieto-Julián, J. E., Bienvenido-Huertas, D., and Marín-García, D. (2020). Validation of close-range photogrammetry for architectural and archaeological heritage: Analysis of point density and 3D mesh geometry. Remote Sens. 12, 3571. doi:10.3390/rs12213571
Mulsow, C., Kenner, R., Bühler, Y., Stoffel, A., and Maas, H.-G. (2018). Subaquatic digital elevation models from uav-imagery. ISPRS - Int. Archives Photogrammetry, Remote Sens. Spatial Inf. Sci. 422, 739–744. doi:10.5194/isprs-archives-XLII-2-739-2018
Parente, L., Chandler, J. H., and Dixon, N. (2021). Automated registration of SfM-MVS multitemporal datasets using terrestrial and oblique aerial images. Photogrammetric Rec. 36, 12–35. doi:10.1111/phor.12346
Parente, L., Chandler, J. H., and Dixon, N. (2019). Optimising the quality of an SfM-MVS slope monitoring system using fixed cameras. Photogrammetric Rec. 34, 408–427. doi:10.1111/phor.12288
Rende, S. F., Bosman, A., Menna, F., Lagudi, A., Bruno, F., Severino, U., et al. (2022). Assessing seagrass restoration actions through a micro-bathymetry survey approach (Italy, mediterranean sea). Water 14, 1285. doi:10.3390/w14081285
Rossi, P., Mancini, F., Dubbini, M., Mazzone, F., and Capra, A. (2017). Combining nadir and oblique UAV imagery to reconstruct quarry topography: Methodology and feasibility analysis. Eur. J. Remote Sens. 50, 211–221. doi:10.1080/22797254.2017.1313097
Schmiedt, G. (1972). Il livello antico del mar Tirreno Testimonianze dei resti archeologici. Florence, Italy: Casa Editrice Leo S. Olschki.
Smith, M. W., Carrivick, J. L., and Quincey, D. J. (2016). Structure from motion photogrammetry in physical geography. Prog. Phys. Geogr. Earth Environ. 40, 247–275. doi:10.1177/0309133315615805
Štroner, M., Urban, R., Reindl, T., Seidl, J., and Brouček, J. (2020). Evaluation of the georeferencing accuracy of a photogrammetric model using a quadrocopter with onboard GNSS RTK. Sensors 20, 2318. doi:10.3390/s20082318
Tavasci, L., Vecchi, E., and Gandolfi, S. (2022). “Definition of the local geoid undulation using non-contemporary GNSS-levelling data on subsidence area: Application on the adriatic coastline,” in Geomatics and geospatial technologies communications in computer and information science. Editors E. Borgogno-Mondino, and P. Zamperlin (Cham, Switzerland: Springer International Publishing), 259–270. doi:10.1007/978-3-030-94426-1_19
Vecchi, E., Tavasci, L., De Nigris, N., and Gandolfi, S. (2021). GNSS and photogrammetric uav derived data for coastal monitoring: A case of study in emilia-romagna, Italy. J. Mar. Sci. Eng. 9, 1194. doi:10.3390/jmse9111194
Westoby, M. J., Brasington, J., Glasser, N. F., Hambrey, M. J., and Reynolds, J. M. (2012). ‘Structure-from-Motion’ photogrammetry: A low-cost, effective tool for geoscience applications. Geomorphology 179, 300–314. doi:10.1016/j.geomorph.2012.08.021
Keywords: UAS, RTK, bathymetry, Structure-from-Motion (SfM), photogrammetry, underwater, 3D model
Citation: Mazza D, Parente L, Cifaldi D, Meo A, Senatore MR, Guadagno FM and Revellino P (2023) Quick bathymetry mapping of a Roman archaeological site using RTK UAS-based photogrammetry. Front. Earth Sci. 11:1183982. doi: 10.3389/feart.2023.1183982
Received: 10 March 2023; Accepted: 31 March 2023;
Published: 10 April 2023.
Edited by:
Daniele Spatola, Sapienza University of Rome, ItalyReviewed by:
Giulia Iacobucci, Sapienza University of Rome, ItalyEmanuele Colica, University of Malta, Malta
Copyright © 2023 Mazza, Parente, Cifaldi, Meo, Senatore, Guadagno and Revellino. This is an open-access article distributed under the terms of the Creative Commons Attribution License (CC BY). The use, distribution or reproduction in other forums is permitted, provided the original author(s) and the copyright owner(s) are credited and that the original publication in this journal is cited, in accordance with accepted academic practice. No use, distribution or reproduction is permitted which does not comply with these terms.
*Correspondence: Luigi Parente, Z2VvLmx1aWdpcGFyZW50ZUBnbWFpbC5jb20=