 Wade L. Aubin
- 1Jackson School of Geosciences, University of Texas at Austin, Austin, TX, United States
- 2Department of Earth Sciences, University of Oregon, Eugene, OR, United States
Obsidian pyroclasts are common in deposits from silicic sub-Plinian eruptions and can record pre- and syn-eruptive processes in the volcanic conduit. Previous work focusing on dissolved volatiles and vesicle textures has been useful in extracting timescales of sintering, diffusion, and vesicle relaxation recorded by obsidian pyroclasts. Here we focus on microlite crystals (<100 µm in size) to augment previous work because they form at different rates than vesicles or than rates of volatile degassing. Hence, they have the potential to disclose additional information about processes occurring in an explosive conduit. We examine microlites in 72 samples from tephra deposits of the 1340 C.E. North Mono eruption, California, U.S.A., and complement these measurements with hydrothermal experiments at 800°C, 10–50 MPa, and durations from 1 to 7 h. Three observations of the natural obsidians further elucidate their formation. First, microlite number densities (MND) increased as the eruption progressed. Second, multiple microlite morphologies occur for feldspars (blocky, swallowtail, tabular, cluster, skeletal) and pyroxenes (individual rods or clusters of acicular crystals) in each obsidian, regardless of any other characteristic. Third, microlite orientations correlate with the dominant morphology of vesicles, being generally well aligned in samples with ellipsoid vesicles, generally poorly aligned in samples with spherical vesicles, and either unaligned or aligned into planes in samples with distorted vesicles. In hydrothermal experiments, MND increase with time, microlites display only one morphology, and microlites are randomly oriented at any given pressure or temperature. When compared to natural obsidians, our experiments suggest most of the microlites could have grown in ≤∼7 h. The variety of microlite morphologies and orientations argue for repeated in-conduit fragmentation and sintering, consistent with the idea that each individual obsidian pyroclast is the product of ash sintering at multiple depths in the conduit prior to finally being erupted. During most of the eruption, obsidian pyroclasts were extracted from many depths in the conduit, preserving an array of volatile contents and microlite textures. Near the end of the explosive phase, however, higher MND record longer periods of stalling while dissolved volatile contents record vapor-melt equilibration at shallow depths in the conduit.
1 Introduction
The observations of the eruptions of Volcán Chaitén and Cordón Caulle, in 2008–2012, both in Chile, have challenged our understanding of rhyolitic eruptions (Castro and Dingwell, 2009; Lara, 2009; Castro et al., 2013; Schipper et al., 2013; Heap et al., 2019). Each eruption began with explosive activity that quickly transitioned to “hybrid” activity in which lava extruded from volcanic vents that simultaneously explosively erupted gases, ash and pyroclasts (Schipper et al., 2013; Heap et al., 2019). Such explosive-effusive activity disputed previous models whereby volatile exsolution drives an explosive phase that is followed by effusion of degassed lava. A recent model to explain the contemporaneous occurrence of degassing (pumice and ash) and degassed (lava) envisions that all products are generated by variable amalgamation and sintering of pyroclasts at depth generated by fragmentation (Wadsworth et al., 2020; 2022). Once enough sintered material accumulates to occlude the erupting conduit, effusion of degassed lava flows and domes ensues. Continued active degassing in the occluded conduits causes the resintered magma to fracture, releasing the gases in explosive behavior, erupting ash and pyroclasts (Castro et al., 2012; 2014; Schipper et al., 2013; Saubin et al., 2016; Wadsworth et al., 2022).
A core concept of the model of Wadsworth et al. (2022) is that ash sinters and accumulates along the conduit walls. Pyroclastic obsidian, found in explosive tephra deposits, was, for many years, thought to represent the chilled glassy margins of dikes (e.g., Newman et al., 1988; Bursik, 1993). In particular, the origin and significance of obsidians from the 1340 C.E. North Mono eruption have been the subject of many previous studies (Taylor et al., 1983; Newman et al., 1986; 1988; Sieh and Bursik, 1986; Dobson et al., 1989; Bursik, 1993; Gonnermann and Manga, 2003; Rust et al., 2004; Watkins et al., 2012; Barnes et al., 2014; Gardner et al., 2017; Watkins et al., 2017). Recent work suggests instead that the North Mono obsidian pyroclasts were formed by syn-eruption sintering of hot melt and ash along conduit margins (Gardner et al., 2017; Watkins et al., 2017). This model was based mainly on the interpretation that cuspate vesicle shapes in the pyroclastic obsidians are relict spaces between ash that sintered during the eruption. Watkins et al. (2017) showed that pyroclasts preserve heterogeneities in dissolved volatile concentrations and used diffusion modeling to confirm that the obsidians could have formed during the timescale of the eruption.
Throughout the process of magma ascent and cycles of fragmentation, sintering, and dwelling along the conduit margins or in the occluded conduit, there is opportunity for microlite crystals to nucleate, grow, and become aligned. Microlites thus offer an additional piece of information about in-conduit processes because they form at rates dictated by the undercooling of the magma, which is driven by the degassing of the magma during the eruption. Once formed, they remain rigid, unlike vesicles that are easily deformed. Thus, we use microlite numbers, shapes, and orientations in obsidian pyroclasts from the North Mono eruption in conjunction with vesicle textures and volatile concentrations to further investigate the rates and dynamics of obsidian formation during explosive volcanic events.
2 Materials and methods
2.1 Obsidian pyroclasts
Obsidian pyroclasts were collected from the tephra deposit formed by the North Mono eruption (Sieh and Bursik, 1986; Bursik, 1993). That eruptive sequence began with ejection of ∼0.2 km3 of tephra in a series of sub-Plinian explosions and then shifted to producing pyroclastic flows and surges, followed by extrusion of ∼0.4 km3 of lava in five domes and coulees (Sieh and Bursik, 1986). The tephra deposit consists of 10 lapilli layers, consisting mostly of pumice and lithics with variable amounts of pyroclastic obsidian, interbedded with well-sorted ash beds (Figure 1). Obsidians were collected from two pits dug into the tephra. Barnes et al. (2014) and Gardner et al. (2107) give full descriptions of the pit locations, tephra stratigraphy, and sample selection. In addition, we collected obsidian pyroclasts from the lower and upper halves of layer P1at the same site as Newman et al. (1988). Dissolved volatile concentrations (H2O-CO2) in obsidians from layers P2, P4, P6, and P10 are reported in Gardner et al. (2017) and Barnes et al. (2014).
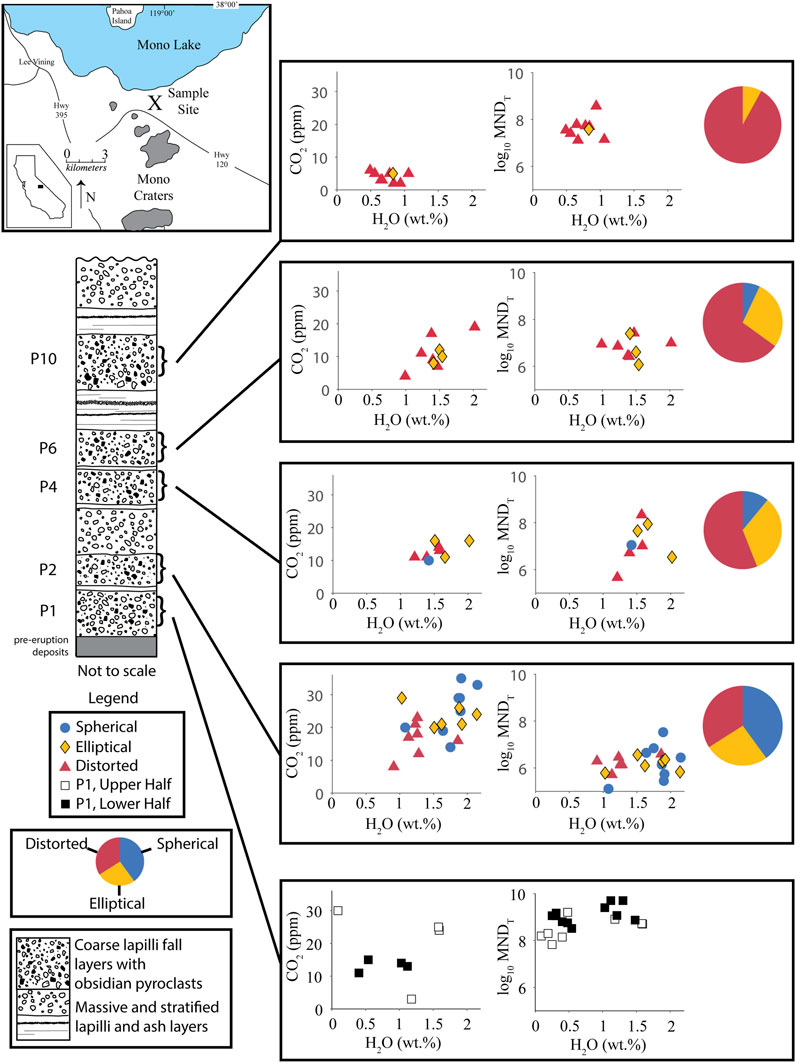
FIGURE 1. Location Map and schematic stratigraphic section of the North Mono tephra deposit after descriptions from Sieh and Bursik (1986) and Barnes et al. (2014). Graphs show H2O-CO2 concentrations and MND in obsidians. Each volatile concentration data point is an average of multiple spot analyses. Colors and shapes of data points represent main vesicle type in that obsidian. Pie charts show relative abundances of the main vesicle types in obsidian clasts. MNDT = Total MND (pyroxene + feldspar + Fe-Ti oxides). Volatile concentrations are assumed to represent the final conditions at which each obsidian clast equilibrated before being erupted out of the vent. Therefore, relative volatile concentrations define a conduit stratigraphy of the depth at which obsidian clasts experienced their final sintering event. MND is a proxy for the relative amounts of time that obsidians spent in the volcanic conduit. Higher MND = more time in the conduit. MND generally increases with time through the eruptive sequence. MND in obsidians from layer P1 are one to three orders of magnitude greater than those in any other layers. The pie charts show a progression in vesicle types from an abundance of spherical vesicles early in the eruption to distorted vesicles later in the eruption.
All obsidian pyroclasts are gray to black in color. Those from layers P2-P10 have vesicularities that range from 0.02 to 8.4 vol%, although most have <1 vol% (Gardner et al., 2017). Banding, defined by distinct concentrations of vesicles and/or microlites, is common, with bands often being discontinuous, and variable in thickness and spacing (Figure 2A). Vesicles in the obsidians range in shape from spherical to ellipsoidal to “distorted” (Gardner et al., 2017). Distorted vesicles are irregularly shaped, with jagged edges and sharp contortions, and are often elongated, likely because of shear stress that the obsidian experienced.

FIGURE 2. Representative photomicrographs of textures in (A–E) obsidian clasts and (F) experiments. (A) Banding in sample P10-D; (B) clinopyroxene microlite in sample P4B-C; (C) swallow-tailed alkali feldspar and clinopyroxene attached to Fe-Ti oxide in sample P10-E; (D) blocky feldspar and pyroxene in sample P4B-C; (E) Fe-Ti oxide trichites and clinopyroxene microlites in layer P1 obsidian clasts in sample B1L-FFF; (F) clinopyroxene microlite and spherical vesicles in experimental sample A-61.
Obsidians from an earlier erupted tephra layer (layer P2) have mainly spherical vesicles and generally higher dissolved volatile concentrations. Obsidians with dominantly distorted vesicles comprise the majority (92%) of clasts in the last part of the eruptive sequence (layer P10) and have generally lower dissolved volatile concentrations. The relative occurrence of banding in the obsidians also increases from layer P2 through layer P10. Obsidians with mainly ellipsoidal vesicles are common throughout the tephra sequence (Figure 1). In contrast, none of the 20 obsidians examined from layer P1 have vesicles.
We measured microlite number densities (MND) in thin sections of 73 obsidians from layers P1-P10 (Table 1). All obsidians contain clinopyroxene and Fe-Ti oxide microlites. Obsidians from layers P2-P10 also contain alkali feldspar microlites. We measured the relative abundances of different pyroxene and feldspar crystal morphologies in 24 of these samples from layers P2, P4, P6, and P10 spanning the range of volatile concentrations found in each tephra layer (Table 2). We measured microlites by selecting seven different 120 μm x 120 µm areas in each thin section and counting all microlites of each mineral phase using a petrographic microscope while focusing through the sample. Depth was measured using a Heidenhain focus drive linear encoder attached to the focusing drive of the microscope. MND is thus the number of microlites counted within a given volume of sample. For banded samples we determined MND for each band separately. Because vesicularities are mostly <1 vol%, no corrections were made to MND for the presence of vesicles.
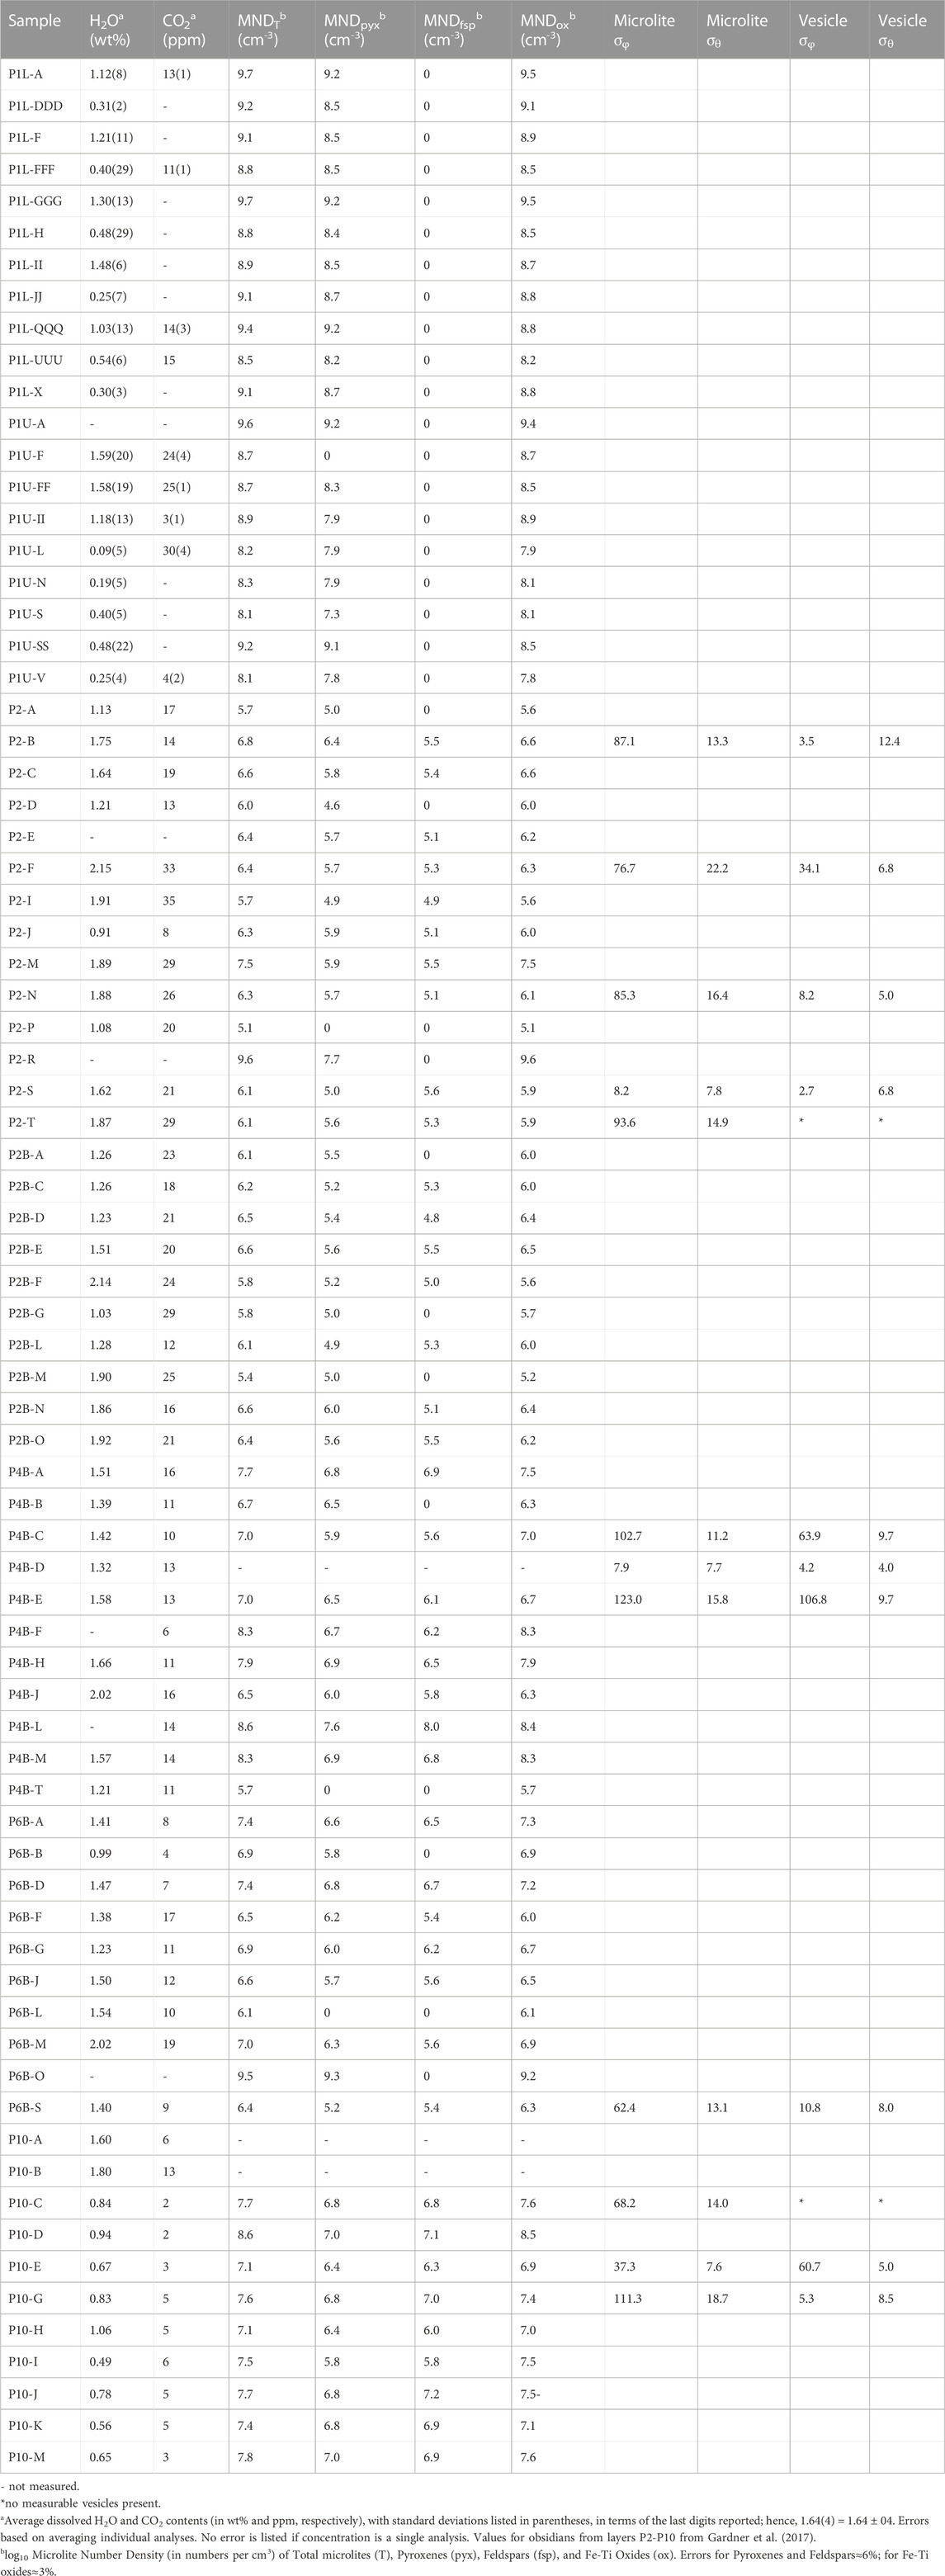
TABLE 1. Dissolved volatile contents, Microlite Number Densities (MND), and microlite and vesicle standard deviations of trend (σφ) and plunge (σθ) for North Mono obsidian samples.
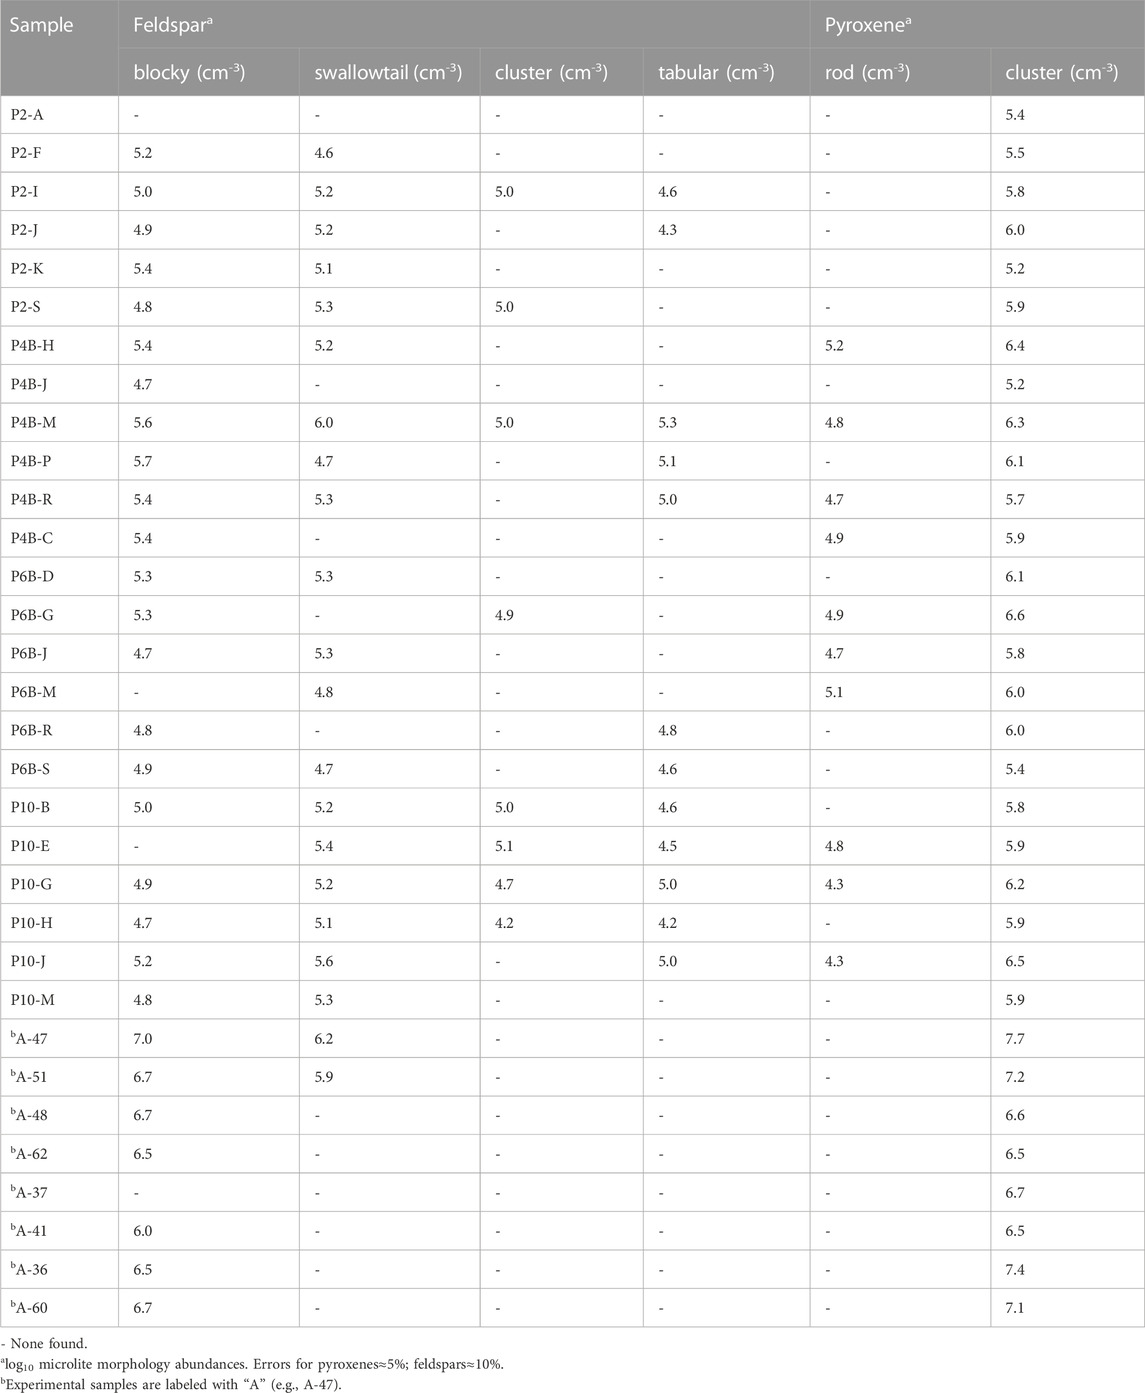
TABLE 2. Microlite morphology abundances for North Mono obsidian samples and experimental samples.
Microlite counting errors were determined by counting through seven volumes per sample in seven different samples. We repeated this process seven times. Errors are of the numbers of microlites counted, prior to conversion to numbers of microlites per unit volume, and are based on averaging individual analyses. For MND counts, the error for pyroxene and feldspar is ∼6% and Fe-Ti oxide MND is ∼3%. For microlite morphology counts, the error is ∼5% for pyroxenes and ∼10% for feldspar. These error values stem mainly from sample heterogeneity rather than analytical uncertainty.
We measured the orientations of microlites and vesicles in 11 obsidian clasts (Table 1), following the procedures of Castro et al. (2002) and Befus et al. (2014). Rod-shaped pyroxene microlites were used to measure microlite orientations. They are the only microlites with any measurable alignments. The trend (φ) of the long axis of a microlite or vesicle was measured using the goniometer on the stage of a petrographic microscope. The plunge (θ) was determined by measuring the apparent length of each microlite or vesicle using the reticle in the eyepiece of the microscope and then the depths of each end were measured using the same technique as for measuring depth for MND (Befus et al., 2014). In cases where different regions of obsidian pyroclasts had distinctly different textures, φ and θ were measured separately in each region. We note that orientations are relative to the position of the sample on the microscope stage because obsidian pyroclasts were not oriented in the field. Vesicle orientations were measured only for elongated vesicles. Microlite and vesicle φ and θ were plotted on lower hemisphere stereonet projections using the Stereonet program (Allmendinger et al., 2013; Cardozo and Allmendinger, 2013). To compare alignments between groups of microlites and vesicles, we calculated the standard deviations of φ and θ (σφ and σθ). Smaller standard deviations indicate better alignment (Manga, 1998; Befus et al., 2014). We measured MND and lengths of microlites within and outside of high-density bands in two samples, using the same methods as described above.
Dissolved volatile concentrations for layer P1 obsidians were analyzed using a Thermo Electron Nicolet 6700 spectrometer and Continuµm IR microscope. In most cases, concentrations of molecular H2O and hydroxyl OH were determined from absorbances at ∼5,250 and ∼4,500 cm−1, using white light and a CaF2 beamsplitter, and the expressions of Zhang et al. (1997). In some samples with low volatile concentrations however, total H2O was measured from absorbance at ∼3,500 cm−1, using a globar light source and KBr beamsplitter. Published values for the molar absorptivity at 3,500 cm–1 in rhyolitic glasses vary, and average 78 ± 2 (L cm−1 mol−1), (Ihinger et al., 1994; Behrens and Schmidt, 1998; Okumura et al., 2003; Leschik et al., 2004). Including the molar absorptivities used by Newman et al. (1986) and Dobson et al. (1989) together with the proportions of absorptions at 5,200 and 4,500 cm–1 we calculated a total molar absorptivity of 71 ± 2 (L cm−1 mol−1), for the 3,500 cm−1 peak. We assumed a constant density value of 2,350 g L−1. Using an absorptivity of 1214 L cm–1 mol–1 (Behrens et al., 2004), we analyzed dissolved molecular CO2 (absorbance peak at ∼2,350 cm–1) at the same spots. Thickness was measured several times at each analysis spot. The error of measured volatile contents includes any error on thicknesses. Thickness was measured with the focus drive encoder described above. This method has been calibrated using glasses of known thickness and verified by measuring the same glasses with micrometers. Each thickness was measured repeatedly. The average error on thickness is ±8 µm. Reported H2O and CO2 contents are the means of three to five spots (Table 1). FTIR analysis data is available in the Supplementary Material for this manuscript.
2.2 Experiments
Five pumice from the North Mono tephra deposit were used to make rhyolite powder as starting material for experiments. Each pumice had >70% porosity and <1% microlites visible in thin section. Pumice were first crushed into sub-mm-sized pieces using a steel mortar and pestle, and then ground together into a powder using an agate mortar and pestle. The powder was then sieved, and the size fraction of <45 µm (4.5 φ) was used in all experiments.
Each experiment consisted of ∼40 mg of powder poured into a Ag capsule (3 mm outside diameter) that had been welded shut on one end. The other end of the capsule was left open. Each capsule was placed into a sample holder at the end of an Inconel rod, which was then inserted into a pressure vessel made of Nickel-based alloy that was fitted with a rapid quench extension (Gardner, 2007). The pressure vessel was connected to a pressure line, and pressure was applied using water. Because the capsule was open, the pressurizing water was in contact with the powder, ensuring complete H2O saturation during experiments (Gardner et al., 2019). An external magnet held the sample in the water-cooled end of the pressure vessel while the vessel heated to the experimental temperature of 800°C. Once the pressure vessel had equilibrated thermally, the external magnet was raised, lifting the sample into the hot zone of the pressure vessel. Samples were held at high temperature and pressures for durations ranging between 1 and 7 h, during which pressure varied by no more than 0.1 MPa and temperature varied by no more than 2°C. Samples were then quenched by quickly lowering the external magnet, bringing the sample into the water-cooled region of the vessel where it cooled at ∼150°C s–1 (Gardner et al., 2018).
We chose 800°C as our experimental temperature based on calculations of magmatic temperature (Tm) using magnetite-ilmenite compositions reported by Carmichael (1966) from Mono Craters obsidian lavas (samples Cam 103, Cam 104, Cam 108, and Cam 110). We calculated Tm for these samples using the model of Anderson and Lindsley (1988) for Fe-Ti oxide geothermometry.
A thin section was made of each experimental sample and MND, microlite morphologies, and orientations were measured using the same techniques as for natural obsidians (Table 2, 3). Microlite counting error was determined using the same method as for the obsidian clasts. For MND, error is ∼10% for pyroxene and feldspar microlites and ∼3% for Fe-Ti oxide microlites. For microlite morphology counts, errors are ∼15% for pyroxene and ∼10% for feldspar.
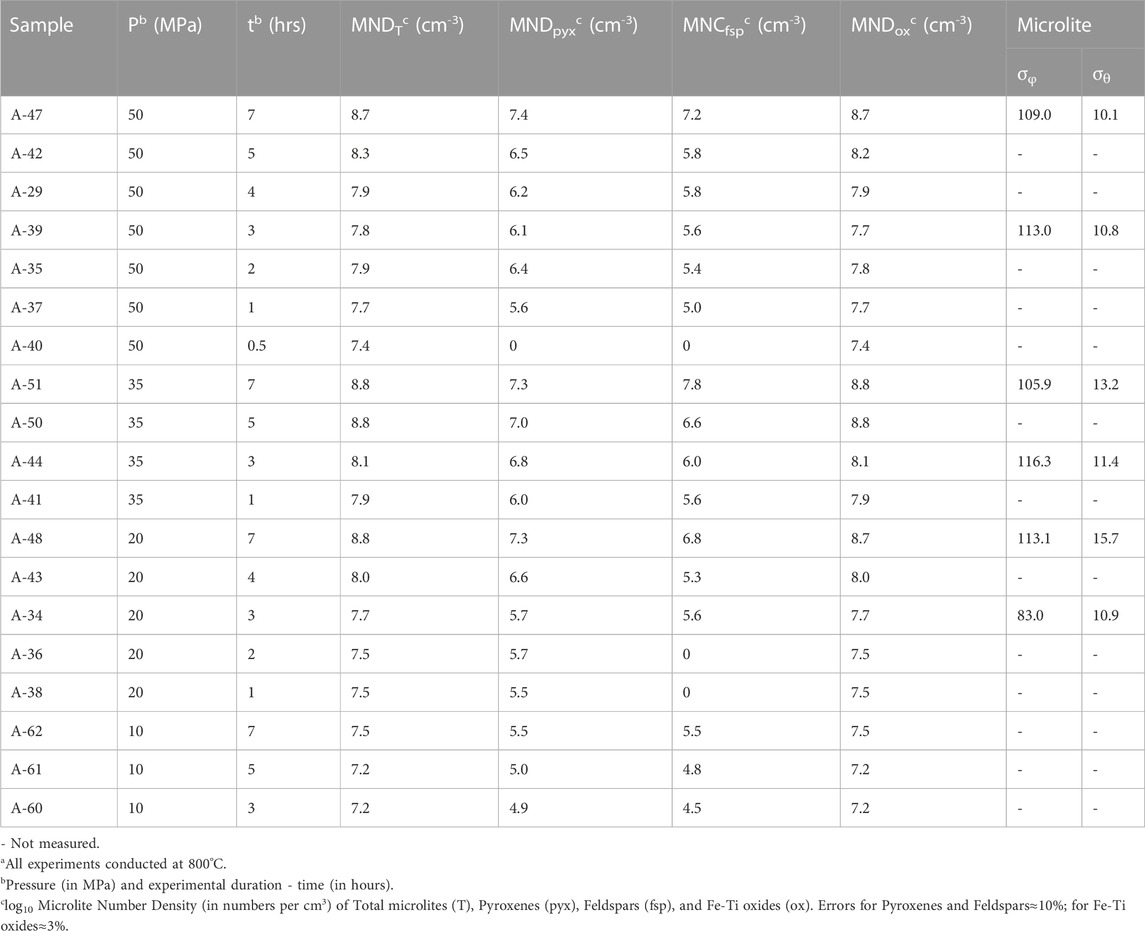
TABLE 3. Experimental run conditionsa, results, and microlite standard deviations of trend (σφ) and plunge (σθ).
3 Results
3.1 Obsidian pyroclasts
3.1.1 Microlite number densities and morphologies
Most obsidians contain <1 vol% microlites of euhedral to subhedral rod-shaped clinopyroxene crystals, subhedral, blocky alkali feldspar crystals, frequently with swallowtail protrusions, and Fe-Ti oxides. Clinopyroxene crystals are 2–30 µm in length and <1–3 µm wide (Figure 2). These crystals are frequently paired with an Fe-Ti oxide microlite on one end of the crystal (Figures 2B, C). Clinopyroxenes have high positive relief and often have a slight green color in plane-polarized light. Overall, clinopyroxene MND range from 104.6 to 109.7 cm−3. Fe-Ti oxide microlites are scattered throughout every sample as euhedral to subhedral opaque crystals <1–10 µm in diameter and are sometimes in clusters. Fe-Ti oxide MND range from 105.1 to 109.6 cm−3, and nearly always exceed clinopyroxene MND in a given sample.
Alkali feldspar microlites are found in ∼80% of the obsidian pyroclasts (Figure 3), ∼40% of the time as subhedral, blocky crystals that are 1–20 µm in size (Figure 2D). They occur individually and in clusters of two or more. Microlites with “swallow tail” protrusions also constitute ∼40% of the feldspars and are 2–20 µm long and <1–4 µm wide (Figure 2C). Roughly ∼6–7% of the feldspars are tabular crystals, have skeletal textures, or occur in clusters of long slender needle-shaped crystals. Overall, feldspar MND range from 104.8 to 108.0 cm−3.
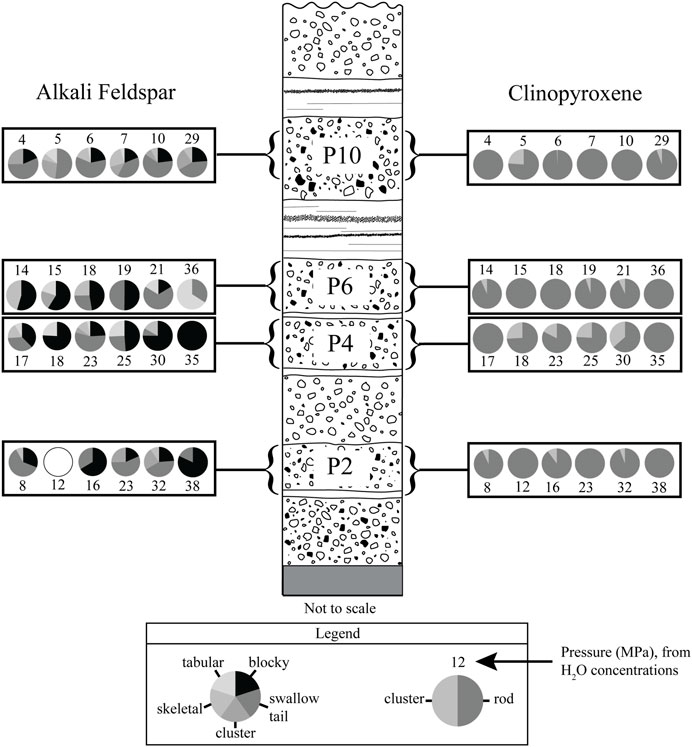
FIGURE 3. Microlite morphology by tephra layer. Each pie chart shows the morphologies present in a single obsidian clast. The first feldspar pie chart in each layer and the first pyroxene pie chart in that layer are from the same obsidian clast, as well as the second, and so on. Open circle indicates that no microlites were found during counting. Numbers assigned to each pie chart indicate the pressure at which the obsidian pyroclasts last equilibrated prior to eruption. Equilibration pressures were calculated from co-existing dissolved H2O-CO2 concentrations using the model of Liu et al. (2005).
In obsidians from layer P1, many of the Fe-Ti oxide microlites uniquely occur as asteroidal trichites (Skinner, 1983), clusters of curved needles that branch away from a central core in all directions (Figure 2E). Individual needles can reach up to 150 µm in length, and in some cases <1–4 µm long clinopyroxene crystals are attached along the sides of the needles. Individual clinopyroxene microlites only occur as tabular crystals 2–45 µm in length and <1–4 µm wide.
3.1.2 Microlite and vesicle alignments
In general, microlites are not as well aligned as vesicles (Figure 4). Microlite σφ ranges from 7.9⁰ to 123⁰, and σθ ranges from 7.6⁰ to 22.2⁰ (Table 1). Vesicle σφ ranges from 2.7⁰ to 106.8⁰, and σθ ranges from 3.6⁰ to 12.8⁰ (Table 1). There is no clear trend in microlite alignments through the tephra sequence. Rather, microlite alignments seem to be correlated more closely with dominant vesicle types in obsidians. Microlites are generally poorly aligned in obsidian samples with mainly spherical vesicles (Figure 4A). In obsidians with mainly ellipsoid vesicles, microlites are generally either well aligned and have a common orientation with vesicles, or they are aligned in a plane with vesicles in the obsidian (Figures 4B, C). Microlites are unoriented in ∼5% of samples with mainly ellipsoid vesicles (Figure 4G). In samples where distorted vesicles are the dominant type, microlites are usually either poorly aligned or are aligned in a planar fashion as described below (Figures 4D–F).
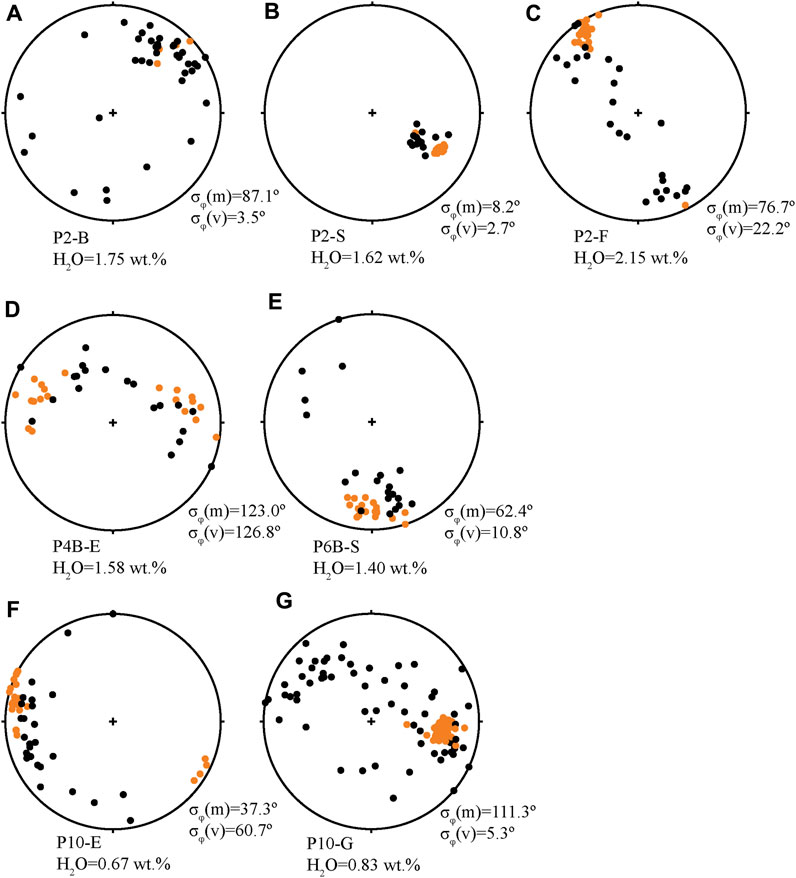
FIGURE 4. Representative lower hemisphere stereonet projections of microlite and vesicle orientations in obsidians. Microlites are black circles, vesicles are orange circles. Dissolved H2O (wt%) and microlite and vesicle σφ are listed for each sample. (A) Sample P2-B is an example of an obsidian with a relatively high dissolved volatile concentration and mainly spherical vesicles. Microlites are unoriented. (B) Sample P2-S and (C) sample P2-F are examples of obsidians with high dissolved volatile concentrations (higher equilibration pressure) and ellipsoidal-type vesicles. P2-S has very well oriented microlites and vesicles and sample P2-F has well-oriented vesicles and microlites are oriented in a great circle plane with the vesicles. (D) Sample P4B-E is an example of an obsidian with distorted vesicles that have been stretched. The vesicles and microlites both have high σφ, but they are oriented together in the same great circle plane. (E) Sample P6B-S and (F) sample P10-E are examples of samples with distorted vesicles, P6B-S with a relatively high H2O concentration and P10-E with low. In these two examples, vesicles are not as well oriented as in samples with ellipsoid or spherical vesicles, and microlites are variably oriented (some are oriented with respect to vesicles, and some are not). (G) Sample P10-G is an example of an obsidian with relatively low dissolved volatile concentrations and ellipsoidal and distorted type vesicles. It has well oriented vesicles and unoriented microlites.
Whereas a low σφ and σθ is a good indication of microlites being aligned in a “lineated” fashion, these metrics are a poor indicator of microlite alignment in a “foliated” fashion. The situation where microlites have high σφ but occupy a plane is revealed by the stereonets where the data plot along a great circle (e.g., Figures 4C, D). These diagrams also show the relationship, or lack thereof, between microlite and vesicle alignments within a sample. In cases where microlites are oriented in a plane that includes the vesicles, we consider the planar alignment as having been caused by the same stress that aligned the vesicles.
There are two types of banding in the obsidians, defined by vesicles and/or microlites. In vesicle banded obsidians, MND do not vary within or between the bands, but in some cases, microlite orientations differ between adjacent bands as well as the glass between them (e.g., Figure 5). In clasts with bands defined by different microlite abundances, clinopyroxene MND are two orders of magnitude greater within the bands (105 vs. 107 cm−3), and alkali feldspar MND are one order of magnitude greater (104 vs. 105 cm−3). Microlites are also ∼15–30% larger within the bands than outside of the bands.
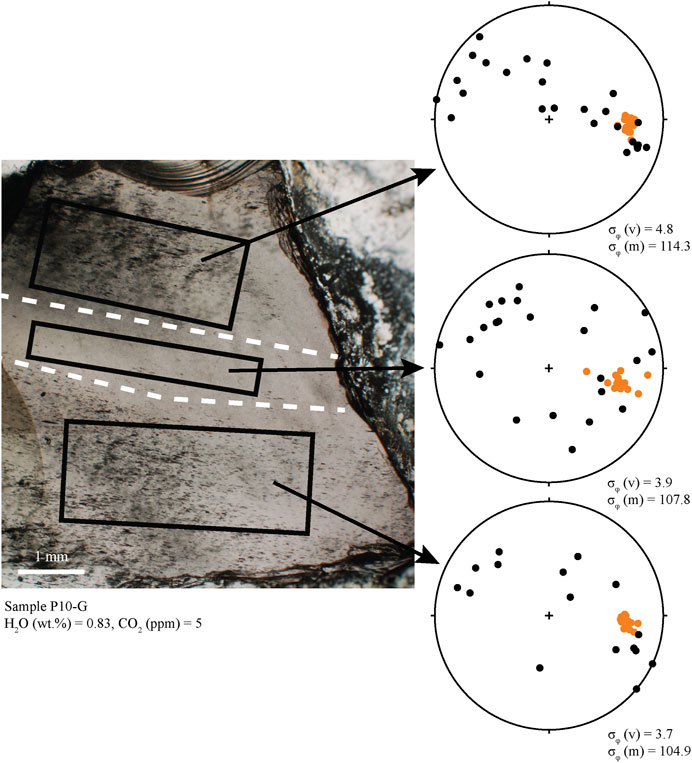
FIGURE 5. Photomicrograph of sample P10-G. This sample has three distinct textural regions separated in the photo with dashed white lines. Lower hemisphere stereonet projections show the orientations of long axes of microlites and vesicles. Colors are the same as in Figure 4. Vesicles (mostly ellipsoid) in each region are strongly aligned (low σφ). Microlites are not well aligned (high σφ) and are either randomly oriented (middle section) or are aligned roughly planar with vesicles (top section). We interpret this as demonstrating three fragments that sintered together. Compression during sintering deformed vesicles by pure shear into a single alignment.
3.2 Experiments
The experiments yielded a brownish glass with <1% microlites of clinopyroxene, alkali feldspar, and Fe-Ti oxides (Figure 2F). In all experiments, the rhyolite powder sintered into coherent glass, although relict grain boundaries are often visible. Those boundaries are often marked by tiny Fe-Ti oxide microlites, especially at junctions between multiple grains, as also seen in experiments by Castro et al. (2005). We assume that all vesicles in the experiments began as distorted relict spaces between ash particles that then evolved into spherical form, and our results indicate that they had sufficient time to relax (Gardner et al., 2018).
3.2.1 Microlite number densities and morphologies
Almost all clinopyroxenes grown are euhedral to subhedral rod-shaped crystals, 2–24 µm in length and <1–3 µm in width. A few (∼1%) occur in clusters (Figure 6A). Fe-Ti oxide microlites are ubiquitous (Table 3). They occur as euhedral to subhedral crystals <8 µm in size. Alkali feldspar occurs ∼95% of the time as blocky, subhedral, or tabular crystals, sometimes as intergrown pairs, 2–18 µm in size. The remaining ∼5% are swallowtail crystals (Figure 6B).
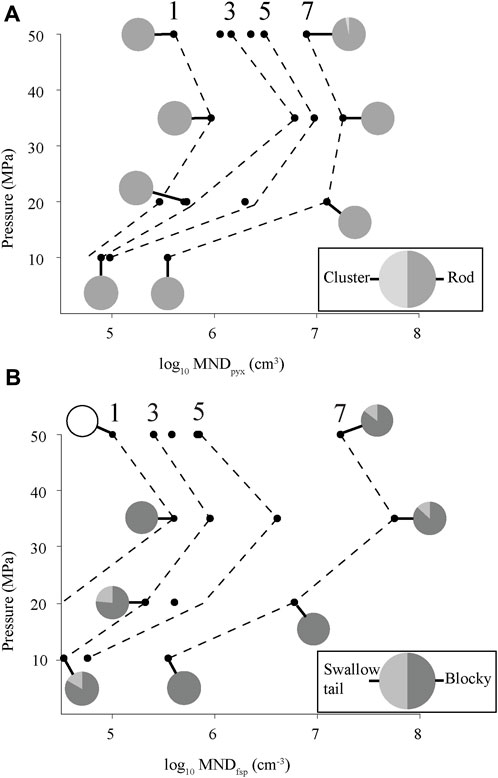
FIGURE 6. Experimental MND for (A) clinopyroxene and (B) alkali feldspar as a function of pressure and time. Dashed contour lines with numbers on top show experimental MND as a function of time (in hours) of experiments at different pressures. Contours are approximate. Pie charts show relative abundances of crystal morphologies at different pressures and times. Empty pie chart in (B) = no feldspar microlites found in this sample.
At a given pressure, MND increases systematically with time (Figure 6). Over 7 hours the alkali feldspar and clinopyroxene MND increase by two orders of magnitude (105 to 107 cm−3) at 50, 35, and 20 MPa, and one order of magnitude (104–105 cm−3) at 10 MPa. Fe-Ti oxide MND increase by one order of magnitude (107–108 cm−3) at 50, 35, and 20 MPa, and less than an order of magnitude at 10 MPa (Table 3). Interestingly, for a given experimental duration, there is a peak in MND ∼35 MPa for all mineral phases (Figure 6). Browne and Gardner (2006) found a similar peak in microlite growth rates in hornblende reaction rims at moderate pressures (60–70 MPa). We interpret these trends as a competition between viscosity and supersaturation. At low H2O contents (low pressure) nucleation is hindered by the higher viscosity of the melt. At high H2O contents (high pressure), nucleation rate is slow, because of lower supersaturation.
3.2.2 Microlite alignments
We measured orientations of 109 microlites in six experiments that cover the ranges of experimental pressures and times (Table 3). In all six, microlites are poorly aligned as shown by their high σφ (83⁰–119.1⁰) and σθ (10.1⁰–15.7⁰) values.
4 Discussion
Our experiments of sintering of North Mono rhyolitic ash produced dense obsidian with MND of 105.6–108.8 cm−3. These new results place constraints on the time that each pyroclast (or part of a pyroclast) spent in the conduit (Figure 7). Except for samples from layer P1, which have much higher MNDs, the MNDs from the natural pyroclasts could have been produced within minutes to ∼7 h. This timescale of hours agrees with the findings of Watkins et al. (2017), who modeled the post-sintering diffusion timescales needed to explain volatile concentration gradients within pyroclasts and found them to be
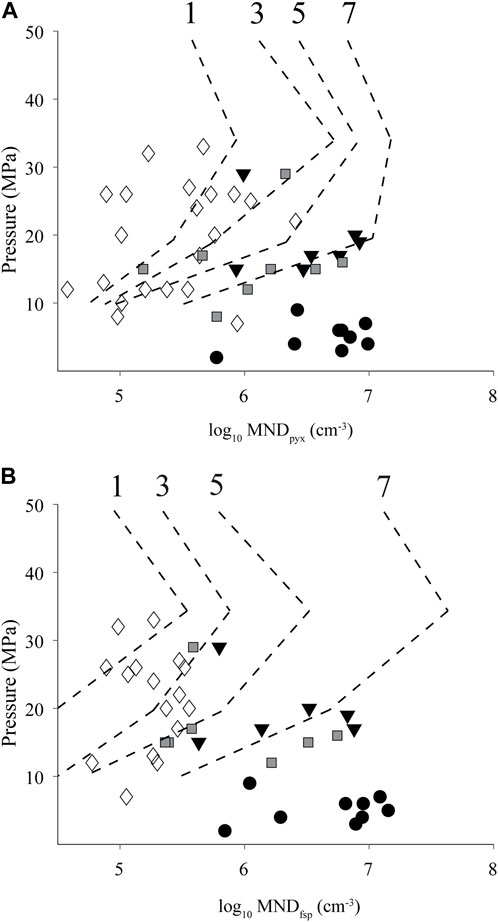
FIGURE 7. North Mono MND for (A) clinopyroxene and (B) alkali feldspar as a function of pressure. Note increasing MND with lower pressures (higher in tephra deposit). Pressure calculated from dissolved H2O concentrations using the model of Liu et al. (2005). Dashed contour lines with numbers on top are experimental MND as a function of time from Figure 6. Key to symbols: P2-open diamonds, P4-black triangles, P6-gray squares, P10-black circles.
4.1 Interpretations of orientations
Microlite σφ and σθ are variable in every layer (Table 1). They do not show correlations with dissolved H2O concentrations or stratigraphy (Figure 8). Microlite orientations are thought to record accumulated strain (Manga, 1998; Castro et al., 2002). The ability of an obsidian clast to accommodate strain is related to its viscosity (η). Dissolved volatile concentrations, especially H2O, strongly influences viscosity, with greater dissolved H2O concentrations leading to lower viscosity (Dingwell et al., 1996; Hess and Dingwell, 1996). Although CO2 can also affect viscosity, the CO2 concentrations in these obsidians are low enough that their impact on viscosities is negligible. For the obsidians with the highest H2O concentrations (2.15 wt%), we estimate η≈106 Pa s during their final equilibration (T=800⁰; C, Hess and Dingwell, 1996). For obsidians with the lowest H2O concentrations (0.49 wt%), we estimate η≈108. Both values are below the viscosity of the glass transition (Tg) ∼1012 Pa s for silicic melts (Gottsmann et al., 2002). The presence of crystals in melts can also affect viscosity. Given that most obsidian clasts from layers P2-P10 contain <1 vol% microlites, we presume they had negligible effect on viscosity.
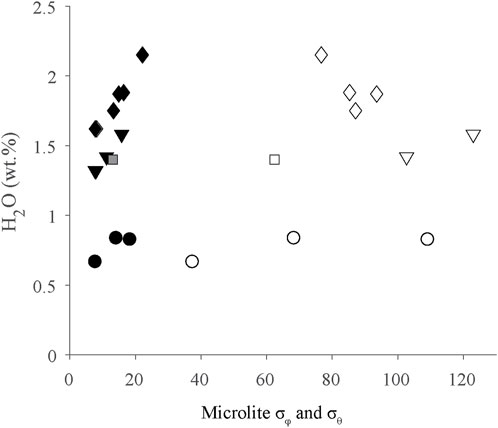
FIGURE 8. Microlite σφ and σθ as a function of dissolved H2O concentrations plotted by stratigraphic unit. Key to symbols: P2-diamonds, P4-triangles, P6-squares, P10-circles. Additionally, open symbols=standard deviation of trend (σφ), filled symbols=standard deviation of plunge (σθ). As discussed in the text, σφ and σθ values show no stratigraphic trends.
Differences in viscosity were likely important in the ability of vesicles to become oriented when subjected to shear stress. For vesicles to retain stretched-distorted or ellipsoidal shapes, the strain rate in the conduit must have exceeded the relaxation timescales of the vesicles, and the obsidians must have cooled to Tg before relaxation could occur. A vesicle’s relaxation timescale is a direct function of the radius of curvature of the vesicle, the surface tension between the vesicle and the surrounding medium, and the viscosity (Rust et al., 2004). Variable amounts of relaxation and shearing could have produced all the vesicles textures, as well as their relationships to microlite orientations observed in the obsidians. Most vesicles in the obsidians are inferred to begin as unoriented distorted vesicles; remnants of interstitial spaces between sintered fragments of ash (Gardner et al., 2017) (Figure 9A). The process of amalgamating different ash particles together should lead to unoriented microlites as well (Figure 9A). Given this initial condition, if such a clast were not subjected to strain, the vesicles would relax to spherical and microlites would remain unoriented (Figure 9B). This can explain why, in general, microlites are less oriented in samples with dominantly spherical vesicles (e.g., Figure 4A). If, however, the same clast were assembled and then subjected to shear strain, the vesicles would become elongated to ellipsoids (Figure 9C). Strain will affect vesicles more than microlites, so for microlites to become well oriented, they must be subjected to greater strain than that required for vesicles. On the wall of an eruptive conduit, multiple episodes of strain in a similar direction, with periods of vesicle relaxation in between, would cause microlites to become progressively better oriented and aligned in a similar direction as vesicles. A scenario such as this can explain why microlites are more aligned in obsidians with ellipsoidal vesicles (Figures 4B, C).
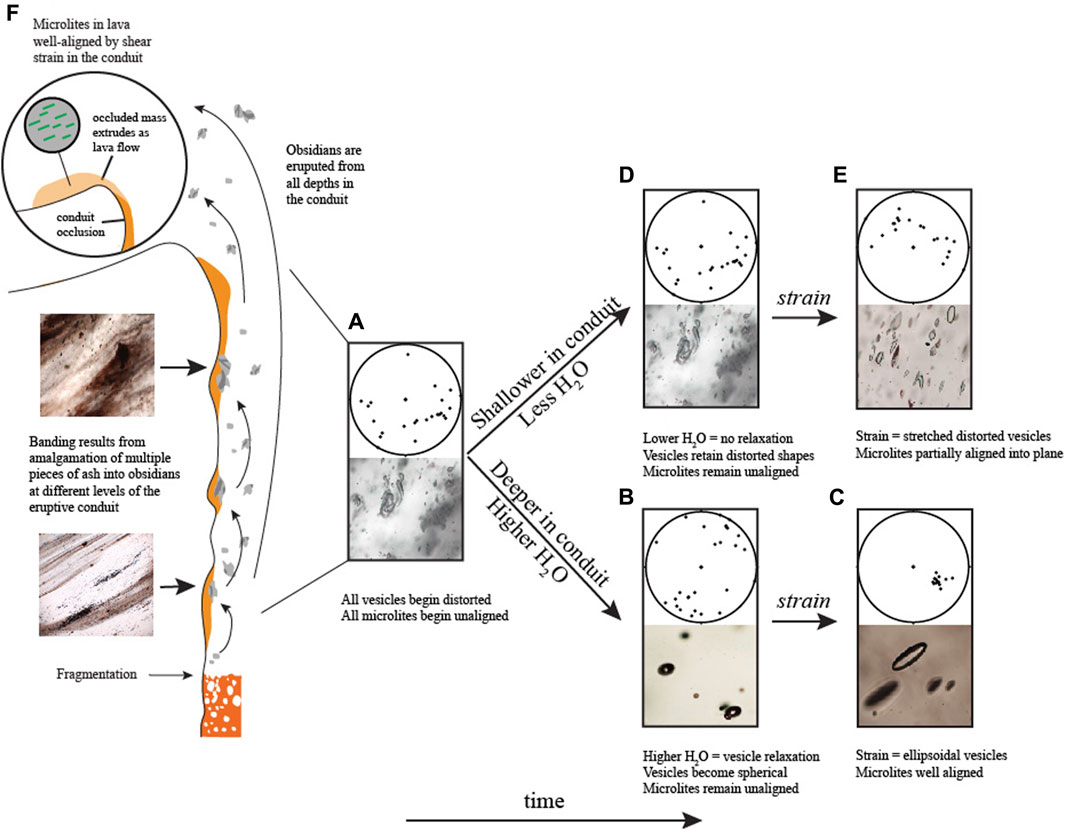
FIGURE 9. Schematic of physical characteristics of obsidian pyroclasts produced in the eruptive conduit. Stereonets show lower hemisphere projection of microlite orientations. Amalgamation of multiple pieces of ash results in visible banding in obsidians from all depths in the conduit. (A) As discussed in the text, amalgamation and sintering of ash fragments into a single obsidian produces a clast with initially distorted vesicles and unaligned microlites. (B) At higher H2O contents (deeper in the conduit) and under no strain, vesicles will tend to relax to spherical and microlites will remain unoriented. This explains why obsidians with higher H2O have more spherical vesicles and unaligned microlites. (C) Under strain, spherical vesicles will elongate to ellipsoidal shapes and microlites will rotate and become well aligned. (D) At lower H2O contents (shallower in the conduit), higher viscosity impedes vesicle relaxation and vesicles will retain their distorted shapes and microlites will remain unaligned. (E) Under strain, these distorted vesicles will stretch and microlites will become partially aligned. (F) During the transition to hybrid behavior, sintered obsidian blocking the conduit experiences greater shear stresses. Microlites in the sintered mass become well aligned. Degassed lava flows extruding from the conduit carry the well-aligned microlites away from the vent.
If sintering occurs at shallow levels in the conduit where H2O concentrations are expected to be relatively low, the higher viscosities and thus longer relaxation timescales would impede vesicle relaxation. In this scenario, the initially cuspate vesicles would be more likely to retain their distorted morphologies and microlites would remain unoriented (Figure 9D). If such a clast were to be strained, then the distorted vesicles would elongate into stretched-distorted shapes (e.g., Gardner et al., 2017) and the microlites could also become oriented, as observed in some cases (Figure 9E; Figure 4D).
In some cases, vesicles in different bands are elongated and well oriented, but microlites in those same bands are either unoriented or are oriented into planes with the vesicles in that band (e.g., Figure 5). We interpret samples such as these to have been under active strain when they were erupted and that vesicles deformed in response to high strain rates during eruption. Microlites either did not have enough time to become well oriented or the high viscosity inhibited their rotation, or a combination of both.
4.2 Origins of obsidian pyroclasts through the eruption sequence
The concentrations of dissolved volatiles define the pressures (depths) at which obsidians last sintered, stalled, and partially equilibrated with the exsolved gas phase. Similar to microlite populations between bands in the obsidians, volatile concentrations also differ between bands (Watkins et al., 2017). This is a reflection of the complex nature of these clasts and demonstrates that the separate pieces that comprise each clast have different P-t histories.
Obsidians with greater volatile concentrations have generally fewer microlites (Figure 1), and spherical or ellipsoidal vesicles. We interpret these obsidians as having last sintered at greater depths (more H2O-CO2) and having spent less time in the conduit (lower MND). The two obsidian clasts that Watkins et al. (2017) analyzed in detail in their investigation corroborate our interpretations. The obsidian with a modeled sintering timescale of
Early in the North Mono eruption the wide ranges in volatile concentrations and the relatively lower numbers of microlites in pyroclastic obsidians indicate that ash was sintering at many different depths in the conduit, and obsidians in layer P2 were produced in < ∼3 h (Figure 7). As the eruption progressed ash was still sintering throughout the conduit, evidenced by wide ranges of volatile concentrations (Figure 1). Greater numbers of microlites in layer P4 and P6 obsidians indicate that obsidians were assembled and stagnated for timeframes up to ∼7 h (Figure 7).
During the final stages of the explosive phase of the North Mono eruption (layer P10), most obsidians had much lower volatile concentrations (Figure 1), showing that they equilibrated at shallow depths prior to being ejected from the conduit. Generally greater MND argue that most of these obsidian clasts were assembled and stagnated for timeframes up to ∼7 h, possibly longer (Figure 7). A few obsidians, however, have relatively high volatile concentrations and indicate that ash was continuing to sinter over a range of depths in the conduit (Table 1).
The progression through the tephra deposit of generally decreasing volatile concentrations and increasing MND (increasing time in the conduit) is what would be expected to be produced from an eruption scenario proposed by Wadsworth et al. (2022). Gradual occlusion of the eruptive conduit would cause obsidian to spend more time in the conduit and more opportunities for multiple cycles of fragmentation and resintering. During the transition to hybrid behavior, the conduit would have become completely blocked by sintered ash and obsidian. In this sintered mass, obsidian would continue to degas leading to lower dissolved volatile concentrations such as those in the North Mono lavas. It would also experience greater shear stresses that would serve to align the microlites into better orientations than those in any of the obsidian pyroclasts (Figure 9F), which is what we observe in the North Mono lavas. Continued fragmentation and degassing in the active conduit below the sintered mass would cause it to extrude as lava or as a dome (Wadsworth et al., 2022).
Eruption of the North Mono tephra deposit ended with the extrusion of five separate domes and coulees (Sieh and Bursik, 1986). The three most prominent domes are North Coulee, North Dome/Northwest Coulee, and Panum Dome (Sieh and Bursik, 1986; Kelleher and Cameron, 1990; Barnes et al., 2014). Befus et al. (2015) found that microlites in lavas from the Northwest Coulee and South Dome (a satellite of Panum Dome) of the North Mono eruption, are well-oriented and they were aligned by strain in the volcanic conduit (Figure 9F). In their 16 samples of the North Mono lavas, microlite σφ=18⁰–59⁰ (avg. 34⁰) and microlite σθ=15⁰–40⁰ (avg. 24⁰) (Befus et al., 2015). By way of comparison, in pyroclastic obsidians from layer P10, average microlite σφ=86.5⁰ and average σθ=15.3⁰ (Table 1). Whereas σθ values are similar between the two, σφ values show that the microlites in the lavas are significantly more aligned. Dissolved volatiles concentrations measured in these lavas range from 0.12 to 0.33 wt% H2O and 1–2 ppm CO2 (Newman et al., 1988; Barnes et al., 2014; Befus et al., 2015). In the obsidian pyroclasts from layer P10, dissolved H2O=0.49–1.80 wt% and CO2=3–13 ppm.
The lavas are more degassed than pyroclastic obsidian from layer P10. MND between the two, however, are equivalent, indicating that obsidian in the lavas was produced over similar timescales as the pyroclasts in layer P10. This suggests that during the eruption of layer P10 the eruptive conduit finally became fully occluded by sintered ash, consistent with the Wadsworth et al. (2020) model. Pyroclasts were no longer able to be fragmented from the mass blocking the conduit, which continued to degas and then extruded as a lava.
4.3 Opening event of the North Mono eruption
Layer P1 is the first layer of the North Mono tephra deposit. It is the most voluminous layer, comprising ∼10% of the total pyroclastic fall volume (Sieh and Bursik, 1986). Obsidian pyroclasts from layer P1 are distinct from those in the rest of the deposit. Vesicles are absent, and MND values are one to two orders of magnitude greater, yet microlites are unoriented. Dissolved volatile concentrations, however, overlap those in the other pyroclasts (Table 1).
The lack of microlite orientations, and the ubiquitous occurrence of Fe-Ti oxide trichites, suggest that these obsidians formed in a static environment. We thus posit that these obsidians are the products of a batch of melt that had intruded at shallow depths, possibly in propagating dikes before the beginning of the eruption, where it stalled. Equilibrium pressures for these obsidians calculated from dissolved H2O-CO2 concentrations, using the model of Liu et al. (2005), range from ∼1 to 20 MPa (avg. ∼8.5 MPa). Assuming a granitic composition crust this suggests that these clasts formed at an average depth of ∼350 m. As the melt cooled, any vesicles present were resorbed. This allowed time (hours to days, possibly weeks) for more nucleation and growth of microlites in a fixed environment, including the needle-shaped morphologies. When the main eruption started, pieces of this intrusion were entrained in the mixture erupting out of the vent.
5 Conclusion
Obsidian pyroclasts from the 1340 C.E. North Mono eruption record processes that occurred in an explosively erupting conduit. Detailed analysis of microlites in these obsidians show that all microlite numbers increase with time and decrease with dissolved volatile concentrations through the eruption. Each obsidian pyroclast contains a mixture of microlite morphologies that are correlated with vesicle type in the obsidian pyroclasts (spherical, ellipsoidal, and distorted). Experimentally, we reproduced most of the microlite number densities in the obsidians in ≤∼7 h. In contrast to the North Mono obsidians, microlites in the experiments are unoriented and occur in a single morphology, and vesicles are spherical. We therefore conclude that the North Mono obsidians microlites record natural processes beyond what is accessible to static experiments. For example, a given obsidian pyroclast can be assembled from many different pieces of ash that sintered together throughout the eruptive conduit, each with their own P-T-t path and strain histories. This is reflected by distinct domains in dissolved volatile concentrations, vesicle textures, and microlite numbers, morphologies, and orientations in the resultant obsidians. In its opening phase, the North Mono eruption entrained bits of obsidian that had formed as magma stalled at shallow crustal depths. During most of the explosive eruption, wide ranges of volatile concentrations indicate that obsidian pyroclasts were sintering in ∼1–7 h and were being erupted from many depths in the conduit. During the later phases of the eruption, the obsidian pyroclasts became more degassed and underwent longer periods of stalling before being erupted from shallow depths. As the eruptive conduit became blocked by sintering ash, high strain rates caused microlites to become well aligned. Continued fragmentation and degassing of ash at depth led to the extrusion of sintered degassed lavas with well-oriented microlites.
Data availability statement
The original contributions presented in the study are included in the article/Supplementary Material, further inquiries can be directed to the corresponding author.
Author contributions
WA: conceptualization, data collection and analysis, writing and editing; JG: conceptualization, data analysis, review and editing; JW: review and editing; ML: data collection and analysis. All authors contributed to the article and approved the submitted version.
Funding
JG was supported by the National Science Foundation under NSF Grant No. EAR-1725186. JW was supported by the National Science Foundation under NSF Grant No. EAR-2024510.
Acknowledgments
The authors thank Fabian Wadsworth and Ed Llewellin for assistance in the field, and Victor Garza for assisting with data collection. We thank Kenny Befus for his technical expertise and advice about many parts of this study. We would also like to thank Omero (Phil) Orlandini, Nicholas Meszaros, and Daniel Campos for assistance with the Scanning Electron Microscope (SEM) at the University of Texas at Austin. Helpful reviews from Mathieu Colombier, Stephan Kolzenburg, Massimo D'Antonio, and Stuart Kenderes improved this manuscript.
Conflict of interest
The authors declare that the research was conducted in the absence of any commercial or financial relationships that could be construed as a potential conflict of interest.
Publisher’s note
All claims expressed in this article are solely those of the authors and do not necessarily represent those of their affiliated organizations, or those of the publisher, the editors and the reviewers. Any product that may be evaluated in this article, or claim that may be made by its manufacturer, is not guaranteed or endorsed by the publisher.
Supplementary material
The Supplementary Material for this article can be found online at: https://www.frontiersin.org/articles/10.3389/feart.2023.1183923/full#supplementary-material
References
Allmendinger, R., Cardozo, N., and Fisher, D. (2013). Structural geology algorithms: vectors and tensors. Cambridge, England: Cambridge University Press.
Anderson, D., and Lindsley, D. (1988). Internally consistent solution models for Fe-Mg-Mn-Ti oxides: Fe-Ti oxides. Am. Mineral. 73, 714–726.
Barnes, J., Prather, T., Cisneros, M., Befus, K., Gardner, J., and Larson, T. (2014). Stable chlorine isotope behavior during volcanic degassing of H2O and CO2 at Mono Craters, CA. Bull. Volcanol. 76, 805. doi:10.1007/s00445-014-0805-y
Befus, K., Gardner, J., and Zincke, R. (2012). Analyzing water contents in unexposed glass inclusions in quartz crystals. Am. Mineral. 97, 1898–1904. doi:10.2138/am.2012.4206
Befus, K., Manga, M., Gardner, J., and Williams, M. (2015). Ascent and emplacement dynamics of obsidian lavas inferred from microlite textures. Bull. Volcanol. 77, 88. doi:10.1007/s00445-015-0971-6
Befus, K., Zinke, R., Jordan, J., Manga, M., and Gardner, J. (2014). Pre-eruptive storage conditions and eruption dynamics of a small rhyolite dome: douglas Knob, Yellowstone volcanic field, USA. Bull. Volcanol. 76, 808. doi:10.1007/s00445-014-0808-8
Behrens, H., and Schmidt, M. O. (1998). Infrared spectroscopy of hydrous silicic glasses at temperatures up to 600°C and implications for the incorporation and dynamics of water in glasses. Neues Jahrb. für Mineral. 172, 203–226. doi:10.1127/njma/172/1998/203
Behrens, H., Tamic, N., and Holtz, F. (2004). Determination of the molar absorption coefficient for the infrared absorption band of CO2 in rhyolitic glasses. Am. Mineral. 89, 301–306. doi:10.2138/am-2004-2-307
Browne, B., and Gardner, J. (2006). The influence of magma ascent path on the texture, mineralogy, and formation of hornblende reaction rims. Earth. Planet. Sci. 246, 161–176. doi:10.1016/j.epsl.2006.05.006
Bursik, M. (1993). Subplinian eruption mechanisms inferred from volatile and clast dispersal data. J. Volcanol. Geotherm. Res. 55, 57–70. doi:10.1016/0377-0273(93)90031-l
Cardozo, N., and Allmendinger, R. (2013). Spherical projections with OSXStereonet. Comp. Geosci. 51, 193–205. doi:10.1016/j.cageo.2012.07.021
Carmichael, I. (1966). The Iron-Titanium oxides of salic volcanic rocks and their associated ferromagnesian silicates. Contrib. Mineral. Petrol. 14, 36–64. doi:10.1007/bf00370985
Castro, J., Schipper, C., Mueller, S., Militzer, A., Amigo, A., Parejas, C. S., et al. (2013). Storage and eruption of near-liquidus rhyolite magma at Cordón Caulle, Chile. Bull. Volcanol. 75, 702. doi:10.1007/s00445-013-0702-9
Castro, J., Bindeman, I., Tuffen, H., and Schipper, C. (2014). Explosive origin of silicic lava: textural and δD-H2O evidence for pyroclastic degassing during rhyolite effusion. Earth Planet. Sci. Lett. 405, 52–61. doi:10.1016/j.epsl.2014.08.012
Castro, J., Cordonnier, B., Tuffen, H., Tobin, M., Puskar, L., Martin, M., et al. (2012). The role of melt-fracture degassing in defusing explosive rhyolite eruptions at volcán Chaitén. Earth Planet. Sci. Lett. 333–334, 63–69. doi:10.1016/j.epsl.2012.04.024
Castro, J., Dingwell, D., Nichols, A., and Gardner, J. (2005). “New insights on the origins of flow bands in obsidian,” in Kinematics and dynamics of lava flows. Editors M. Manga, and G. Ventura (Geol Soc Amer Spec Pap), 55–65. 396.
Castro, J., and Dingwell, D. (2009). Rapid ascent of rhyolitic magma at Chaitén volcano, Chile. Nat. Lett. 461, 780–783. doi:10.1038/nature08458
Castro, J., Manga, M., and Cashman, K. (2002). Dynamics of obsidian flows inferred from microstructures: insights from microlite preferred orientations. Earth Planet. Sci. Lett. 199, 211–226. doi:10.1016/s0012-821x(02)00559-9
Dingwell, D., Romano, C., and Hess, K.-U. (1996). The effect of water on the viscosity of a haplogranitic melt under P-T-X conditions relevant to silicic volcanism. Contrib. Mineral. Petrol. 124, 19–28. doi:10.1007/s004100050170
Dobson, P., Epstein, S., and Stolper, E. (1989). Hydrogen isotope fractionation between co-existing vapor and silicate glasses and melts at low pressure. Geochim. Cosmochim. Acta 53, 2723–2730. doi:10.1016/0016-7037(89)90143-9
Gardner, J. (2007). Bubble coalescence in rhyolitic melts during decompression from high pressure. J. Volcanol. Geotherm. Res. 166, 161–176. doi:10.1016/j.jvolgeores.2007.07.006
Gardner, J., Llewellin, E., Watkins, J., and Befus, K. (2017). Formation of obsidian pyroclasts by sintering of ash particles in the volcanic conduit. Earth Planet. Sci. Lett. 459, 252–263. doi:10.1016/j.epsl.2016.11.037
Gardner, J., Wadsworth, F., Llewellin, E., Watkins, J., and Coumans, J. (2018). Experimental sintering of ash at conduit conditions and implications for the longevity of tuffisites. Bull. Volcanol. 80, 23. doi:10.1007/s00445-018-1202-8
Gardner, J., Wadsworth, F., Llewellin, E., Watkins, J., and Coumans, J. (2019). Experimental constraints on the textures and origin of obsidian pyroclasts. Bull. Volcanol. 81, 22. doi:10.1007/s00445-019-1283-z
Gonnermann, H., Manga, M., Westrich, H. R., and Price, R. H. (2003). Non-explosive silicic volcanism. Nature 323, 598–602. doi:10.1038/323598a0
Gottsmann, J., Giordano, D., and Dingwell, D. (2002). Predicting shear viscosity during volcanic processes at the glass transition: a calorimetric calibration. Earth Planet. Sci. Lett. 198, 417–427. doi:10.1016/s0012-821x(02)00522-8
Heap, M., Tuffen, H., Wadsworth, F., Reuschlé, T., Castro, J., and Schipper, C. (2019). The permeability evolution of tuffisites and implications for outgassing through dense rhyolitic magma. J. Geophys. Res. Solid Earth 124, 8281–8299. doi:10.1029/2018jb017035
Hess, K.-U., and Dingwell, D. (1996). Viscosities of hydrous leucogranitic melts: a non-Arrhenian model. Am. Min. 81, 1297–1300.
Ihinger, P. D., Hervig, R. L., and McMillan, P. F. (1994). “Analytical methods for volatiles in glasses,” in Volatiles in magmas, rev. In min. Editors M. R. Carroll, and J. R. Holloway, 67–121. 30.
Kelleher, P., and Cameron, K. (1990). The geochemistry of the Mono Craters-Mono Lake islands volcanic complex, eastern California. J. Geophys. Res. 95 (17), 17643–17659. doi:10.1029/jb095ib11p17643
Lara, L. (2009). The 2008 eruptions of the Chaitén volcano, Chile: a preliminary report. Andean Geol. 36, 125–129.
Leschik, M., Heide, G., Frischat, G. H., Behrens, H., Wiedenbeck, M., Wagner, N., et al. (2004). Determinination of H2O and D2O contents in rhyolitic glasses. Phys. Chem. Glasses-Eur. J. Glass Sci. Tech. Part B 45, 238–251.
Liu, Y., Zhang, Y., and Behrens, H. (2005). Solubility of H2O in rhyolitic melts at low pressures and a new empirical model for mixed H2O–CO2 solubility in rhyolitic melts. J. Volcanol. Geotherm. Res. 143, 219–235. doi:10.1016/j.jvolgeores.2004.09.019
Manga, M. (1998). Orientation distribution of microlites in obsidian. J. Volcanol. Geotherm. Res. 86, 107–115. doi:10.1016/s0377-0273(98)00084-5
Newman, S., Epstein, S., and Stolper, E. (1988). Water, carbon dioxide, and hydrogen isotopes in glasses from the ca. 1340 A.D. eruption of the mono craters, california: constraints on degassing phenomena and initial volatile content. J. Volcanol. Geotherm. Res. 35, 75–96. doi:10.1016/0377-0273(88)90007-8
Newman, S., Stolper, E., and Epstein, S. (1986). Measurement of water in rhyolitic glasses: calibration of an infrared spectroscopic technique. Am. Mineral. 71, 1527–1541.
Okumura, S., Nakamura, M., and Nakashima, S. (2003). Determination of molar absorptivity of IR fundamental OH-stretching vibration in rhyolitic glasses. Am. Min. 88, 1657–1662. doi:10.2138/am-2003-11-1204
Rust, A., Cashman, K., and Wallace, P. (2004). Magma degassing buffered by vapor flow through brecciated conduit margins. Geology 32, 349–352. doi:10.1130/g20388.2
Saubin, E., Tuffen, H., Gurioli, L., Owen, J., Castro, J., Berlo, K., et al. (2016). Conduit dynamics in transitional rhyolitic activity recorded by tuffisite vein textures from the 2008–2009 Chaitén eruption. Front. Earth Sci. 4, 59. doi:10.3389/feart.2016.00059
Schipper, C., Castro, J., Tuffen, H., James, M., and How, P. (2013). Shallow vent architecture during hybrid explosive–effusive activity at Cordón Caulle (Chile, 2011–12): evidence from direct observations and pyroclast textures. J. Volcanol. Geotherm. Res. 262, 25–37. doi:10.1016/j.jvolgeores.2013.06.005
Sieh, K., and Bursik, M. (1986). Most recent eruption of the Mono Craters, eastern central California. J. Geophys. Res. 91 (12), 12539–12571. doi:10.1029/jb091ib12p12539
Skinner, C. (1983). Obsidian studies in Oregon: an investigation of selected methods of obsidian characterization utilizing obsidian collected at prehistoric quarry sites in Oregon. Master’s thesis. Oregon: University of Oregon.
Taylor, B., Eichelberger, J., and Westrich, H. (1983). Hydrogen isotopic evidence of rhyolitic magma degassing during shallow intrusion and eruption. Nature 306, 541–545. doi:10.1038/306541a0
Wadsworth, F., Llewellin, E., Castro, J., Tuffen, H., Schipper, C., Gardner, J., et al. (2022). A reappraisal of explosive-effusive silicic eruption dynamics: syn-eruptive assembly of lava from the products of cryptic fragmentation. J. Volcanol. Geotherm. Res. 432, 107672. doi:10.1016/j.jvolgeores.2022.107672
Wadsworth, F., Llewellin, E., Vasseur, J., Gardner, J., and Tuffen, H. (2020). Explosive-effusive volcanic eruption transitions caused by sintering. Sci. Adv. 6, eaba7940. doi:10.1126/sciadv.aba7940
Watkins, J., Gardner, J., and Befus, K. (2017). Nonequilibrium degassing, regassing, and vapor fluxing in magmatic feeder systems. Geology 45, 183–186. doi:10.1130/g38501.1
Watkins, J., Manga, M., and Depaolo, D. (2012). Bubble geobarometry: a record of pressure changes, degassing, and regassing at Mono Craters, California. Geology 40, 699–702. doi:10.1130/g33027.1
Keywords: explosive-effusive, rhyolitic, obsidian, microlite, sintering, volatiles
Citation: Aubin WL, Gardner JE, Watkins JM and Lloyd MH (2023) Construction of obsidian during explosive-effusive eruptions: insights from microlite crystals in obsidian pyroclasts. Front. Earth Sci. 11:1183923. doi: 10.3389/feart.2023.1183923
Received: 10 March 2023; Accepted: 02 October 2023;
Published: 12 October 2023.
Edited by:
Hugo Delgado Granados, National Autonomous University of Mexico, MexicoReviewed by:
Massimo D'Antonio, University of Naples Federico II, ItalyMathieu Colombier, Department of Earth and Environmental Sciences, Ludwig Maximilian University of Munich, Germany
Stuart Kenderes, Purdue University Indianapolis, United States
Stephan Kolzenburg, University at Buffalo, United States
Copyright © 2023 Aubin, Gardner, Watkins and Lloyd. This is an open-access article distributed under the terms of the Creative Commons Attribution License (CC BY). The use, distribution or reproduction in other forums is permitted, provided the original author(s) and the copyright owner(s) are credited and that the original publication in this journal is cited, in accordance with accepted academic practice. No use, distribution or reproduction is permitted which does not comply with these terms.
*Correspondence: Wade L. Aubin, wade.aubin@utexas.edu