- Shandong Earthquake Agency, Jinan, China
Seismic activities can be seen as the composition of background and clustering earthquakes. It is important to identify seismicity clusters from background events. Based on the Nearest Neighbour Distance algorithm proposed by Zaliapin, we use the Gaussian mixture model (GMM) to fit its spatiotemporal distribution and use the probability corresponding to clustering seismicity in the GMM model as the clustering ratio. After testing with synthetic catalogues under the ETAS (epidemic-type aftershock sequence) model, We believe the method can discriminate cluster events from randomly occurring background seismicity in a more physical background. We investigate the seismicity and its clustering features before the M6.6 Jinggu earthquake in Yunnan Province, China on 7 October 2014. Our results show the following: 1) The seismogenic process of this strong earthquake has three stages, which are already described by the IPE model (the model is similiar to dilatancy diffusion model, growth of cracks is also involved but diffusion of water in and out of the focal region is not required); 2) The main shock might have been caused by the breaking of a local locked barrier in the hypocentre, and the meta-instability stage was sustained for about 1 year on the fault. From this study, we conclude that the evolution of seismicity clustering features can reflect changes in stress in the crust, and it is closely connected to the seismogenic process of a strong earthquake.
1 Introduction
Seismic data can be regarded as a combination of background and clustering earthquakes (Zhuang et al., 2005). These two parts have different tectonic genesis and physical mechanisms (Zhuang et al., 2005; Jagla and Kolton, 2010; Hardebeck, 2021): Background earthquakes are assumed to be mostly caused by secular, tectonic loading or, in the case of seismic swarms, by stress transients that are not caused by previous earthquakes; Clustering earthquakes triggered by static or dynamic stress changes, seismically-activated fluid flows, after-slip, etc., hence by mechanical processes that are at least partly controlled by previous earthquakes (van Stiphout et al., 2012). The identification and statistical characterisation of seismic clusters may provide useful insights about the features of seismic energy release and their relation to physical properties of faults (Peresan and Gentili, 2018). The identification of clustering earthquakes is important for many applications in seismology, including seismic hazard assessment, earthquake prediction research, and seismicity rate change estimation (Bayliss et al., 2019). Since clustering earthquakes are mainly affected by earthquakes that have already occurred, the so-called “parent event”, and their physical properties and mechanisms are different from background seismicity, therefore, it is often necessary to separate the two groups of events (Zhang and Shearer, 2016).
Studies have shown that seismicity clusters can occur before moderate and strong earthquakes (Yamashita and Knopoff, 1992; Evison and Rhoades, 1999; Ma et al., 2013). Dieterich (1994) believed that small earthquake clustering is driven by changes in stress near the seismic zone and may be related to the nucleation process of large earthquakes. This has been confirmed by rock tests (Yang et al., 1998). Background seismicity also changes regularly during stress changes caused by a strong earthquake (Ellsworth et al., 1981); therefore, by using relative ratio changes between cluster and background events, we can estimate the risk of a future strong earthquake (Cao et al., 1996).
Many methods exist to quantify the spatiotemporal clustering of earthquakes, as well as to distinguish background and clustering events in seismic activity (e.g., Gardner and Knopoff, 1974; Reasenberg, 1985; Reasenberg and Jones, 1989; Molchan and Dmitrieva, 1992). Pioneering methods include the earthquake concentration C-value as defined by Wang (1984), which is a function based on frequency per unit area; and the seismic spatial clustering (Js) and temporal clustering degree (Jt) based on the Morishita index of Zhang and Jiang (1996). Later studies include the commonly used windowing methods (Gardner and Knopoff, 1974; Reasenberg, 1985) and a stochastic declustering method based on the ETAS model (Zhuang et al., 2002).
Pei et al. (2004) assumed that background and clustering earthquakes satisfy the 2D Poisson process with different parameters. By introducing the concept of N-order distance, a superimposed 2D Poisson process is transformed into a 1D mixed-density function. Based on the selected distance order, a genetic algorithm can be used to decompose the mixed density and then analyse the seismic clustering mode (Zaliapin et al., 2008; Zaliapin et al., 2011). considered factors such as the spatiotemporal distribution and energy of earthquakes and defined the nearest neighbour distance (NND) between different events, from which a method for analysing clustering earthquakes and identifying aftershocks was derived. Promising results have been obtained from applications of this method in recent years (Zaliapin and Ben-Zion, 2013a; Zaliapin and Ben-Zion, 2013b; Zaliapin and Ben-Zion, 2016a; Zaliapin and Ben-Zion, 2016b).
Building on previous work (Zheng et al., 2014; Wang et al., 2017), we develop Zaliapin’s method using a Gaussian mixture model (GMM). Using the M6.6 Jinggu earthquake in Yunnan Province on 7 October 2014 (hereinafter “Jinggu earthquake”) as an example, we analyse the spatiotemporal clustering characteristics of regional small earthquakes before a strong earthquake.
2 Theory and method
2.1 NND algorithm
For a given earthquake catalogue
where
In a given time-space magnitude, the nearest neighbour is defined as follows:
Zaliapin et al. (2008) proved through theoretical analysis that if the assumption is that the earthquake process is a stable stochastic Poisson process with a certain probability density, and the magnitude marks
It is possible to further define the temporal and spatial components of the magnitude-normalised NND:
In the previous statistical methods for analysing seismic activity, time, space and energy domains were often separated and not considered together. The NND defined by Zaliapin et al. (2008) comprehensively considers the distribution of earthquakes in the space, time and energy domains and provides normalised parameters, which effectively simplifies the complex problem of the N-dimension.
2.2 The ETAS model
The ETAS model is a self-exciting point process (Ogata, 1999) that describes the spatiotemporal clustering of seismicity, which accounts for secondary aftershock excitation with statistically self-similar features and has notable significance in terms of statistical physics. Therefore, it is widely used to study the spatiotemporal features of regional seismicity as well as features of aftershock activity (such as Jiang et al., 2007; Jiang and Zhuang, 2010).
Assuming that each earthquake triggers its aftershocks and aftershock activity follows the Omori-Utsu formula in the time domain, in the ETAS model, the frequency of aftershocks per unit time t is as follows:
where
There are two parts on the right side of Eq. 5. The first is the background earthquake occurrence rate, which represents seismicity caused by external triggers, such as structural loading or increased pore pressure. The second is the aftershock sequence, which follows the modified Omori formula.
Consider point-process models for the data of occurrence times and locations of earthquakes, Ogata & Zhuang (2006) extended the ETAS model to spatiotemporal domain. The occurrence rate λ(t, x, y) of a space–time point process is mathematically defined in terms of the occurrence probability of an event at time t and the location (x, y) conditional on the past history of the occurrences. In the typical space–time extensions of the ETAS model, formula (5) can be modified as
2.3 A Gaussian mixture model of background and clustering earthquakes
Earthquakes can be regarded as a spatiotemporal stochastic point process (Ogata, 1988; Console et al., 2003; Holden et al., 2003); in particular cluster earthquakes can be regarded as a self-exciting spatiotemporal stochastic point process (Reinhart, 2018). Assuming that background earthquakes and clustering earthquakes are generated by different stochastic processes, and taking into account the spatiotemporal distribution of NND
where f1(η), f2(η) are two Gaussian PDFs for seperately modeling background and clustering earthquakes. The coefficient wk is the weight of the k-th Gaussian model for
2.4 Numerical test
Figure 1A shows the M-t diagrams of 1,000 simulated earthquakes generated by the ETAS model. The catalogue was generated using the code from Helmstetter and Sornette (2002). The initial parameters of the ETAS model were:
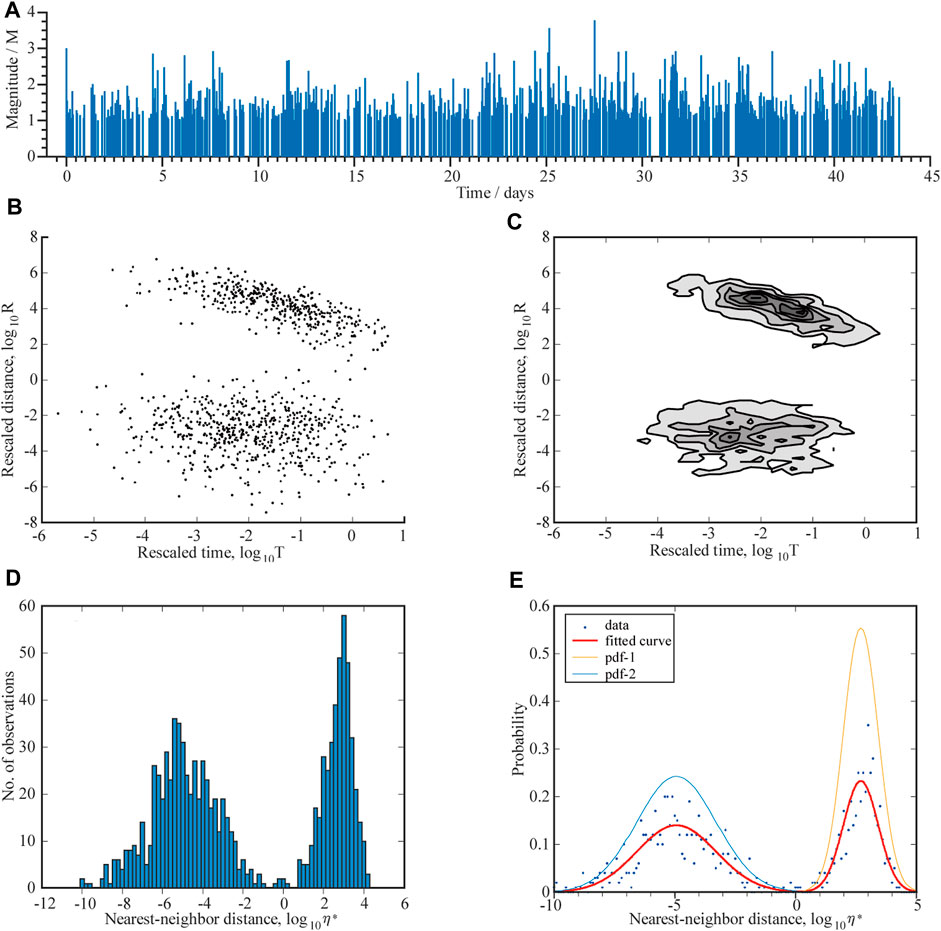
FIGURE 1. (A) Temporal distribution of M>=1.0 events in synthetic catalogues; (B) Spatiotemporal distribution of η*; (C) Contour map of distribution density of panel (B); (D) Histogram of η*; (E) Fitted mixture PDF (red).
Based on the GMM, we analysed the earthquake catalogue simulated by the ETAS model. The GMM was used to solve the 2D distribution of the NND
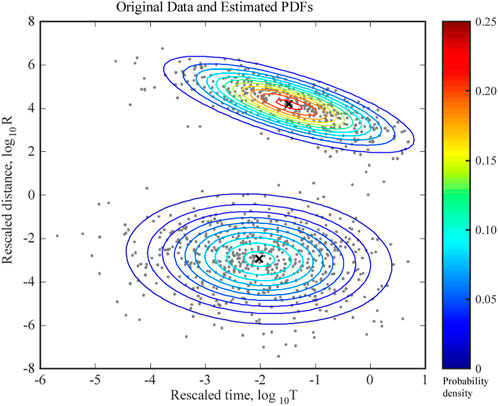
FIGURE 2. Contour map of PDFs of the GMM model for earthquakes shown in Figure 1.
3 Data and study area
The M6.6 Jinggu earthquake took place on 7 October 2014 in the Lanping-Simao Basin on the west side of the Honghe fault zone in southern Yunnan (Xu et al., 2014; Chang et al., 2016; Mao et al., 2019). It was the only M ≥ 6.5 earthquake to occur in southern Yunnan in the past decade. It was a highly significant seismic event, but there has been little relevant research on the earthquake (geophysical research includes Li et al., 2015; Sun et al., 2015; Zhang et al., 2018), with particularly few studies on pre-earthquake seismicity (only Luo et al., 2016; He et al., 2019).
Based on the method of analysing clustering earthquakes proposed above, we analysed the clustering characteristics of regional seismic activity before moderate and strong earthquakes using the Jinggu earthquake as an example. Referring to the numerical simulations by Zhou et al. (1994) and theoretical analysis by (Mei et al., 1995; Mei et al., 1996) on deformation field, Zhang and Jiang (1996) think the statistical area should be 200–300 km while study on seismic activities prior to a strong earthquake. So we used the Jinggu earthquake epicentre as the centre point with a radius R = 150 km and studied the seismic records between 1 January 2009 and 30 September 2014 (Figure 3).
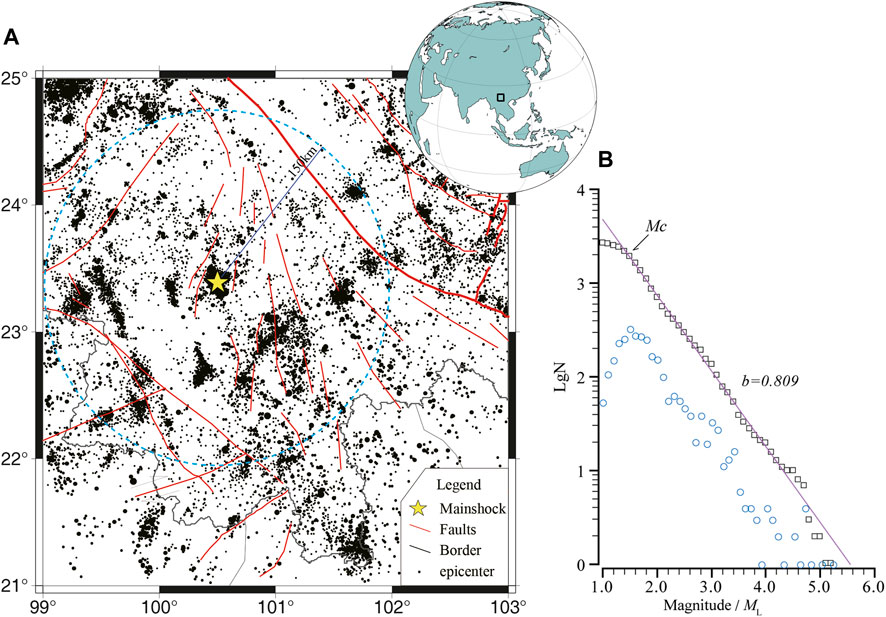
FIGURE 3. Distribution of ML ≥ 1.0 events (black dots) and faults (red lines) in south Yunnan, star denotes the Jinggu M6.6 earthquake, the faults name are given on Figure 7; right panel shows the Gutenberg-Richter relationship of seismicity in the study area, pink line represents fitted result.
In the application of this paper, first, according to the Gutenberg-Richter relation of the earthquake catalogue in the study area, the minimum magnitude of completeness Mc = ML 1.5 of the area was determined (Figure 3B), and the
4 Computation and analysis
With the Jinggu earthquake as the centre, we selected ML ≥ 1.5 earthquakes within a radius of 150 km between 1 January 2009 and 30 September 2014 and used the GMM approach above to calculate the earthquake clustering ratio in the area (Figure 4). The NND
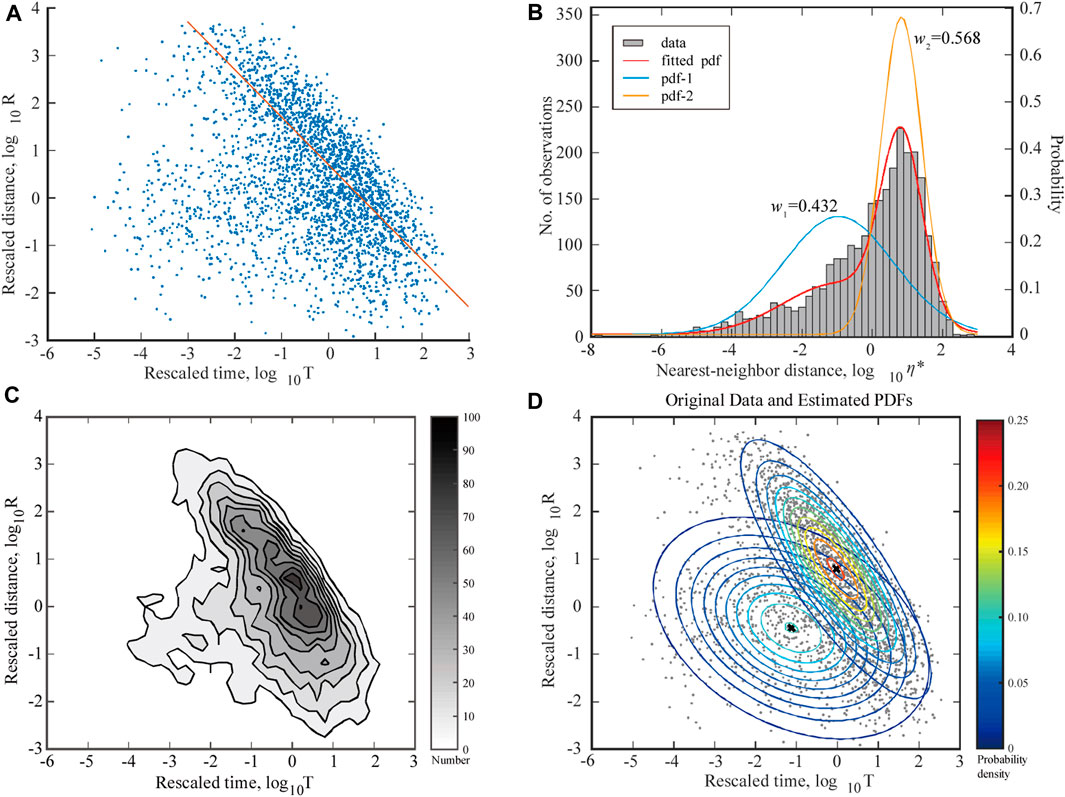
FIGURE 4. Results of nearest neighbour algorithm of ML ≥ 1.5 seismic activities around 2014 Jinggu M6.6 earthquake (within a radius of 150 km). (A) Distribution of spatial and temporal components of η*, (B) histogram and its fitted PDF of η*; (C) Density contour map ofη*; and (D) PDFs of fitted GMM model.
4.1 Temporal variation of small earthquake clusters
The seismic clustering ratio was calculated for each natural year (window size: 365 days, and step size 30 days) of the earthquake catalogue within a 150 km radius around the Jinggu earthquake (Figure 5). According to the definition of
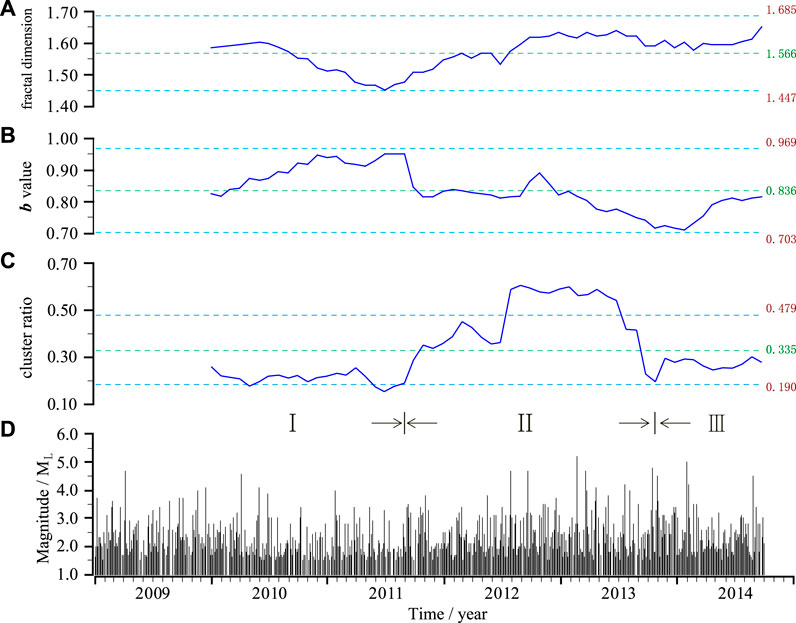
FIGURE 5. Plots of magnitude (D), fractal dimension (A), b-value (B), and clustering ratio (C) versus time. The blue horizontal dashed lines represent standard deviation, and green lines are mean values.
Figure 5 shows that the evolution of small earthquake activity parameters before the Jinggu earthquake can be divided into three clear stages. Stage I: In 2010–2011, the fractal dimension d of the epicentre showed declined and then recovered, while the b-value increased and clustering remained below the mean level; the decrease in the fractal dimension indicated a strengthening of the orderly spatial distribution of seismic activity, but the simultaneous increase in b-value meant that the regional mean stress was still low (Wyss et al., 2004). Stage II: From October 2011 to September 2013, the fractal dimension d recovered somewhat, while the b-value was very low and continued to decline; from the beginning of 2013, the b-value dropped to a level lower than the background value of 0.809, which signalled an increase in crustal stress in the study area; the degree of earthquake clustering in the study area increased significantly at this point as the b-value decreased. Stage III: After October 2013 and until the mainshock, the fractal dimension d did not change significantly, the b-value increased and returned to its mean level, and the clustering of small earthquakes declined to around the mean value with some fluctuations.
4.2 Physical interpretation of small earthquake cluster variation
Chinese and international scholars have proposed various models of the seismogenic process of strong earthquakes, such as the barrier model, dilatancy-diffusion model (DD model), Institute of Physics of the Earth model (IPE model), and integrated model (Liu and Cao, 2003). Soviet seismologist Mjachkin (Mjachkin et al., 1975) proposed the IPE model based on fracture mechanics and rock tests and divided the seismogenic process of strong earthquakes into three stages, as shown in Figure 6A. Combining the analysis of small earthquake activity before the Jinggu earthquake in Section 4.1 and the changes in Benioff strain energy in Figure 6B, we found that it conforms closely with the IPE model. From 2010 to the first half of 2011, the epicentral area had a random distribution of small ruptures as well as low regional stress (a high b-value) and strain release rate, with activity largely due to background events caused by tectonic stress, so the clustering ratio remained below 0.3 (Figure 5). In the later part of this stage, the fractal dimension d decreased, indicating that microfractures develop in an orderly direction. In the second half of 2011, the acceleration stage may have been reached, with a sharp increase in microfractures, an increase in stress (lower b-value), an acceleration in strain release, and a rapid increase in the clustering of small earthquakes to above 0.4. From the end of 2013 onwards, Stage III was reached, in which the growth of new microfractures stopped and the number of active fissures decreased. Therefore, although the fractal dimension d changed little, the clustering of small earthquakes decreased significantly until the mainshock of M6.6 occurred.
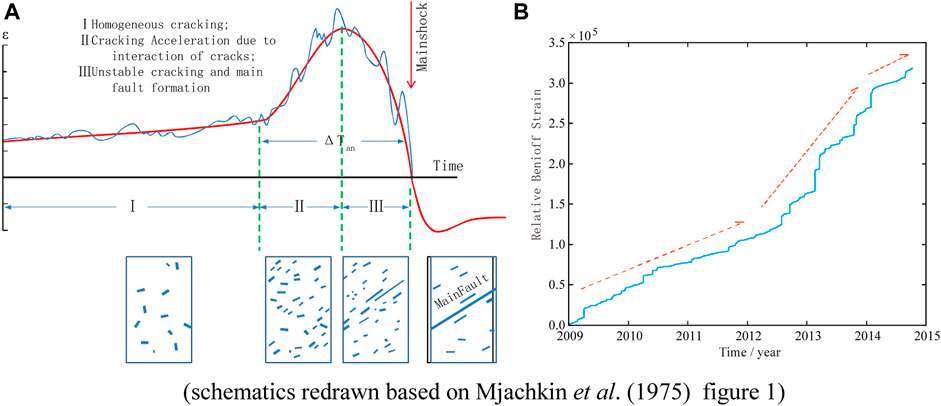
FIGURE 6. (A) Change of average deformation velocity during the seismic cycle; (B) Cumulative Benioff strain energy (relative energy, take ML0.0 as 1) versus time.
4.3 Spatial variation and physical interpretation
Using the method above, spatial scanning was conducted of seismic activity in the study area (Figure 3) in the 18 months before the Jinggu earthquake. A variable window length was applied to ensure sufficient earthquakes for each scanning window. The minimum window length radius l was 10 km. If the number of earthquakes in the scanning window at a certain location was less than 100, the scanning radius was expanded at a step of 5 km until the number of earthquakes was sufficient to satisfy the requirements, with a maximum l of 50 km. The results are shown in Figure 7.
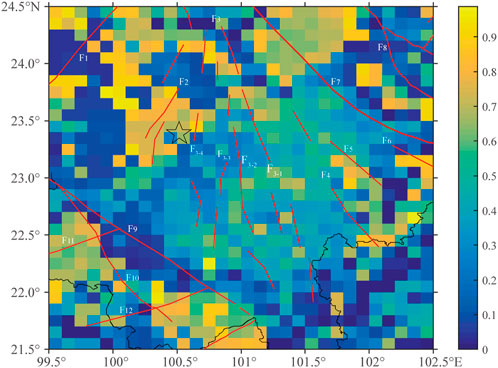
FIGURE 7. Spatial variation of clustering ratio in southern Yunnan Province. F1 Nanting River Fault; F2 Lancang River Fault; F3 Wuliang Mountain Fault; F4 Babian River Fault; F5 Amo River Fault; F6 Ailao Mountain Fault; F7 Hong River Fault; F8 Shiping-Jianshui Fault; F9 Mujia-Qianmai Fault; F10 Lancang-Mengzhe Fault; F11 Menglian Fault; F12 Daluo Fault. [The names of the faults are from Chang et al. (2016), and the star represents the epicentre of the M6.6 mainshock].
Figure 7 shows a high degree of clustering of small earthquakes concentrated around the epicentre of the Jinggu earthquake. This is particularly notable at the Lancang River Fault (F2) and the west branch of the Wuliang Mountain Fault (F3-4), which were close to the mainshock. It is even more noteworthy that the epicentral area of the Jinggu earthquake was unusually calm despite the concentration of small earthquakes in its surrounding areas, which accords precisely with the barrier model proposed by Mei et al. (1995). Geological analysis has revealed that the Jinggu earthquake occurred on an unknown secondary active fault outside the boundary fault zone (Xu et al., 2014), which may indicate that the fracture intensity at the epicentre was higher than that of the surrounding main fault.
5 Discussion and conclusion
The minimum space-time distance
Based on this method, we studied regional small earthquake activity before the Jinggu earthquake in Yunnan Province, China on 7 October 2014 and discovered the following:
1. The seismogenic process of the Jinggu M6.6 earthquake can be divided into three stages. Based on the stochastic activity of the background earthquake, stress gradually increased, small earthquakes were highly clustered, and the release of strain energy accelerated markedly 3 years before the earthquake. One year before the mainshock, the existence of a fault barrier or hypocentre barrier causes calmer rupture activity near faults. Following the accumulation of strain energy, the main shock finally occurred. The seismogenic process of the Jinggu earthquake accords with the theoretical model.
2. There was a high degree of clustering of small earthquakes concentrated around faults near the Jinggu earthquake prior to the earthquake, while the epicentral area was relatively calm, which may indicate that the epicentral area was a barrier with relatively high fracture strength and that was locally locked. It was the fracture of this barrier that caused the M6.6 Jinggu earthquake to occur.
Rock tests have shown that large fractures are preceded by increased and concentrated microfractures (Stanchits et al., 2006; Aben et al., 2019). The latest theoretical model of progressive localization of deformation before large earthquakes (Kato and Ben-Zion, 2021) states that before such an event, regional weakening will gradually form localized deformation around the eventual rupture zones, and regions containing faults of various scales experience substantial clusters of seismicity during localized deformation. Analysis of the Jinggu earthquake in this paper revealed the spatiotemporal evolution of clustering earthquakes can indeed reflect changes in tectonic stress, which is connected to the seismogenic process of strong earthquakes. Furthermore, approximately 1 year before the Jinggu earthquake, the b-value of the seismogenic area recovered and clustering decreased significantly, which was similar to the conditions before the slip instability in rock tests. Does this decrease in clustering of small earthquakes, the recovery of the b-value, and reduction in the release of strain energy after an acceleration indicate that the hypocentre has entered the sub-instability stage? This could be the focus of future studies.
Data availability statement
The original contributions presented in the study are included in the article/Supplementary Material, further inquiries can be directed to the corresponding author.
Author contributions
JZ conceived the study.
Funding
Jointly funded by the China Earthquake Science Experimental Site Earthquake Predictability International Cooperation Project (2018YFE0109700), the Earthquake Tracking and Orientation Tasks of the China Earthquake Administration, and the Science and Technology Innovation Team of the Shandong Earthquake Agency.
Acknowledgments
The catalogue used in this paper is from the unified cataloguing system of the China Earthquake Network Center. b-values and fractal dimensions were calculated using MapSiS v2.8.11 developed by Li Shengle et al. The implementation and programming of the nearest neighbour distance algorithm was based on Matlab. Thanks to the reviewers for their comments and suggestions.
Conflict of interest
The author declares that the research was conducted in the absence of any commercial or financial relationships that could be construed as a potential conflict of interest.
Publisher’s note
All claims expressed in this article are solely those of the authors and do not necessarily represent those of their affiliated organizations, or those of the publisher, the editors and the reviewers. Any product that may be evaluated in this article, or claim that may be made by its manufacturer, is not guaranteed or endorsed by the publisher.
References
AbenBrantut, F. M. N., and Mitchell, T. M. E. C. David (2019). Rupture energetics in crustal rock from laboratory-scale seismic tomography. Geophys. Res. Lett. 46 (13), 7337–7344. doi:10.1029/2019GL083040
Bayliss, K., Naylor, M., and Main, I. G. (2019). Probabilistic identification of earthquake clusters using rescaled nearest neighbour distance networks. Geophys. J. Int. 217, 487–503. doi:10.1093/gji/ggz034
Cao, T., Petersen, M. D., and Reichle, M. S. (1996). Seismic hazard estimate from background seismicity in southern California. Bull. Seism. Soc. Amer. 86 (5), 1372–1381. doi:10.1785/BSSA0860051372
Chang, Z. F, Chen, X. L., Chen, Y. J., Li, J. L., Lin, H., and Hong, M. (2016). The co-seismic ground failure features and seismogenic structure of the Jinggu MS6.6 earthquake[J]. Chin. J. Geophys. 59 (7), 2539–2552. (inChinese). doi:10.6038/cjg20160719
Console, R., Murru, M., and Lombardi, A. M. (2003). Refining earthquake clustering models: Refining earthquake clustering models. J. Geophys. Res. 108 (B10), 51–59. doi:10.1029/2002JB002130
Dieterich, J. (1994). A constitutive law for rate of earthquake production and its application to earthquake clustering. J. Geophys. Res. 99 (B2), 2601–2618. doi:10.1029/93JB02581
Ellsworth, W. L., Lindh, A. G., Prescott, W. H., and Herd, D. G. (1981). “The 1906 San Francisco earthquake and the seismic cycle,” in Earthquake prediction: An international review[M]. Maurie ewing ser. Editors D. W. Simpson, and P. G. Richards (Washington, D.C: AGU), 4, 126–140.
EvisonRhoades, F. F. D. A. (1999). The precursory earthquake swarm in Japan: Hypothesis test. Earth, Planets Space 51 (12), 1267–1277. doi:10.1186/BF03351600
Gardner, J. K., and Knopoff, L. (1974). Is the sequence of earthquakes in southern California, with aftershocks removed, Poissonian? Bull. Seismol. Soc. Am. 64 (5), 1363–1367. doi:10.1785/bssa0640051363
Hardebeck, J. L. (2021). Spatial clustering of aftershocks impacts the performance of physics-based earthquake forecasting models. J. Geophys. Res. Solid Earth 126, e2020JB020824. doi:10.1029/2020jb020824
He, Y. W., Wang, J. F., Yang, X. L., and Yang, J. W. (2019). Study on spatio-temporal scanning characteristics of accelerating moment release before Jinggu MS6.6 Earthquake[J]. South China J. Seismol. 39 (1), 20–24. (inChinese). doi:10.13512/j.hndz.2019.01.004
Helmstetter, A., and Sornette, D. (2002). Sub-critical and supercritical regimes in epidemic models of earthquake aftershocks. J. Geophys. Res 107 (10), 10-11-10-21. doi:10.1029/2001JB001580
Holden, L., Sannan, S., and Bungum, H. (2003). A stochastic marked point process model for earthquakes. Nat. Hazards Earth Syst. Sci. 3 (3), 95–101. doi:10.5194/nhess-3-95-2003
Jagla, E. A., and Kolton, A. B. (2010). A mechanism for spatial and temporal earthquake clustering. J. Geophys. Res. 115, B05312. doi:10.1029/2009JB006974
Jiang, C. S., and Zhuang, J. C. (2010). Evaluation of background seismicity and potential source zones of strong earthquakes in the Sichuan-Yunan region based on the space time ETAS model[J]. Chin. J. Geophys. 53 (2), 305–317. (inChinese). doi:10.3969/j.issn.0001-5733.2010.02.008
Jiang, H. K., Zheng, J. C., Wu, Q., Qu, Y. J., and Li, Y. L. (2007). Earlier statistical features of ETAS model parameters and their seismological meanings[J]. Chin. J. Geophys. 50 (6), 1778–1786. (in Chinese). doi:10.3321/j.issn:0001-5733.2007.06.018
Kato, A., and Ben-Zion, Y. (2021). The generation of large earthquakes. Nat. Rev. Earth Environ. 2 (2), 26–39. doi:10.1038/s43017-020-00108-w
Kato, N., Ohtake, M., and Hirasawa, T. (1997). Possible mechanism of precursory seismic quiescence: Regional stress relaxation due to preseismic sliding[J]. Pure Appl. Geophys. 150 (2), 249–267. doi:10.1007/s000240050075
Li, Q. M., Zhang, Y. S., Lv, J. Q., Ren, J. Q., Zhang, L. F., and Zhang, X. (2015). Thermal infrared anomaly occurring before the Jinggu yunnan MS6.6 earthquake on october 7, 2014[J]. China Earthq. Eng. J. 37 (4), 1007–1012. (in Chinese). doi:10.3969/j.issn.1000-0844.2015.04.1007
Luo, G. F., Tu, H. W., Zeng, X. W., Ma, H. Q., and Yang, M. Z. (2016). Analysis of regional seismic energy field before and after the 2014 Jinggu MS6.6 Earthquak[J]. Earthquake 36 (3), 125–134. (in Chinese). doi:10.3969/j.issn.1000-3274.2016.03.013
Liu, Y. W., and Cao, L. L (2003). Overview of researches on the models of earthquake preparation and the mechanisms of precursor anomalies[J]. Recent Dev. World Seismol. 298, 9–14. (in Chinese). doi:10.3969/j.issn.0253-4975.2003.10.002
Ma, J., Liu, P. X., and Liu, Y. Z. (2013). Features of seismogenic process of the Longmenshan fault zone derived from analysis on the temporal-spatial evolution of earthquakes[J]. Seismol. Geol. 35 (3), 461–471. (in Chinese). doi:10.3969/j.issn.0253-4967.2013.03.001
Mao, Z. B., Chang, Z. F., Li, J. L., Chang, H., Zhao, J. M., and Chen, G. (2019). Late quaternary activity of faults in the epicenter area of Jinggu M6.6 earthquake[J]. Seimology Geol. 41 (4), 821–836. (in Chinese). doi:10.3969/j.issn.0253-4967.2019.04.002
Mei, S. R. (1996). On the physical model of earthquake precursor fields and the mechanism of precursors’ time-space distribution (III) — Anomalies of seismicity and crustal deformation and their mechanisms when a strong earthquake is in preparation. Acta Seismol. Sin. 9 (2), 223–234. doi:10.1007/bf02651066
Mei, S. R. (1995). On the physical model of earthquake precursor fields and the mechanism of precursors’ time-space distribution — Origin and evidences of the strong body earthquake-generating model. Acta Seismol. Sin. 8 (3), 337–349. doi:10.1007/bf02650562
Mjachkin, V. I., Brace, W. F., Sobolev, G. A., and Dieterich, J. H. (1975). Two models for earthquake forerunners. Pure Appl. Geophys. 113 (1), 169–181. doi:10.1007/BF01592908
Molchan, G. M., and Dmitrieva, O. E. (1992). Aftershock identification: Methods and new approachesfication: Methods and new approaches. Geophys. J. Int. 109 (3), 501–516. doi:10.1111/j.1365-246X.1992.tb00113.x
Ogata, Y., and Zhuang, J. (2006). Space–time ETAS models and an improved extension. Tectonophysics 413 (1-2), 13–23. doi:10.1016/j.tecto.2005.10.016
Ogata, Y. (1999). Seismicity analysis through point-process modeling: A review. Pure Appl. Geophys. 155 (2–4), 471–507. doi:10.1007/s000240050275
Ogata, Y. (1988). Statistical models for earthquake occurrences and residual analysis for point processes. J. Am. Stat. Assoc. 83 (401), 9–27. doi:10.1080/01621459.1988.10478560
Pei, Tao, Zhou, Cheng-hu, Yang, Ming, Luo, J. c., and Li, Q. l. (2004). The algorithm of decomposing superimposed 2-D Poisson processes and its application to the extracting earthquake clustering pattern. Acta Seismol. Sin. 17 (1), 54–63. doi:10.1007/bf03191395
Peresan, A., and Gentili, S. (2018). Seismic clusters analysis in Northeastern Italy by the nearest-neighbor approach. Phys. Earth Planet. Interiors 274, 87–104. doi:10.1016/j.pepi.2017.11.007
Reasenberg, P., and Jones, L. (1989). Earthquake hazard after a mainshock in California. Science 243, 1173–1176. doi:10.1126/science.243.4895.1173
Reasenberg, P. (1985). Second-order moment of central California seismicity, 1969-1982. J. Geophys. Res. Solid Earth 90 (B7), 5479–5495. doi:10.1029/JB090iB07p05479
Reinhart, A. (2018). A review of self-exciting spatio-temporal point processes and their applications. Stat. Sci. 33 (3), 299–318. doi:10.1214/17-STS629
Stanchits, S., Vinciguerra, S., and Dresen, G. (2006). Ultrasonic velocities, acoustic emission characteristics and crack damage of basalt and granite. Pure Appl. Geophys. 163 (5), 975–994. doi:10.1007/s00024-006-0059-5
Sun, S. A., Hao, H. T., and Wei, J. (2015). Regional characteristics of gravity field change before the Yunnan Jinggu M6.6 Earthquak[J]. J. Geodesy Geodyn. 35 (4), 613–615. (in Chinese). doi:10.14075/j.jgg.2015.04.015
van Stiphout, T., Zhuang, J., and Marsan, D. (2012). Seismicity declustering. United states: Community Online Resource for Statistical Seismicity Analysis. doi:10.5078/corssa-52382934
Wang, P., Zheng, J. C., Li, X. H., and Xu, C. P. (2017). Study on the characteristics of earthquake clustering in North China based on the nearest neighbor distance[J]. J. Geodesy Geodyn. 37 (12), 1229–1233. (in Chinese). doi:10.14075/j.jgg.2017.12.005
Wang, W. (1986). Anomalous variation of C values for seismic spatial concentrative degree before several large earthquakes in North China[J]. J. Seismol. Res. 9 (2), 147–158. (in Chinese).
Wyss, M., Sammis, C. G., Nadeau, R. M., and Wiemer, S. (2004). Fractal dimension and b-value on creeping and locked patches of the san andreas fault near parkfield, California. Bull. Seism. Soc. Am. 94 (2), 410–421. doi:10.1785/0120030054
Xu, X. W., Cheng, J., Xu, C., Li, X., Yu, G. H., Chen, G. H., et al. (2014). Discussion on block kinematic model and future themed areas for earthquake occurrence in the Tibetan plateau: Inspiration from the ludian and Jinggu earthquakes[J]. Seismol. Geol. 36 (4), 1116–1134. (in Chinese). doi:10.3969/j.issn.0253-4967.2014.04.015
Yamashita, T., and Knopoff, L. (1992). Model for intermediate-term precursory clustering of earthquakes. J. Geophys. Res. 97 (B13), 19873–19879. doi:10.1029/92JB01216
Zaliapin, I., Gabrielov, A., Borok, V. Keilis–, and Wong, H. (2008) Clustering analysis of seismicity and aftershock identification. Phys. Rev. Lett. 101, 1–4. doi:10.1103/PhysRevLett.101.018501
Zaliapin, I., and Zion, Y. Ben (2016a). A global classification and characterization of earthquake clusters. Geophys. J. Int. 207 (1), 608–634. doi:10.1093/gji/ggw300
Zaliapin, I., and Zion, Y. Ben (2011). Asymmetric distribution of aftershocks on large faults in California: Asymmetric aftershocks on bimaterial faults. Geophys. J. Int. 185 (3), 1288–1304. doi:10.1111/j.1365-246x.2011.04995.x
Zaliapin, I., and Zion, Y. Ben (2016b). Discriminating characteristics of tectonic and human-induced seismicity. Bull. Seism. Soc. Amer. 106 (3), 846–859. doi:10.1785/0120150211
Zaliapin, I., and Zion, Y. Ben (2013a). Earthquake clusters in southern California I: Identification and stability: Identification of earthquake clusters. J. Geophys. Res. 118 (6), 2847–2864. doi:10.1002/jgrb.50179
Zaliapin, I., and –Zion, Y. Ben (2013b). Earthquake clusters in southern California II: Classification and relation to physical properties of the crust: Classification of earthquake clusters. J. Geophys. Res. 118 (6), 2865–2877. doi:10.1002/jgrb.50178
Zhang, L. F., Guo, X., Zhang, X., Wei, C. X., and Qin, M. Z. (2018). The outgoing long wave radiation anomalous features of the MS6.5 Ludian and MS6.6 Jinggu Earthquakes in 2014[J]. Earthq. Res. China 34 (4), 713–719. (in Chinese). doi:10.3969/j.issn.1001-4683.2018.04.011
Zhang, Q., and Shearer, P. M. (2016). A new method to identify earthquake swarms applied to seismicity near the San Jacinto Fault, California. Geophys. J. Int. 205 (2), 995–1005. doi:10.1093/gji/ggw073
Zhang, X. D., and Jiang, Z. P. (1996). Measuring of clustering degree in temporal and spatial distribution of earthquakes and initial research of anomaly characteristics before earthquakes[J]. North- West. Seismol. J. 18 (3), 37–41. (in Chinese).
Zheng, J. C., Li, D. M, Wang, P., Lv, Z. Q., and Lin, M. (2014). Method and application of clustering seismicity identification based on nearest-neighbor distance[J]. Earthquake 34 (4), 100–109. (in Chinese). doi:10.3969/j.issn.1000-3274.2014.04.011
Zhou, S. Y., Wu, Y., Wang, R. B., and Yang, G. H. (1994). Research of pattern dynamics parameters of crustal deformation field in seismogenic process. Acta Seismol. Sin. 7 (3), 427–432. doi:10.1007/bf02650680
Zhuang, J. C., Chang, C. P., Ogata, Y., and Chen, Y. I. (2005). A study on the background and clustering seismicity in the Taiwan region by using point process models[J]. J. Geophys. Res., 110(B05), 1–17. doi:10.1029/2004JB003157
Keywords: clustering, Gaussian mixture model, ETAS model, seismogenesis, foreshock activities
Citation: Zheng J (2023) Clustering features and seismogenesis of the 2014 M6.6 Jinggu earthquake in Yunnan Province, China. Front. Earth Sci. 11:1177821. doi: 10.3389/feart.2023.1177821
Received: 02 March 2023; Accepted: 05 June 2023;
Published: 19 June 2023.
Edited by:
Jiancang Zhuang, Institute of Statistical Mathematics, JapanReviewed by:
Elisa Varini, National Research Council (CNR), ItalyMikhail Rodkin, Institute of Earthquake Prediction Theory and Mathematical Geophysics (RAS), Russia
Copyright © 2023 Zheng. This is an open-access article distributed under the terms of the Creative Commons Attribution License (CC BY). The use, distribution or reproduction in other forums is permitted, provided the original author(s) and the copyright owner(s) are credited and that the original publication in this journal is cited, in accordance with accepted academic practice. No use, distribution or reproduction is permitted which does not comply with these terms.
*Correspondence: Jianchang Zheng, empjbWFpbEB5ZWFoLm5ldA==
 Jianchang Zheng