 Ma Jianbo
 Liu Menghua
- State Key Laboratory of Explosion Science and Technology, School of Mechatronical Engineering, Beijing Institute of Technology, Beijing, China
Blasting lumpiness prediction is one of the most important research contents in engineering blasting. Although the traditional KUZ-RAM model is widely used, it often overestimates the size of blasting. Therefore, the KUZ-RAM model was updated or corrected in this paper by simplifying the difficult problem of statistical burst fragmentation in LS-DYNA. Based on the theory of area measurement method, the fitting mechanism of machine learning is used to study the lumpiness of simulation results. The updated KUZ-RAM model adds a coefficient of 0.623 to the original equation of average lumpiness xm. The linear coefficient R2 between the predicted results and the field blasting results increases from −1.99 to 0.97, which significantly improves the prediction of blasting lumpiness.
1 Introduction
The karst area in the world accounts for 7%–12% of the total land area. As a drinking water source, karst water supplies 20%–25% of the world’s population. China is the country with the widest karst distribution area in the world, accounting for about 1/3 of the land area. With the development of engineering construction in China, a large number of projects need to pass through karst areas. Due to the complex geological conditions, large differences in water-rich characteristics and strong heterogeneity of karst areas, various disasters and accidents are very likely to occur during the construction process.
The fragmentation of rocks is an important factor that affects the efficiency and economy of mining (Shim et al., 2009). Blasting is one of the most commonly used methods for mining, and the size of rock fragmentation and the blasting distribution function after blasting are often used as a basis for scientific judgment and description to evaluate the mining benefits of blasting. Blast fragmentation is a complex issue that has been studied by many scholars in the past few decades. Based on theories such as energy theory and stress wave theory, many models have been established and widely recognized and applied, such as the Hanukayev model (Favreau, 1983), the Harries model (Harries, 1977), the Lilly blasting capability index model (Lilly, 1986), the BLASPA blasting mathematical model (FavreauR., 1983), the NAG-FRAG model (McHugh, 1983), and the KUZ-RAM block distribution calculation formula (Cunningham, 1987) proposed by Cunningham (1987) base on the Kuznetsov equation (Kuznetsov, 1973) and R-R formula (Just, 1974). However, the prediction results are still less accurate and have great application limitations due to rock classification problems. In recent years, many scholars are still paying attention to the stability of the mining site and the influence of the collapse mechanism on block size Li et al. (2021a), and trying to revise and optimize existing models in a more scientific way, such as Gheibie et al. (2009) has corrected KUZ-RAM; Lawal (2021) also used image processing technology to optimize the KUZ-RAM model; Liu et al. (2020) established its relationship with pore parameters based on the comprehensive study of fractal dimension by Turcotte (1986) and Harries (1973); L.G.Margolin, etc. Margolin et al. (1985) proposed the BCM layered crack model, etc., also some important empirical formulas summarized from field experience da Gama (1971). However, there are still problems of narrow application scope and poor practical use effect.
The fragmentation of rocks is an important factor that affects the efficiency and economy of mining (Shim et al., 2009). Blasting is one of the most commonly used methods for mining, and the size of rock fragmentation and the blasting distribution function after blasting are often used as a basis for scientific judgment and description to evaluate the mining benefits of blasting.
Blast fragmentation is a complex issue that has been studied by many scholars in the past few decades. Based on theories such as energy theory and stress wave theory, many models have been established and widely recognized and applied, such as the Hanukayev model (Favreau, 1983), the Harries model (Harries, 1977), the Lilly blasting capability index model (Lilly, 1986), the BLASPA blasting mathematical model FavreauR. (1983), the NAG-FRAG model (McHugh, 1983), and the KUZ-RAM block distribution calculation formula (Cunningham, 1987) proposed by Cunningham (1987) base on the Kuznetsov equation (Kuznetsov, 1973) and R-R formula (Just, 1974). However, the prediction results are still less accurate and have great application limitations due to rock classification problems. In recent years, many scholars are still paying attention to the stability of the mining site and the influence of the collapse mechanism on block size Li et al. (2021a), and trying to revise and optimize existing models in a more scientific way, such as Gheibie et al. (2009) has corrected KUZ-RAM; Lawal (2021) also used image processing technology to optimize the KUZ-RAM model; Liu et al. (2020) established its relationship with pore parameters based on the comprehensive study of fractal dimension by Turcotte (1986) and Harries (1973); L.G.Margolin, etc. (Margolin et al., 1985) proposed the BCM layered crack model, etc., also some important empirical formulas summarized from field experience da Gama (1971). However, there are still problems of narrow application scope and poor practical use effect.
In recent years, computer science and image processing methods have gradually been applied to the field of blast fragmentation research. Trivedi (TRIVEDIR and GUPTAN, 2015) was the first to apply neural networks (ANN) and adaptive neural networks (ANFIS) to open pit blasting research. Shim et al. (2009) combined the KUZ-RAM block prediction model and SIS three-dimensional data prediction technology to optimize blast parameters in their research. A. Bahrami et al. (2010) established a BP neural network using 220 data to optimize blasting. Asl PF (Asl et al., 2018) used the firefly algorithm to predict flying rocks and fragmentation; and Mehrdanesh A (Mehrdanesh et al., 2018) introduced robotic technology into the evaluation of rock fracture. Xie et al. (2021) found the stability and applicability of the FFA-GBM algorithm after comparing various machine learning algorithms. Zhou et al. (2022) studied the stability of floor through numerical simulation. These studies provide the basis for computer study of blasting block size, but there is still a lack of detailed determination of blasting block size.
In addition, image processing methods were introduced to study the impact of blasting on mine stability and block size as early as 1960 by the line segment measurement method proposed by Bapon (Sanchidrián et al., 2006). In recent years, there have been new developments in the image method, with the use of photography technology to determine the actual size of the blast block having taken off (Ozkahraman, 2006; Kabwe, 2018). Kruttschnitt et al. (Sanchidrián et al., 2009) have achieved the extraction of ore particle size information from multiple parallel belt conveyors using laser sensors; Lange and Crida (Cao et al., 2015) have respectively developed an ore particle size detection system and ore separation software. The commercial software such as Wipfrag, FragScan, SplitDesktop, and WIEP, which are used to analyze rock fragment size distributions, also indicate the continuous improvement and maturity of image processing.
In conclusion, a variety of methods have been applied in the research of blasting, but there are still some defects in the determination of blasting block size. Considering the KUZ-RAM prediction model overestimates the size of the blasting block, this paper, combining computer science and image processing technology, optimizes the empirical prediction formula for xm in the original model based on the results of actual blasting and simulated calculation. Taking the results of area measurement as the standard and adding the necessary correction factors, the accuracy of the modified model in the actual mine application is further verified. This is of great significance for improving the evaluation of the blasting effect of open-air step blasting.
2 Computational theory and method
2.1 R-R distribution and KUZ-RAM model
In this paper, R-R distribution model is used to describe the block size distribution. The R-R distribution model can be expressed as:
where, Y is the accumulation rate (%) under the screen if the particle size is less than x; x is the rock block size or screen size (mm); x0 is the characteristic size of the rock block, that is, the block size (mm) when the accumulation rate under the screen is (1-1/e)%,
The relationship between explosive consumption per unit and blasting average block size xm in open-pit mines is as follows, according to the relationship between average block size xm and blasting parameters established by Kuznetsov (1973) and Thomas Busuyi (2009):
Where, xm is the average diameter of block size (mm); A is the rock coefficient; k is the single consumption of explosive; e is the single hole charge (kg); Sanfo is the weight power of explosive relative to ANFO explosive (115-TNT).
Rock coefficient (A) can be calculated from Eq. 4 according to the related studies of Cunningham (1987) and Lilly (1986). Specific parameters are shown in Table 1.
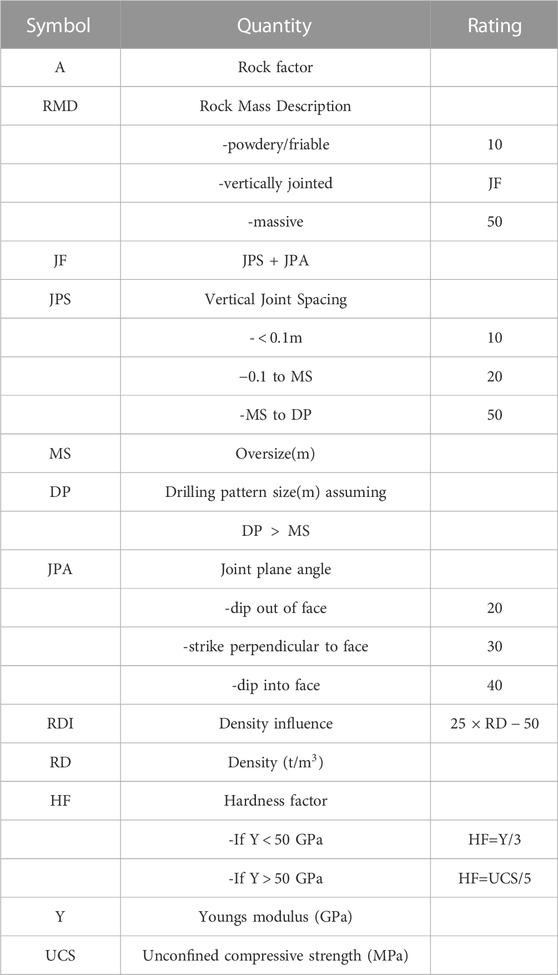
TABLE 1. Parameter values in various rock mass conditions.
2.2 Area measurement method
Rock screening can be regarded as the process of standard ellipsoid passing through the sieve, and its size can be calculated according to the best matching ellipsoid and area measurement method (Zhao, 2015):
where, a is the maximum radius of the best matching ellipsoid (mm); and b is the minimum radius of the best matching ellipsoid (mm); p is the perimeter of the exposed part of the rock (mm), s is the area of the exposed part of the rock (mm2).
There is a functional relationship between the sifting diameter (d) of rock blocks and the maximum and minimum radius of the best matching ellipse of rock blocks:
Thus, the sieving size of the rock block can be calculated by areal measurement. The measurement accuracy of area measurement method can reach 50 mm, and too small rock has no reference value.
In order to verify the accuracy of the area measurement method, this paper compares the image processing results with the field measurement results, as shown in Table 2.
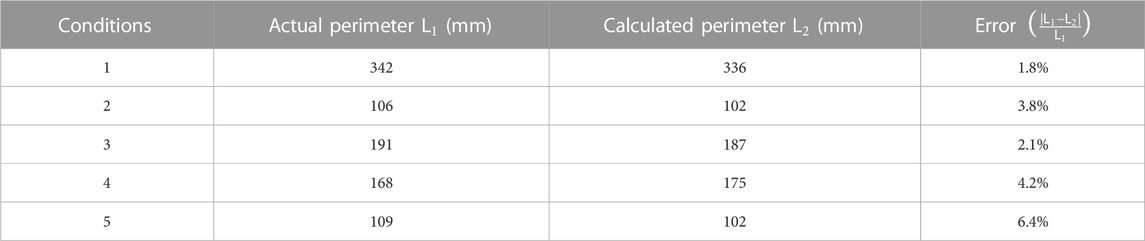
TABLE 2. Comparison between image analysis results and measured results.
As can be seen from the comparison in the table, the error between the image processing result and the measured result is about 5%. Considering the possible errors in the application, it can be considered that the image processing result is consistent with the real value.
A scientific extended application of the area measurement was adopted in this paper. Specifically, assuming that the density (ρ) of the rock block is same, the mass (m) of the rock block was replaced by the volume (V). Then, the volume accumulation rate of the best matching ellipsoid is used to approximate the mass accumulation rate of the rock block under the sieve. The sieving diameter (d) of the rock and the volume (V′) of the corresponding best matching ellipsoid are taken as a set of data, and arranged by the size d. According to the superposition principle, if the volume corresponding to a certain screen size d' is Vj′, then the ratio of the sum of all volumes (
2.3 Comparison between traditional KUZ-RAM model and area measurement method
The actual engineering data of Shenghua Quarry in Hebei Province and Yuanjiacun Iron Mine in Shanxi Province (in China) were used to verify the accuracy of the proposed model. In order to ensure the scientificity and accuracy of the field measured data, 15 groups of blasting measurement data under different blasting conditions at the two sites are selected for analysis and comparison. It is worth mentioning that stratified sampling is used to collect the size of the burst pile rock after rock blasting. The average diameter xm and characteristic diameter x0 of rock block obtained by area measurement method and traditional KUZ-RAM model are shown in Table 3.
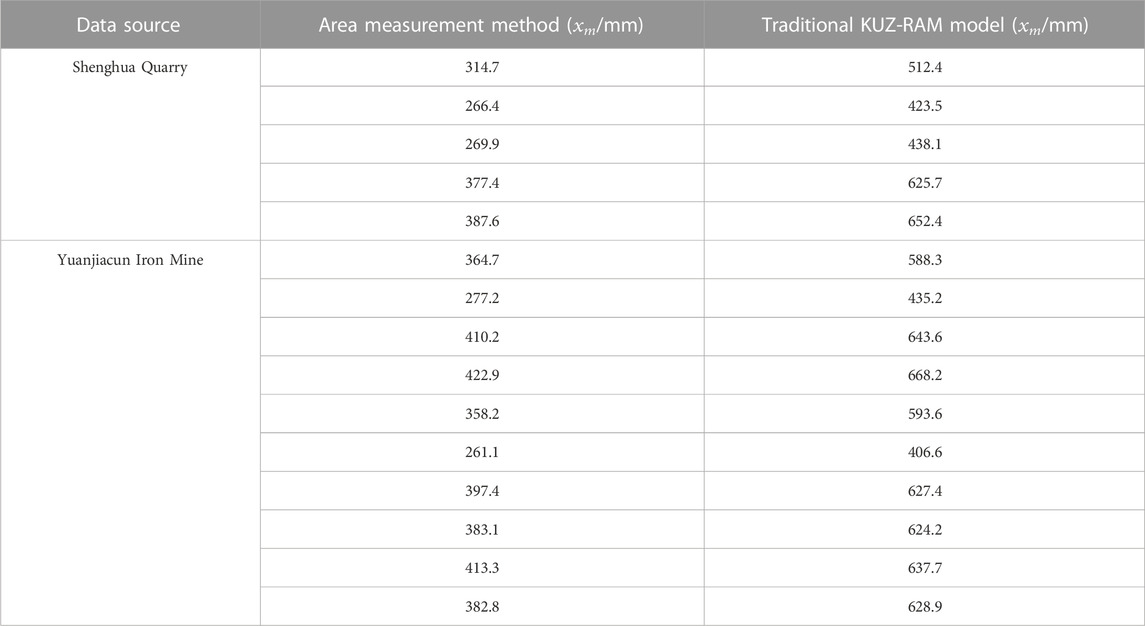
TABLE 3. Rock size characteristics predicted by acreage measurement and initial model.
The comparison of the calculation results of the two blasting rocks is shown in Figure 1. The results predicted by the traditional KUZ-RAM model are all larger than those obtained by the area measurement method. It can be seen that it is necessary for KUZ-RAM to add a correction coefficient term to the prediction model of xm to correct the above errors.
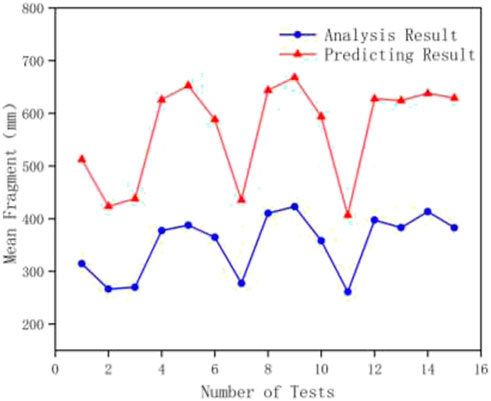
FIGURE 1. The results of xm calculation by the traditional KUZ-RAM model and the area measurement method.
3 Simulation calculation
3.1 Model construction
The three-hole model is constructed by simplifying the blasting situation in the field mining to simulate the field experiment. Its geometric structure and size are shown in Figures 2, 3. In the figures, H is the step height (9 m); T is the plugging length (2 m); L is the charge length (8 m); B is the minimum resistance line (2 m, roughly equal to the row spacing); S is the hole distance (3 m); D is the hole distance (150 mm).
FIGURE 2. Front view of the model.
FIGURE 3. Top view of the model.
The whole model is modeled by Euler element, and the side, bottom and back of the model are set as non-reflective boundary surface. The top surface and the front face of the model are modeled in the way of free surface. The initiation point is located in the center of the top surface and the bottom surface of the charge cylinder, and is set for simultaneous initiation at both ends of the explosive column, delay detonation between different column (Qi et al., 2022) (see Figure 4).
FIGURE 4. Boundary case of the model.
Riedel-Hiermaier-Thoma material model was adopted for rocks (Riedel et al., 1999), and the damage level was determined by Eq. 7.
where, Δεp is the cumulative plastic deformation of the model; ε f is the failure strain.
As a brittle material, rock mass has the characteristics of pressure correlation of compressive strength, strain hardening, damage softening and different strain rate effects of tension and pressure, etc. RHT constitutive model can be simplified according to the above basic assumptions of rock mass, and the rock mass blasting crushing model is used to study. The RHT material parameters used in the model have been calibrated by tests (Schill, 2012). The material used for the in-cavity blockage in the model was soil and foam (MAT_SOIL_AND_FOAM, generally used when the soil is not confined to a structure or when geometric boundaries do not exist) considering the RHT material does not support the Euler algorithm. The RHT material parameters are shown in Table 4.
TABLE 4. RHT model parameters for rock mass in Lagrangian elements.
The air in the model is assumed to be an ideal gas, and its equation of state is Rogers and Mayhew (1995):
where, P is gas pressure; ρ is the air density, 1.225 kg/m3; e0 is the initial internal energy density of air, 254.3 kJ/m3; γ is the adiabatic index, 1.4; the specific heat capacity of air is 717.6 J/kg·K; and the reference temperature is 288.2 K.
The explosive is TNT, and its explosion equation can be described by standard JWL equation of state (Lee et al., 1973):
where, p is detonation pressure; υ is the relative volume of detonation products; e is the initial specific internal energy; A1, A2, R1, R2, and μ are equation of state parameter constants (Qi et al., 2023). Related parameters are shown in Table 5.

TABLE 5. Explosive parameters of TNT.
3.2 Working condition design
According to the field test conditions, simulation conditions are designed in the simulation calculation (Table 6). The parameters of the first five groups of conditions correspond to the mine field production conditions, and the remaining conditions are used to study the relationship between blasting design parameters and blasting average block size.
TABLE 6. Model simulation conditions.
3.3 Blasting assessment of rock
The rock mass will have the maximum damage at the instantaneous energy peak (Li et al., 2021b). Taking the first group of working conditions in Table 3 as an example, the overall pressure distribution is shown in Figure 5. After removing elements with damage degree greater than 0.1, cracks will be formed in the rock mass, and detailed structural characteristics related to damage at different loading stages will be obtained (Li et al., 2023). The damage situation is shown in Figure 6.
FIGURE 5. The distribution of blasting pressure.
FIGURE 6. Damage distribution and crack morphology of rock mass.
Similar to the area measurement method, 3D was converted into 2D pictures by slicing considering the difficulty of estimating the size of debris directly on a 3D model. The multiple incisions were selected for fragment evaluation, as shown in Figure 7. Slices were sliced between each hole to obtain the fragmentation conditions between different cross sections.
FIGURE 7. Vertical cutting position.
The circumference and area of the rock fragments are calculated by operations in LS-DYNA and then combined with the area measurement method to determine the sifting size of the rock blocks. Section conditions of the first group of working conditions in Table 3 are shown in Figures 8, 9.
FIGURE 8. The blasting pressure distribution.
FIGURE 9. Crack distribution on one of cross sections.
3.4 Comparison of simulation results with field tests
In order to verify the accuracy of model calculation, the calculation results of the first five groups of working conditions are compared with the field mining data, as shown in Table 7.
TABLE 7. Comparison between model calculation and field test.
It can be seen from Table 5 that under the same working conditions as mine field production, the error of numerical calculation is within 10%. Considering the deviation of actual sampling accuracy, it is reasonable to think that the model can simulate the blasting mining process. After obtaining a large number of data, the original average block size prediction model is optimized.
4 Updating and discussion of the model
4.1 Model updating
The original KUZ-RAM formula is optimized and improved because the original formula overestimates the average block size xm. The prediction formula for the average block size shown in Eq. 3 is divided into two parts, which are the part representing the characteristics of rock mass (rock coefficient) and the parameter of blasting design. That is:
Lawal (2021) believes that coefficient 0.06 in Eq. 4 is the root cause of error when revising the KUZ-RAM model. However, this redefinition of rock coefficient not only reduces the application range of the original rock coefficient, but also fails to consider the influence of blasting design parameters on the prediction results. Therefore, the paper maintains the original rock coefficient in the optimization process of the model, and focuses on the optimization of blasting design parameters. The revised model is:
where, x′m is the corrected average blasting block size.
Equation 12 can also be rewritten as:
50 groups of blasting results and simulation data from two mines are selected, and Levenberg-Marquardt algorithm (L-M algorithm) is applied to fit the coefficient K of Eq. 13. The result of this coefficient is 0.623, which is more reasonable.
Therefore, Eq. 12 can be updated as:
The symbol in the formula has the same meaning as in the previous text.
4.2 Comparison between the updated and original model
Data sampling is conducted on the blasting results of another 15 groups under different working conditions in field blasting, and after sorting, xm and x0 are compared between the prediction results of the original, updated KUZ-RAM model, and obtained by the area measurement method (field measurement). The comparison results are shown in Table 8. From the comparison results of the three, it can be seen that the prediction results of the updated KUZ-RAM model are very close to that of the area measurement method. The prediction errors of xm were all below 6%, and the linear correlation coefficient R2 reached 0.97. This is significantly higher than the prediction accuracy of the original KUZ-RAM model with an average error of more than 60% (R2 = −1.99). In addition, the prediction error of the original model in x0 is further amplified due to the inaccuracy of the xm prediction results. The prediction error of x0 in the original model is more than 50% (R2 = −2.61), but the updated model is less than 8% (R2 = 0.96). It can be seen that the prediction accuracy of the updated thickness model in both xm and x0 has been greatly improved, which is very close to the actual measured results.
TABLE 8. Comparison of original KUZ-RAM model, updated model and field measured results.
The comparison results of Figures 10, 11 show that the optimized model in this paper can predict the size of blasting block size more accurately, and has a good effect on the prediction and description of the blasting distribution model. Moreover, the combination of image processing, area measurement and numerical simulation is easier to realize and cheaper than traditional statistical methods.
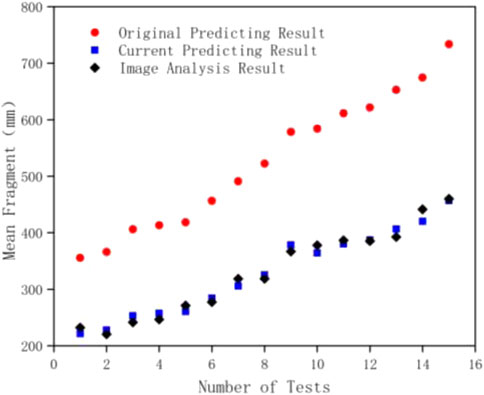
FIGURE 10. Comparison of xm results.

FIGURE 11. Comparison of x0 results.
4.3 Evaluation of the updated model
The regularity of calculation block size and field explosion and error before and after model updating is also further studied. The calculation results of the updated KUZ-RAM model were compared with those of the original KUZ-RAM model through the field blasting results. All the data are from the field test results under different blasting conditions, including large and small blasting conditions. The blasting results under different lithology and blasting parameters are analyzed and compared.
As discussed above, the prediction result of the original KUZ-RAM model for xm is generally larger than that of the updated model. As shown in Figure 12, the horizontal axis is the image analysis result of xm (measured I); vertical axis is the original KUZ-RAM model prediction error (|xm − I|), linear fitting results for both: |xm − I| = 0.53I + 24.12, linear coefficient R2 = 0.86. It can be considered that the error has a linear relationship with the actual average block size, which also proves the feasibility of using a single correction coefficient to correct the model. Another obvious phenomenon is that the error is further amplified with the increase of xm. In open-pit mines, large-scale blasting is the main mining method, and its average block size is usually greater than 500 mm, which indicates that the original KUZ-RAM model has great limitations in application.

FIGURE 12. The prediction error trend of the original KUZ-RAM model with xm value.
In order to further verify the accuracy of the updated model, image analysis and updated model prediction are used to calculate and optimize different blasting results. The calculation comparison of R-R distribution models is shown in Figure 13. The linear relationship between the updated model and the results of image analysis (R2 = 0.99) is higher than that of the original model (R2 = 0.72). It can be seen that the R-R distribution model obtained by KUZ-RAM model is basically consistent with the results of image analysis, which can provide a more accurate description of the block distribution of field mines.
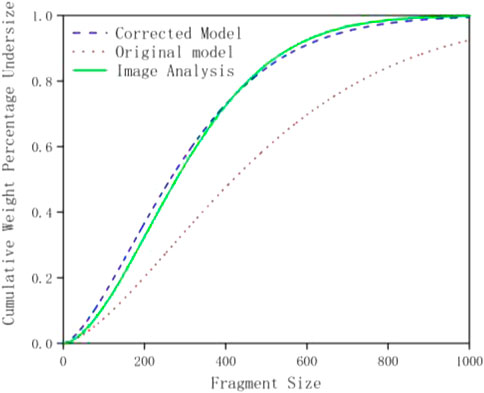
FIGURE 13. Calculation comparison of R-R distribution models.
5 Conclusion
In this paper, we use the fitting method in image processing and machine learning to propose a correction to the prediction formula of the average block size
At the same time, for karst areas with complex geological conditions, modified blasting block parameters are realized according to the comparison results of different rock damage integrity, which can better evaluate the rock integrity after project crushing, which is of great significance for practical engineering applications.
Data availability statement
The original contributions presented in the study are included in the article/Supplementary Material, further inquiries can be directed to the corresponding author.
Author contributions
MJ: Responsible for experiment, data processing and manuscript writing. WZ: Data collection and analysis. YE: Data collection, Experimental work. LM: Responsible for experiment, data processing and Proofreading of data.
Funding
This work was supported by National Natural Science Foundation of China (No: 51678050).
Conflict of interest
The authors declare that the research was conducted in the absence of any commercial or financial relationships that could be construed as a potential conflict of interest.
Publisher’s note
All claims expressed in this article are solely those of the authors and do not necessarily represent those of their affiliated organizations, or those of the publisher, the editors and the reviewers. Any product that may be evaluated in this article, or claim that may be made by its manufacturer, is not guaranteed or endorsed by the publisher.
References
Asl, P. F., Monjezi, M., Hamidi, J. K., and Armaghani, D. J. (2018). Optimization of fly rock and rock fragmentation in the Tajareh limestone mine using metaheuristics method of firefly algorithm. Eng. Comput. 34, 241–251. doi:10.1007/s00366-017-0535-9
Bahrami, A., Monjezi, M., Goshtasbi, K., and Ghazvinian, A. (2010). Prediction of rock fragmentation due to blasting using artificial neural network. Eng. Comput., 27(2), 1–5. doi:10.1007/s00366-010-0187-5
Cao, L., Tan, H., and Peng, H. (May 2015). Mixed dynamic task allocation for multiple UAV. J. Nanjing Univ. Sci. Technol. 39 (2), 206–214.
Cunningham, C. V. B. (1987). Fragmentation estimations and the kuz—ram model, Proceedings of the second international symposium on rock fragmentation by blasting. Keystone: Colorado, 475–487.
da Gama, C. D. (1971). Size distribution general law of fragments resulting from rock blasting. Trans. Soc. Min. Eng,AIME 250 (4), 314–316. doi:10.1016/j.ijrmms.2014.08.007
Favreau, R. F. 1983. “Rock displacement velocity of bench blasting[J],” in Proceedings of the first International Conference on Blasting and Rock Fragmentation, 47:408–418.
Favreau, R. F.1983. “Displacement velocity of rock by step blasting,” in Proceedings of the First International Conference on Rock Blasting.
Gheibie, S., Aghababaei, H., Hoseinie, S. H., and Pourrahimian, Y. (2009). Modified kuz—ram fragmentation model and its use at the sungun copper mine. J. Rock Mech. Min. Sci. 46 (6), 967–973. doi:10.1016/j.ijrmms.2009.05.003
Harries, A. (1973). Mathematical model of cratering and blasting national symp. Adelaide: Australia: Rock Frag.
Harries, G. (1977). “The Calculation of the Fragmentation of rock from createring,” in 15th Aplom symposium Apcom '77. (Brisbar, Austrilia).
Just, G. D. (1974). The application of size distribution equations to rock breakage by explosives. J. Rock Mech. Min. Sci. Geomech. Abstr. 11 (1), 22. doi:10.1007/BF01238045
Kabwe, E. (2018). Velocity of detonation measurement and fragmentation analysis to evaluate blasting efficacy. J. Rock Mech. Geotech. Eng. 10, 523–533. doi:10.1016/j.jrmge.2017.12.003
Kuznetsov, V. M. (1973). The mean diameter of the fragments formed by blasting rock. Sov. Min. Sci. 9, 144–148. doi:10.1007/bf02506177
Lawal, A. I. (2021). A new modification to the Kuz-Ram model using the fragment size predicted by image analysis. J. Rock Mech. Min. Sci. 138, 104595. doi:10.1016/j.ijrmms.2020.104595
Lee, E., Finger, M., and Collins, W. . JWL equation of state coefficients for high explosives. Lawrence Livermore National Laboratory Report, 1973. Livermore, CA, USA.
Li, X. L., Chen, S. J., Liu, S. M., and Li, Z. H. (2021). AE waveform characteristics of rock mass under uniaxial loading based on Hilbert-Huang transform. J. Central South Univ. 28 (6), 1843–1856. doi:10.1007/s11771-021-4734-6
Li, X. L., Chen, S. J., Wang, S., Zhao, M., and Liu, H. (2021). Study on in situ stress distribution law of the deep mine taking Linyi Mining area as an example. Adv. Mater. Sci. Eng. 9 (4), 5594181–5594211. doi:10.1155/2021/5594181
Li, X. L., Zhang, X. Y., Shen, W. L., Zeng, Q., Chen, P., Qin, Q., et al. (2023). Research on the mechanism and control technology of coal wall sloughing in the ultra-large mining height working face. Int. J. Environ. Res. Public Health 20 (2), 868. doi:10.3390/ijerph20010868
Lilly, P. A. (1986). An empirical method of assessing rock mass blastability, Proceedings of the large open pit planning conference. Parkville, Victoria: Australian IMM, 89–92.
Liu, S. M., Li, X. L., Wang, D. K., and Zhang, D. (2020). Investigations on the mechanism of the microstructural evolution of different coal ranks under liquid nitrogen cold soaking. Energy Sources, Part A Recovery, Util. Environ. Eff., 28, 1–17. doi:10.1080/15567036.2020.1841856
Margolin, G., Numerical simulation of failure . Changsha, China: Proceedings of the First International Conference on Blasting Rock Breaking,1985:203–210.
McHugh, S. Numerical simulation of dynamic induced failure and breakage. Proceedings of the first International Conference on Blasting and Rock Fragmentation. Bristol, UK, 1983; 234--243.
Mehrdanesh, A., Monjezi, M., and Sayadi, A. R. (2018). Evaluation of effect of rock mass properties on fragmentation using robust techniques. Eng. Comput. 34, 253–260. doi:10.1007/s00366-017-0537-7
Ozkahraman, H. T. (2006). Fragmentation assessment and design of blast pattern at Goltas Limestone Quarry, Turkey. Int. J. Rock Mech. Min. Sci. 43 (4), 628–633. doi:10.1016/j.ijrmms.2005.09.004
Qi, J., Wang, D., Liu, Q., Liu, C., Wang, Z., He, Z., et al. (2022). Deflagration evolution characteristic and chemical reaction kinetic mechanism of JP-10/DEE mixed fuel in a large-scale tube. Fuel 322, 124238. doi:10.1016/j.fuel.2022.124238
Qi, J., Wang, D., and Shi, C. (2023). Effects of aluminum powder additives on deflagration and detonation performance of JP-10/DEE mixed fuel under weak and strong ignition conditions. Appl. Energy 331, 120477. doi:10.1016/j.apenergy.2022.120477
Riedel, W., Thoma, K., Hiermaier, S., and Schmolinske, E. (1999). Penetration of reinforced concreteby BETA-B-500, numerical analysis using a new macroscopic concrete model for hydrocodes, Proceedings of the 9th International Symposium on Interaction of the Effects of Munitions with Structures. Berlin, Germany, 315–322.
Rogers, G. F. C., and Mayhew, Y. R. Thermodynamic and transport properties of fluids. John Wiley & Sons, 1995. Hoboken, NJ, USA.
Sanchidrián, J. A., Segarra, P., and López, L. M. (2006). A practical procedure for the measurement of fragmentation by blasting by image analysis. Rock Mech. Rock Eng. 39 (4), 359–382. doi:10.1007/s00603-005-0073-4
Sanchidrián, J. A., Segarra, P., Ouchterlony, F., and Lopez, L. M. (2009). On the accuracy of fragment size measurement by image analysis in combination with some distribution functions. Rock Mech. Rock Eng. 42 (1), 95–116. doi:10.1007/s00603-007-0161-8
Schill, M. Finite Element Simulations Of Blasting And The Effects Of Precise Initiation On Fragmentation. Swebrec: Norrbotten, Sweden; 2012.
Shim, H-J., Ryu, D-W., Chung, S-K., Synn, J-H., and Song, J-J. (2009). Optimized blasting design for large-scale quarrying based on a 3-D spatial distribution of rock factor. J. Rock Mech. Min. Sci. 46 (2), 326–332. doi:10.1016/j.ijrmms.2008.07.006
Spathis, , and Alex, T. (2004). A correction relating to the analysis of the original kuz-ram model. Fragblast 8 (4), 201–205. doi:10.1080/13855140500041697
Thomas Busuyi, J. (2009). Optimization of drilling and blasting operations in an open pit mine—The SOMAIR experience. Min. Sci. Technol. 19 (3), 736–739. doi:10.1016/s1674-5264(09)60134-4
Trivedir, S. I. N. G. H. T. N., and Guptan, (2015). Prediction of blastinduced flyrock in opencast mines using ANN and ANFIS. Geotechnical Geol. Eng. 33 (4), 875–891. doi:10.1007/s10706-015-9869-5
Turcotte, D. L. (1986). Fractals and fragmentation. J.Geophys Ros. 91 (132), 1921–1926. doi:10.1029/jb091ib02p01921
Xie, C., Nguyen, H., Bui, X.-N., Choi, Y., Zhou, J., and Nguyen-Trang, T. (2021). Predicting rock size distribution in mine blasting using various novel soft computing models based on meta-heuristics and machine learning algorithms. Geosci. Front. 12 (3), 101108. doi:10.1016/j.gsf.2020.11.005
Zhao, M. (2015). Study on lumpiness distribution of rock burst based on fractal theory. Inner Mongolia University of Science and Technology. Inner Mongolia, China.
Keywords: step blasting, average lumpiness, KUZ-RAM model, area measurement method, numerical simulation calculation
Citation: Jianbo M, Zhongqi W, En Y and Menghua L (2023) Research on evaluation model of rock failure integrity under complex geological conditions in karst area. Front. Earth Sci. 11:1177459. doi: 10.3389/feart.2023.1177459
Received: 01 March 2023; Accepted: 31 March 2023;
Published: 09 May 2023.
Edited by:
Xuelong Li, Shandong University of Science and Technology, ChinaReviewed by:
Rulong Bn, Guilin University of Technology, ChinaJunlong Sun, Kunming University of Science and Technology, China
Copyright © 2023 Jianbo, Zhongqi, En and Menghua. This is an open-access article distributed under the terms of the Creative Commons Attribution License (CC BY). The use, distribution or reproduction in other forums is permitted, provided the original author(s) and the copyright owner(s) are credited and that the original publication in this journal is cited, in accordance with accepted academic practice. No use, distribution or reproduction is permitted which does not comply with these terms.
*Correspondence: Liu Menghua, bG1oY3p4ekAxNjMuY29t