 F. Napolitano1
 O. Amoroso1
 V. De Novellis2,3*
 G. M. Adinolfi4,5
 R. De Matteis4
 E. Sansosti2D. Russo6
 R. Caputo6
 V. Convertito3
- 1Dipartimento di Fisica “E. R. Caianiello”, Università degli Studi di Salerno, Fisciano, Italy
- 2Consiglio Nazionale delle Ricerche, Napoli, Italy
- 3Istituto Nazionale di Geofisica e Vulcanologia, Osservatorio Vesuviano, Napoli, Italy
- 4Dipartimento di Scienze e Tecnologie, Università degli Studi del Sannio, Benevento, Italy
- 5Dipartimento di Scienze della Terra, Università degli Studi di Torino, Torino, Italy
- 6Dipartimento di Fisica e Scienze della Terra, Università degli Studi di Ferrara, Ferrara, Italy
We present the first seismic imaging of the crustal volume affected by the March-April 2021 Thessaly sequence by applying a 3D seismic tomography to the aftershocks recorded by an unprecedented number of stations. The results, in terms of VP, VS, and VP/VS ratio and earthquakes’ location parameters, depict blind fluid-filled inherited structures within the Northern Thessaly seismic gap. The tomographic images highlight the basal detachment accommodating the Pelagonian nappe onto the carbonate of the Gavrovo unit. The high VP/VS (>1.85) where most of the seismicity occurs increases from SE to NW, showing possible fluid accumulation in the NW edge of the seismogenic volume that could have contributed to the sequence evolution. The aftershock relocations correlate well with the fault planes of the three mainshocks proposed by several geodetic models, but also show additional possible faults sub-parallel and antithetical to the main structures, not to be overlooked for future seismic risk mitigation.
1 Introduction
The March-April 2021 Thessaly seismic sequence (hereafter TSS), with its maximum moment magnitude of 6.3 and five events with Mw>5, represents one of the largest seismic sequences affecting a continental extensional domain in Greece in the instrumental era (Figure 1). The sequence started on 3 March 2021 (10:16:08 UTC) with the occurrence of an Mw 6.3 earthquake, followed by an Mw 6.0 event on 4 March (18:38:19 UTC), and by an Mw 5.6 on 12 March (12:57:50 UTC). Several works have investigated the TSS through joint analyses of geodetic, seismological and geological data (De Novellis et al., 2021; Ganas et al., 2021; Karakostas et al., 2021; Papadopoulos et al., 2021; Tolomei et al., 2021; Kontoes et al., 2022; Yang et al., 2022). The location and focal mechanism of the three mainshocks have been widely inferred by modern geodetic techniques that, exploiting the InSAR measurements short satellite revisit time, allowed isolating the contribution of the major earthquakes of the sequence and to investigate their interaction. Early geodetic models (Ganas et al., 2021; Papadopoulos et al., 2021; Kontoes et al., 2022) indicate that the sequence was caused by unmapped blind normal fault segments. De Novellis et al. (2021) and Yang et al. (2022) proposed four seismogenic faults for the seismic sequence, consisting of two NE-dipping faults (one of which is responsible for the Mw 6.3), another NE-dipping fault for Mw 6.0 and a SW-dipping fault for Mw 5.6. Based on field investigations, among the activated structures, only the Vlachogianni fault segment (Figure 1) provided clear evidence of linear morphogenic deformation along the surface (Ganas et al., 2021; Koukouvelas et al., 2021; Kassaras et al., 2022; Kontoes et al., 2022). Geological and geophysical information has also been combined with the Robust Satellite Technique (RST) to detect thermal anomalies associated with the MW6.3 event (Kouli et al., 2021).
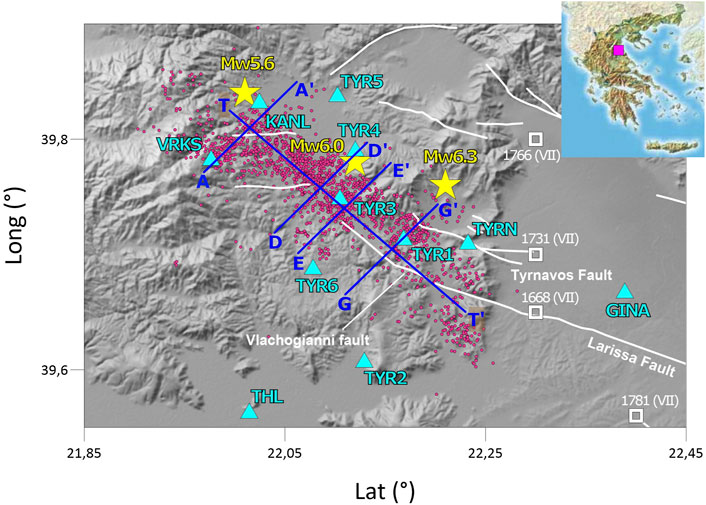
FIGURE 1. Study area and seismological data with main tectonic lineaments (white lines) redrawn after Caputo and Pavlides (1993). Historical earthquakes in Thessaly area (Caputo and Helly, 2005b) are shown with white squares, including the maximum intensity, IMAX, of each event in brackets (data by Caputo et al., 2006). The March-April 2021 aftershock sequence relocated through the 3D tomographic inversion is shown with magenta circles. Cyan triangles represent the seismic network used in this study to perform the seismic tomography. Yellow stars are the three strongest events of the TSS. Traces of the vertical tomographic cross-sections are shown with blue segments.
The interest in the area affected by the TSS is driven by the fact that it has been recognized as a possible seismic gap (Caputo, 1995), partially filled by the sequence (De Novellis et al., 2021), embedded within one of the most seismically active areas in Greece, at the back-arc area of the Aegean microplate (Caputo and Pavlides, 1993). Despite the persistent tectonic activity (Caputo, 1993; Caputo et al., 1994; 2004; Caputo, 1995; Caputo, 1996; Caputo and Helly, 2005a), likely due to the relatively low strain rate characterizing the region, the cumulative displacement on these progressively growing faults has not yet been able to strongly affect the morphology of the area where clear hydrographic anomalies could be still observed (Caputo et al., 2021). Two major active fault systems have been recognized in Thessaly (Caputo, 1995) with comparable evidence of late Pleistocene and Holocene seismogenic activity. However, while the southern zone has been struck by several strong earthquakes during historical and instrumental recording periods (Papadopoulos, 1992; Caputo and Helly, 2005a; Caputo et al., 2006) (Figure 1), in northern Thessaly there is no instrumental record of strong events over the last three centuries, with the only exception of the 1941 Larissa event (M 6.3) (Papaioannou, 1988; Ambraseys and Jackson, 1990; Caputo, 1995).
Therefore, the TSS represents an opportunity to improve our knowledge about the tectonics of this seismic gap area. In this work, we provide the first detailed image of the elastic properties and aftershock hypocenter locations of the TSS crustal volume. To reach this goal, we have performed a 3D P- and S-wave tomographic inversion using a large number of the TSS aftershock events, recorded by permanent and temporary seismic stations installed during the sequence in the epicentral area. The new high-resolution local 3D velocity models and aftershocks’ location are jointly interpreted with the available geological information of the area, with the recent InSAR measurements, and with the fault parameters computed for the three strongest events of the sequence. Our results give new insights into the TSS’s highly fluid-filled crustal volumes characterized by inherited blind fault networks and could be used as a benchmark for future seismic hazard assessments in Thessaly.
2 Data
The seismic catalogue consists of 1,853 earthquakes occurring from 28 February 2021 to 26 April 2021 with moment magnitude (Mw) ranging between 0.2 and 6.3, recorded at 116 seismic stations within a maximum epicentral distance of 100 km. The earthquakes of the sequence have been recorded by the broad-band and strong motion stations of the Hellenic Unified Seismological Network (HUSN; http://eida.gein.noa.gr/). Mainshocks and aftershocks have been previously located by De Novellis et al. (2021) by using a 1D velocity model proposed for an area to the South-East of Thessaly (Papadimitriou et al., 2010). In order to obtain an accurate tomographic image of the crustal volume affected by the sequence, in the present study we selected the events and the stations that fall within a volume extending 40×41×20 km3 around the mainshock epicentral area. The selection reduced the initial dataset to ∼1,500 events, for a total number of 7,859 P- and 7,767 S-waves arrival times provided by NOA-IG (National Observatory of Athens - Institute of Geodynamics) recorded at 11 seismic stations (Figure 1).
We note that 7 temporary seismic stations (TYR1-6) were installed in the area on 5 March 2021 by AUTH (Department of Geophysics of the Aristotle University of Thessaloniki; HT network; doi:10.7914/SN/HT) and two other stations (VRKS and KANL) were installed on the Northern edge of the sequence on 14 March by the University of Patras Seismology Lab (UPSL; HP network; doi:10.7914/SN/HP) (Figure 1). The lack of these temporary stations within the focal area prevented us from reaching a sufficient number of P- and S-wave first arrival times necessary for obtaining reliable aftershock locations during the early phases of the sequence. Consequently, all events that occurred in the first 2 days of the sequence, including the early strongest earthquakes (Mw > 5), cannot be considered in the present tomographic study.
3 Methods
Local earthquake 3D tomography is highly dependent on the starting velocity model and the initial hypocenter locations (Kissling et al., 1994). In order to achieve a reliable starting model, we first determined an optimized 1D velocity model for the TSS area, obtained solving the coupled hypocenter-velocity problem by implementing the VELEST software (Kissling et al., 1995) (Supplementary Figure S1). From the starting dataset, we selected the best constrained 546 earthquakes on the basis of the following quality criteria: azimuthal gap smaller than 150°; Root Mean Square (RMS) smaller than 0.55 s; both horizontal and vertical hypocentral location error lower than 0.7 km. The 1D P-wave velocity model proposed by Papadimitriou et al. (2010) (cyan line in Figure S1) has been used as the starting model. After 8 iterations, we retrieved the best minimum 1D P-wave velocity model for the area (thicker blue line in Supplementary Figure S1), achieving an RMS reduction of 83% relative to the initial model and an average station correction value of 0.059 s.
The 1,500 events selected from the starting dataset have been located using the Non-LinLoc software (Lomax et al., 2000), considering the new minimum 1D P-wave model (Supplementary Figure S1) and the VP/VS ratio of 1.78 provided by De Novellis et al. (2021). We excluded all the events having less than 6 direct wave arrival times, azimuthal gap higher than 220° and horizontal and vertical location error larger than 1 km. The resulting dataset consists of 1,100 well-constrained seismic events (Supplementary Figure S2) that have been used as input for the 3D velocity tomography and for the interpretation of the overall seismotectonic setting of the area.
Both the 3D P- and S-wave velocity models, as well as the obtained earthquakes’ location, were estimated using an iterative linearized travel time inversion code (Latorre et al., 2004). This code has been already successfully used in tectonic (Amoroso et al., 2014; 2017; Napolitano et al., 2021; De Landro et al., 2022), and volcanic regions (Serlenga et al., 2016; De Landro et al., 2017). It has also been applied in geothermal settings (Amoroso et al., 2018; 2022) and in the feasibility study of offshore exploitation areas (De Landro et al., 2020). The direct problem of first arrival travel times is handled on a fine grid with nodes separated 250 m along the three orthogonal directions by computing a finite-difference solution of the eikonal equation (Podvin and Lecomte, 1991). The slowness along the rays is numerically integrated to recalculate travel times. In order to estimate VP, VS and earthquake hypocenter parameters, P- and S-wave travel times are simultaneously inverted by using the least squares root (LSQR) method of Paige and Saunders (1982). The damping parameter resulting from the trade-off L-curve was set to 0.3 (Supplementary Figure S3).
A trilinear interpolation function, based on a grid of regularly spaced nodes, finally describes the velocity distribution in a continuous medium. The inversion mesh grid was set to 4×4×1 km3. We have a-posteriori verified that the convergence is reached after 6 iterations, with a root mean square reduction of 50% (Supplementary Figure S4). In order to assess the 3D spatial resolution of the final velocity model, we performed the checkerboard tests (Supplementary Figures S5, S6). We computed the similarity between exact and recovered checkerboard anomalies (resolvability) and displayed it on the final images (Zelt, 1998).
4 Results
We show in Figure 2 the horizontal slices at 0, 2, 3, 4, 5, 6, 7, 8 and 10 km depth of VP and VS models. Only those sectors where the checkerboard tests semblance exceeds 0.7 (enclosed in dark gray lines in Figures 2, 3, 4) are considered to be well resolved and discussed. The obtained VP values span from 4.6 to 6.9 km/s, whereas VS values range between 2.6 and 3.9 km/s. We also provided 12 vertical cross-sections, 9 of which oriented NNE-SSW (12-km long) and 3 along the WNW-ESE direction (28-km long) (Figures 1, 2, 3, 4; Supplementary Figure S7), all reaching a depth of 10 km.
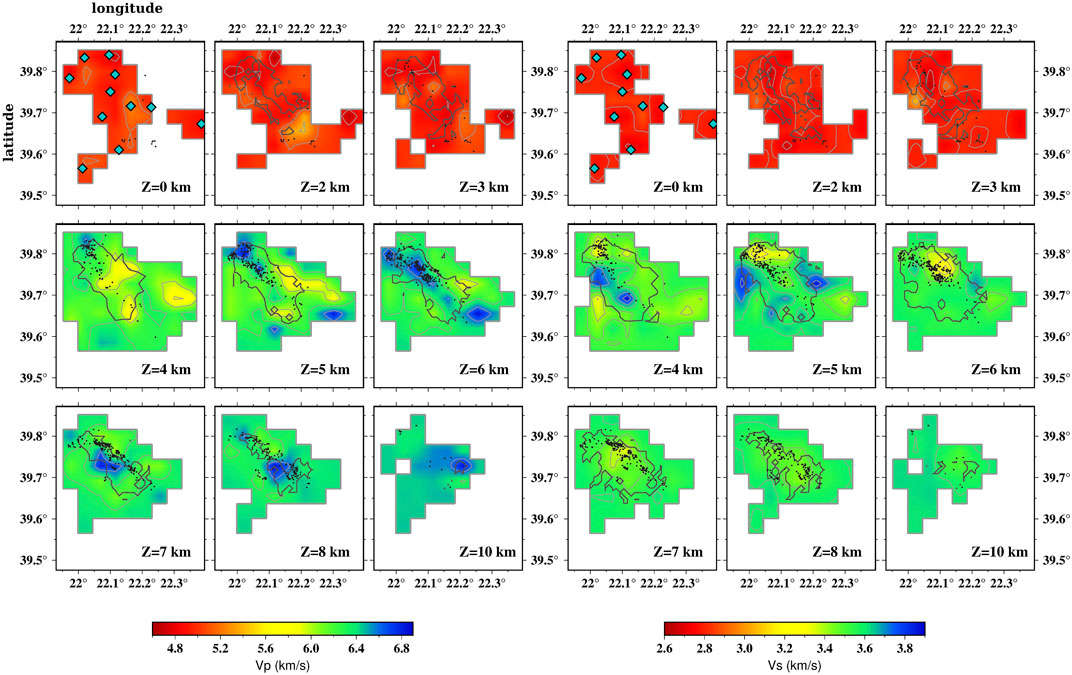
FIGURE 2. Horizontal slices for 0–10 km depths showing P- and S- wave velocity models (left and right panels, respectively). The used seismic stations are represented in the 0 km depth slice as cyan diamonds. Black dots represent the location of the seismic events achieved from the tomographic inversion procedure. Each slice includes the events below and above 500 m from the selected depth. Well-resolved areas are contoured by solid dark gray lines.
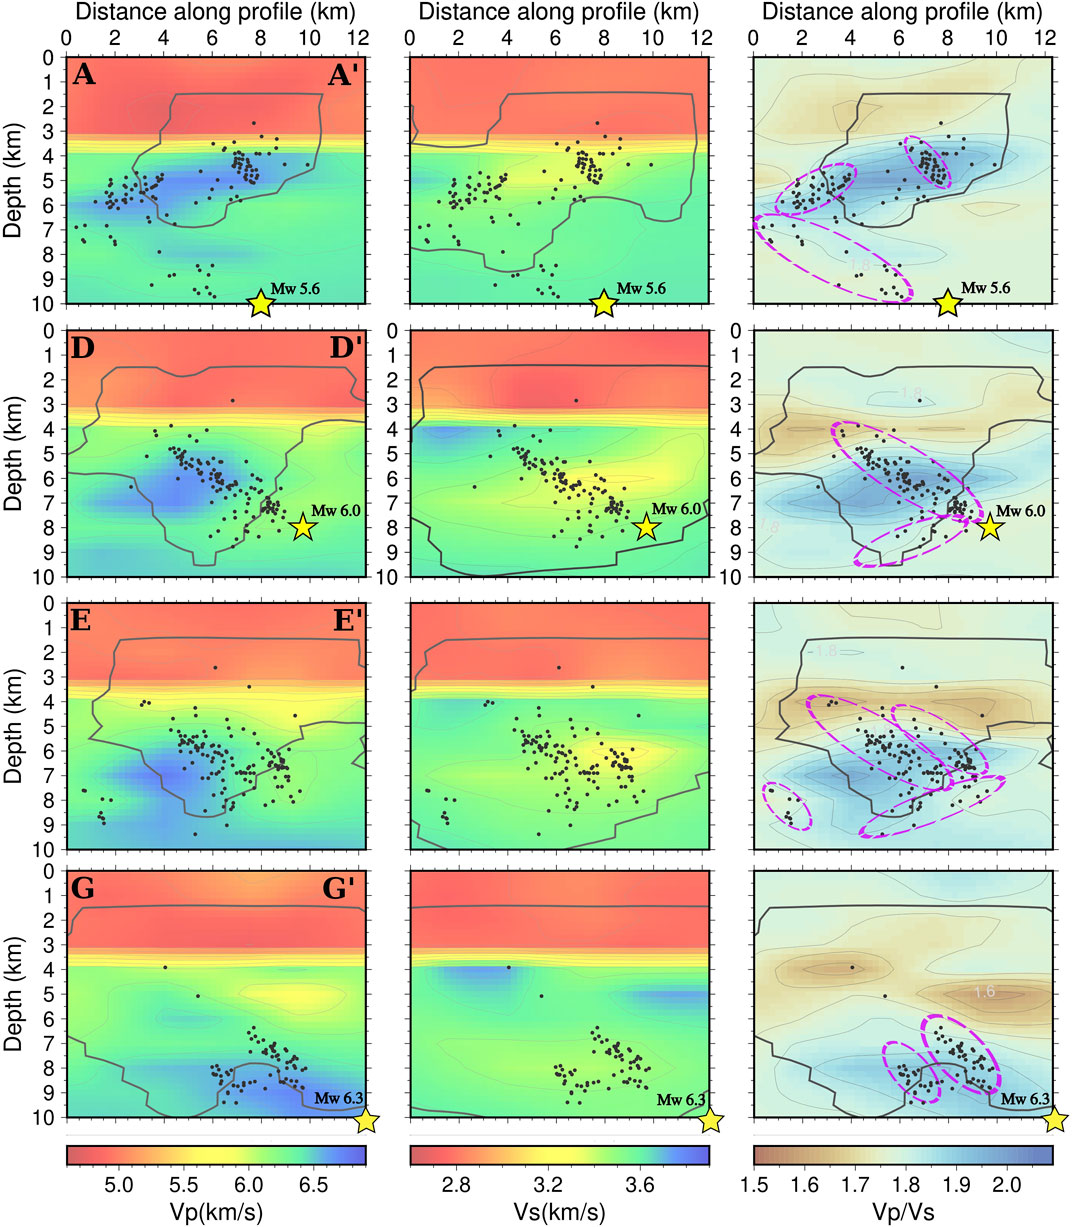
FIGURE 3. VP, VS and VP/VS model and micro-earthquake locations projected onto the AA’, DD’, EE’ and GG’ cross-sections located in Figure 1. Well-resolved areas are contoured by solid dark gray lines. The purple dashed ellipses represent the cluster of seismicity found in this work. Yellow stars represent the mainshocks of the sequence.
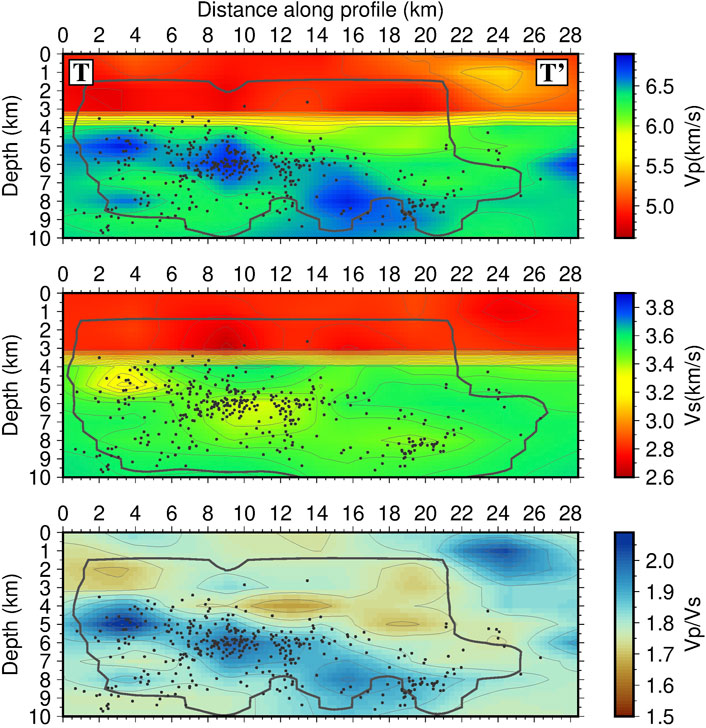
FIGURE 4. VP, VS and VP/VS model and micro-earthquake locations projected onto the TT’ cross-section located in Figure 1. Well-resolved areas are contoured by solid dark gray lines. Earthquakes within 1 km from each side of the slice are shown with black circles.
Differently from Figure 2, the hypocenters shown in each vertical cross-section are plotted by selecting a distance of ±1,000 m from each slice. The VP/VS ratio maps (Figures 3, 4; Supplementary Figure S7) have been obtained by dividing the value of VP by VS at each node of the inversion grid. We centered the color map to the average VP/VS value (1.78) computed by De Novellis et al. (2021) and set the lower and the upper limit of the color scale at 1.5 and 2.1, respectively. This allows us to visually identify relatively high and low VP/VS anomalies if compared with the average value.
The tomographic images show a sharp increase of VP between 3 and 4 km-depth. Considering the well resolved area, VP is quite homogeneous between 1.5 and 3 km depth with values around 4.9–5.0 km/s, while at ∼4 km-depth, VP is up to 6.3 km/s. Similar velocity variations are observed for VS showing values of 2.6–2.8 km/s between 1.5 and 3 km-depth and 3.5–3.6 km/s below 4 km-depth (Figures 2, 3, 4).
Higher VP values (∼6.8 km/s) are observed in the NW portion of the seismogenic volume at 4 km-depth progressively widening toward the southeast up to 6 km-depth and further deepening in the central sector down to at least 8 km, which is the last well resolved slice from our tomographic results (Figure 4). A second velocity anomaly is observed in the eastern sector at depths between 5 and 7 km. It is noteworthy that the major high VP anomaly seems to be paired with a slightly low VS anomaly (3.3 km/s), which corresponds to a significant increase of the VP/VS ratio in this portion of the seismogenic volume (Figures 3, 4). A high VP/VS anomaly (>1.9) deepens from ∼4 km depth in the NW sector to 10 km depth at the southernmost tip of the TSS volume, following the relocated seismicity depth. In each vertical section, this high VP/VS anomaly is systematically topped by a low VP/VS anomaly (1.55–1.65) (Figures 3, 4).
Based on the obtained velocity models, the relocated earthquakes, obtained from the inversion procedure, are confined within a 30×9×7 km3 seismogenic volume, suggesting the presence of a complex fault network. The volume involved in the TSS appears roughly elongated in a NW-SE direction (300°) and rotated towards the WNW-ESE direction at the northernmost edge of the volume. Almost all the analyzed and relocated aftershocks show a hypocentral depth greater than 3 km and most of them fall within high VP/VS volumes (Figures 3, 4). The relocated aftershocks appear to be clustered into multiple seismogenic sub-volumes of varying sizes likely representing not only the main causative faults of the three mainshocks but also some sub-parallel and antithetic faults reactivated during the seismic sequence. These fault structures and the inferred main properties combined with available geological and tectonic information will be discussed in the following section.
5 Discussion
The reliable earthquakes’ location and the detailed new 3D P- and S-wave velocity tomographic images obtained in the present study enable us to constrain the main crustal properties and identify the geometry of the fault network activated during the TSS. The first result achieved is the sharp increase of the P-waves (from 5.0 km/s to 6.3 km/s), and S-waves velocity (from 2.6–2.8 km/s to 3.5–3.6 km/s), revealed between 3 and 4 km depth (Figures 2, 3, 4). This feature possibly corresponds to a low-angle shear zone representing the basal detachment accommodating the overlying Pelagonian nappe, mainly consisting of metamorphic rocks, onto the recrystallized carbonate platform of the Gavrovo unit. The result is corroborated by lithological succession in regions close to our study area (Makris et al., 2001; Papoulia and Makris, 2010; Makris and Papoulia, 2018) and in region characterized by similar geodynamic context, where a similar succession has been inferred (Improta et al., 2000; 2014; Amoroso et al., 2014; Napolitano et al., 2021). Currently, the latter extensively outcrops in the Mount Olympus tectonic window about 25 km east of the investigated area (Nance, 2010), corroborating the presence of this nearly horizontal detachment and the consequent rapid velocity increase with depth. Within the underlying carbonate platform, the tomographic images show NW-SE elongated rock volumes with high VP (6.5–6.8 km/s) and high VP/VS (>1.85) values (Figures 3, 4, 5; Supplementary Figure S7). These volumes are likely bounded by predominantly NE-dipping inherited structures, whose geometry was previously unknown, that slightly deviate from the mainly ESE–WNW direction of the major active faults of Thessaly (Caputo, 1995). We illuminate for the first time several clusters of aftershocks, likely associated with these inherited structures. The fault pattern and the structural architecture of the Thessaly crust, illustrated in this work, is compatible with an older accretionary complex related to the Oligo-Miocene Hellenic subduction, the associated compressional regime followed by the WSW-wards migration of the post-collisional orogenic collapse (Kilias et al., 1991; Caputo and Pavlides, 1993).
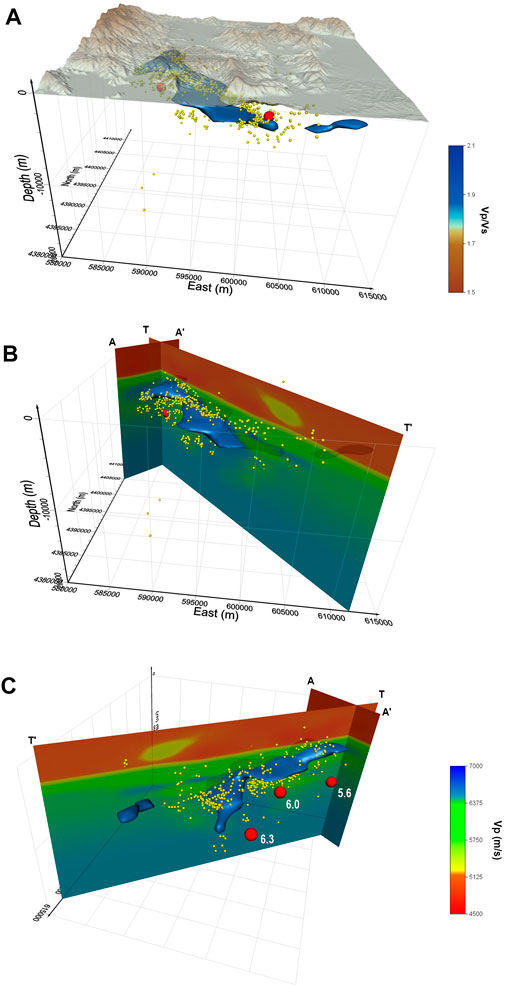
FIGURE 5. 3D high VP/VS anomaly (>1.85), relocated seismicity (yellow spheres) and mainshocks hypocenters (red spheres), in (A) topped by the topography of Northern Thessaly area; in (B) and (C) shown with the addition of VP cross-sections (AA’ and TT’) from two different view angles. VP increases at 4 km depth, showing the basal detachment that accommodates the overlying Pelagonian nappe onto the carbonatic Gavrovo unit.
The lack of temporary seismic stations in the focal area at the very beginning of the sequence prevented us from relocating the three mainshocks of TSS. In order to achieve a full picture of the sequence, the source parameters of the mainshocks computed in previous papers (Ganas et al., 2021; Kassaras et al., 2022) and the fault planes inferred from surface deformations analysis using the InSAR technique (De Novellis et al., 2021; Ganas et al., 2021; Tolomei et al., 2021; Kontoes et al., 2022) have been combined with the new 3D tomographic model, in terms of velocity and earthquake relocation, provided in the present work.
Section GG’ in Figure 3 shows two clusters of seismicity achieved by our analysis located in a high VP (6.7–6.8 km/s) and high VP/VS ratio (1.85–1.9) region. The Mw 6.3 hypocentre is located at 10 km depth (Table 1; Ganas et al., 2021), and matches the deepest tip of the northern cluster. The focal mechanisms provided by different authors (Ganas et al., 2021; Kassaras et al., 2022; Kontoes et al., 2022) indicate a NW-SE striking, NE-dipping, pure dip-slip normal faulting (see Supplementary Table S1 for further details). In addition, considering the suggested error on the dip angle (∼10°) the two recognized clusters match the F1a and F1b planes inferred by De Novellis et al. (2021). In particular, the Mw 6.3 event occurred at the deepest tip of F1b, which has been interpreted as causing a rupture length of ∼16 km from surface deformations analysis. The lack of temporary stations in the early days of the sequence allows us to image only part of the MW 6.3 fault plane (∼8 km, Slices from EE’ to II’ in Supplementary Figure S7), preventing us from commenting on the total rupture length of the seismogenic structure which extend southward up to latitude 39.6°.
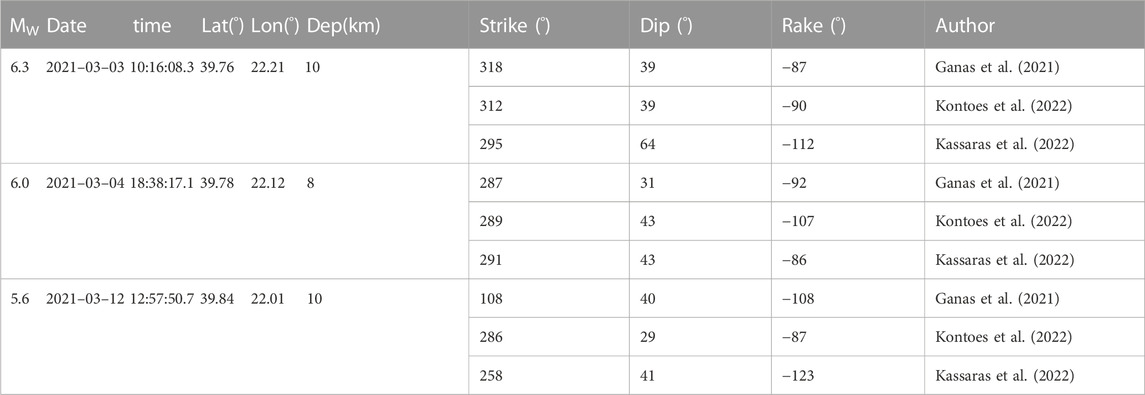
TABLE 1. Focal mechanisms of the three mainshocks of the Thessaly seismic sequence computed by Ganas et al. (2021), Kontoes et al. (2022) and Kassaras et al. (2022).
The location of the Mw 6.0 event (Table 1; Ganas et al., 2021) is at depth of 8 km, at the deepest tip of the seismogenic volume shown in slice DD’ (Figure 3), which is characterized by high VP (6.7–6.8 km/s) and high VP/VS (1.9–1.95) values. The focus volume of the Mw 6.0 event is instead characterized by intermediate values of VP (6.3 km/s) and VP/VS (1.78). The major seismogenic structure exactly coincides with the F2 plane proposed by De Novellis et al. (2021) as the causative source of the Mw 6.0. The agreement confirms the slightly counterclockwise rotation of this volume if compared with the Mw 6.3 fault plane, with a similar dip (30°–40°) and rupture length (∼13–15 km) as the Mw 6.3, in accordance with recent geodetic models (De Novellis et al., 2021; Tolomei et al., 2021). Focal mechanisms computed for the Mw 6.0 corroborate our results (Table 1; Ganas et al., 2021; Kassaras et al., 2022; Kontoes et al., 2022).
The source orientation of the Mw 5.6 event is still debated. Some authors have proposed a SW-dipping fault plane (De Novellis et al., 2021; Papadopoulos et al., 2021; Sarhosis et al., 2022; Yang et al., 2022), while Kontoes et al. (2022) have recently proposed two possible fault plane solutions. Our analysis seems to be able to fix this point. From our relocations, the deeper NE-dipping cluster of aftershocks (vertical section AA’ in Figure 3) appears as the most likely source of the event along which, at a depth of 10 km, the event appears to have occurred (Table 1; Ganas et al., 2021). Thus, our results support the NE-dipping solution proposed by Kontoes et al. (2022) and Kassaras et al. (2022) (see Table 1) as the most likely focal plane for this event. This area is characterized by higher-than-average VP (>6.8 km/s) and by the highest VP/VS (1.95–2.00) values, even though these anomalies are at the edge of the well-resolved area by the checkerboard tests.
Another remarkable result of the present study, that is highlighted by the aftershocks relocations, concerns the central volume involved in TSS where the seismicity seems to describe a low-angle structure located between 7 and 10 km depth in agreement with the major nearby Tyrnavos and Larissa Faults (sections DD’, EE’ in Figure 3). The ellipse-shaped cluster of seismicity associated with the Mw 6.0 event is clearly in the middle of at least two (probably three) sub-parallel structures, one less than 2 km to the east, and another about 5 km to the west (section EE' in Figure 3). Moving to the NW, a dense cluster of seismicity is located within the hanging-wall block of the Mw 5.6 rupture (section AA’ in Figure 3). This cluster, also characterized by one of the highest VP (>6.8 km/s) and VP/VS (1.95) values, has not been identified in other works. These inherited structures, revealed with our new detailed aftershock relocations, must necessarily be taken into account in possible future scenarios in the framework of seismic risk mitigation in Thessaly.
High VP/VS values (>1.85), always topped by low VP/VS anomaly (1.55–1.65), have been found in the whole seismogenic volume from SE, at 10 km-depth, to NW, at 4 km-depth (Figures 3, 4, 5; Supplementary Figure S7). In the same direction the VP/VS value increases, reaching values around 2 in the extreme NW of the sequence, while VS decreases from the mean value at the same depths (Figure 3 and Slices RR', SS' and TT' in Supplementary Figure S7). A strong consistency between the longitudinal sections with respect to the sequence is evident, showing a progressive deepening of the low Vp/Vs anomaly (nearly horizontal in the SS' slice in Supplementary Figure S7 and deeper in the SE going toward the RR' slice). It should be noted that in the uppermost crust the VP/VS ratio is useful in discriminating zones saturated with fluids (Nur and Booker, 1972) since the P- and S-wave velocities are differently affected by the presence and physical state of fluids. Similar high VP/VS values have been linked to the presence of fluids in other comparable geological settings (Chiarabba et al., 2009; Amoroso et al., 2014; Adinolfi et al., 2019; 2020; Napolitano et al., 2021). Additionally, the calculated high VP/VS anomaly provides a Poisson ratio of ∼0.3, denoting a predominant water saturation of rocks in the examined crustal volume (Dvorkin et al., 1999).
Since our analysis deals with aftershocks that occurred just 1 month after the occurrence of the Mw 6.3, our results suggest the imprinting and redistribution of fluids after the sequence with a likely fluid accumulation in the NW sector of the seismogenic volume. This inference is also supported by recent works (De Novellis et al., 2021; Yang et al., 2022) that show how the evolution of the entire sequence is compatible with a mechanism of pore fluid pressure diffusion likely due to the volume deformation produced by the two main events.
6 Conclusion
In conclusion, the present study provides the first 3D seismic tomography of the Thessaly region and the relocation of most of the aftershock events that occurred from March to April 2021. The tomographic images have highlighted the nearly horizontal basal detachment that accommodates the overlying Pelagonian nappe, mainly consisting of metamorphic rocks, onto the recrystallized carbonate platform of the Gavrovo unit. The outcome is corroborated also by the Gavrovo unit outcrop in the Mount Olympus tectonic window, 25 km away from the focal area. Almost all the aftershock hypocenters have been located within the underlying carbonate unit and characterized by VP and VP/VS values higher-than-background. The seismogenic volume mainly develops along the NW-SE direction. The achieved relocations depict clear ellipse-shaped clusters of events that well correlate with the fault planes proposed for the three largest events of the sequence (Mw 6.3, 6.0, 5.6) from several geodetic models, but also show additional possible volumes sub-parallel and antithetical to the main structures affecting Northern Thessaly region.
High VP/VS values have been interpreted as the imprinting of the redistribution of fluids during the TSS sequence. These results are corroborated by the diffusivity analysis achieved in previous papers, which inferred pore fluid pressure higher than hydrostatic and fluid movement along the seismogenic volume as the most likely contributors to the sequence evolution. Indeed, VP/VS increases from SE to NW, showing a possible fluid accumulation in correspondence of the NW edge of the seismogenic volume. Our results give new insights into the highly fluid-filled inherited blind fault network of the TSS and could be a benchmark for future seismic hazard assessments in Thessaly. Indeed, when single faults are not known, it is a common practice in seismic hazard analyses to assume areal or volumetric sources with uniform seismic potential and Poisson seismicity model (e.g., Reiter, 1991). Conversely, the knowledge of single faults or fault systems allows to refine seismic hazard estimations since specific distance metrics (e.g., Joyner and Boore distance) as well as seismicity recurrence models (e.g., Characteristic model, Brownian Passage Time) can be considered (e.g., Convertito et al., 2006; Pace et al., 2006).
Data availability statement
The original contributions presented in the study are included in the article/supplementary material, further inquiries can be directed to the corresponding author.
Author contributions
VC, VD, and ES conceived the work. FN, OA, RD, VC, and GA performed the 1D velocity model, earthquake relocation and 3D tomographic analysis. All authors contributed to the joint interpretation of the 3D seismic tomography, geology and deformation analysis. FN, OA, VD, and RC worked on the draft preparation. All authors discussed the results and contributed to the final manuscript.
Funding
This work has been supported by the PRIN-MATISSE (20177EPPN2) project funded by the Italian Ministry of Education and Research.
Conflict of interest
The authors declare that the research was conducted in the absence of any commercial or financial relationships that could be construed as a potential conflict of interest.
Publisher’s note
All claims expressed in this article are solely those of the authors and do not necessarily represent those of their affiliated organizations, or those of the publisher, the editors and the reviewers. Any product that may be evaluated in this article, or claim that may be made by its manufacturer, is not guaranteed or endorsed by the publisher.
Supplementary material
The Supplementary Material for this article can be found online at: https://www.frontiersin.org/articles/10.3389/feart.2023.1176348/full#supplementary-material
References
Adinolfi, G. M., Cesca, S., Picozzi, M., Heimann, S., and Zollo, A. (2019). Detection of weak seismic sequences based on arrival time coherence and empiric network detectability: An application at a near fault observatory. Geophys. J. Int. 218 (3), 2054–2065. doi:10.1093/gji/ggz248
Adinolfi, G. M., Picozzi, M., Cesca, S., Heimann, S., and Zollo, A. (2020). An application of coherence-based method for earthquake detection and microseismic monitoring (Irpinia fault system, Southern Italy). J. Seismol. 24 (5), 979–989. doi:10.1007/s10950-020-09914-7
Ambraseys, N. N., and Jackson, J. A. (1990). Seismicity and associated strain of central Greece between 1890 and 1988. Geophys. J. Int. 101 (3), 663–708. doi:10.1111/j.1365-246x.1990.tb05577.x
Amoroso, O., Ascione, A., Mazzoli, S., Virieux, J., and Zollo, A. (2014). Seismic imaging of a fluid storage in the actively extending Apennine mountain belt, southern Italy. Geophys. Res. Lett. 41 (11), 3802–3809. doi:10.1002/2014gl060070
Amoroso, O., Festa, G., Bruno, P. P., D'Auria, L., De Landro, G., Di Fiore, V., et al. (2018). Integrated tomographic methods for seismic imaging and monitoring of volcanic caldera structures and geothermal areas. Appl. Geophys. 156, 16–30. doi:10.1016/j.jappgeo.2017.11.012
Amoroso, O., Napolitano, F., Hersir, G. P., Agustsdottir, T., Convertito, V., De Matteis, R., et al. (2022). 3D seismic imaging of the nesjavellir geothermal field, SW-Iceland. Front. Earth Sci. 10. doi:10.3389/feart.2022.994280
Amoroso, O., Russo, G., De Landro, G., Zollo, A., Garambois, S., Mazzoli, S., et al. (2017). From velocity and attenuation tomography to rock physical modeling: Inferences on fluid-driven earthquake processes at the Irpinia fault system in southern Italy. Geophys. Res. Lett. 44 (13), 6752–6760. doi:10.1002/2016gl072346
Caputo, R., Bravard, J.-P., and Helly, B. (1994). The pliocene-quaternary tecto-sedimentary evolution of the Larissa plain (eastern thessaly, Greece). Geodin. Acta 7 (4), 219–231. doi:10.1080/09853111.1994.11105267
Caputo, R., and Helly, B. (2005b). Archaeological evidences of past earthquakes: A contribution to the SHA of thessaly, central Greece. J. Earthq. Eng. 9 (2), 199–222. doi:10.1080/13632460509350539
Caputo, R., Helly, B., Pavlides, S., and Papadopoulos, G. (2006). Archaeo- and palaeoseismological investigations in Northern Thessaly (Greece): Insights for the seismic potential of the region. Nat. Hazards 39, 195–212. doi:10.1007/s11069-006-0023-9
Caputo, R., Helly, B., Pavlides, S., and Papadopoulos, G. (2004). Palaeoseismological investigation of the Tyrnavos fault (thessaly, central Greece). Tectonophysics 394 (1), 1–20. doi:10.1016/j.tecto.2004.07.047
Caputo, R., Helly, B., Rapti, D., and Valkaniotis, S. (2021). Late quaternary hydrographic evolution in thessaly (central Greece): The crucial role of the piniada valley. Quat. Int. 635 (2022), 3–19. doi:10.1016/j.quaint.2021.02.013
Caputo, R., and Helly, B. (2005a). The Holocene activity of the rodià fault, central Greece. J. Geodyn. 40 (2-3), 153–169. doi:10.1016/j.jog.2005.07.004
Caputo, R. (1995). Inference of a seismic gap from geological data: Thessaly (Central Greece) as a case study. Ann. Geophys. 38 (1). doi:10.4401/ag-4127
Caputo, R. (1993). “Morphotectonics and kinematics along the Tyrnavos fault, northern Larissa plain, mainland Greece,” in Neotectonics and active faulting. Editors I. Stewart, C. Vita-Finzi, and L. A. Owen (Stuttgart: Zeitschrift für Geomorphol. N.F., Suppl.-Bd.), 94, 167–185.
Caputo, R., and Pavlides, S. (1993). Late cainozoic geodynamic evolution of thessaly and surroundings (Central-Northern Greece). Tectonophysics 223 (3-4), 339–362. doi:10.1016/0040-1951(93)90144-9
Caputo, R. (1996). The active nea anchialos fault system (central Greece): Comparison of geological, morphotectonic, archaeological and seismological data. Ann. Geophys. 39 (3), 557–574. doi:10.4401/ag-3992
Chiarabba, C., De Gori, P., and Boschi, E. (2009). Pore-pressure migration along a normal-fault system resolved by time-repeated seismic tomography. Geology 37 (1), 67–70. doi:10.1130/g25220a.1
Convertito, V., Emolo, A., and Zollo, A. (2006). Seismic-hazard assessment for a characteristic earthquake scenario: An integrated probabilistic–deterministic method. Bull. Seism. Soc. Am. 96 (2), 377–391. doi:10.1785/0120050024
De Landro, G., Amoroso, O., Russo, G., D’Agostino, N., Esposito, R., Emolo, A., et al. (2022). Decade-long monitoring of seismic velocity changes at the Irpinia fault system (southern Italy) reveals pore pressure pulsations. Sci. Rep. 12 (1), 1247–1249. doi:10.1038/s41598-022-05365-x
De Landro, G., Amoroso, O., Russo, G., and Zollo, A. (2020). 4d travel-time tomography as a tool for tracking fluid-driven medium changes in offshore oil–gas exploitation areas. Energies 13 (22), 5878. doi:10.3390/en13225878
De Landro, G., Serlenga, V., Russo, G., Amoroso, O., Festa, G., Bruno, P. P., et al. (2017). 3D ultra-high resolution seismic imaging of shallow Solfatara crater in Campi Flegrei (Italy): New insights on deep hydrothermal fluid circulation processes. Sci. Rep. 7 (1), 3412–3510. doi:10.1038/s41598-017-03604-0
De Novellis, V., Reale, D., Adinolfi, G. M., Sansosti, E., and Convertito, V. (2021). Geodetic model of the March 2021 Thessaly seismic sequence inferred from seismological and InSAR data. Remote Sens. 13, 3410. doi:10.3390/rs13173410
Dvorkin, J., Mavko, G., and Nur, A. (1999). Overpressure detection from compressional-and shear-wave data. Geophys. Res. Lett. 26 (22), 3417–3420. doi:10.1029/1999gl008382
Ganas, A., Valkaniotis, S., Briole, P., Serpetsidaki, A., Kapetanidis, V., Karasante, I., et al. (2021). Domino-style earthquakes along blind normal faults in northern thessaly (Greece): Kinematic evidence from field observations, seismology, SAR interferometry and GNSS. Bull. Geol. Soc. Greece 58, 37–86. doi:10.12681/bgsg.27102
Improta, L., De Gori, P., and Chiarabba, C. (2014). New insights into crustal structure, cenozoic magmatism, CO2 degassing, and seismogenesis in the southern apennines and irpinia region from local earthquake tomography. J. Geophys. Res. Solid Earth 119, 8283–8311. doi:10.1002/2013JB010890
Improta, L., Iannaccone, G., Capuano, P., Zollo, A., and Scandone, P. (2000). Inferences on the upper crustal structure of Southern Apennines (Italy) from seismic refraction investigations and subsurface data. Tectonophysics 317, 273–298. doi:10.1016/S0040-1951(99)00267-X
Karakostas, V., Papazachos, C., Papadimitriou, E., Foumelis, M., Kiratzi, A., Pikridas, C., et al. (2021). The March 2021 Tyrnavos, central Greece, doublet (Μw6.3 and Mw6.0): Aftershock relocation, faulting details, coseismic slip and deformation. Bull. Geol. Soc. Greece. 58, 131–178. doi:10.12681/bgsg.27237
Kassaras, I., Kapetanidis, V., Ganas, A., Karakonstantis, A., Papadimitriou, P., Kaviris, G., et al. (2022). Seismotectonic analysis of the 2021 Damasi-Tyrnavos (Thessaly, Central Greece) earthquake sequence and implications on the stress field rotations. J. Geodyn. 150, 101898. doi:10.1016/j.jog.2022.101898
Kilias, A., Fasoulas, C., Priniotakis, M., Sfeikos, A., and Frisch, W. (1991). Deformation and HP/LT metamorphic conditions at the tectonic window of kranea (W-Thessaly, northern Greece). Z. Dtsch. Geol. Ges. 142, 87–96. doi:10.1127/zdgg/142/1991/87
Kissling, E., Ellsworth, W. L., Eberhart Phillips, D., and Kradolfer, U. (1994). Initial reference models in local earthquake tomography. J. Geophys. Res. Solid Earth 99 (B10), 19635–19646. doi:10.1029/93jb03138
Kissling, E., Kradolfer, U., and Maurer, H. (1995). Program VELEST user’s guide-Short Introduction. ETH Zurich: Institute of Geophysics.
Kontoes, C., Alatza, S., Chousianitis, K., Svigkas, N., Loupasakis, C., Atzori, S., et al. (2022). Coseismic surface deformation, fault modeling, and coulomb stress changes of the March 2021 thessaly, Greece, earthquake sequence based on InSAR and GPS data. Seismol. Res. Lett. 93 (5), 2584–2598. doi:10.1785/0220210112
Koukouvelas, I. K., Nikolakopoulos, K. G., Kyriou, A., Caputo, R., Belesis, A., Zygouri, V., et al. (2021). The March 2021 Damasi earthquake sequence, central Greece: Reactivation evidence across the westward propagating Tyrnavos graben. Geosciences 11 (8), 328. doi:10.3390/geosciences11080328
Kouli, M., Peleli, S., Saltas, V., Makris, J. P., and Vallianatos, F. (2021). Robust Satellite Techniques for mapping thermal anomalies possibly related to seismic activity of March 2021, Thessaly Earthquakes. Bull. Geol. Soc. Greece 58, 105–130. doi:10.12681/bgsg.27058
Latorre, D., Virieux, J., Monfret, T., Monteiller, V., Vanorio, T., Got, J. L., et al. (2004). A new seismic tomography of Aigion area (Gulf of Corinth, Greece) from the 1991 data set. Geophys. J. Int. 159 (3), 1013–1031. doi:10.1111/j.1365-246x.2004.02412.x
Lomax, A., Virieux, J., Volant, P., and Berge-Thierry, C. (2000). “Probabilistic earthquake location in 3D and layered models,” in Advances in seismic event location (Dordrecht: Springer), 101–134.
Makris, J., and Papoulia, J. (2018). “Mapping sedimentary basins and crust on/offshore Western Greece by deep seismic soundings: The Corfu and Lefkas-Killini profiles,” in In 2018 SEG international exposition and annual meeting (OnePetro).
Makris, J., Papoulia, J., Papanikolaou, D., and Stavrakakis, G. (2001). Thinned continental crust below northern Evoikos Gulf, central Greece, detected from deep seismic soundings. Tectonophysics 341 (1-4), 225–236. doi:10.1016/s0040-1951(01)00186-x
Nance, R. D. (2010). Neogene–recent extension on the eastern flank of Mount Olympus, Greece. Tectonophysics 488 (1-4), 282–292. doi:10.1016/j.tecto.2009.05.011
Napolitano, F., Amoroso, O., La Rocca, M., Gervasi, A., Gabrielli, S., and Capuano, P. (2021). Crustal structure of the seismogenic volume of the 2010–2014 pollino (Italy) seismic sequence from 3D P-and S-wave tomographic images. Front. Earth Sci. 9, 735340. doi:10.3389/feart.2021.735340
Nur, A., and Booker, J. R. (1972). Aftershocks caused by pore fluid flow? Science 17 (4024), 885–887. doi:10.1126/science.175.4024.885
Pace, B., Peruzza, L., Lavecchia, G., and Boncio, P. (2006). Layered Seismogenic source model and proba-bilistic seismic-hazard analyses in Central Italy. Bull. Seism. Soc. Am. 96 (1), 107–132. doi:10.1785/0120040231
Paige, C. C., and Saunders, M. A. (1982). Lsqr: An algorithm for sparse linear equations and sparse least squares. ACM Trans. Math. Softw. (TOMS) 8 (1), 43–71. doi:10.1145/355984.355989
Papadimitriou, P., Kaviris, G., and Makropoulos, K. (2010). The cornet seismological network: 10 years of operation, recorded seismicity and significant applications. Ann. géologiques Des. pays helléniques 45, 193–208.
Papadopoulos, G. A., Agalos, A., Karavias, A., Triantafyllou, I., Parcharidis, I., and Lekkas, E. (2021). Seismic and geodetic imaging (DInSAR) investigation of the March 2021 strong earthquake sequence in Thessaly, Central Greece. Geosciences 11, 311. doi:10.3390/geosciences11080311
Papadopoulos, G. A. (1992). Rupture zones of strong earthquakes in the Thessalia region, Central Greece. Proc. XXIII Gen. Assem. Esc. Prague 2, 337–340.
Papaioannou, I. (1988). I seismiki istoria tis Larisas kata to 18o kai 19o aiona [The seismic history of Larissa during the 18th and 19th centuries]. Eleftheria Newsp. 7.
Papoulia, J., and Makris, J. (2010). Tectonic processes and crustal evolution on/offshore Western Peloponnese derived from active and passive seismics. Bull. Geol. Soc. Greece 43 (1), 357–367. doi:10.12681/bgsg.11187
Podvin, P., and Lecomte, I. (1991). Finite difference computation of traveltimes in very contrasted velocity models: A massively parallel approach and its associated tools. Geophys. J. Int. 105 (1), 271–284. doi:10.1111/j.1365-246x.1991.tb03461.x
Sarhosis, V., Giarlelis, C., Karakostas, C., Smyrou, E., Bal, I. E., Valkaniotis, S., et al. (2022). Observations from the March 2021 thessaly earthquakes: An earthquake engineering perspective for masonry structures. Bull. Earthq. Eng. 20, 5483–5515. doi:10.1007/s10518-022-01416-w
Serlenga, V., de Lorenzo, S., Russo, G., Amoroso, O., Garambois, S., Virieux, J., et al. (2016). A three-dimensional QP imaging of the shallowest subsurface of Campi Flegrei offshore caldera, southern Italy. Geophys. Res. Lett. 43 (21), 11–209.
Tolomei, C., Caputo, R., Polcari, M., Famiglietti, N. A., Maggini, M., and Stramondo, S. (2021). The use of interferometric synthetic aperture radar for isolating the contribution of major shocks: The case of the March 2021 thessaly, Greece, seismic sequence. Geosciences 11, 191. doi:10.3390/geosciences11050191
Wessel, P., Luis, J. F., Uieda, L., Scharroo, R., Wobbe, F., Smith, W. H. F., et al. (2019). The generic mapping tools version 6. Geochem. Geophys. Geosystems 20, 5556–5564. doi:10.1029/2019GC008515
Yang, J., Xu, C., Wen, Y., and Xu, G. (2022). Complex coseismic and postseismic faulting during the 2021 Northern Thessaly (Greece) earthquake sequence illuminated by InSAR observations. Geophys. Res. Lett. 49, e2022GL098545. doi:10.1029/2022GL098545
Keywords: tomography and imaging, seismicity and tectonics, local crustal structure, seismology, role of fluids
Citation: Napolitano F, Amoroso O, De Novellis V, Adinolfi GM, De Matteis R, Sansosti E, Russo D, Caputo R and Convertito V (2023) Seismic imaging of fluid-filled inherited structures of the Northern Thessaly (Greece) seismic gap. Front. Earth Sci. 11:1176348. doi: 10.3389/feart.2023.1176348
Received: 28 February 2023; Accepted: 11 April 2023;
Published: 20 April 2023.
Edited by:
Aydın Büyüksaraç, Çanakkale Onsekiz Mart University, TürkiyeReviewed by:
Hamdi Alkan, Yüzüncü Yıl University, TürkiyeFilippos Vallianatos, National and Kapodistrian University of Athens, Greece
Copyright © 2023 Napolitano, Amoroso, De Novellis, Adinolfi, De Matteis, Sansosti, Russo, Caputo and Convertito. This is an open-access article distributed under the terms of the Creative Commons Attribution License (CC BY). The use, distribution or reproduction in other forums is permitted, provided the original author(s) and the copyright owner(s) are credited and that the original publication in this journal is cited, in accordance with accepted academic practice. No use, distribution or reproduction is permitted which does not comply with these terms.
*Correspondence: V. De Novellis, di5kZW5vdmVsbGlzQGlyZWEuY25yLml0