 Ahmed Mohamed
 Saad S. Alarifi
 Ahmed Abdelrady
94% of researchers rate our articles as excellent or good
Learn more about the work of our research integrity team to safeguard the quality of each article we publish.
Find out more
ORIGINAL RESEARCH article
Front. Earth Sci. , 17 April 2023
Sec. Solid Earth Geophysics
Volume 11 - 2023 | https://doi.org/10.3389/feart.2023.1173569
This article is part of the Research Topic Advanced Methods for Interpreting Geological and Geophysical Data View all 36 articles
This study combined gravity data from the Earth Gravitational Model (EGM2008) with other data to better understand the spatial variations of the sedimentary cover and the structural trends that affect groundwater flow in the Nubian Sandstone Aquifer System. Our findings were verified and evidenced by geological, geochronological, geochemical data, and earthquake records: 1) The Uweinat-Aswan basement uplift, which runs east-west, partially isolates the Dakhla subbasin from the shallower northern Sudan subbasin, and thereby impeding the south-to-north groundwater flow from northern Sudan platform to the Dakhla subbasin; 2) A thickening of the sedimentary cover in the NE-SW direction from the southern Kufra through the northern Kufra to the Dakhla subbasin; 3) The sedimentary cover was found to increase from less than 500 m in the south (Northern Sudan and Uweinat region) to more than 6 km in the north (Mediterranean coast); 4) A number of structural trends (NE-SW, N-S, E-W, and NW-SE) affecting the region; 5) A large Pelusium megashear system that runs northeast to southwest makes it easier for groundwater to flow from the Kufra subbasin to the Dakhla subbasin; 6) Along the paths that groundwater takes, like from Siwa to Qattara and from northwest Farafra to north Bahariya, and along structures that run in the same direction as the flow, a progressive increase in 36Cl groundwater ages were observed; 7) It is a better way to learn about the hydrogeological context of large aquifers and figure out how to best manage these underground water sources.
Water scarcity has affected parts of the Middle East, and it is widely known that disputes over the limited resources are frequent (Wolf, 1998; Amery and Wolf, 2000; Wolf and Newton, 2007). One of these areas that demands immediate and global attention is northeast Africa. Given the significance of water for both people and ecosystems, water sustainability is a crucial issue on a worldwide scale (United Nations, 2013; Bernauer and Böhmelt, 2020). Climate change and human-caused water use have an impact on water sustainability (Wada et al., 2010; United Nations World Water Assessment Programme, 2014).
Four countries in northeast Africa share the largest groundwater aquifer in the Sahara, known as the Nubian Sandstone Aquifer System (NSAS) (Figure 1). The transboundary Nubian aquifer, which covers an area of 2 × 10⁶ km2, is shared by Egypt (38%), Libya (34%), Sudan (17%), and Chad (11%), with Egypt and Libya possessing the majority of the aquifer’s water resources, whereas Chad and Sudan having a smaller amount (Thorweihe and Heinl, 2002). Future infrastructure projects in these countries may have access to a steady supply of water from the NSAS. The Dakhla, Kufra, and Northern Sudan Platform subbasins comprise the NSAS (Figure 1).
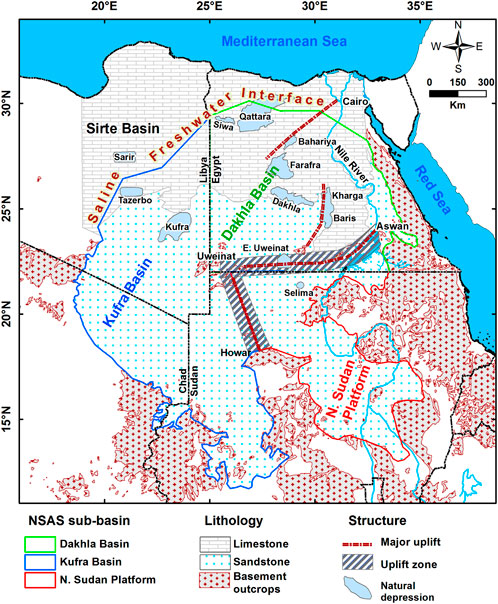
FIGURE 1. Location map showing the distribution of the NSAS, sub-basins, and basement uplifts within the aquifer.
Sediment thickness and structural trends are important parameters in mapping subsurface geology, investigating geotectonic environments, modeling groundwater flow in sedimentary basins, and gaining a better understanding of the behavior of groundwater flow for large aquifers. Due to fault systems that act as impediments to horizontal fluid flow, offshore hydrocarbon reservoirs may become more separated from others (Bredehoeft et al., 1992; Darby et al., 1996; Knott et al., 1996), as well as in sedimentary basin systems on land (e.g., Bense and Van Balen, 2004). Regional groundwater flow patterns can also be affected by major fault systems and uplift structures, which can either serve as passageways for groundwater flow or as impediments to its movement (Schaefer, 1983; Annecchione et al., 2001; Bense and Person, 2006). There are indications that faults behave as conduits, such as widespread mineralization zones (Mozley and Goodwin, 1995; Garven et al., 1999) and the seepage of polluted groundwater along them (e.g., Ofoegbu et al., 2001; Mal’kovskii and Pek, 2001).
Geophysical data can be used to trace the boundaries of hidden basement structures in order to identify subsurface structures that may regulate groundwater flow. Magnetic and gravity data are the most prevalent techniques for mapping and delineating non-horizontal contacts between rocks of distinct physical properties (density, magnetics susceptibility). The anomalies caused by the physical property differences can cause lineaments that reflect a disruption in the contour patterns at several places along the opposite sides of the lineaments. There have been numerous studies on the analysis of the lineaments in delineating basement and basin structures deduced from magnetic and gravity data (Berendsen et al., 1983; Johnsgard, 1983; Al Fasatwi and van Dijk, 1989; Fichler et al., 1999; Lyatsky et al., 2004; Hassan and Peirce, 2008; Aydogan, 2011; Davy et al., 2012; Feumoe and Ndougsa-Mbarga, 2012; Yutsis et al., 2012). Due to the fact that gravity anomalies can be caused by varying mass distributions at different depths, interpreting them is not a unique problem involving subsurface density structures (Blakely, 1996; Senosy et al., 2013). However, borehole data can be used as constraints to lessen the non-uniqueness problem.
The Gravity Recovery and Climate Experiment (GRACE) mission’s Gravity measurements, together with other pertinent data, have been widely used in several study regions to estimate regional changes in groundwater storage (e.g., Mohamed et al., 2017; 2019; 2020a; 2020b; 2020c; Taha et al., 2021; Mohamed and Gonçalvès, 2021; Mohamed et al., 2021; Mohamed et al., 2022a; Mohamed et al., 2022b; Mohamed et al., 2023a; Mohamed et al., 2023b; Alshehri and Mohamed, 2023). Moreover, regional gravity and magnetic data are employed to study heat flow in various regions (Mohamed and Al Deep, 2021; Mohamed et al., 2022d). Furthermore, investigations of groundwater and subsurface geology (Al Deep et al., 2021; Mohamed and Ella, 2021), as well as groundwater withdrawal-related land subsidence (Othman, 2019), have all been studied using geophysical data.
Mohamed et al. (2017) showed that from January 2003 to December 2012, the Nubian aquifer in Sudan and Chad experienced an average yearly recharge of 0.78 ± 0.49 and 1.44 ± 0.42 km3/year, respectively. Comparatively, the Nubian aquifer in Egypt and Libya experiences groundwater depletion rates of 4.44 ± 0.42 and 0.48 ± 0.32 km3/year, respectively. Ahmed and Abdelmohsen (2018) have improved estimates of the Nubian aquifer’s recharge and depletion rates and studied its relationship with artificial lakes using temporal (04/2002 to 06/2016) GRACE data and outputs from land surface models. Their findings indicate that the aquifer received a total recharge of 20.27 ± 1.95 km3 througout the periods of 04/2002 to 02/2006 and from 04/2008 to 6/2016. In contrast, the aquifert’s groundwater storage decreased by 13.45 ± 0.82 km3/year througout the period of 3/2006 to 3/2008. They reported that the recharge events may only occur when there is an abnormally high amount of precipitation over the Nubian recharge domains and/or when Lake Nasser levels significantly rise. Mohammed et al. (2022c) have studied the groundwater flow behavior and the replenishment in the Nubian aquifer during wet and dry periods.
Although similar studies might be conducted in many small African regions, no prior research employing the geophysical methodology we propose has been done for the whole study area. The current study uses gravity data from the Earth Gravitational Model (Pavlis et al., 2012), along with constraints from geologic mapping and borehole data, to find out how subsurface structures affect the NSAS’s groundwater resources. The configuration of the delineated structural trends may be related to groundwater management in the aquifer. These structural patterns have an impact on groundwater flow, both facilitating and/or impeding it. The gravity datasets’ results and outputs were validated using field, seismic, geochemical, and isotopic data.
The NSAS is a massive freshwater aquifer beneath the Eastern Libyan Desert, Northern Sudan, and Northeastern Chad (Heinl and Thorweihe, 1993). This is primarily a fossil groundwater reservoir with a low recharge rate. The NSAS includes the Dakhla, the Northern Sudan Platform, and the Kufra subbasins (Figure 1).
The Precambrian basement complex underlies the sedimentary cover and outcrops along the marginal areas of the NSAS (Himida, 1970; Bellini and Massa, 1980). The Precambrian lithologies crop out to the south, east, southwest, and west of the study area. Minor exposures are also found at the Uweinat area, Bir Terfawi, and northwestern Sudan (Figure 1). These rocks are composed mainly of granites and granodiorites, with smaller amounts of metasediments, metavolacanics, metagabros, and serpentines. High-grade metamorphic rocks, with occasional granite intrusions, make up the basement complexes of the Nubian-Arabian Shield (El Ramly and Hussein, 1985; El Gaby et al., 1990). Alkaline, ring-structured granites and metamorphic rocks make up the bulk of the Gebel Uweinat massif, with some younger volcanic units contributing to the overall composition (Klitzsch and Wycisk, 1987; Meneisy, 1990). Sequences of volcanic rocks are typical of the Tibesti highlands. Meta-gneisses, granites, and some younger volcanic activities make up the Kordofan and Darfur massifs. To the north, the groundwater flow in the aquifer is restricted by the saline-freshwater interface at about 29° north latitude (Figure 1).
The NSAS is located mainly within Paleozoic-Mesozoic sandstones with minor units of shallow marine to deltaic Tertiary shale and clays (Hesse et al., 1987). It is unrestricted south of 25° latitude. North of about 25° latitude in Egypt, it is buried by the Eocene limestone that lies above the thick Campanian marine shales and clays of the Mut Formation and the Campanian-Lower Paleocene Dakhla Formation. This latitude is roughly in the middle of the transition zone between the NSAS and the Sirte Basin in Libya (Hesse et al., 1987).
In the absence of a full coverage of the airborned and ground gravity data over the NSAS, we adopted using of the EGM 2008. The EGM2008 was generated using satellite, land, and marine gravity data, and long wavelength gravity variations derived from the satellite GRACE data. Accepted in our regional study of the NSAS, the resulting gravity model is computed to have a spherical harmonic degree of 2160 with a spatial resolution of 9.3 km, which is 6 times higher than that of EGM96. Figure 2 shows the Bouguer gravity anomaly map, which was extracted from the EGM2008 data.
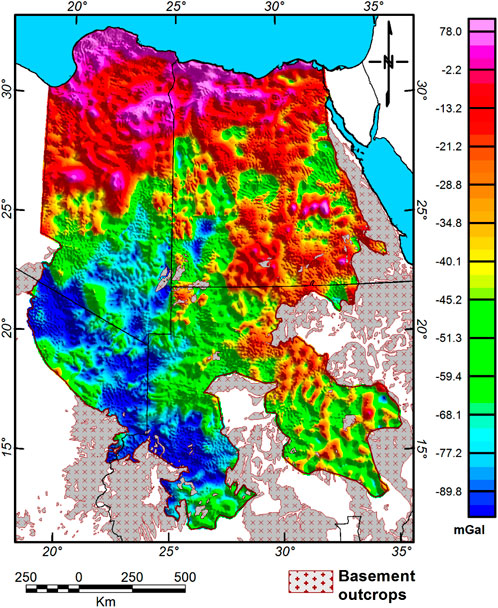
FIGURE 2. Bouguer gravity anomaly map generated from the EGM2008 data (Pavlis et al., 2012) over the study area.
The processing techniques of this study included five steps. We first extracted the Bouguer gravity anomaly map from the EGM2008 and then extracted the high-pass filtered gravity anomaly map (Step I). The regional structural trends were delineated using the upward continuation technique (Step II), and the shallow trends were delineated using the separation technique (Step III). Calculating the loading and gravitational effects of the sediments (Step IV). Hydrogeological prospection was developed to discuss the major structural trends and uplifts affecting the groundwater flow across the NSAS sub-basins (Step V). Finally, the prospection was verified and tested against isotopic, chronologic, geochemical, and earthquake data (Step VI).
Given that we are interested in analyzing the NSAS’s sedimentary cover, basement relief, and associated structures, we filtered the EGM2008 gravity data using a high-pass filter with a 1,000-km cut off wavelength to eliminate the longer wavelength components associated with large and deep sources derived from the deep mantle (Obenson, 1974; Block et al., 2009). The high-pass filtered gravity anomaly map (Figure 3) which was used as a source data, shows a negative anomaly trend extending in a NE–SW direction from the southern Kufra subbasin (NE Chad) through the northern Kufra subbasin (SE Libya) to the Dakhla subbasin at the area between north Gilf Kebir and Siwa. There is a strong positive gravity anomaly in the southeastern part of the study area, up to southern Egypt, and in some northeasterly-extended areas in northeastern Libya and northwest Egypt (Figure 3). According to Riad et al. (1983), higher gravity anomalies can only be juxtaposed with low gravity anomaly features and vice versa along zones of high gravity gradients if shear movements are acting on previously faulted formations.
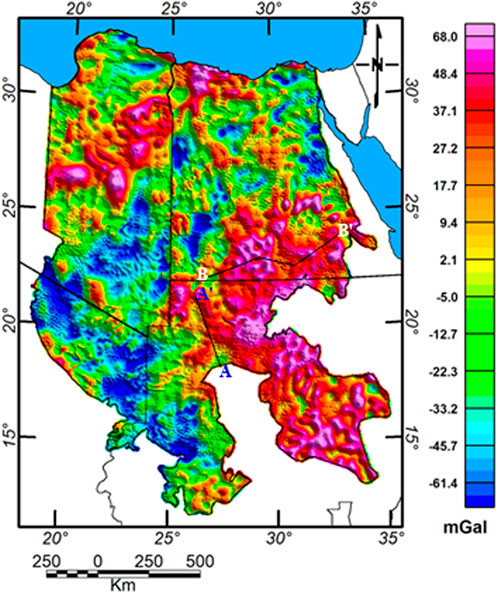
FIGURE 3. High-pass filtered gravity anomaly map (λ < 1,000 km) of the Bouguer gravity anomaly map (Figure 2). Also shown are the locations of AA’ gravity profile and BB’ cross section (Figure 18).
The Earth’s surface, a flight path, or a satellite’s orbit can all be used to calculate or observe gravity. However, gravity information is frequently unavailable at the location where measurements are made. This necessitates a subsequent upward movement to a new height level. Continuation filters can transform measured data into new forms by isolating, amplifying, and projecting the gravity anomaly onto a level above the original observation surface (Pawlowski, 1995; Blakely, 1996).
The large wavelength anomalies were most visible on the upward continued gravity map (Z = 5 km; Figure 4). The continuation distance influences how the anomalies appear and how far they travel. When comparing Figure 4 to the source data in Figure 3, you can see that as the height of the continuation increased to 5 km, the anomalies from nearby sources began to overlap more and more. As a result, shallow sources and noises have less effect. Figure 4 depicts positive gravity anomalies in the southeastern part of the study area (NE Sudan and S Egypt) as well as along a zone near the northwestern part of the study area in Libya and Egypt. On the other hand, negative NE-SE directed gravity anomalies were discovered in NE Chad, SE Libya, and their extension in Egypt. The anomalies visible on the high-pass filtered gravity map (Figure 3) are manifestations of deeper gravity anomalies, as demonstrated by the regional gravity anomaly map (Figure 4).

FIGURE 4. Regional gravity anomaly map (Upward contiuation: 5 km) of the high-pass filtered bouguer gravity map shown in Figure 3.
As well as being a helpful tool for outlining regional structures, the upward continuation technique is frequently employed to isolate the regional field component from the observed field. The residual component is created by subtracting the upward continuation anomaly from the total field anomaly. The upward continuation height was chosen as 5 km to be used in the separation.
The residual anomaly map (Figure 5) shows different anomalies of different amplitudes, which were used to delineate the local trends that are related to the shallow zones. The structural trends interpreted from the residual gravity map show that the NE–SW and E–W directions are the main trends affecting the shallow zones. These results are indicative of aligned faults in a general NE–SW direction, which continue upward from the deep-seated zone into the shallow depths, especially in the northern part of the study region.
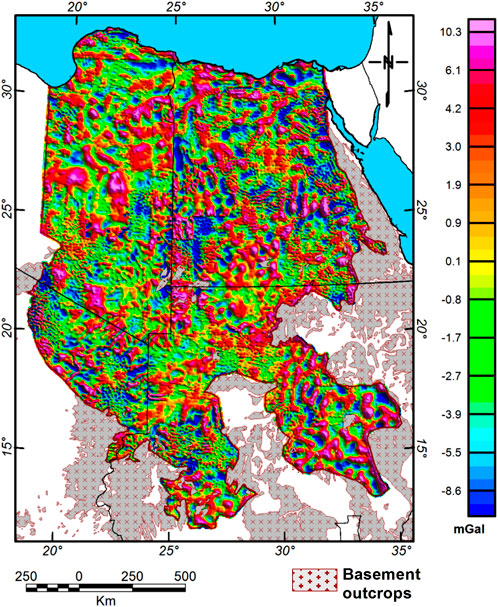
FIGURE 5. Residual gravity anomaly map after removing of the regional component.
The tectonic trends can be inferred from the reported alignments of magnetic anomalies in northern Egypt along clear and preferred axes (Meshref, 1990). The Pelusium megashear system (PMS) is responsible for a number of these tendencies, particularly in the northeastern direction.
The sedimentary cover of the NSAS was reported in Mohamed et al. (2017), where they mapped the thickness variations of the sediments using the gravity data, and the connectivity of its subbasins was studied. Based on the slope of the graph (Figure 6) in the high and low frequency parts of the power spectrum curve, the depth (h) to shallow gravity sources with a wavenumber ranging from 0.03 to 0.27/km is about 0.8 km, and for the deep sources with a wavenumber varying between 0.0 and 0.03/km is about 6 km. The noise sources with the highest wavenumbers at the very shallow depths were not conceded. Mohamed (2016) and Mohamed et al. (2017) have used 2D models to figure out how thick the sedimentary cover is and used more than 2000 borehole data as control points (Figure 7). Towards the southern edge of the Dakhla subbasin, close to the Uweinat-Aswan uplift, the basement level has shallowed, as seen in Figure 8. Under the sedimentary cover, the basement rocks are exposed or extend to the surface at relatively shallow depths, forming a partial dividing line between the Dakhla subbasin and the shallow northern Sudan platform. Thickening of the sediments is observed in a northeasterly direction from the Kufra subbasin in Chad and Libya into the Dakhla subbasin in Egypt. Along this zone the thickness of sediments ranges from 3 to more than 4 km, which was primarily occupied by Paleozoic-Lower Upper Cretaceous Sandstone in the Kufra subbasin and by Paleozoic Lower Upper Cretaceous Sandstone, which is capped by Upper Cretaceous and Tertiary sediments in the northern and western parts of the Dakhla subbasin (Thorweihe and Heinl, 2002).
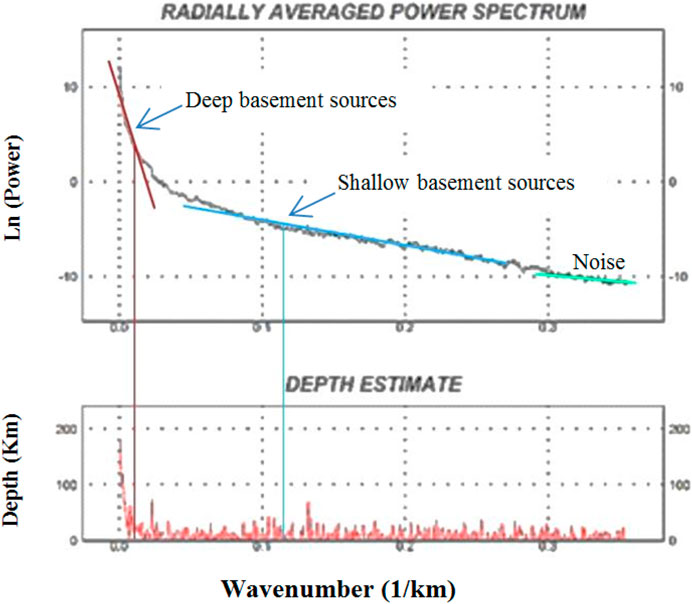
FIGURE 6. Power spectrum for gravity data.
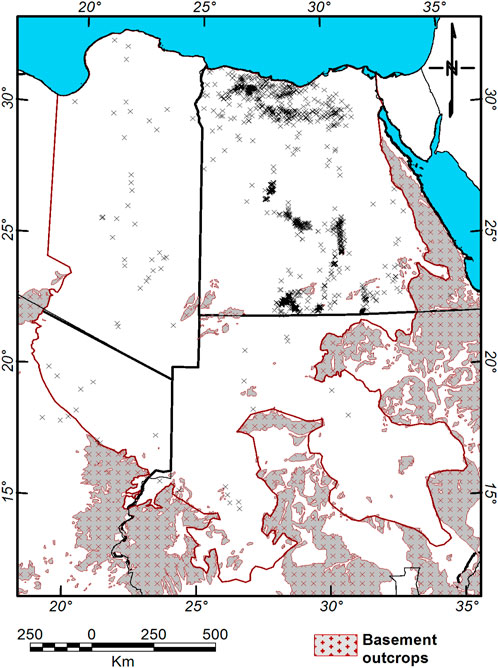
FIGURE 7. Wells used by Mohamed (2016), and Mohamed et al. (2017) to constrain the gravity profiles and the cross sections.
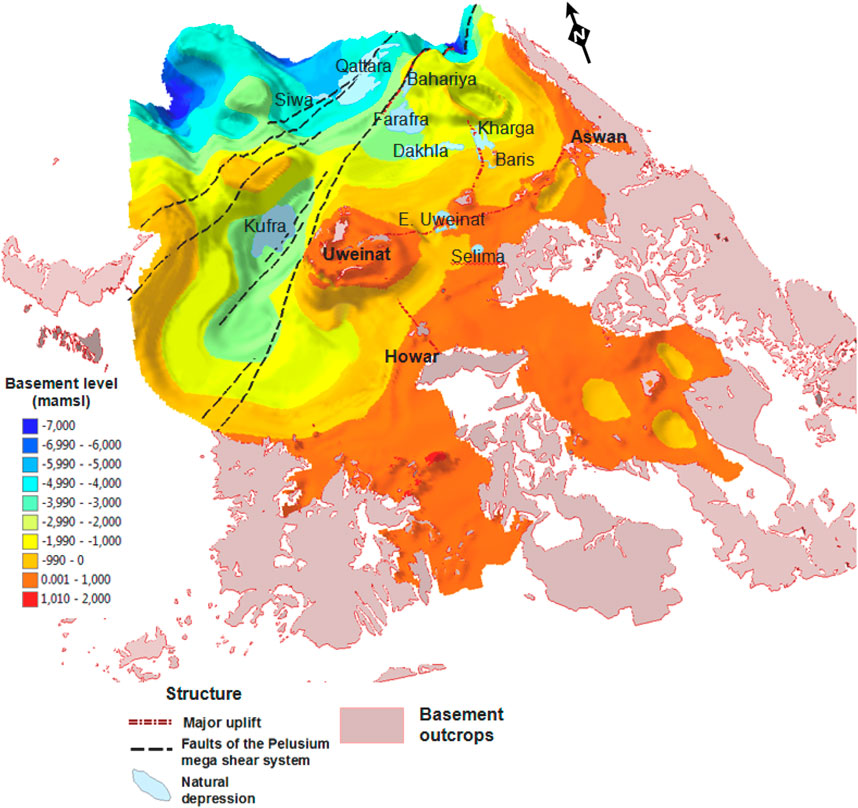
FIGURE 8. Basement relief 3D map extracted over the NSAS showing thickening of the sedimentary sequences to the north and along the northeast trending PMS (After Mohamed, 2016; Mohamed et al., 2017).
The volume of sediments was calculated in the aquifer between the southern basement boundary in Sudan and Chad and the northern boundary at the saline-fresh water interface in Egypt and Libya. Based on the total area (∼2.01 × 10⁶ km2) of the aquifer, the average sediments volume was estimated to be 247.5 × 10⁴ km3. The aquifer has an area of 691 × 103 km2 in Egypt, with average volume of 1.03 × 10⁶ km3. In Libya, it has an area of 397.44 × 10³ km2, with average volume of 807.5 × 10³ km3. In Chad, it has an area of 227 × 103 km2, with average sediment volume of 369.421 × 03 km3. The aquifer has an area of 746.7 × 10³ km2 in Sudan, with average sediment volume of 270.61 × 10³ km3.
In the study region, sandstones, shales, and limestones are the most common forms of rock. Large sand dunes and sheets cover much of the southern region, making it difficult to recognize the underlying geological structures. Calculating the 3D gravitational and loading effect of the sediments was carried out using the exponential density-depth curve of Cowie and Karner (1990). We used this method to compute the gravitational effect of a sedimentary basin in which compaction causes sediment density to change continuously with depth. Although there are large uncertainties in the relationship between density and depth for depths greater than 5 km, the exponential function fits the log data in a number of sediment basins well. The density-depth function of Cowie and Karner (1990) has been successfully applied for calculating the exponential increase in sediment density downward to the surface of the basement, as given by Weissel et al. (1990).
The gravitational and loading effect of the sediments was also calculated by taking the average density of the common rock types in El Kharga region (density: ∼2.60 g/cm3; Senosy et al., 2013). The gravitational effect in gal of the sedimentary sequence was determined using Eq. 1, which is described by Nedelkon and Burney, (1962) and Skeels, (1965).
Where Δg is the gravity value in gal, G is the international gravitational constant, which is equal to 6.672 × 10⁻⁸ cm3·g−1·s−2, ρ is the density contrast between the rock unit density and the base density of the crustal rocks (2.67 gm/cm3). h is the thickness in cm.
The average of the gravitational effects of the sediments using the two techniques was calculated and removed to obtain the gravity map (Figure 9) on the surface of the basement.
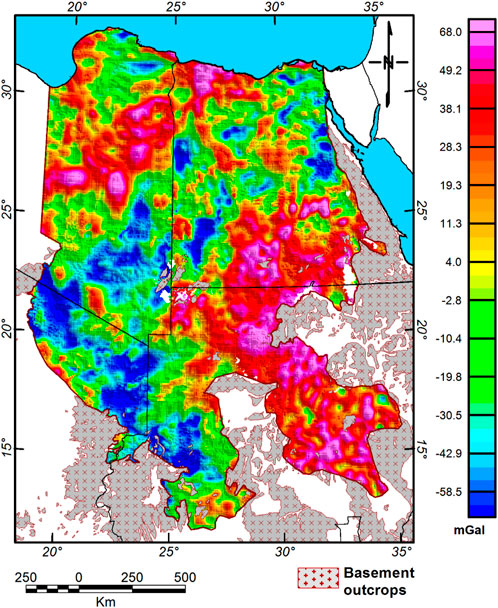
FIGURE 9. Gravity map on the surface of the basement after removing the gravity effect of sedimentary cover.
In the current study, the structural trends (Figures 10–13) delineated from the high-pass filtered gravity, regional, residual maps and gravity map on the basement surface can be recognized in various directions. The primary structural trends influencing the research area were displayed using a rose diagram (Figure 14). These tectonic patterns are thought to be a result of the cumulative effects of tectonic stress over a period of time spanning multiple epochs in Earth’s history. Various structural trends, including those running in the NE-SW, N-S, E-W, NW-SE directions, are all apparent in the data. These trends may be attributed to the Pelusium–Qattara trends, Nubian trend, Tethyan trend, and Gulf of Suez trend, respectively. It cuts the basement and extends upward in the sedimentary cover. These trends are more characteristic of some parts in the study area, and some trends show more strength in some parts than others (Meshref, 1990). Some trend lines show variations of 10°–20° direction. The NE-SW direction, associated with the Pelusium and Qattara trends, is the dominant structural trend in the region, in addition to the shallowing E–W basement features of the Uweinat–Aswan uplift in southern Egypt.

FIGURE 10. Gravity structural trends delineated from the high-pass filtered gravity map.
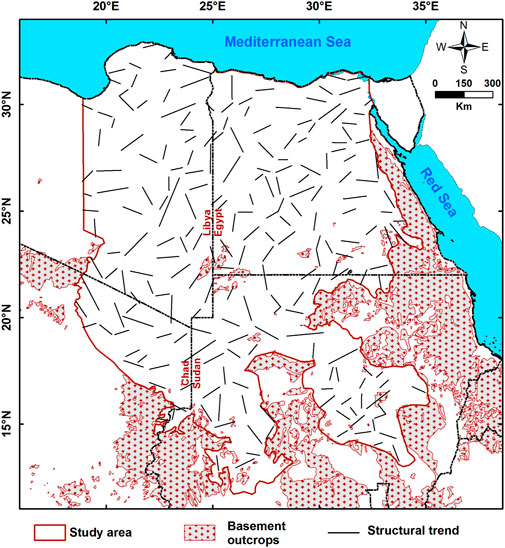
FIGURE 11. Gravity structural trends delineated from the regional gravity map.
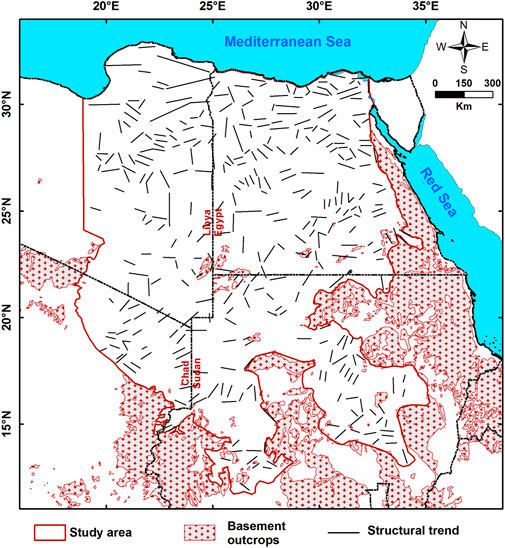
FIGURE 12. Gravity structural trends delineated from the residual gravity map.
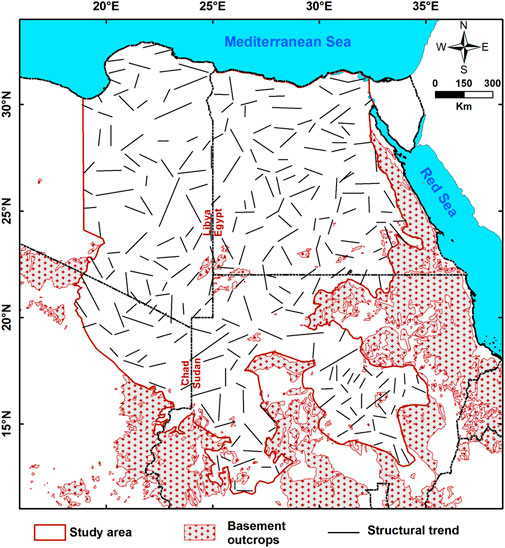
FIGURE 13. Gravity structural trends delineated from the gravity map on the surface of the basement rocks.
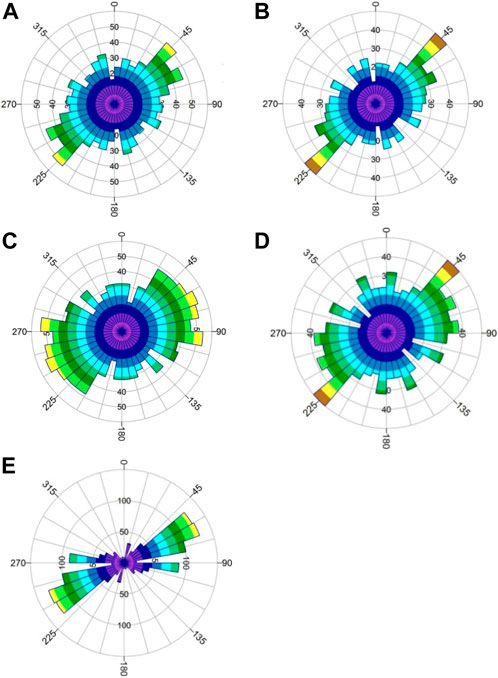
FIGURE 14. Rose diagram for the structural trends interpreted from the: (A) high-pass filtered gravity map, (B) regional gravity map, (C) residual gravity map, (D) gravity map on the basement surface, and (E) basement and Jurassic rocks in north Western Desert, showing the NE–SW trend is the main structural trend affecting the area and minor trends in the E–W, N–S, and NW–SE directions.
The dominant trend affecting the basement rocks and overlying sediments in the study region is NE-SW. This pattern is associated with the PMS (Neev, 1975; Neev, 1977), which spreads from Turkey to the south Atlantic. It runs parallel to the Mediterranean Sea’s eastern margin, then curves NE-SW across central Africa from the Nile delta to the delta of Niger in the Gulf of Guinea (Figure 15). It is assumed that it has been acting as an en echelon left-lateral megashear system since Precambrian times (Neev et al., 1982).
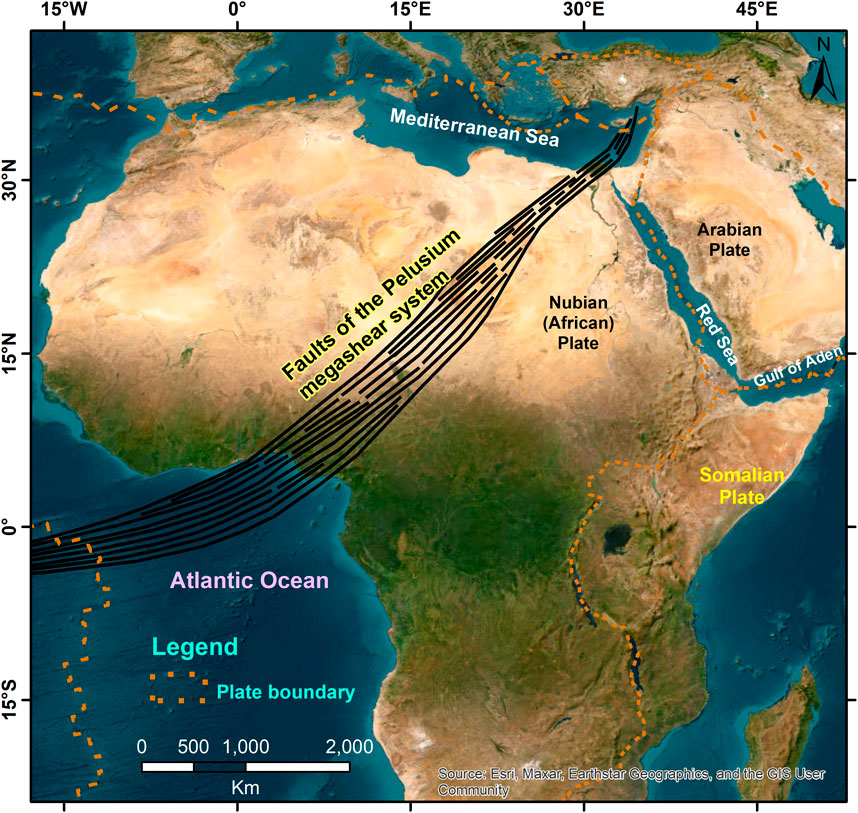
FIGURE 15. Distribution pattern of the faults of the PMS across Africa (Modified after Neev et al., 1982).
It is most likely that the Kufra subbasin in Chad and Libya and its extension in Egypt were formed by deposition in the lowlands of the Pelusium megashear structures (Figure 16). A broad and elongated southwest-trending deposition trough stretches between the Pelusium structures and the Qattara depression (Said, 1962; Chubert, 1968). It is suggested that an additional en echelon transcurrent fault exists to the west of the Pelusium line. It extends from the Qattara depression in the southwest through El Alamein and along the western flanks of the Nile cone and the Eratosthenes Seamount to join the Pelusium line at the divide of the eastern and western Anatolian zones (Neev, 1975). The Qattara-Eratosthenes, Pelusium, and Dead Sea megashears in the Levant are all part of this system. The border zone between eastern and western Anatolia is where all of these ancient faults converge (Neev, 1975; Ambraseys, 1978; Neev and Friedman, 1978).
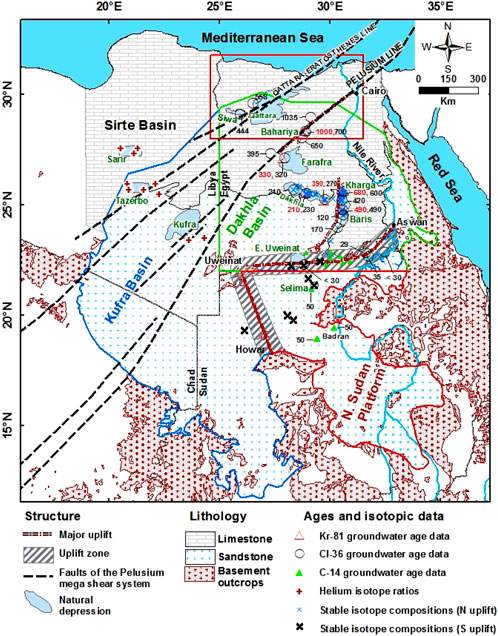
FIGURE 16. Locations of dated (Kr-81: Sturchio et al., 2004; Cl-36: Patterson et al., 2005; C-14: Froehlich et al., 2007; C-14: Haynes and Haas, 1980; Cl-36: Current Study; C-14: Froehlich et al., 2007), Noble gases (3He/4He: Al Faitouri, 2013) witthin or proximal to the shear system and isotopically (O, H) analyzed groundwater samples north and south of the Uweinat–Aswan uplift. Red box shows studies in Figure 17A.
Africa is identified as a land of broad basins ringed by irregular uplifts (Holmes, 1965). Egypt is isolated from the Sudan to the south by one of these uplifts (Figure 16). This uplift forms the southern edge of the Dakhla subbasin and is the transition zone to the northern Sudan platform. The Precambrian and younger crystalline rocks cover an area of some 40,000 km2 in southwest Egypt (Said, 1990). Near the Gebel Uweinat-Gebel Kamil region, where the borders of Sudan, Egypt, and Libya converge, the majority of these rocks are exposed. The Bir Safsaf, Gebel El Asr, and Gebel Umm Shaghir complexes, as well as other smaller basement inliers, are exposed between Bir Safsaf and Lake Nasser. Between Gebel Uweinat and Lake Nasser, the basement is close to the surface everywhere except between Gebel Kamil and Bir Safsaf, where there is a down-faulted graben (Bir Misaha trough is occupied with up to 700 m of Cretaceous sediments; Schneider and Sonntag, 1985). The Uweinat-Bir Safaf-Aswan uplift is the basement high that isolates the deep intracratonic Dakhla subbasin from the shallow subbasins of northern Sudan (Schandelmeier et al., 1983), that obstructs the northward groundwater flow from the Northern Sudan Platform into the Dakhla subbasin. At the end of the Paleozoic, the area between Gebel Uweinat and Aswan was subjected to an up-lifting, accompanied by magmatic intrusions and tectonic events. After erosion of the Paleozoic cover, the vertical movement tendency was reversed during the Jurassic time, and sedimentation began probably in the Late Jurassic or Early Cretaceous time (Klitzsch, 1984).
Noble gases are excellent tracers in groundwater-related studies due to their inert nature and unique isotopic and soluble characteristics. Their usefulness is not limited to one specific field of study but rather can be applied to a wide variety of fields, including but not limited to groundwater dating, recharge, paleoclimatology, mantle and seismic studies (Scarsi and Craig, 1996; Kipfer et al., 2002; Kulongoski et al., 2003).
The helium (3He/4He) isotope ratio of aquifer water is measured to identify its origins. Helium produced on-site through the radioactive decay of U and Th series and other sources from outside the aquifer, perhaps from the crust and/or the mantle along deep-seated faults, are possible major contributors. According to a study of the helium content of groundwater in the Kufra, Tazerbo, and Sarir subbasins (Figure 16; Al Faitouri, 2013), crustal helium makes up 95% of the total helium at Kufra, while helium from the mantle makes up 3.3% and helium produced in situ makes up 1.7%. 85% of the Sarir subbasin is crustal, 14.6% is mantle, and 0.4% is in situ. Tazerbo has crustal value of 90%, mantle value of 9.7%, and in situ value of 0.3%. Given that the PMS extends upward into the sedimentary cover, helium from the crust and mantle should move into the aquifer along deep structures that cut the crust under these subbasins.
The NE–SW trending PMS zone cuts the basement and intersects the Libyan–Egyptian border at the western part of the Dakhla subbasin in the area bwtween north Gilf Kebir and Siwa, with a sediment thickness of more than 3,500 m. This trend formed lowland zones, which were mostly filled later by high permeable sandstones especially at the lower zones. The Kufra subbasin with thick sediments of about 4,000 m is situated inside that trend (Figure 8).
Chlorine-36 ages for groundwater samples from the Nubian aquifer at depths varying between 1,000 and 1,500 m show a progressive increase northeastward from Siwa (Age: 444 kyr) to Qattara (Gara; Age: 558 kyr), and from Dalla area in west Farafra (Age: 395 kyr) to north Bahariya (Age: 1,035 kyr; Figure 16). These samples were found within the hydraulically conductive sandstones of the megashear system, which have enhanced porosity and permeability within and proximal to the shear compared to its surroundings. These results suggest that the PMS is providing a favorable groundwater flow conduit from the Kufra to the Dakhla subbasin.
North of the Uweinat-Bir Safsaf-Aswan uplift, groundwater samples have a depleted isotopic composition (average ±1 Standard deviation of 37 samples: δ18O: −10.7‰ ± 0.9‰; δD: −80.8‰ ± 3.9‰) than those to the south of the uplift (average of 7 samples: δ18O: −8.6‰ ± 1.4‰; δD: −40.8‰ ± 5.6‰, Sultan et al., 2013; Ahmed et al., 2014; Figure 16). It is possible that the uplift is obstructing the flow of groundwater from the south to the north, and that is why the north side of the uplift isn’t showing signs of replenishment. Groundwater age differences on either side of the uplift give support to this concept. South of the uplift in East Uweinat, groundwater samples show young Cl-36 ages (<30 kyr) and young C-14 ages (∼1.8–11 kyr; Haynes and Haas, 1980). Young C-14 ages (∼50 kyr) were reported from northern Sudan (Froehlich et al., 2007; Figure 16). To the north of the uplift, the groundwater ages show a progressive northward increase from the Dakhla (∼210 kyr) Farafra (∼330), and eastward to Kharga (∼490–680 kyr; Sturchio et al., 2004; Patterson et al., 2005).
Over 100 well logs, 700 well tops, and several hundred kilometers of 2D and 3D seismic profiles were used by the El Paso exploration and production company (Wescott et al., 2011) to better define the structures of the basement and Jurassic sediments in the northern region of the Western Desert. They indicated that the northeast-southwest trend is inherited from the basement map derived from potential fields. The integration of well control and seismic data has produced a much more accurate representation of the structural architecture, including east-west trending deep areas (Figures 16, Figure 17A).
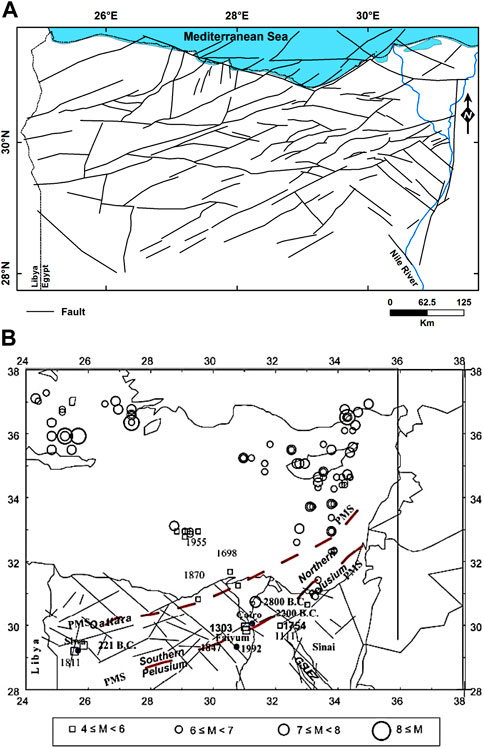
FIGURE 17. (A)Structural architecture of the basement and Jurassic rocks in north Western. Desert by the El Paso exploration and production company (Wescott et al., 2011). (B) Historical and important earthquakes triggered by the PMS in the time period 2800 BC-1995 AD. (PMS = PMS as detected from this study, Thin lines = shear faults detected from gravity). (Compiled by Gamal, 2013 from, Maamoun, 1979; Maamoun et al., 1984; Ben-Menahem, 1979; Riad et al., 1983 and (Woodward-Clyde, 1985).
The distribution of earthquake epicenters (Kebeasy, 1990) indicates that the activity occurs along three major seismically active trends. The Northern Red Sea–Gulf of Suez–Cairo–Alexandria Clysmic trend, the Levant–Aqaba trend, and the East Mediterranean–Cairo–Faiyum Pelusiac trend are these three trends. The Pelusiac trend extends from the eastern Mediterranean to Cairo and the Fayum region to the east of the Nile Delta. Along this trend, small to moderate earthquakes have occurred historically and recently (Kebeasy, 1990), and the earthquake foci are contained within the crust. The moderate and first instrumentally recorded event in the Gilf Kebir region in 1978 may indicate the spread of this trend into the southwestern regions of the Western Desert. Using the available tectonic data, new magnetic tilt derivative map, recent fault plane solution map, and the available compiled earthquake catalogue (Figure 17B) for historical and recent occurrences in and around the Pelusium. Gamal (2013) has provided evidence for the extension of the PMS near Egypt’s capital (Cairo), indicating the activity of this structure in northern Egypt. The Cairo-Bahariya uplift isolates the Dakhla subbasin in the south from the northwest Egyptian subbasin and may continue along the northwest corner of the Farafra Oasis (Figure 16). The PMS zone, which runs NE-SW, is where this uplift probably originated.
The groundwater resources in the southern part of the Egyptian Western Desert depend exclusively on the subsurface inflow across the Egyptian-Sudanese border. The occurrence of the Uweinat–Aswan uplift made the sediments lessen in this zone (Figure 18 BB'), with cross sectional areas of ∼130 and ∼85 km2 below the ground surface and the water table, respectively. These few thick sediments strongly impede the northward groundwater flow from northern Sudan into Egypt. The sediments are composed of shaley sandstones in the area between Bir Safsaf and Aswan, with shale increasing towards the north; and composed of sandstones up to 700 m thick in the area between Bir Safsaf and Uweinat, where the Bir Misaha trough occurs. This trough may act as a small passage from north Sudan into Egypt. However, the heavy extraction rate of groundwater (47.56 m3/s; 1.5 km3/year; Mohamed, 2016; Mohamed et al., 2022c) in East Uweinat area may not be compensated for by groundwater flow from north Sudan. This is demonstrated by the east-west trending Uweinat-Awan basement uplift, which is obstructing groundwater flow from north Sudan. Moreover, sediment thickness in the Bir Misaha trough decreases southward due to the shallowing of the basement level in west Selima area (−63 m-amsl in west Selima well).
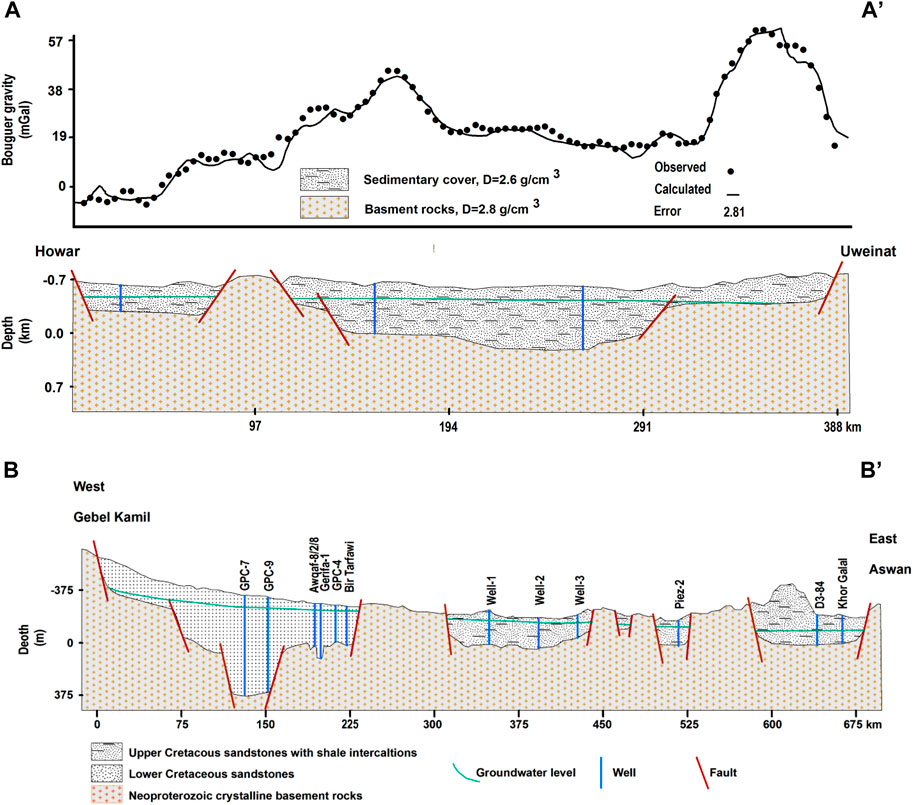
FIGURE 18. Two-dimensional gravity inversion model along profile AA' (plotted on Figure 3). Also shown are the locations of the wells along or proximal to this profile. And a schematic geological west–east cross-section along the Uweinat–Aswan uplift [Profile BB'; Figure 3] was generated from well data (Figure 7) and the basement relief map (Figure 8).
According to data from the Tropical Rainfall Measuring Mission, the sandstone outcrops of the aquifer in northern Sudan receive an average annual precipitation of 91 mm [32.8 km3; Mohamed, 2016; Mohamed et al. (2017)]. However, the northern part of the aquifer does not exhibit the effect of rechrging of groundwater flow from the Sudanese recharge areas. It is also hindered by the east-west trending Uweinat-Awan basement uplift, as evidenced by the differences in the isotopic compositions of groundwater on either side of the uplift (Sultan et al., 2013; Ahmed et al., 2014; Mohamed et al., 2017).
The sediment cross-sectional areas for the north-south-trending Uweinat-Howar uplift are approximately 170 and 110 Km2 below ground surface and water table, respectively (Figure 18 AA'). This uplift has not prevented water from flowing toward the Northern Sudan Platform [Mohamed et al. (2017)]. This is corroborated by the lack of significant GRACE anomaly variations across the uplift as a result of the low extraction rates from both the NE Chad and NW Sudan, as well as the estimated high rates of precipitation at 54.8 and 32.8 km3/yr for the Southern Kufra and Northern Sudan Platform subbasins, respectively. Consequent recharge rates were estimated at 0.78 ± 0.49 and 1.44 ± 0.42 km3/year over the recharge areas in Sudan and Chad, respectively (Mohamed, 2016; Mohamed et al., 2017).
Regional flow was first talked about in terms of the NSAS by Ball (1927) and Sandford (1935). The surface of groundwater was found to have a southwest-to-northeast gradient, and it was thought that groundwater flows from unnamed “intake beds” in the southwest to Egyptian oasis regions in the northeast along this gradient (Figure 19).
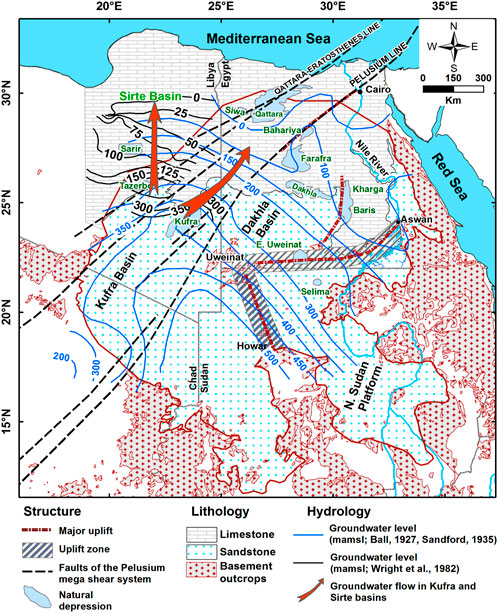
FIGURE 19. Groundwater contour lines of Ball (1927) and Sandford (1935). Also shown is the groundwater level and flow direction in the Kufra and Sirte Basins after Wright et al. (1982).
The PMS provides a preferred pathway for groundwater flow from the Kufra to the Dakhla subbasin due to its northeast-southwest orientation. This is evident based on the regional groundwater flow (Ball, 1927; Sandford, 1935) and piezometric contour trend of the Nubian aquifer in the Kufra and Sirte subbasins used by Wright et al. (1982). Figure 19 suggests a north-northeast flow in the Kufra and Sirte subbasins, while the NSAS flow is northeasterly. This suggests a rerouting of groundwater flow from the Kufra subbasin to the Nubian artesian aquifer system in Egypt along that trend.
The Red Sea and the Gulf of Suez are where most of Egypt’s geothermal resources are found, where the surface temperature ranges from 40°C to 76°C. According to Boulos (1989), other locations were discovered in the Egyptian Western Desert near the Qattara depression and the oasis (Bahariya and Dakhla). The majority of greenhouses in Bahariya Oasis are entirely dependent on thermal waters; the Kifar-1 well is a prime example of this. This is one of the most productive flowing water wells in this region. It is located in the Qattara depression. Under a high pressure of 5 kg/cm2, the well releases a vast quantity of warm, pure, and fresh water (T = 57°C and TDS = 464 ppm). The well discharges water from the 8 m (1,166–1,174 m) thick interval at a rate of 406 m3/h. The difference between the temperature of the water discharged from the Kifar well and the nighttime air temperature reaches 47°C in the winter, and 37°C in the summer. The water from the well is used for heating, greenhouses, and drinking (Boulos, 1989). The geothermal activity in the northwestern Desert is most likely due to the combined effect of the thick sedimentary cover and geothermal fluids along the NE–SW trending Qattara and Pelusium shear zones, which cut the crust in the most active region of northern Egypt. Mohamed and Al Deep (2021) have studied the crustal thickness, and heat flow in Africa using global gravity and magnetic data. They have shown that the crust and upper mantle could be more thoroughly penetrated by the PMS (Mohamed et al., 2017; Mohamed, 2019; Mohamed and Al Deep, 2021). In the Egyptian Western Desert, areas with higher geothermal anomalies and heat flow values between 40 and 56 mW/m2 are important proof that the PMS exists in Libya and Egypt. Higher geothermal anomalies in Egypt and Libya, especially the 1,000-m-deep thermal wells with groundwater that is hotter than 60°C, may be able to provide alternative energy sources (Mohamed and Al Deep, 2021).
According to our findings, the area of the NSAS was influenced by a number of structural trends in different directions; the most prominent directions are NE–SW, N–S, E–W, and NW–SE. The NE–SW trend is associated with the Pelusium and Qattara mega shear; the Pelusium megashear cuts the Precambrian rocks and runs from Turkey to the Gulf of Ghana. The N–S, E–W, and NW–SE structural trends correspond to the Nubian, Tethyan, and Gulf of Suez trends, respectively.
The sedimentary cover has increased from less than ∼0.5 km in northern Sudan and southern Egypt to more than 6 km along the Mediterranean coast. The sediment thickness along the Uweinat-Aswan basement uplift demonstrates a shallowing of the basement rocks. The PMS has created deep structural lowlands that were later filled with sediments to form a thick sedimentary zone extending from the Kufra subbasin in Libya and Chad to the Dakhla subbasin in Egypt.
Most groundwater moves along the northeast-southwest-trending PMS zone from the Kufra subbasin to the Dakhla subbasin. The Uweinat-Aswan basement uplift impedes the flow and recharging of groundwater from southern recharge areas.
The raw data supporting the conclusion of this article will be made available by the authors, without undue reservation.
All authors listed have made a substantial, direct, and intellectual contribution to the work and approved it for publication.
This research was supported by Researchers Supporting Project number (RSP2023R496), King Saud University, Riyadh, Saudi Arabia.
The authors declare that the research was conducted in the absence of any commercial or financial relationships that could be construed as a potential conflict of interest.
All claims expressed in this article are solely those of the authors and do not necessarily represent those of their affiliated organizations, or those of the publisher, the editors and the reviewers. Any product that may be evaluated in this article, or claim that may be made by its manufacturer, is not guaranteed or endorsed by the publisher.
Ahmed, M., Sultan, M., Wahr, J., and Yan, E. (2014). The use of GRACE data to monitor natural and anthropogenic induced variations in water availability across Africa. Earth-Science Rev. 136, 289–300.
Al Deep, M., Araffa, S. A. S., Mansour, S. A., Taha, A. I., Mohamed, A., and Othman, A. (2021). Geophysics and remote sensing applications for groundwater exploration in fractured basement: A case study from abha area, Saudi Arabia. J. Afr. Earth Sci. 184, 104368. doi:10.1016/j.jafrearsci.2021.104368
Al Faitouri, M. (2013). Isotope and noble gas study of three aquifers in central and eastern Libya: PhD thesis. USA: Colorado State University, 117.
Al Fasatwi, Y. A., and van Dijk, P. M. (1989). Lineament and geomorphic analysis of remote sensing data as an aid to hydrocarbon exploration, Sirt Basin, Libya. Proc. Themat. Conf. Geol. Remote Sens. 7, 299–313.
Alshehri, F., and Mohamed, A. (2023). Analysis of groundwater storage fluctuations using GRACE and remote sensing data in wadi as-sirhan, northern Saudi Arabia. Water 15, 282. doi:10.3390/w15020282
Ambraseys, N. N. (1978). “Studies in historical seismicity and tectonics,” in The environmantal history of the near and middle east since the last ice age. Editor W. C. Brice (New York: Academic), 185–210.
Amery, H. A., and Wolf, A. T. (2000). Water in the Middle East: A geography of peace. Austin, Tex: University of Texas Press.
Annecchione, M. A., Chouteau, M., and Keating, P. (2001). Gravity interpretation of bedrock topography: The case of the Oak Ridges Moraine, southern Ontario, Canada. J. Appl. Geophys. 47, 63–81. doi:10.1016/S0926-9851(01)00047-7,
Aydogan, D. (2011). Extraction of lineaments from gravity anomaly maps using the gradient calculation: Application to Central Anatolia. Earth, Planets Space 63, 903–913. doi:10.5047/eps.2011.04.003,
Ben-Menahem, A. (1979). Earthquake catalogue for the Middle East (92 B.C.-1980 A.D.): Bollettino di Geofisica teorica. Applicata 21, 245–310.,
Bense, V. F., and Person, M. A. (2006). Faults as conduit-barrier systems to fluid flow in siliciclastic sedimentary aquifers. Water Resour. Res. 42. doi:10.1029/2005WR004480,
Bense, V. F., and Van Balen, R. (2004). The effect of fault relay and clay smearing on groundwater flow patterns in the Lower Rhine Embayment. Basin Res. 16, 397–411. doi:10.1111/j.1365-2117.2004.00238.x,
Berendsen, P., Wilson, F. W., Yarger, H. L., and Steeples, D. W. (1983). “New data on major basement fractures in the tectonics development of eastern Kansas,” in Proceedings of the 3rd Basement Tectonics International Conference, Germany, July 1994, 227–240.
Bernauer, T., and Böhmelt, T. (2020). International conflict and cooperation over freshwater resources. Nat. Sustain. 3, 350–356. doi:10.1038/s41893-020-0479-8
Blakely, R. J. (1996). Potential theory in gravity and magnetic. New York: Cambridge University Press, 441.
Block, A. E., Bell, R. E., and Studinger, M. (2009). Antarctic crustal thickness from satellite gravity: Implications for the transantarctic and gamburtsev subglacial mountains. Earth Planet. Sci. Lett. 288, 194–203. doi:10.1016/j.epsl.2009.09.022
Boulos, F. K. (1989). “Groundwater of Nubian aquifer system of Western Egypt- A source for geothermal energy,” in Proceeding of the 11th New Zealand Geothermal Workshop, 297–300.
Bredehoeft, J., Belitz, K., and Sharp-Hansen, S. (1992). The hydrodynamics of the big horn basin: A study of the role of faults. AAPG Bull. 76, 530–546.
Cowie, P. A., and Karner, G. D. (1990). Gravity effect of sediment compaction: Examples from the north Sea and the rhine graben. Earth Planet. Sci. Lett. 99, 141–153. doi:10.1016/0012-821X(90)90078-C
Darby, D., Haszeldine, R. S., and Couples, G. D. (1996). Pressure cells and pressure seals in the UK Central Graben. Mar. Petroleum Geol. 13, 865–878. doi:10.1016/S0264-8172(96)00023-2
Davy, B., Stagpoole, V., Barker, D., and Yu, J. (2012). Subsurface structure of the Canterbury region interpreted from gravity and aeromagnetic data. N. Z. J. Geol. Geophys. 55, 185–191. doi:10.1080/00288306.2012.690765
Feumoe, A. N. S., and Ndougsa-Mbarga, T. (2012). Delineation of tectonic lineaments using aeromagnetic data for the south-east Cameroon area. Geofizika 29, 1–18.
Fichler, C., Rundhovde, E., Olesen, O., Sæther, B. M., Rueslåtten, H., Lundin, E., et al. (1999). Regional tectonic interpretation of image enhanced gravity and magnetic data covering the mid-Norwegian shelf and adjacent mainland. Tectonophysics 306, 183–197. doi:10.1016/S0040-1951(99)00057-8
Froehlich, K., Aggarwal, P. K., and Garner, W. A. (2007). An integrated approach in evaluating isotopic data of the nubian sandstone aquifer syatem (NSAS) in Egypt (IAEA–CN–151/147): Advances in isotope hydrology and its role in sustainable water resources management (IHS—2007). Proc. a Symposium Vienna 1, 31–45.
Gamal, M. A. (2013). Truthfulness of the existence of the Pelusium megashear fault system, east of Cairo, Egypt. Int. J. Geosciences 04, 212–227. doi:10.4236/ijg.2013.41018
Garven, G., Appold, M. S., Toptygina, V. I., and Hazlett, T. J. (1999). Hydrogeologic modeling of the Genesis of carbonate-hosted lead-zinc ores. Hydrogeology J. 7, 108–126. doi:10.1007/s100400050183
Hassan, H., and Peirce, J. (2008). Fusion of airborne gravity and magnetic images for improved detection of structural control: 2008 CSPG CSEG CWLS convention, 692–696.
Haynes, C. V., and Haas, H. (1980). Radiocarbon evidence for holocene recharge of groundwater, Western Desert, Egypt. Radiocarbon 22, 705–717. doi:10.1017/s0033822200010079
Heinl, M., and Thorweihe, U. (1993). “Groundwater resources and management in SW-Egypt,” in Geopotential and ecology, analysis of a Desert region: Catena supplement. Editors B. Meissner, and P. Wycisk, 26, 199.
Hesse, K.-H., Hissene, A., Kheir, O., Schnaecker, E., Schneider, M., and Thorweihe, U. (1987). Hydrogeological investigations of the nubian aquifer system, eastern Sahara. Berl. Geowiss. Abh. (A) 75, 397–464.,
Johnsgard, S. K. (1983). The fracture pattern of north-central Kansas, hydrogen soil gas anomalies over the Midcontinent Rift System. Kans. Geol. Surv. Open-file Rep. 88-25, 112.
Kebeasy, R. M. (1990). “Seismicity,” in The geology of Egypt. Editor R. Said (Rotterdam: Balkema), 51–59.
Kipfer, R., Aeschbach-Hertig, W., Peeters, F., and Stute, M. (2002). Noble gases in lakes and ground waters. Rev. Mineralogy Geochem. 47, 615–700. doi:10.2138/rmg.2002.47.14
Klitzsch, E. H. (1984). Northwestern Sudan and bordering areas: Geological development since Cambrian time. Berl. Geowiss. Abh. (A) 50, 23–45.
Knott, S. D., Beach, A., Brockbank, P. J., Lawson Brown, J., McCallum, J. E., and Welbon, A. I. (1996). Spatial and mechanical controls on normal fault populations. J. Struct. Geol. 18, 359–372. doi:10.1016/S0191-8141(96)80056-3
Kulongoski, J. T., Hilton, D. R., and Izbicki, J. A. (2003). Helium isotope studies in the Mojave Desert, California: Implications for groundwater chronology and regional seismicity. Chem. Geol. 202, 95–113. doi:10.1016/j.chemgeo.2003.07.002
Lyatsky, H., Pana, D., Olson, R., and Godwin, L. (2004). Detection of subtle basement faults with gravity and magnetic data in the Alberta Basin. Lead. Edge 23, 1282–1288. doi:10.1190/leedff.23.1282_1
Maamoun, M. (1979). Macroseismic observations of principal earthquake in Egypt: Helwan institue of astronomy and Geophysics. Bulletin 183, 120.
Maamoun, M., Megehed, A., and Allam, A. (1984). Seismicity of Egypt. Helwan: Bulletin of the Helwan Institute of Astronomy & Geophysics 4, 109–160.
Mal’kovskii, V., and Pek, A. (2001). Evaluation of the influence of a highly permeable fault on transport of pollutants by the local groundwater flow. Geol. ore deposits 43, 216–223.
Meshref, W. M. (1990). “Tectonic framework,” in The geology of Egypt. Editor R. Said (Netherlands: Balkema), 113–154.
Mohamed, A. (2020b). Gravity applications in estimating the mass variations in the Middle East: A case study from Iran. Arab. J. Geosci. 13, 364. doi:10.1007/s12517-020-05317-7
Mohamed, A. (2020c). Gravity applications to groundwater storage variations of the Nile Delta Aquifer. J. Appl. Geophys. 182, 104177. doi:10.1016/j.jappgeo.2020.104177
Mohamed, A. (2020a). Gravity based estimates of modern recharge of the Sudanese area. J. Afr. Earth Sci. 163, 103740. doi:10.1016/j.jafrearsci.2019.103740
Mohamed, A. (2019). Hydro-geophysical study of the groundwater storage variations over the Libyan area and its connection to the Dakhla basin in Egypt. J. Afr. Earth Sci. 157, 103508. doi:10.1016/j.jafrearsci.2019.05.016
Mohamed, A., Abdelrady, A., Alarifi, S. S., and Othman, A. (2023). Geophysical and remote sensing assessment of Chad’s groundwater resources. Remote Sens. 15, 560. doi:10.3390/rs15030560
Mohamed, A., Abdelrahman, K., and Abdelrady, A. (2022a). Application of time-variable gravity to groundwater storage fluctuations in Saudi Arabia. Front. Earth Sci. 10, 873352. doi:10.3389/feart.2022.873352
Mohamed, A., Ahmed, E., Alshehri, F., and Abdelrady, A. (2022c). The groundwater flow behavior and the recharge in the nubian sandstone aquifer system during theWet and arid periods. Sustainability 14, 6823. doi:10.3390/su14116823
Mohamed, A., Al Deep, M., Abdelrahman, K., and Abdelrady, A. (2022d). Geometry of the magma chamber and curie point depth beneath Hawaii island: Inferences from magnetic and gravity data. Front. Earth Sci. 10, 847984. doi:10.3389/feart.2022.847984
Mohamed, A., and Al Deep, M. (2021). Depth to the bottom of the magnetic layer, crustal thickness, and heat flow in Africa: Inferences from gravity and magnetic data. J. Afr. Earth Sci. 179, 104204. doi:10.1016/j.jafrearsci.2021.104204
Mohamed, A., Al Deep, M., Othman, A., Taha Al Alshehri, F., and Abdelrady, A. (2022b). Integrated geophysical assessment of ground-water potential in southwestern Saudi Arabia. Front. Earth Sci. 10, 937402. doi:10.3389/feart.2022.937402
Mohamed, A. (2016). “Constraints on the amount and passages of groundwater Flow in the Nubian Sandstone Aquifer across political boundaries, Egypt,” in A PhD thesis submitted to faculty of science (Assiut, Egypt: Assiut University).
Mohamed, A., Eldeen, E. R., and Abdelmalik, K. (2021). Gravity based assessment of spatio-temporal mass variations of the groundwater resources in the Eastern Desert, Egypt. Arab. J. Geosci. 14, 500–515. doi:10.1007/s12517-021-06885-y
Mohamed, A., and Ella, E. M. A. E. (2021). Magnetic applications to subsurface and groundwater investigations: A case study from wadi El assiuti, Egypt. Ijg 12, 77–101. doi:10.4236/ijg.2021.122006
Mohamed, A., and Gonçalvès, J. (2021). Hydro-geophysical monitoring of the NorthWestern Sahara Aquifer System’s groundwater resources using gravity data. J. Afr. Earth Sci. 178, 104188. doi:10.1016/j.jafrearsci.2021.104188
Mohamed, A., Othman, A., Galal, W. F., and Abdelrady, A. (2023b). Integrated geophysical approach of groundwater potential in Wadi Ranyah, Saudi Arabia, using gravity, electrical resistivity, and remote-sensing techniques. Remote Sens. 15, 1808. doi:10.3390/rs15071808
Mohamed, A., Sultan, M., Ahmed, M., Yan, E., and Ahmed, E. (2017). Aquifer recharge, depletion, and connectivity: Inferences from GRACE, land surface models, geochemical, and geophysical data. United States: Geological Society of America Bulletin. in press.
Mozley, P. S., and Goodwin, L. B., 1995, Patterns of cementation along a cenozoic normal fault: A record of paleoflow orientations Geol., 23, p. 539, doi:10.1130/0091-7613(1995)023<0539:POCAAC>2.3.CO;2
Nedelkon, I. P., and Burney, P. H. (1962). Determination of gravitational field in depth. Geophys. Prospect. 10, 1–18. doi:10.1111/j.1365-2478.1962.tb01995.x
Neev, D., and Friedman, M, G. (1978). Late holocene tectonic activity along the margins of the sinai subplate. Science 202, 427–429. doi:10.1126/science.202.4366.427
Neev, D., Hall, J. K., and Saul, J. M. (1982). The Pelusium megashear system across Africa and associated lineament swarms. J. Geophys. Res. 87, 1015–1030. doi:10.1029/JB087iB02p01015
Neev, D. (1975). Tectonic evolution of the Middle East and the Levantine basin (easternmost Mediterranean). Geology 3, 683. doi:10.1130/0091-7613(1975)3<683:TEOTME>2.0.CO;2
Neev, D., 1977, The Pelusium Line–a major transcontinental shear: Tectonophysics, 38, p. T1, T8. doi:10.1016/0040-1951(77)90207-4
Obenson, G. (1974). A 1973 gravimetric geoid of Africa. Geophys. J. R. Astronomical Soc. 37, 271–283. doi:10.1111/j.1365-246X.1974.tb01238.x
Ofoegbu, G., Painter, S., Chen, R., Fedors, R. W., and Ferrill, D. A. (2001). Geomechanical and thermal effects on moisture flow at the proposed Yucca Mountain nuclear waste repository. Nucl. Technol. 134, 241–262. doi:10.13182/nt01-a3199
Othman, A. (2019). “Measuring and monitoring land subsidence and Earth fissures in Al- qassim region, Saudi Arabia: Inferences from InSAR,” in Advances in remote sensing and geo informatics applications. CAJG 2018. Advances in science, technology & innovation (IEREK interdisciplinary series for sustainable development). Editors H. El-Askary, S. Lee, E. Heggy, and B. Pradhan (Cham: Springer). doi:10.1007/978-3-030-01440-7_66
Patterson, L. J., Sturchio, N. C., Kennedy, B. M., van Soest, M. C., Sultan, M., Lu, Z.-T., et al. (2005). Cosmogenic, radiogenic, and stable isotopic constraints on groundwater residence time in the Nubian Aquifer, Western Desert of Egypt. Geochem. Geophys. Geosystems 6, 1–19. doi:10.1029/2004GC000779
Pavlis, N. K., Holmes, S. A., Kenyon, S. C., and Factor, J. K. (2012). The development and evaluation of the Earth gravitational model 2008 (EGM2008). J. Geophys. Res. 117. doi:10.1029/2011JB008916
Pawlowski, R. S. (1995). Preferential continuation for potential-field anomaly enhancement. GEOPHYSICS 60, 390–398. doi:10.1190/1.1443775
Riad, S., El-Etr, H. A., and Mokhles, A. (1983). Basement tectonics of northern Egypt as interpreted from gravity data, 4. International Basement Tectonics Association Publication, 209–231.
Sandford, K. S. (1935). Sources of water in the north-western Sudan: Source. Geogr. J. 85, 412–431. doi:10.2307/1785619
Scarsi, P., and Craig, H. (1996). Helium isotope ratios in Ethiopian Rift basalts. Earth Planet. Sci. Lett. 144, 505–516. doi:10.1016/S0012-821X(96)00185-9
Schaefer, D. H. (1983). Gravity survey of dixie valley, west-central Nevada: U.S. Geol. Surv. Open-File Rep. 82-111, 17.
Schandelmeier, H., Richter, A., and Franz, G. (1983). Outline of the geology of magmatic and metamorphic units between Gebel Uweinat and Bir Safsaf (SW Egypt/NW Sudan). J. Afr. Earth Sci. 1, 275–283. doi:10.1016/s0731-7247(83)80012-3
Schneider, M., and Sonntag, C., 1985, Hydrogeology of the Gebel uweinat-aswan uplift system, eastern Sahara: Papers of the Int. Congr. Hydrogeology of rocks of low permeability.
Senosy, M. M., Youssef, M. M., and Zaher, M. A. (2013). Sedimentary cover in the South Western Desert of Egypt as deduced from Bouguer gravity and drill-hole data. J. Afr. Earth Sci. 82, 1–14. doi:10.1016/j.jafrearsci.2013.02.001
Skeels, D. C. (1965). An approximation solution of the problem of maximum depth in gravity interpretation. Geophysics 28, 724–735. doi:10.1190/1.1439262
Sturchio, N. C., Du, X., Purtschert, R., Lehmann, B. E., Sultan, M., Patterson, L. J., et al. (2004). One million year old groundwater in the Sahara revealed by krypton-81 and chlorine-36. Geophys. Res. Lett. doi:10.1029/2003GL019234
Sultan, M., Ahmed, M., Sturchio, N., Eugene, Y., Milewski, A., Becker, R., et al. (2013). “Assessment of the vulnerabilities of the nubian sandstone fossil aquifer, north Africa,” in Climate vulnerability. Understanding and addressing threats to essential resources. Editor R. A. Pielke (Oxford: Elsevier Inc., Academic Press), 5, 311–333.
Taha, A. I., Al Deep, M., and Mohamed, A. (2021). Investigation of groundwater occurrence using gravity and electrical resistivity methods: A case study fromWadi sar, hijaz mountains, Saudi Arabia. Arab. J. Geosci. 14, 334. doi:10.1007/s12517-021-06628-z
Thorweihe, U., and Heinl, M. (2002). Groundwater Resources of the Nubian Aquifer System NE-Africa Synthesis: Modified synthesis submitted to Observatoire du Sahara et du Sahel. Paris: OSS, 23.
United Nations (2013). Department of economic and social affairs. Population Division; United Nations: New York, NY, USA.
United Nations World Water Assessment Programme (WWAP). The united Nations World water development report 2014. In Water and energy; UNESCO: Paris, France.
Wada, Y., Van Beek, L. P. H., Van Kempen, C. M., Reckman, J. W. T. M., Vasak, S., and Bierkens, M. F. P. (2010). Global depletion of groundwater resources. Geophys. Res. Lett. 37 (20). doi:10.1029/2010gl044571
Weissel, J. K., Cowie, P. A., and Karner, G. D., 1990, Fourier domain representation of gravity anomalies due to lithospheric deformation: in prep.
Wescott, W. A., Atta, M., Blanchard, D. C., Cole, R. M., Georgeson, S. T., Miller, D. A., et al. (2011). Jurassic Rift architecture in the northeastern Western Desert, Egypt. Milan, Italy: AAPG International Conference and Exhibition.
Wolf, A. (1998). Conflict and cooperation along international waterways. Water Policy 1 (2), 251–265. doi:10.1016/S1366-7017(98)00019-1
Wolf, A. T., and Newton, J. T. (2007). Case study transboundary dispute resolution: The tigris-euphrates basin. Oregon: Oregon State University. Transboundary Freshwater Dispute Database (TFDD) Available at: http://www.transboundarywaters.orst.edu/.
Woodward-Clyde consult- ants (1985). Seismic hazards in the vicinity of the Aswan dam and Lake Nasser: Internal report. Cairo: Geological Survey of Egypt.
Wright, E. P., Benfield, A. C., Edmunds, W. M., and Kitching, R. (1982). Hydrogeology of the Kufra and Sirte basins, eastern Libya. Q. J. Eng. Geol. Hydrogeology 15, 83–103. doi:10.1144/GSL.QJEG.1982.015.02.02
Keywords: EGM2008, field data, Nubian sandstone aquifer system, sedimentary cover, structural trends, uplift, groundwater resources, chlorine-36
Citation: Mohamed A, Alarifi SS and Abdelrady A (2023) Sedimentary cover and structural trends affecting the groundwater flow in the Nubian Sandstone Aquifer System: Inferences from geophysical, field and geochemical data. Front. Earth Sci. 11:1173569. doi: 10.3389/feart.2023.1173569
Received: 24 February 2023; Accepted: 27 March 2023;
Published: 17 April 2023.
Edited by:
Ahmed M. Eldosouky, Suez University, EgyptReviewed by:
Omid Memarian Sorkhabi, University College Dublin, IrelandCopyright © 2023 Mohamed, Alarifi and Abdelrady. This is an open-access article distributed under the terms of the Creative Commons Attribution License (CC BY). The use, distribution or reproduction in other forums is permitted, provided the original author(s) and the copyright owner(s) are credited and that the original publication in this journal is cited, in accordance with accepted academic practice. No use, distribution or reproduction is permitted which does not comply with these terms.
*Correspondence: Ahmed Mohamed, YWhtZWRtb2hhbWVkQGF1bi5lZHUuZWc=; Ahmed Abdelrady, YS5yLmEubWFobW91ZEB0dWRlbGZ0Lm5s
Disclaimer: All claims expressed in this article are solely those of the authors and do not necessarily represent those of their affiliated organizations, or those of the publisher, the editors and the reviewers. Any product that may be evaluated in this article or claim that may be made by its manufacturer is not guaranteed or endorsed by the publisher.
Research integrity at Frontiers
Learn more about the work of our research integrity team to safeguard the quality of each article we publish.