 Birhanu Abera Kibret
 Atalay Ayele
 Derek Keir
94% of researchers rate our articles as excellent or good
Learn more about the work of our research integrity team to safeguard the quality of each article we publish.
Find out more
ORIGINAL RESEARCH article
Front. Earth Sci., 15 May 2023
Sec. Solid Earth Geophysics
Volume 11 - 2023 | https://doi.org/10.3389/feart.2023.1170907
In magma-rich continental rifts extension by magma intrusion is thought to accommodate much of the extension. We aim to constrain major melt reservoirs in the crust during magma-rich rifting by applying P-to-S receiver functions (RFs) using legacy teleseismic data having magnitudes Mb > 6.0 and epicentral distances ranging from 30° to 90° and collected between the years 2000 and 2013 in 17 temporary broadband stations in Ethiopia and Eritrea. The majority of the NW Plateau crust shows fast Vs of ∼4–4.7 km/s with localized slow Vs (3.2 km/s) and high Vp/Vs (1.85–2.0) in the mid-crust (∼10–25 km depth). The seismic velocity beneath the Afar crust is fairly homogeneous except beneath the current locus of strain at the magmatic segments, which have a relatively fast Vs. (∼4.5 km/s) at a shallow (∼6–14 km) depth underlain by slower Vs. (<3.2 km/s) and high Vp/Vs (2.0) at lower crustal depths (∼20–25 km). The Moho is sharp beneath most of the plateau stations and more gradational beneath Afar with estimated values of 36–44 km in the NW plateau and 26–30 km in Afar. The results point towards the presence of partial melt in localized places in the mid-crust beneath the NW plateau, and in the lower crust beneath the west of Afar, and particularly focused in the lower crust beneath the magmatic segments in Afar. The results suggest that the lower crust is an important melt reservoir for rift-related magmatic processes. The presence of melt in the NW plateau crust is more difficult to explain but is potentially linked to the broad extension of the plateau, or lateral migration of melt from the rift.
The northern part of the East African rift system has extensive dike and sill intrusions beneath the rift, which have modified the compositional, thermal, and mechanical properties of the lithosphere (Bialas et al., 2010; Buck et al., 2006). However, observations are also increasingly showing that magmatic processes beneath the Northwestern (NW) plateau may impact the region’s distribution of extension and geological evolution (e.g., Mackenzie et al., 2005; Cornwell et al., 2006; Chambers et al., 2021). The magmatic processes can potentially be offset by tens to hundreds of kilometers from the center of the rift and similarly offset from the magma source deep below the surface (Maccaferri et al., 2014). Most previous studies were focused near the center of the rift mainly around the magmatic segments of the Main Ethiopian Rift (MER) and Afar (Corti, 2009), and as a result, magmatic and tectonic processes away from the rift valley are poorly understood.
The geology of both regions within and outboard of the MER and Afar show strong evidence of Recent magmatic activity (Corti et al., 2018). This observation is strengthened by the presence of significant geothermal activity both within the rift and around the NW plateau (Wolfenden et al., 2005; Keir et al., 2009b; Chambers et al., 2021) which is visible at the Galema range and Yerer-Tullu Wellel Volcano lineament (Kieffer et al., 2004; Keranen & Klemperer, 2008; Chambers et al., 2019). Furthermore, low Vp and Vs. have been imaged away from the rift valley in various locales in the region and interpreted as being affected by off-rift magmatism (e.g., Hammond et al., 2013). Beneath the NW plateau as far north as Lake Tana, slow seismic wave velocity anomalies have been interpreted as melt stored in stacked sills in the mid-to-lower crust (Maguire et al., 2006; Hammond et al., 2013; Chambers et al., 2019). Therefore, off-rift magmatic activity may significantly impact the locus and evolution of extension (Chiasera et al., 2018). This observation is also demonstrated in places other than the MER, Afar, and NW plateau, such as at the Baikal Rift Zone, where the Vitim volcanic field lies more than 200 km away from the rift center (Yang et al., 2018). However, more studies on the Afar rift margin and adjacent plateaus are still required.
We used the P-to-S receiver function (RF) technique applied to broadband teleseismic data from seismic stations that were temporarily deployed between 2000 and 2013. Our study area includes the Afar rift and the NW plateau regions, where broadband seismic investigations have produced an abundance of seismic data (Figure 1). We aim to better understand how and where magmatic processes and mechanical rifting have taken place by determining the thickness, internal structure, and composition of the crust inside and outside the rift valley. Given that RF techniques are particularly sensitive to bulk crustal features, we created new 2D profiles to constrain first-order estimation of Vs, Vp, and Vp/Vs versus depth beneath the study areas to determine the extent to which the crust has been modified by magmatic processes (Christensen & Mooney, 1995; Zandt & Ammon, 1995; Stuart et al., 2006). This effort will enhance knowledge of regional tectonics and the relationships between plate stretching, thinning, and magma intrusion during a continental breakup by analyzing the crustal structure along the two profiles (Figure 1).
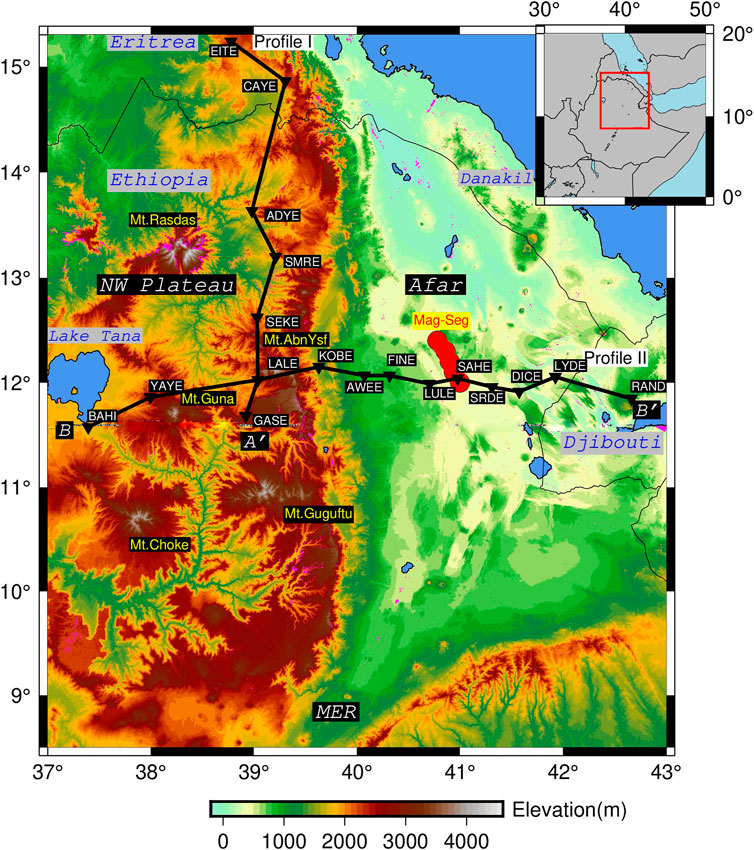
FIGURE 1. The figure displays a topographical map of Afar and the adjoining NW plateau. MER represents the Main Ethiopian Rift. Lakes appear as deep blue polygons. Mt. Rasdas, Mt. AbnYsf, Mt. Guna, Mt. Choke and Mt. Guguftu are to represent Ras-Dashen Mountain, Abune-Yosef Mountain, Guna Mountain, Choke Mountain and Guguftu Mountain respectively. The black inverted triangles show the temporary broadband seismic stations that were installed in the Afar and NW plateaus between 2007 and 2012. Profile I is oriented north-south from A to A′, while Profile II is oriented east-west from B to B'. The red polygon in Afar (Mag-Seg) represents the magmatic segment. The red rectangle in the inset map represents the study area.
The Afar region is a unique locale since it is here that the transition from continental plateaus to imminent seafloor spreading within rift takes place (Hayward & Ebinger, 1996; Bastow et al., 2010; Ahmed et al., 2022). The rifting in Afar is thought to have started soon after the impact of the Afar mantle plume at around 30 Ma (Hofmann et al., 1997; Pik et al., 1998; Pik et al., 1999; Pik et al., 2008; Beccaluva et al., 2009), with the extension thought to have been initiated on the border faults mainly by mechanical faulting (Hayward & Ebinger, 1996; Wolfenden et al., 2005). However, with continued rifting, the extension progressively migrated into the rift valley floor and also is thought to have increasingly included magma intrusion (Wolfenden et al., 2005). The rifting in Afar occurs between the Nubian, Somalian, and Arabian plates and the Danakil microplate. In the central and northern parts of Afar that are the focus of this study, the counterclockwise rotation of the Danakil microplate relative to the Nubian plate controls the extension. This motion causes ∼NE directed extension that increases from <1 cm/yr in the Danakil Depression of northern Afar to ∼2 cm/yr across central Afar (Viltres et al., 2020). The spatial localization of the strain is debated. InSAR data has revealed localized extension from episodic crustal dike intrusion in the ∼20 km-wide, ∼70 km long-magmatic segments (e.g., Wright et al., 2006; 2012; Pagli et al., 2015; Barnie et al., 2016), whereas in regions linking the magmatic segments strain by a combination of normal and oblique slip faulting (e.g., Pagli et al., 2019; La Rosa et al., 2021). However, regional strain analysis that includes regional GPS data shows that this localized strain is set within an extension distributed across the whole rift (Doubre et al., 2017), and includes distributed extension across the Northwestern Plateau (Birhanu et al., 2016).
Previous seismic studies such as RF studies (Dugda et al., 2005; Stuart et al., 2006; Hammond et al., 2011; Rooney et al., 2018; Kibret et al., 2019; Wang et al., 2021) and joint inversion of RFs and surface wave analysis (Dugda & Nyblade, 2006; Dugda et al., 2007) estimated the crustal thickness beneath most of Afar to be in the range of ∼20–26 km and shallowing to ∼16 km northward to the Danakil Depression (Hammond, 2014; Ahmed et al., 2022). Central-east Afar near the Djibouti border has a crustal thickness of ∼30 km (e.g., Hammond et al., 2011). These studies also constrain bulk crustal Vp/Vs, which are commonly very high (<1.9) beneath the rift, especially in proximity to the magmatic segments, an observation explained by both solidified mafic intrusion and the presence of partial melt in the crust (Desissa et al., 2013; Ahmed et al., 2022). The interpretation of thinned and intruded continental crust including localized melt pockets is supported by the modeling of both gravity and magnetotelluric (MT) datasets (e.g., Desissa et al., 2013; Mammo, 2013; Lewi et al., 2016). S-p RFs have been used to try to understand deeper lithosphere structures (e.g., Rychert et al., 2012; Lavayssière et al., 2018). A common observation is that the lithosphere-asthenosphere boundary (LAB) is difficult to image seismically, interpreted to be due to melting percolation into the lithosphere masking the expected seismic discontinuity (e.g., Lavayssière et al., 2018). These findings are consistent with deeper seismic tomography has revealed a low-velocity anomaly in the upper mantle beneath Afar, interpreted as the asthenospheric melt zone (Hammond et al., 2011; Chambers et al., 2021).
Several geophysical studies have also constrained the crust and lithosphere structures beneath the NW plateau. Many P-s RF studies show crustal thickness ranges of (38–44 km; Ahmed et al., 2022; Cornwell et al., 2010; Dugda et al., 2005; Hammond et al., 2011; Kibret et al., 2019; Stuart et al., 2006; Wang et al., 2021). This result is consistent with estimates of the thickness of the crust derived from seismic refraction profiles (40–45 km; Mackenzie et al., 2005; Maguire et al., 2006; Makris & Ginzburg, 1987), gravity inversion analysis (>40 km; Mammo, 2013; Tiberi et al., 2005), and joint inversion of surface waves and P-s RFs (40 km; Dugda et al., 2007). The crust of the NW plateau is significantly more mafic (Vp/Vs >1.85) than the SE plateau because of the distinct pre-rift crustal magmatic compositions (Bastow et al., 2011). According to magnetotelluric research, seismic anisotropy, and receiver function analysis, the high Vp/Vs values on the NW plateau are often associated with the presence of crustal melt in the crust from ongoing magmatism (Whaler & Hautot, 2006; Hammond et al., 2011). Similarly, S-p RFs detect the lithosphere-asthenosphere boundary (LAB) as a velocity drop 65–75 km beneath the NW plateau (LAB; Lavayssière et al., 2018; Rychert et al., 2012).
The data used for this study are from the IRIS Data Management Center (DMC) archive. This legacy data were gathered by six projects that installed temporary seismic stations between 2000 and 2013. Out of a large number of stations that were installed as part of these temporary projects, we only selected 17 stations that fit our two profiles and produced clear RFs with the direct P and converted phases. This study employs 39 teleseismic events that occurred between March 2007 and March 2012 at 10 broadband seismic stations (ADYE, DICE, GASE, KOBE, LALE, LYDE, SEKE, SMRE, SRDE, YAYE) that are acquired from Afar Consortium project operated by Universities of Bristol, Leeds, and Addis Ababa. We also used 15 teleseismic events that occurred at BAHI station during 2000–2002 from the Seismic Investigation of Deep Structure Beneath the Ethiopian Plateau and Afar Depression (Ethiopia) project operated by IRIS/PASSCAL (e.g., Nyblade, 2000), as well as 54 teleseismic events recorded by two stations (FINE, AWEE) during 2007–2009 from the AFAR07 project operated by the University of Rochester (e.g., Ebinger, 2007). Similarly, we utilized 35 teleseismic events recorded by two stations (LULE, SAHE) during 2009–2013 from the AFAR0911 project operated by the University of Southampton, and 22 teleseismic events recorded by two stations (EITE & CAYE) during 2010–2011 from Eritrea Seismic Project (ESP) operated by Birkbeck University of London. Likewise, 15 teleseismic events were recorded by RAND station during 2009–2012 from the DORA project operated by Ecole et Observatoire des Sciences de la Terre (EOST). The instruments used were Guralp CMG-3T (120 s natural period), CMG-ESP (60 s natural period), and CMG-40T (30 s natural period) (e.g., Hammond et al., 2011) and STS-2 sensor for RAND stations that continuously collected the data with a sample rate of 50 Hz. The selected earthquakes have magnitudes Mb >6.0 and epicentral distances between 30° and 90° (Figure 2). All the events were requested from the IRIS Data Management Center (DMC) (https://ds.iris.edu/ds/nodes/dmc/).
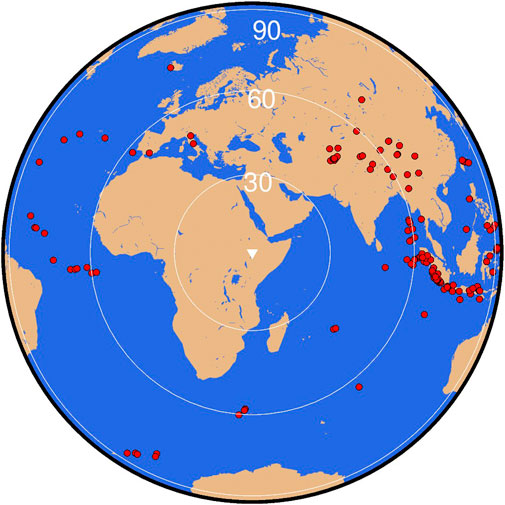
FIGURE 2. The locations of teleseismic earthquakes. Red circles are epicenter of individual earthquakes used for the analysis with Mb > 6.0 and epicentral distance between 30 and 90 degrees. The narrowest white circle denotes a distance of 30 degrees, while the medium and larger white circles denote distances of 60 and 90 degrees, respectively.
In our study, we focused on investigating the regional velocity structure of the crust and upper mantle using high-quality seismic data from temporarily deployed stations in Ethiopia, Eritrea, and Djibouti. Our analysis was based on the receiver function (RF) approach (Langston, 1979; Ammon et al., 1990) which is a well-established technique for locating P- to S-wave conversions and their reverberations from interfaces in the crust and mantle (Langston, 1979). Specifically, we applied the RF technique to identify the discontinuities of the crust and upper mantle, as well as to map their depths and characteristics.
The raw data are processed using the Herrmann software (Herrmann & Ammon, 2002). To ensure the robustness and reliability of the data, various preprocessing steps and corrections are employed in SAC formatted data. First, a trend removal technique is applied to eliminate long-term variations. This is followed by a tapering procedure, which smooths the signal and minimizes abrupt changes that may cause distortion. Mean removal is also used to eliminate the average value of the signal from the raw seismic data (Ahmed et al., 2022). Subsequently, the instrumental frequency response is corrected by implementing a pole-zero function, which preserves the amplitude and phase alteration of the recorded waveform.
We truncate the three-component seismograms using a time window from 10 s before, to 40 s after the P arrivals and apply a Butterworth bandpass filter between 0.01 and 5 Hz to decrease the impact of low-frequency noise on the RFs (e.g., Kibret et al., 2022). Selected teleseismic seismograms are rotated to produce the radial (R), tangential (T), and vertical (Z) components from the east-west, north-south, and vertical components, respectively. A Gaussian parameter of 1.0 and a water level of 0.01 are used in computing all RFs (Langston, 1979; Dugda et al., 2007). Each P-to-S RF is calculated from the frequency domain deconvolution method (Ammon, 1991). We selected good signal-to-noise ratio seismograms using the visual inspection method in which the radial component of the seismogram obtained from the deconvolution of the vertical from the horizontal is clear and where the direct P and the converted phases are found. The Ps conversion, which is normally from the Moho is typically the dominating signal in the first few seconds of the RF, followed by converted P-wave multiples inside the crust (e.g., Zandt & Ammon, 1995; Hammond et al., 2011). Following the deconvolution, we stacked events as a vital part of the RF process to increase the signal-to-noise ratio and decrease the need for damping (e.g., Gurrola et al., 1995). The number of individual RFs for each stacked trace ranges from 8 to 40.
We aimed to determine the 1D velocity model for each station from their calculated stacked RF. To enhance the resolution of the images and improve the signal-to-noise ratio, we employ a technique of stacking multiple RFs. This involves combining various RFs obtained from different back azimuths, as demonstrated in Supplementary Figure S5. We employed an approach known as iterative deconvolution to reduce the variance between the observed and the synthetic RF (e.g., Ligorria & Ammon, 1999). Synthetic seismograms were calculated using the method of Randall (1989), which is based on the reflection-matrix technique of Kennett (1983) and Ligorria and Ammon (1999). The ak135 initial velocity model which depicts a close-to-constant velocity layer for the lithosphere is utilized to get Vp and Vs during the inversion (Kennett et al., 1995; Kibret et al., 2022). The ak135 model was selected for the purposes of comparing the findings of this investigation with those of prior studies conducted by authors in different areas (e.g., Kibret et al., 2022), as well as due to usability with the CPS software. To calculate the appropriate final synthetic RF and the corresponding 1D velocity model, we checked to see if the RF obtained from the global initial ak135 velocity model (Kennett et al., 1995) matched the stacked RF (Supplementary Figure S3). We move on to the next iteration if the corresponding RF obtained from the global starting ak135 velocity model and the stacked RF do not resemble one another. If the mismatch between the stacking RF and the synthetic RF is bigger, then the derived 1D velocity model obtained from this synthetic RF is rejected. Following the initial inversion, starting with the initial model, all subsequent inversions are performed iteratively until the misfit (the root mean square difference) between the stacked RF and the synthetic RF is within the range of 0.01%–0.05% (Gurrola et al., 1995; Ligorria & Ammon, 1999). This process is repeated until we have the final 1D velocity model with a corresponding synthetic RF that appears to be the best fit for the stacked RF. Finally, the best fit RF and its corresponding 1D velocity models are automatically selected by comparing the percentage of fit and visual inspection (Figure 3).
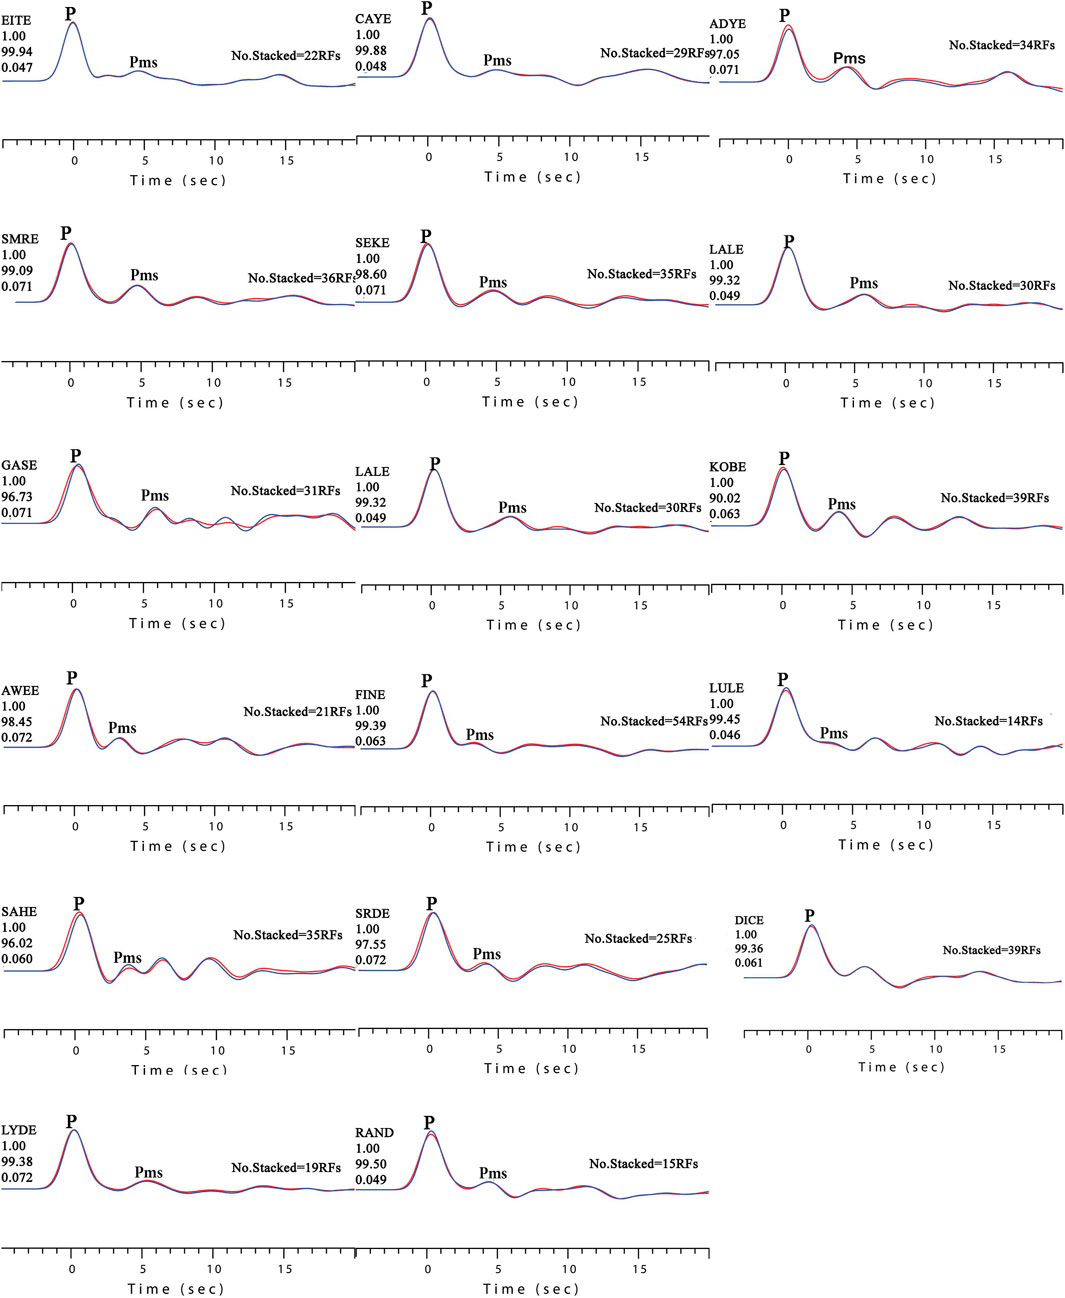
FIGURE 3. Comparison of the observed RFs in blue with the synthetic RF in red for 17 seismic stations. P shows the direct phase, while Ps represent the converted phase, likely from the Moho. The text to the left of the plots lists the name of the station, the Gaussian width parameter, the percentage of model fit between the estimated and observed value, and the applied ray parameters.
The 1D velocity models of Vp and Vs are also produced for each station by inverting best fit synthetic RFs over a range of lower frequencies and ray parameters (Cassidy, 1992; Dugda et al., 2007) (Figure 4). Velocities in the 1D models were solved at a depth interval of 2 km, and we plot and interpret the top 60 km of the models. To interpret the crustal composition, we also calculated the Vp/Vs ratio at each 2 km depth interval in the Vs model, (Ligorria & Ammon, 1999), and using the average Vp (6.5 km/s) computed for the same station (Zhu & Kanamori, 2000; Hammond et al., 2011). For this study, a variety of ray parameters between 0.04 and 0.069 and Gaussian width factors 1.0 were used. To help interpret the deep crustal structure in 1D velocity models we plot the crustal thickness derived from previous H-k stacking of RFs (e.g., Hammond et al., 2011; Wang et al., 2021; Ahmed et al., 2022). We then re-interpreted the Moho in our 1D models by identifying the largest velocity step within a similar depth range to the previous Moho estimates.
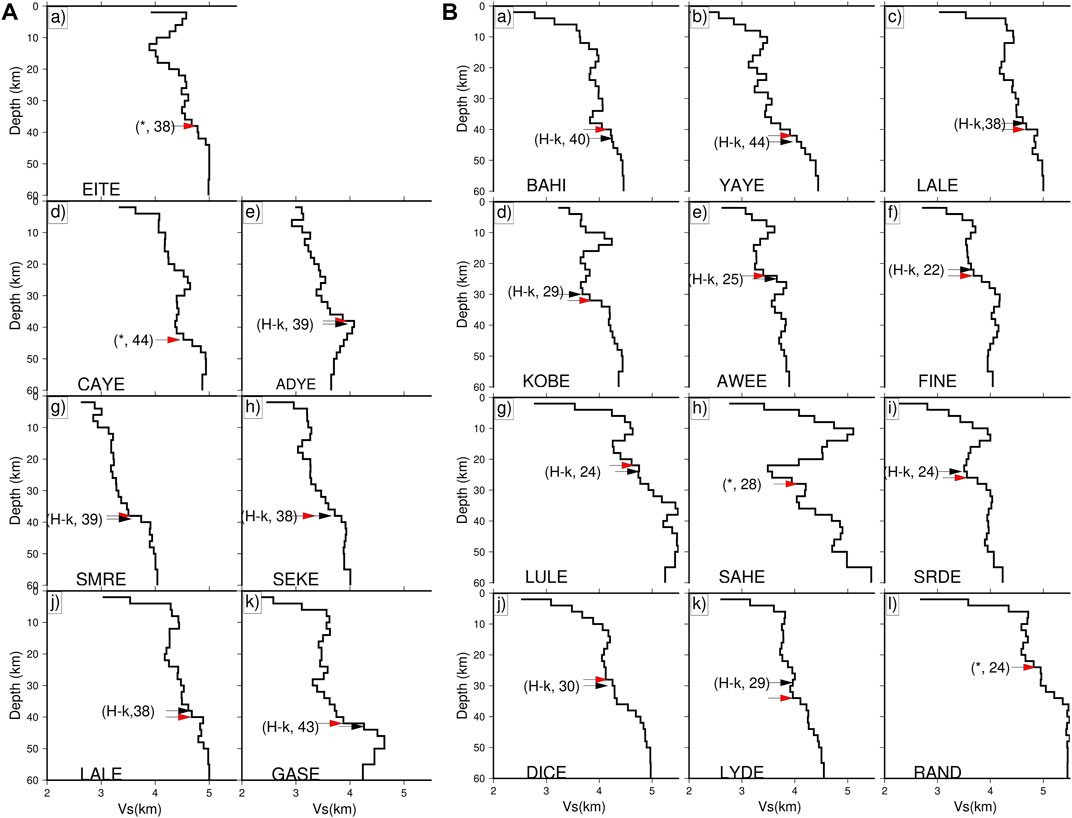
FIGURE 4. 1D models resulted from RF inversion. The red arrows in Figures (A) and (B) correspond to Moho discontinuities obtained from the inversion. The black arrows in these figures represent the Moho depth calculated in the previous H-k RFs stacking technique (Hammond et al., 2011). The black stars is used to show the stations do not have previously calculated Moho depth values. Profile I represent the AA′ axis’ north-south direction, whereas profile II displays the BB′ axis’ east-west direction.
Additionally, we employed the Delaunay triangulation interpolation method to estimate unknown velocities based on several calculated velocities and created a 2D velocity model (Ping et al., 2009; Kibret et al., 2022). The technique assumes there are no points inside any triangle’s perimeter and works with three velocities at once. By triangulating and contouring the estimated velocity data we imaged the 2D velocity versus depth plots. we used this interpolation technique as implemented in the GMT plotting software (Wessel et al., 2019; Kibret et al., 2022).
Geophysicists routinely use Vp/Vs data to interpret the presence of partial melt in the crust and typically use Vp/Vs values of >1.9 as evidence (Einarsson and Brandsdóttir, 2006; Ebinger et al., 2017; Wang et al., 2021; Ahmed et al., 2022; Kibret et al., 2022). We compute the cumulative relative frequency (Ott & Longnecker, 2001; Peck et al., 2008) of our Vp/Vs model below a depth of 10 km to quantify the proportion of the mid and lower crust with a Vp/Vs of >1.9. We remove the top 10 km from the analysis since high Vp/Vs ratios are more likely associated with sediments. We use the Vp/Vs model acquired at 2 km intervals on profiles I and II (9 stations on the NW plateau and 9 stations in Afar) by dividing the frequency of each value by the total number of observations and then multiplying the relative frequency by 100 to convert it to a percent (%) (e.g., Abdulla et al., 2014) (Table 1). The percentage of cumulative frequency (PCF) is computed using the Vp/Vs data and its frequency below a depth of 10 km. PCF represents the proportion of the mid and lower crust with a Vp/Vs of >1.9, which is an important parameter in our study. Specifically, it provides valuable information on the distribution of Vp/Vs ratios in the crust and can be used to identify areas with anomalous values, which could be indicative of geological structures and processes.
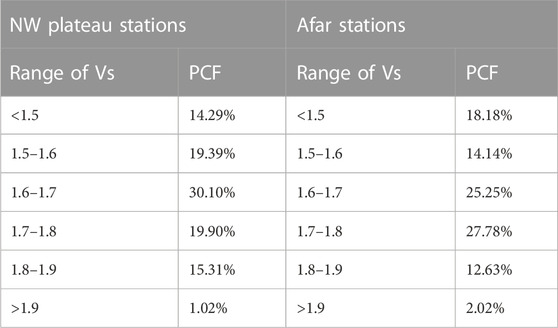
TABLE 1. The percentage of cumulative frequency (PCF) distribution for different ranges of Vp/Vs values. The range of Vs and PCF values are described for both the NW plateau and Afar depression.
Figure 3 shows our observed RFs in blue compared to the synthetic RFs in red. Overall, we detected a clear Ps conversion in both Profiles I and II at delay times from 3 to 6 s, with the arrival time of the Ps discontinuity in the observed stacked RF signal increasing toward the NW plateau. Additionally, our synthetic RFs are very well matched to the observed RFs, with a misfit score ranging from 97.05 to 99.88.
The 1D models of the station on the NW plateau generally show a fairly simple velocity structure with increasing seismic velocity with depth. The profiles fall into 2 distinct classes of characteristic S-wave velocities. Most of the stations (ADYE, SMRE, SEKE, GASE. YAYE) show S-wave velocities of between ∼3–4 km/s for the majority of the crust. Slower velocities than this are in the top ∼5 km for some stations. The second class of stations shows somewhat faster velocities through most of the crust. Specifically, stations EITE, CAYE, LALE, and BAHI show seismic velocities between ∼4 and 4.7 km/s through most of the crust. Again, slower velocities than this are commonly modeled for the uppermost crust at these stations. The 1D models for most of the NW plateau stations also demonstrate a relatively large velocity discontinuity seen at depths between 36 and 44 km (Figure 4A).
The 2D profiles provide a means to identify the spatial variability of the major variations in the Vs structure, and to identify finer scale patterns. A significant area of anomalously slow crustal Vs. (<3.2 km/s) is observed from ADYE, SMRE, and SEKE (Figure 5). This region is the slowest in the middle of the feature beneath SMRE. While the magnitude of the velocities varies in the anomaly, it generally shows the slowest Vs. in the mid-crust at ∼10–25 km depth. This region is flanked on either side by the faster crust (4–4.7 km/s). Vs. at mantle depths of more than ∼40 km is slowest (<4.0 km/s) beneath regions of the slower crust, while the higher Vs. crust beneath EITE, CAYE, and LALE is underlain by a faster mantle of >4.0 km/s.
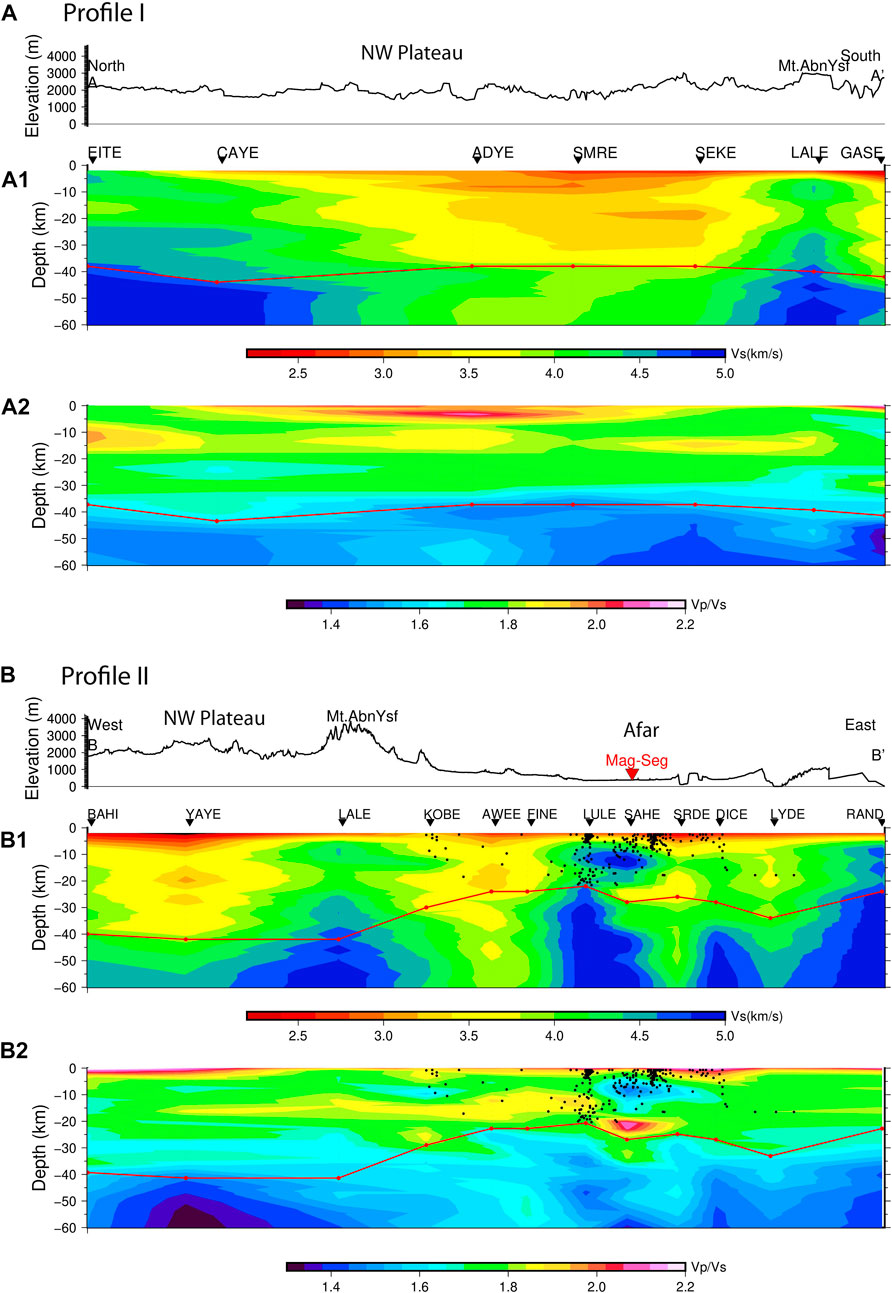
FIGURE 5. (A) displays a 2D vertical slice taken from profile I of Figure 1 spanning the area from station EITE (in Eritrea) to GASE along the NW plateau (from north to south) with (A1) showing the Vs model and (A2) showing the Vp/Vs model. Blue denotes faster Vs, whereas red denotes slower Vs However, red denotes a high Vp/Vs ratio, whereas blue denotes a low Vp/Vs ratio. (B) displays a 2D vertical slice across the Afar profile II of Figure 1 from BAHI (at Bahir Dar near Lake Tana) to RAND in Djibouti. The red inverted triangle represents the location of the magmatic segment in central Afar. The 2D Vs and Vp/Vs models shown in Figures 5B1, B2 were produced by inverting RFs with an east-west alignment (profile II). Under profile II, the earthquake hypocenters from Zwaan et al. (2020) are shown as black circles. The red solid line depicts the Vs discontinuity shown in the 2D models. The solid black line above profiles I and II may be seen as a 1D topographical map of those two profiles.
The 2D Vp/Vs profiles for the NW plateau show that most of the crust has a Vp/Vs of 1.7–1.8 (Figure 5). The exceptions are regions in the mid-crust at ∼10–25 km where Vp/Vs is generally 1.8–1.9. This depth range of the high Vp/Vs is similar to the depth range across which Vs is commonly slower, causing the local Vs inversion described above. In addition, in the middle portion of the profile, Vp/Vs in the uppermost crust is locally as high as 2.0.
The broad characteristics and pattern of variabilities in Vs in the Afar stations are quite different from the NW plateau. Firstly, the overall Vs is generally relatively faster at the majority of stations compared to the NW plateau (Figure 4). Except for the top 5 km under station AWEE, all stations have crustal Vs that are mostly between 3.5 and 4.5 km/s (Figure 4B). However, set within this simpler framework, far more dramatic local spatial and depth variability is observed. For example, a noticeable feature common in the profiles is that relatively fast velocities of ∼4 km/s are reached at relatively shallow depths, resulting in fairly minimal increases in velocity with depth through the crust (e.g., stations FINE, LYDE, RAND). Some stations also show a very noticeable decrease in velocity at mid-lower crustal depths (e.g., SAHE, LULE, SRDE).
Profile II displays the 2D Vs model that is under Afar and allows us to explore the spatial variations of Vs characteristics identified in the 1D models above. As a reference point geologically and in terms of variability in the Vs structure, the current locus of extension (magmatic segment) is positioned between LULE and SAHE stations. Both these stations have a similar seismic structure with a relatively fast (∼4.5 km/s) Vs at a shallow (∼6–14 km) depth range, underlain by slower velocities at lower crustal depths (∼15–25 km). On either side of the current locus of strain within the rift, the Vs is generally slower, particularly in the lower crust.
Vp/Vs of the Afar crust is mostly in the 1.7–1.8 range (Figure 5B2). In particular, the east of Afar shows a distinct lack of variability in Vp/Vs from these values. In contrast beneath the magmatic segment, the Vp/Vs at ∼20–25 km depth is locally and markedly high at over 2.0. Beneath the west of Afar, the Vp/Vs shows elevated values of up to ∼1.9 at ∼10–20 km depth. Vp/Vs is also locally elevated in the uppermost ∼5 km in places.
The Moho depth of the NW plateau is first calculated from the 1D Vs model and compared with the Vp/Vs model from the 1D and 2D Vs models. The 1D Vs model and the 2D model both show that the Moho is both an abrupt (ADYE:38, SMRE:38, LALE:40, GASE:42, and BAHI:38 km) and a gradational (EITE:38, CAYE:44, SEKE:38, and YAYE:42 km) discontinuity (Figure 4A). The Moho is sharp beneath most of the NW plateau stations. These strong velocity discontinuities are found beneath the bulk of NW plateau stations at depths where they were previously thought to be Moho (e.g., Hammond et al., 2011). The thickest crust (about 44 km) is seen at Eritrea’s furthest station, CAYE (Figure 4). The deepest Moho, 44 km, is imaged at the NW plateau border beneath the CAYE and YAYE stations (Figure 5A). However, the NW plateau’s crustal thickness varies from 36 to 44 km.
Both the 1D Vs and the 2D Vp/Vs models show the Moho depth beneath Afar. However, compared to the NW plateau, only about four Afar stations have strong velocity discontinuities (KOBE:32, AWEE:25km, SRDE:26km, and SAHE:28 km). Instead, beneath most of the Afar stations (FINE:24km, LULE:22km, DICE:28km, LYDE:43km, and RAND:24 km), a more gradational Moho is observed (Figure 4B). In Afar, the crustal thickness ranges from 26 to 30 km (Figure 4B). Afar has a thinner crust than the NW plateau (Figure 5B), with the AWEE station at the Tendaho graben in Central Afar having the thinnest crust (26 km) in our region.
The percentage of cumulative frequency (PCF) is computed using the Vp/Vs data and its frequency below a depth of 10 km. The analysis shows that 2% and 1% of the Afar and NW plateau crust, respectively, have Vp/Vs of >1.9 (Table 1).
We provide new independent constraints on crustal Vs and Vp/Vs structures beneath the NW Plateau that build on previous S-wave imaging and RFs studies (Hammond et al., 2011; Chambers et al., 2019) (Figure 5A). Our result shows that the regions of slow Vs (<3.2 km/s) lie beneath the broader area of the NW plateau. In particular in profile I the region between SMRE and SEKE is characterized by such velocities at 10–25 km depth. These velocities are slower than expected. For example, silicic and intermediate rocks that are most typical of continental crust have Vs at these depths in the range of 3.6–3.8 km/s (Birch, 1960; Simmons, 1964), with mafic rocks having typical Vs of >3.8 km/s at crustal temperatures of 600°C (Hacker & Abers, 2004; Chambers et al., 2019). The velocities we observe are significantly slower and require alternative explanations than simply variation in rock types, such as warmer temperatures or the presence of a fluid phase.
Uniquely constraining the slow Vs. as being from high temperature or the presence of fluids is difficult without independent constraints. However, broadly speaking the reduction in Vs with an increase in temperature in a range believable for the crust is insufficient to explain the observations. For example, intermediate rocks at 600°C, more typical of lower crustal conditions have Vs of ∼3.7 km/s. We, therefore, turn to the presence of a fluid phase, such as partial melt to explain the regions of especially slow Vs (e.g., Artemieva et al., 2004). Direct support for our interpretation comes from our own computed Vp/Vs In general, regions with slow Vs (3.2 km/s) have a high Vp/Vs (1.85–2.1). Vp/Vs of typical continental crust is <1.8 (Christensen, 1996; Hammond et al., 2011), while for mafic rock it is 1.7–1.9 (Hammond et al., 2011). However, in localized places (1% of the NW Plateau crust as shown by the PCF analysis (Table 1) we observe Vp/Vs of >1.9, which can only really be explained by the presence of a fluid phase such as partial melt.
Independent constraints on the presence of partial melt at this mid-crustal depth range beneath the NW plateau are also supported by other studies (Hammond et al., 2011; Chambers et al., 2019; Eshetu et al., 2021). For example, seismic imaging from ambient noise and surface waves show slow Vs (∼3.2 km/s) at 10 km depth beneath localized regions of the NW plateau, which are interpreted as regions including partial melt (e.g., Chambers et al., 2019). The presence of localized regions of partial melt beneath the NW plateau is further supported by Ahmed et al. (2022) who observed bulk crustal Vp/Vs of >1.85 beneath limited stations in the area. Additionally, scattered deep crustal earthquakes and high electrical conductivities below 10 km beneath the NW plateau have been previously interpreted as being magma or fluid-related (Whaler & Hautot, 2006; Keir et al., 2009a). The presence of melt in the NW plateau crust is somewhat unexpected, with potential explanations for the melt source being from decompression melting of the asthenosphere directly beneath a broadly extending plateau (Birhanu et al., 2016), or from lateral migration of magma from beneath the rift (e.g., Ebinger et al., 2017).
The uppermost crustal velocity structure beneath Afar is very variable (Figure 5B). Thickest regions of slow Vs (<3.2 km/s) and high Vp/Vs at depths of <6 km commonly correlate well with the position of sedimentary and volcanic material which agrees with previous findings (Hammond et al., 2011; Chambers et al., 2021 and referenced therein; Kibret et al., 2019). Below the uppermost crust, the seismic velocity beneath Afar is fairly homogeneous except beneath the current locus of strain at the magmatic segments. East of the magmatic segment (stations SRDE, DICE, LYDE), Vs is fairly high (>4.0 km/s) and Vp/Vs is mostly 1.75–1.8, consistent with continental crust intruded with now solidified mafic rock. West of the magmatic segment (stations KOBE, AWEE, FINE) however, Vs is slightly slow (∼3.2–4.0 km/s) but with distinctively high Vp/Vs of ∼1.8–1.9, more suggestive of mafic crust including limited partial melt. This suggests asymmetry in present-day magmatic modification of the crust beneath Afar, with ongoing processes more focused between the magmatic segment and the western Afar margin. Beneath the magmatic segment (stations LULE, SAHE), a distinctive feature is slow Vs combined with especially high Vp/Vs (2.0) at depths of ∼20–25 km (i.e., lower crust), which is best explained by the presence of partial melt. The PCF analysis shows that this region constitutes 2% of the crust (Table 1), and strongly points towards the lower crust being a major and long-lived magma storage zone. In the upper crust beneath the magmatic segment, we observe high Vs (>4.5 km/s) but anomalously low Vp/Vs. This combination is difficult to explain without the presence of a gas phase (Whittington et al., 2009), which is consistent with vigorous magmatic degassing from solidifying intrusions, and also a vigorous hydrothermal system (Lee et al., 2016; Ebinger et al., 2017; Roecker et al., 2017).
We have derived a new, continuous Moho map by interpolating the RF constraints to characterize the Vs and Moho variability for the NW plateau and Afar stations. To first-order, the crustal thickness in our interpretation assumes the Moho depth at the base of the relatively large velocity gradient (e.g., Collins, 1991; Clitheroe et al., 2000; Collins et al., 2003; Fontaine et al., 2013; Bello et al., 2021), and our Moho depths are consistent with previous studies (e.g., Hammond et al., 2011; Ahmed et al., 2022). However, beneath most of our stations in the NW plateau, the Moho is characterized by a sharp velocity contrast, whereas in Afar, the velocity contrasts are more commonly gradational. The gradational velocity gradient across the Afar Moho as compared to the NW plateau might be due to the increasing lower crustal mafic intrusion, which reduces the velocity contrast between crust and mantle. This agrees with previous findings that mafic intrusions in the lower crust can alter the nature of the Moho to become more gradational (e.g., Thybo & Artemieva, 2013; Hodgson et al., 2017). A similar observation is inferred beneath the southern Tanganyika Rift of Ufifipa (e.g., Hodgson et al., 2017). The generally sharper Moho beneath the NW plateau suggests magma modification of the lower crust is less common, pointing towards spatially isolated supply from depth.
This study utilized teleseismic data collected from 17 broadband stations in Ethiopia and Eritrea between 2000 and 2013 to investigate the crustal structure of the region. The results revealed that the majority of the crust has faster Vs (4–4.7 km/s) with a regionally slower Vs (3.2 km/s) and a high ratio of Vp/Vs (1.85–2.0) in the mid-crust of the NW Plateau at a depth of 10–25 km. The analysis also identified homogeneous crust beneath most of the Afar stations, except for faster material (4.5 km/s) observed in the upper-mid crust beneath the magmatic segment, which is the current locus of extension. Conversely, the magmatic segment of Afar revealed slower Vs (3.2 km/s) and a high Vp/Vs (2.0) at deeper crustal depths (20–25 km). Furthermore, slow Vs (∼3.2 km/s) and a high Vp/Vs (>1.9) were inferred beneath the NW Plateau, indicating the presence of partial melt.
These results suggest the presence of mafic crust with fluid phases, such as partial melt, beneath Afar and the NW Plateau. They have important implications for our understanding of the tectonic processes and geodynamic evolution of the region. The study provides valuable insights into the crustal structure and composition of the area and could pave the way for further research.
The original contributions presented in the study are included in the article/Supplementary Material, further inquiries can be directed to the corresponding author.
BK used the Computer Application for Seismology program to produce additional scripts. All three writers contributed to the idea for this study. BK handled the selection and processing of the teleseismic signals, the modeling of all other datasets, and the manuscript’s composition. All authors contributed to the manuscript’s writing and the discussion and interpretation of the results.
Addis Ababa University funded the research project. DK’s time on the work was supported by Natural Environment Research Council under NERC Grant NE/L013932/1, and the Ministero dell’Università e della Ricerca (MiUR) through PRIN grant 2017P9AT72.
We appreciate the IRIS Data Management Center’s assistance (IRIS DMC). Likewise, author would like to express my profound gratitude to Prof. Robert Herrmann for familiarizing the scientific community with his software package “Computer Program for Seismology.” We would also like to thank Zwaan (Zwaan et al., 2020) for archiving the earthquake epicenters in Afar. Finally, we would like to thank Addis Ababa University for giving me the chance to perform this study. The seismic station network in Ethiopia is financially supported by the International Science Program (ISP) of Uppsala University. The authors want to express their sincere appreciation to all the reviewers, editors, and editorial staff for their invaluable contributions and support.
The authors declare that the research was conducted in the absence of any commercial or financial relationships that could be construed as a potential conflict of interest.
All claims expressed in this article are solely those of the authors and do not necessarily represent those of their affiliated organizations, or those of the publisher, the editors and the reviewers. Any product that may be evaluated in this article, or claim that may be made by its manufacturer, is not guaranteed or endorsed by the publisher.
The Supplementary Material for this article can be found online at: https://www.frontiersin.org/articles/10.3389/feart.2023.1170907/full#supplementary-material
Abdulla, F., Hossain, M., and Rahman, M. (2014). On the selection of samples in probability proportional to size sampling: Cumulative relative frequency method. Math. Theory Model. 4, 102–107.
Ahmed, A., Doubre, C., Leroy, S., Keir, D., Pagli, C., Hammond, J. O. S., et al. (2022). Across and along-strike crustal structure variations of the Western Afar margin and adjacent plateau: Insights from receiver functions analysis. J. Afr. Earth Sci. 192, 104570. doi:10.1016/j.jafrearsci.2022.104570
Ammon, C. (1991). The isolation of receiver effects from teleseismic P waveforms. Bull. Seismol. Soc. Am. 81 (6), 2504–2510. doi:10.1785/bssa0810062504
Ammon, C., Randall, G., and Zandt, G. (1990). On the non-uniqueness of receiver function inversions. J. Geophys. Res. Solid Earth 95 (B10), 15303–15318. doi:10.1029/jb095ib10p15303
Artemieva, I. M., Billien, M., Lévêque, J.-J., and Mooney, W. D. (2004). Shear wave velocity, seismic attenuation, and thermal structure of the continental upper mantle. Geophys. J. Int. 157 (2), 607–628. doi:10.1111/j.1365-246X.2004.02195.x
Barnie, T. D., Oppenheimer, C., and Pagli, C. (2016). in Does the lava lake of erta ‘ale volcano respond to regional magmatic and tectonic events? An investigation using Earth observation data. Editors T. J. Wright, A. Ayele, D. J. Ferguson, T. Kidane, and C. Vye-Brown (London: Geological Society, London, Special Publications). doi:10.1029/JB095iB10p15303
Bastow, I. D., Keir, D., and Daly, E. (2011). The Ethiopia Afar Geoscientific Lithospheric Experiment (EAGLE): Probing the transition from continental rifting to incipient seafloor spreading. Geol. Soc. Am. Bull. 478, 51–76.
Bastow, I. D., Pilidou, S., Kendall, J. M., and Stuart, G. W. (2010). Melt-induced seismic anisotropy and magma assisted rifting in Ethiopia: Evidence from surface waves. Geochem. Geophys. Geosystems 11. doi:10.1029/2010gc003036
Beccaluva, L., Bianchini, G., Natali, C., and Siena, F. (2009). Continental flood basalts and mantle plumes: A case study of the northern Ethiopian plateau. J. Petrology 50 (7), 1377–1403. doi:10.1093/petrology/egp024
Bello, M., Cornwell, D. G., Rawlinson, N., Reading, A. M., and Likkason, O. K. (2021). Crustal structure of southeast Australia from teleseismic receiver functions. Solid earth. 12, 463–481. doi:10.5194/se-12-463-2021
Bialas, R. W., Buck, W. R., and Qin, R. (2010). How much magma is required to rift a continent? Earth Planet. Sci. Lett. 292 (1-2), 68–78. doi:10.1016/j.epsl.2010.01.021
Birch, F. (1960). The velocity of compressional waves in rocks to 10 kilobars: 1. J. Geophys. Res. 65, 1083–1102. doi:10.1029/jz065i004p01083
Birhanu, Y., Bendick, R., Fisseha, S., Lewi, E., Floyd, M., King, R., et al. (2016). GPS constraints on broad scale extension in the Ethiopian Highlands and Main Ethiopian Rift. Geophys. Res. Lett. 43, 6844–6851. doi:10.1002/2016GL069890
Buck, W. R., Einarsson, P., and Brandsdóttir, B. (2006). Tectonic stress and magma chamber size as controls on dike propagation: Constraints from the 1975–1984 Krafla rifting episode. J. Geophys. Res. Solid Earth 111 (B12). doi:10.1029/2005JB003879
Cassidy, J. F. (1992). Numerical experiments in broadband receiver function analysis. Bull. Seismol. Soc. Am. 82 (3), 1453–1474. doi:10.1785/bssa0820031453
Chambers, E. L., Harmon, N., Keir, D., and Rychert, C. A. (2019). Using ambient noise to image the northern East African Rift. Geochem. Geophys. Geosyst. 20, 2091–2109. doi:10.1029/2018gc008129
Chambers, E. L., Harmon, N., Rychert, C., and Keir, D. (2021). Variations in melt emplacement beneath the northern East African Rift from radial anisotropy. Earth Planet. Sci. Lett. 573, 117150–117213. doi:10.1016/j.epsl.2021.117150
Chiasera, B., Rooney, T. O., Girard, G., Yirgu, G., Grosfils, E., Ayalew, D., et al. (2018). Magmatically assisted off-rift extension-The case for broadly distributed strain accommodation. Geosphere 14, 1544–1563. doi:10.1130/ges01615.1
Christensen, N. I., and Mooney, W. D. (1995). Seismic velocity structure and composition of the continental crust: A global view. J. Geophys. Res. 100, 9761–9788. doi:10.1029/95jb00259
Christensen, N. I. (1996). Poisson's ratio and crustal seismology. Poisson's ratio crustal Seismol. 101, 3139–3156. doi:10.1029/95JB03446
Clitheroe, G., Gudmundsson, O., and Kennett, B. (2000). The crustal thickness of Australia. J. Geophys. Res. 105, 13697–13713. doi:10.1029/1999jb900317
Collins, C. D. N., Drummond, B. J., and Nicoll, M. G. (2003). Crustal thickness patterns in the Australian continent. Geol. Soc. Ame. Spec. Pap. 372, 121–128.
Collins, C. D. N. (1991). The nature of crust-mantle boundary under Australia from seismic evidence in the Australian lithosphere. Geol. Soc. Aust. Spec. Pub. 17, 67–80.
Cornwell, D. G., Mackenzie, G. D., England, R. W., Maguire, P. K. H., Asfaw, L. M., and Oluma, B. (2006). “Northern Main Ethiopian Rift crustal structure from new high-precision gravity data,” in The Afar volcanic province within the East African rift system. Editors G. Yirgu, C. Ebinger, and P. Maguire (United Kingdom: Special Publication of the Geological Society London), 259, 307–322.
Cornwell, D. G., Maguire, P. K. H., England, R. W., and Stuart, G. W. (2010). Imaging detailed crustal structure and magmatic intrusion across the Ethiopian Rift using a dense linear broadband array. Geochem. Geophys. Geosystems 11. doi:10.1029/2009gc002637
Corti, G. (2009). Continental rift evolution: From rift initiation to incipient break-up in the Main Ethiopian Rift, East Africa. Earth-Science Rev. 96, 1–53. doi:10.1016/j.earscirev.2009.06.005
Corti, G., Sani, F., Agostini, S., Philippon, M., Sokoutis, D., and Willingshofer, E. (2018). Off-axis volcano-tectonic activity during continental rifting: Insights from the transversal Goba-Bonga lineament, Main Ethiopian Rift (East Africa). Tectonophysics 728-729, 75–91. doi:10.1016/j.tecto.2018.02.011
Desissa, M., Johnson, N. E., Whaler, K. A., Hautot, S., Fisseha, S., and Dawes, G. J. K. (2013). A mantle magma reservoir beneath an incipient mid-ocean ridge in Afar, Ethiopia. Nat. Geosci. 6 (10), 861–865. doi:10.1038/ngeo1925
Doubre, C., Déprez, A., Masson, F., Socquet, A., Lewi, E., Grandin, R., et al. (2017). Current deformation in Central Afar and triple junction kinematics deduced from GPS and InSAR measurements. Geophys. J. Int. 208 (2), 936–953. doi:10.1093/gji/ggw434
Dugda, M. T., Nyblade, A. A., Julia, J., Langston, C. A., Ammon, C. J., and Simiyu, S. (2005). Crustal structure in Ethiopia and Kenya from receiver function analysis: Implications for rift development in eastern Africa. J. Geophys. Res. 110, B01303. doi:10.1029/2004jb003065
Dugda, M. T., Nyblade, A. A., and Julia, J. (2007). Thin lithosphere beneath the Ethiopian plateau revealed by a joint inversion of Rayleigh wave group velocities and receiver functions. J. Geophys. Res. Solid Earth 112 (B8), B08305. doi:10.1029/2006JB004918
Dugda, M. T., and Nyblade, A. A. (2006). New constraints on crustal structure in eastern Afar from the analysis of receiver functions and surface wave dispersion in Djibouti. Geol. Soc. Lond. Spec. Publ. 259 (1), 239–251. doi:10.1144/gsl.sp.2006.259.01.19
Ebinger, C. (2007). Afar07 [Data set]. International Federation of Digital Seismograph Networks. doi:10.7914/SN/ZE_2007
Ebinger, C. J., Keir, D., Bastow, I., Whaler, K., Hammond, J. O. S., Ayele, A., et al. (2017). Crustal structure of active deformation zones in africa: Implications for global crustal processes. Tectonics 36, 3298–3332. doi:10.1002/2017TC004526
Einarsson, W. R. P., and Brandsdóttir, B. (2006). Tectonic stress and magma chamber size as controls on dike propagation: Constraints from the 1975–1984 Krafla rifting episode. J. Geophys. Res. Solid Earth 111 (B12). doi:10.1029/2005JB003879
Eshetu, A., Mammo, T., and Tilmann, F. (2021). Imaging the Ethiopian rift region using transdimensional hierarchical seismic noise tomography. Pure Appl. Geophys. 178, 4367–4388. doi:10.1007/s00024-021-02880-2
Fontaine, F. R., Tkalcic, H., and Kennett, B. L. N. (2013). Crustal complexity in the Lachlan Orogen revealed from teleseismic receiver functions. Aust. J. Earth Sci. 60, 413–430. doi:10.1080/08120099.2013.787646
Gurrola, H., Baker, G. E., and Minster, J. B. (1995). Simultaneous time-domain deconvolution with application to the computation of receiver functions. Geophys. J. Int., 120(3), 537–543. doi:10.1111/j.1365-246X.1995.tb01837.x
Hacker, B. R., and Abers, G. A. (2004). Subduction Factory 3: An Excel worksheet and macro for calculating the densities, seismic wave speeds, and H2O contents of minerals and rocks at pressure and temperature. Geochem. Geophys. Geosyst. 5, 1–7. doi:10.1029/2003gc000614
Hammond, J. O. S. (2014). Constraining melt geometries beneath the Afar Depression, Ethiopia from teleseismic receiver functions: The anisotropic H-k stacking technique. Geochem. Geophys. Geosyst., 15, 1316–1332.
Hammond, J. O. S., Kendall, J. M., Stuart, G., Ebinger, C., Bastow, I., Keir, D., et al. (2013). Mantle upwelling and initiation of rift segmentation beneath the Afar Depression. Geology 41, 635–638. doi:10.1130/g33925.1
Hammond, J. O. S., Kendall, J. M., Stuart, G., Keir, D., Ebinger, C., Ayele, A., et al. (2011). The nature of the crust beneath the Afar triple junction: Evidence from receiver functions. Geochem. Geophys. Geosyst. 12, 1–24. doi:10.1029/2011gc003738
Hayward, N., and Ebinger, C. J. (1996). Variations in the along-axis segmentation of the Afar rift system. Tectonics 15, 244–257. doi:10.1029/95tc02292
Herrmann, R. B., and Ammon, C. J. (2002). Computer programs in seismology-3.30: Surface waves, receiver functions. Available at: www.eas.slu.edu/People/RBHerrmann/CPS330.html.
Hodgson, I., Illsley-Kemp, F., Gallacher, R. J., Keir, D., Ebinger, C. J., and Mtelela, K. (2017). Crustal structure at a young continental rift: A receiver function study from the Tanganyika Rift. Tectonics 36, 2806–2822. doi:10.1002/2017TC004477
Hofmann, C., Courtillot, V., Féraud, G., Rochette, P., Yirgu, G., Ketefo, E., et al. (1997). Timing of the Ethiopian flood basalt event and implications for plume birth and global change. Nature 389 (6653), 838–841. doi:10.1038/39853
Keir, D., Bastow, I. D., Whaler, K. A., Daly, E., Cornwell, D. G., and Hautot, S. (2009a). Lower crustal earthquakes near the Ethiopian rift induced by magmatic processes: Deep earthquakes induced by magmatic processes. Geochem. Geophys. Geosystems 10 (6). doi:10.1029/2009GC002382
Keir, D., Hamling, I. J., Ayele, A., Calais, E., Ebinger, C., Wright, T., et al. (2009b). Evidence for focused magmatic accretion at segment centers from lateral dike injections captured beneath the Red Sea rift in Afar. Geol. Soc. Am. 37, 59–62. doi:10.1130/G25147A.1
Kennett, B. L. N., Engdah, E. R., and Buland, R. (1995). Constraints on seismic velocities in the Earth from traveltimes. Geophys. J. Int. 122, 108–124. doi:10.1111/j.1365-246x.1995.tb03540.x
Kennett, B. L. N. (1983). Seismic wave propagation in stratified media. New York: Cambridge University Press, 342.
Keranen, K. M., and Klemperer, S. L. (2008). Discontinuous and diachronous evolution of the Main Ethiopian Rift: Implications for development of continental rifts. Earth Planet. Sci. Lett. 265, 96–111. doi:10.1016/j.epsl.2007.09.038
Kibret, B. A., Ayele, A., and Keir, D. (2019). Crustal thickness estimates beneath four seismic stations in Ethiopia inferred from p-wave receiver function studies. J. Afr. Earth Sci. 150, 264–271. doi:10.1016/j.jafrearsci.2018.11.005
Kibret, B. A., Ayele, A., and Keir, D. (2022). Modeling S-wave velocity structure beneath the central Main Ethiopian rift using receiver functions. Front. Earth Sci. 10, 1–13.
Kieffer, B., Arndt, N., Lapierre, H., Bastien, F., Bosch, D., Pecher, A., et al. (2004). Flood and shield basalts from Ethiopia: Magmas from the african superswell. J. Petrol. 45, 793–834. doi:10.1093/petrology/egg112
La Rosa, A., Pagli, C., Wang, H., Doubre, C., Leroy, S., Sani, F., et al. (2021). Plate-boundary kinematics of the Afrera linkage zone (Afar) from InSAR and seismicity. J. Geophys. Res. Solid Earth 126. doi:10.1029/2020jb021387
Langston, C. A. (1979). Structure under mount rainier, Washington, inferred from teleseismic body waves. J. Geophys. Res. 84, 4749–4762.
Lavayssière, A., Rychert, C., Hammond, J. O. S., Harmon, N., Kendall, J. M., Doubre, C., et al. (2018). Imaging lithospheric discontinuities beneath the northern East African Rift usingS-to-Preceiverfunctions. Geochem. Geophys. Geosyst. 19, 4048–4062. doi:10.1029/2018gc007463
Lee, H., Muirhead, J. D., Fischer, T. P., Ebinger, C. J., Kattenhorn, S. A., Sharp, Z. D., et al. (2016). Massive and prolonged deep carbon emissions associated with continental rifting. Nat. Geosci. 9, 145–149. doi:10.1038/ngeo2622
Lewi, E., Keir, D., Birhanu, Y., Blundy, J., Stuart, G., Wright, T., et al. (2016). Use of a high-precision gravity survey to understand the formation of oceanic crust and the role of melt at the southern red sea rift in Afar, Ethiopia. Geol. Soc. Lond. Special Publ. 420, 165–180. doi:10.1144/SP420.13
Ligorria, J. P., and Ammon, C. (1999). Iterative deconvolution and receiver function estimation. Bull. Seismol. Soc. Am. 89, 1395–1400. doi:10.1785/bssa0890051395
Maccaferri, F., Rivalta, E., Keir, D., and Acocella, V. (2014). Off-rift volcanism in rift zones determined by crustal unloading. Nat. Geosci. 7 (4), 297–300. doi:10.1038/ngeo2110
Mackenzie, G. D., Thybo, H., and Maguire, P. K. H. (2005). Crustal velocity structure across the Main Ethiopian rift: Results from two-dimensional wide-angle seismic modelling. Geophys. J. Int. 162, 994–1006. doi:10.1111/j.1365-246x.2005.02710.x
Maguire, P., Keller, R., Klemperer, S., Mackenzie, G. D., Keranen, K., Harder, S., et al. (2006). Crustal structure of the Northern Main Ethiopian Rift from the EAGLE controlled source survey; a snapshot of an incipient lithospheric break-up. Geol. Soc. Spec. Publ. 259, 269–292. doi:10.1144/GSL.SP.2006.259.01.21
Makris, J., and Ginzburg, A. (1987). The Afar Depression: Transition between continental rifting and sea-floor spreading. Tectonophysics 141, 199–214. doi:10.1016/0040-1951(87)90186-7
Mammo, T. (2013). Crustal structure of the flood basalt province of Ethiopia from constrained 3-D gravity inversion. Pure Appl. Geophys. 170, 2185–2206. doi:10.1007/s00024-013-0663-0
Nyblade, A. (2000). Seismic investigation of deep structure beneath the Ethiopian Plateau and Afar depression [data set]. International Federation of Digital Seismograph Networks.
Ott, R. L., and Longnecker, M. T. (2001). An introduction to statistical methods and data analysis. Pacific Grove, CA: Thomson Brooks.
Pagli, C., Mazzarini, F., Keir, D., Rivalta, E., Rooney, T. O., Pisa, U., et al. (2015). Introduction: Anatomy of rifting: Tectonics and magmatism in continental rifts, oceanic spreading centers, and transforms. Geosphere 11 (5), 1256–1261. doi:10.1130/GES01082.1
Pagli, C., Yun, S.-H., Ebinger, C., Keir, D., and Wang, H. (2019). Strike-slip tectonics during rift linkage. Geology 47 (1), 31–34. doi:10.1130/g45345.1
Peck, R., Olsen, C., and Devore, J. (2008). Introduction to statistics and data analysis. Pacific Grove, CA: Thomson Brooks/Cole.
Pik, R., Deniel, C., Coulon, C., Yirgu, G., Hofmann, C., and Ayalew, D. (1998). The northwestern Ethiopian Plateau flood basalts: Classification and spatial distribution of magma types. J. Volcanol. Geotherm. Res. 81, 91–111. doi:10.1016/s0377-0273(97)00073-5
Pik, R., Deniel, C., Coulon, C., Yirgu, G., and Marty, B. (1999). Isotopic and trace element signatures of Ethiopian flood basalts: Evidence for plume–lithosphere interactions. Geochimica Cosmochimica Acta 63, 2263–2279. doi:10.1016/s0016-7037(99)00141-6
Pik, R., Marty, B., Carignan, J., Yirgu, G., and Ayalew, T. (2008). Timing of East African Rift development in southern Ethiopia: Implication for mantle plume activity and evolution of topography. Geology 36 (2), 167–170. doi:10.1130/g24233a.1
Ping, D., Jiatian, L., Xiaoqing, Z., and Jia, L. (2009). A new interpolation model of convex hull in Delaunay triangulation. Proc. SPIE 7492, 1–9.
Randall, G. E. (1989). Efficient calculation of differential seismograms for lithospheric receiver functions. Geophys. J. Int. 99, 469–481. doi:10.1111/j.1365-246x.1989.tb02033.x
Roecker, S., Ebinger, C., Tiberi, C., Mulibo, G., Ferdinand-Wambura, R., Mtelela, K., et al. (2017). Subsurface images of the eastern rift, africa, from the joint inversion of body waves, surface waves, and gravity: Investigating the role of fluids in early-stage continental rifting. Geophys. J. Int. 210, 931–950. doi:10.1093/gji/ggx220
Rooney, T. O., Krans, S. R., Mège, D., Arnaud, N., Korme, T., Kappelman, J., et al. (2018). Constraining the magmatic plumbing system in a zoned continental flood basalt province. Geochem. Geophys. Geosyst. 19, 3917–3944. doi:10.1029/2018gc007724
Rychert, C., Hammond, J. O. S., Harmon, N., Kendall, J., Keir, D., Ebinger, C., et al. (2012). Volcanism in the Afar Rift sustained by decompression melting with minimal plume influence. Nat. Geosci. 5, 406–409. doi:10.1038/ngeo1455
Simmons, G. (1964). Velocity of shear waves in rocks to 10 kilobars, 1. J. Geophys. Res. 69 (6), 1123–1130. doi:10.1029/JZ069i006p01123
Stuart, G., Bastow, I. D., and Ebinger, C. J. (2006). “Crustal structure of the northern Main Ethiopian Rift from receiver function studies,” in The Afar volcanic province within the East African rift system. Editors G. Yirgu, C. J. Ebinger, and P. K. H. Maguire (United Kingdom: Geological Society London Special Publications), 259, 253–267.
Thybo, H., and Artemieva, I. M. (2013). Moho and magmatic underplating in continental lithosphere. Tectonophysics 609, 605–619. doi:10.1016/j.tecto.2013.05.032
Tiberi, C., Ebinger, C., Ballu, V., Stuart, G., and Oluma, B. (2005). Inverse models of gravity data from the Red Sea–Aden–East African rifts triple junction zone. Geophys. J. Int. 163 (2), 775–787. doi:10.1111/j.1365-246x.2005.02736.x
Viltres, R., Jonsson, S., Ruch, J., Doubre, C., Reilinger, R., Floyd, M., et al. (2020). Kinematics and deformation of the southern Red Sea region from GPS observations. Geophys. J. Int. 221 (3), 2143–2154. doi:10.1093/gji/ggaa109
Wang, T., Gao, S. S., Yang, Q., and Liu, K. H. (2021). Crustal structure beneath the Ethiopian Plateau and adjacent areas from receiver functions: Implications for partial melting and magmatic underplating. Tectonophysics 889, 228857–228912. doi:10.1016/j.tecto.2021.228857
Wessel, P., Luis, J. F., Uieda, L., Scharroo, R., Wobbe, F., Smith, W. H. F., et al. (2019). The generic mapping tools version 6. Geochem. Geophys. Geosystems 20, 5556–5564. doi:10.1029/2019gc008515
Whaler, K. A., and Hautot, S. (2006). The electrical resistivity structure of the crust beneath the northern Main Ethiopian Rift. Geol. Soc. Lond. Spec. Publ. 259 (1), 293–305. doi:10.1144/gsl.sp.2006.259.01.22
Whittington, A. G., Hofmeister, A. M., and Nabelek, P. I. (2009). Temperature-dependent thermal diffusivity of the Earth’s crust and implications for magmatism. Nature 458 (7236), 319–321. doi:10.1038/nature07818
Wolfenden, E., Ebinger, C. J., Yirgu, G., Renne, P. R., and Kelley, S. P. (2005). Evolution of a volcanic rifted margin: Southern red sea, Ethiopia. Ethiopia 117, 846–864. doi:10.1130/b25516.1
Wright, T., Sigmundsson, F., Pagli, C., Belachew, M., Hamling, I., Bryndís, B., et al. (2012). Geophysical constraints on the dynamics of spreading centres from rifting episodes on land. Nat. Geosci. 15, 242–250. doi:10.1038/ngeo1428
Wright, T., Ebinger, C., Biggs, J., Ayele, A., Yirgu, G., Keir, D., et al. (2006). Magma-maintained rift segmentation at continental rupture in the 2005 Afar dyking episode. Nature 442, 291–294. doi:10.1038/nature04978
Yang, H., Chemia, Z., Artemieva, I. M., and Thybo, H. (2018). Control on off-rift magmatism: A case study of the Baikal Rift Zone. Earth Planet. Sci. Lett. 482, 501–509. doi:10.1016/j.epsl.2017.11.040
Zandt, G., and Ammon, C. J. (1995). Continental crust composition constrained by measurements of crustal Poisson's ratio. Nature 374, 152–154. doi:10.1038/374152a0
Zhu, L., and Kanamori, H. (2000). Moho depth variation in southern California from teleseismic receiver functions. J. Geophys. Res. Solid Earth 105 (B2), 2969–2980. doi:10.1029/1999JB900322
Keywords: crustal structure, Northwest Plateau, AFAR, receiver function, partial melt, gradational moho
Citation: Kibret BA, Ayele A and Keir D (2023) Crustal structure of the Ethiopian Northwestern Plateau and central Afar from receiver function analysis. Front. Earth Sci. 11:1170907. doi: 10.3389/feart.2023.1170907
Received: 27 February 2023; Accepted: 02 May 2023;
Published: 15 May 2023.
Edited by:
Lidong Dai, Chinese Academy of Sciences, ChinaReviewed by:
Titi Anggono, National Research and Innovation Agency (BRIN), IndonesiaCopyright © 2023 Kibret, Ayele and Keir. This is an open-access article distributed under the terms of the Creative Commons Attribution License (CC BY). The use, distribution or reproduction in other forums is permitted, provided the original author(s) and the copyright owner(s) are credited and that the original publication in this journal is cited, in accordance with accepted academic practice. No use, distribution or reproduction is permitted which does not comply with these terms.
*Correspondence: Birhanu Abera Kibret, YmlyaGFudS5hYmVyYUBhYXUuZWR1LmV0
Disclaimer: All claims expressed in this article are solely those of the authors and do not necessarily represent those of their affiliated organizations, or those of the publisher, the editors and the reviewers. Any product that may be evaluated in this article or claim that may be made by its manufacturer is not guaranteed or endorsed by the publisher.
Research integrity at Frontiers
Learn more about the work of our research integrity team to safeguard the quality of each article we publish.