 Zeyu Ma1
 Hongyi Li
 Min Liu
- 1School of Geophysics and Information Technology, China University of Geosciences (Beijing), Beijing, China
- 2Network Information Center, China University of Geosciences (Beijing), Beijing, China
- 3National Institute of Natural Hazards, Beijing, China
In this paper, we combine the U-net-based phase picking method (PhaseNet) with Graphics Processing Unit-Based Match and Locate technology (GPU-M&L) and a deep-learning-based seismic signal de-noising method (DeepDenoiser) as a workflow for automatically extracting micro-seismic information from continuous raw seismic data. PhaseNet is first used to detect missed seismic phases by scanning through the 5-year continuous waveform data recorded at five broad-band stations in Hainan province. Then Rapid Earthquake Association and Location method (REAL), VELEST program (1-D inversion of velocities and hypocenter locating) and HypoDD (a double-difference locating method) are applied to associate seismic phases with events and to locate, respectively. This initially established catalogue can be served as the template for the following match-filter work. We choose events with a high signal-to-noise ratio (SNR) as templates and apply GPU-M&L to detect more small earthquakes which are difficult to pick by routine methods due to the low SNR. Then, a deep learning-based noise reduction technique named DeepDenoiser is applied to extract seismic signal from noise to provide a better picking of arrival time and then to improve the relocation effects. Finally, we use HypoDD to relocate these events with P- and S- wave arrival times picked by PhaseNet. Compared with the five events listed in the China Earthquake Networks Center routine catalogue, in this study, we detect and locate 977 earthquakes by following the above procedure. Our relocation results illustrate quite a complex distribution pattern of events due to the complicated fault system in the northeastern part of Hainan Province.
1 Introduction
The identification and location of small earthquakes play a key role in studying the nucleation of large earthquakes, the geometry of fault zones, the monitoring of tremors, low-frequency earthquakes, and micro-earthquakes caused by hydraulic fracturing. However, how to quickly extract small earthquake information from the massive raw continuous waveform data still poses a challenge to seismologists. The traditional phase-picking method is not sufficiently competent in detecting low-magnitude events due to the low signal-to-noise ratio (SNR). In recent years, various techniques for microearthquake detection and phase picking have been proposed, and they can be generally sorted into two main categories: waveform based and pick-based seismic detection.
The operation principle of waveform-based seismic detection is to scan continuous waveforms based on earthquake waveform similarity for finding missing seismic events. For earthquakes with similar focal mechanisms that occurred in adjacent areas, their waveforms show a high degree of similarity. Therefore, using identified seismic events a priori as the templates to scan over the continuous waveforms can effectively detect events with low SNR. Matching filter technology (MFT) based on waveform cross-correlation and stacking (Gibbons et al., 2006; Shelly David et al., 2007; Peng and Zhao, 2009), has been proposed and then widely used to detect low-magnitude seismic events. Shelly David et al., 2007 used MFT to detect non-volcanic tremor and low-frequency earthquake swarms and their results reveal the deep structure of seismogenic faults. Meng et al. (2013) applied the MFT method to the 2003 San Simeon earthquake, focusing on aftershock-triggering mechanisms and discussed the subsequent screening principle of the MFT detection events. This technique can detect more seismic events compared with conventional methods, however, its detection performance significantly depends on seismic template events.
In recent years, machine learning, especially deep learning, has been widely used in various scientific fields and has shown great efficiency (Ross et al., 2018; Bergen et al., 2019; Kong et al., 2019; Reichstein et al., 2019; Zhang et al., 2019; Zhou et al., 2019; Zhu and Beroza., 2019; Zhang et al., 2022; Mousavi and Beroza, 2022). Seismologists also apply the deep learning algorithm to the research of earthquake such as event identification, association, and classification. Compared with traditional calculation methods, the deep learning method has the advantages of high efficiency and time and labour saving. Machine learning builds a neural network through a large number of samples, either labelled or not.
Using the deep learning algorithm to identify and associate earthquake phases through the raw continuous waveforms, and then using the MFT algorithm to scan missing events recently has become a highly recognized workflow. Liu et al. (2020a) first combined MFT with deep learning phase-picking methods to construct a high-precision seismic catalogue of the 2019 Ridgecrest earthquake sequence. Zhang et al. (2022) integrated this set of methods into an automatic and pervasive end-to-end workflow (LOC-FLOW). Zhou et al. (2021) have proposed a similar automatic and systematic workflow, PALM, which is also based on different machine learning methods and MFT.
However, both machine learning and MFT techniques may produce false detections since the criteria of picking are based on probability value or cross-correlation threshold which are artificially set and may not be optimal in specific problems. In this study, we propose a new workflow which combines PhaseNet with GPU-M&L technology and DeepDenoiser to extract seismic event signals from continuous raw data. PhaseNet is first used to detect event signals by scanning through raw continuous data . The REAL (Zhang et al., 2019), VELEST (Kissling et al., 1995) and HypoDD (Waldhauser and Ellsworth, 2000) are applied to associate seismic phases with events and locate events, respectively. We select events with a high SNR as templates from the initial catalogue constructed by following the above procedure and apply the GPU-M&L to detect more small earthquakes which are difficult to detect by traditional methods. Then, DeepDenoiser is applied to further confirm the detection of seismic events and simultaneously to provide a better phase picking. Finally, HypoDD is utilized again to relocate these events.
In 1,605, an earthquake of magnitude 7.5 occurred near Haikou in the northeastern part of Hainan Province. This earthquake occurred near the east-west Maniao-Puqian fault system (MPF) and the NNW-trending Puqian-Qinglan fault system (PQF) which are both composed of several faults as shown in Figure 1. These two faults were very active in the Quaternary and controlled the development of the Cenozoic basin and the extent of Quaternary volcanism up to at least the Late Pleistocene (Wang, et al., 2021). The crustal movement in this area has been characterized by strong vertical rise and fall since the Neogene. Uneven subsidence under the control of the NNW trending faults has led to the formation of graben-horst structures. The MPF is a system of deeply extended faults that runs nearly east-west and has been active since the late Cenozoic. The MPF is cut by several NNW-oriented faults, including hidden and exposed faults. Based on the results of gravity measurements and seismic surveys, the faults in the PQF spread horizontally in parallel, in a complex graben-horst configuration. The seismicity of this fault system is weak in the south and strong in the north (Wang et al., 2021). Studying the long-term seismicity of these two faults and their surrounding area can help provide a data basis for analyzing the seismogenic mechanism and tectonic environment of the 1,605 Haikou paleo earthquake.
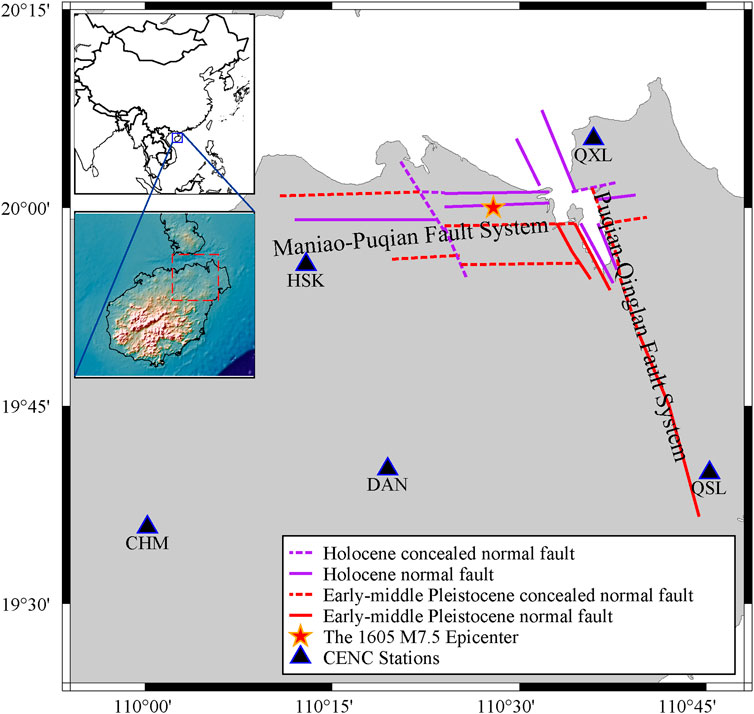
FIGURE 1. Map of the study area and fault systems. The insets in the upper left corner show the study area on a large map of Hainan Province and of China.
Based on the results of previous imaging of the subsurface structure in the area, there is a clearly tilted low-velocity anomaly in the crust. This low-velocity anomaly may be associated with the magma and fluids which have a deep root connected with the mantle plume (Lei et al., 2009; Lin et al., 2022). The study of seismic activity in this area will also provide a basis for studying the Hainan hotspot.
In this study, we apply our proposed new workflow to northeast Hainan to study the complex fault system by detecting the seismicity from 2014 to 2018.
2 Methods
The three-component continuous waveform data from January 2014 to December 2018 with a 100 Hz sampling rate recorded by 5 stations are provided by Hainan Earthquake Administration. Only 5 earthquake events are provided from the CENC catalogue around the fault zone area within 5 years.
Firstly we use PhaseNet, an algorithm for identifying seismic phases based on deep learning, to pick up P- and S- phase signals. Secondly, based on the arrival of seismic phases, we use the REAL algorithm to associate them as seismic events. Thirdly, we use the absolute location method VELEST and the double-difference relative location algorithm HypoDD to locate events. Fourthly, we apply GPU-M&L which introduces a weighting factor of SNR on different traces of waveforms, to calculate the cross-correlation coefficient between each template with the 5-year continuous waveform. Fifthly, we use DeepDenoiser, a deep learning denoise algorithm to extract the noise from the signal to further confirm detections. Finally, we use HypoDD again to relocate all the remained earthquakes. The complete workflow is demonstrated in Figure 2 and the principles and technical details of the methods are described.
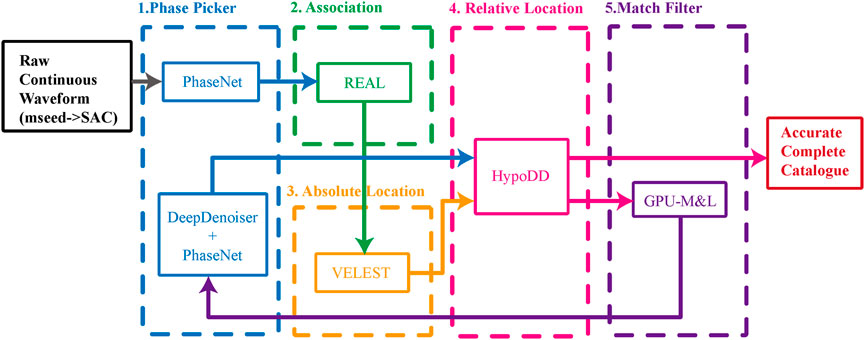
FIGURE 2. Schematic diagram of the workflow.
The phase-picking method based on deep learning - PhaseNet uses a large number of manually labelled seismic waveforms as its training set, providing a model that can label P- and S-wave arrivals with probability peaks. Considering the lack of a large number of seismic events in the Hainan region as training samples for transfer learning, we used the North California model trained by Zhu et al. (2019). This model has been widely applied to different countries and regions and has shown good results. Yen et al. (2021) applied PhaseNet with this model to build a high-resolution catalogue for the central Italy seismic sequence. Li et al. (2023) applied this model in Northeastern China to build a complete small earthquake catalogue to study the Magmatic system and seismicity of the Arxan volcanic group.
The continuous seismic waveform is rearranged as two groups with 15-second-interval and 30-second-long (i.e. 3,000 data points) windows for scanning. Before scanning, to optimize the scanning results and better apply the model, all the original seismic waveforms were temporally normalized without filtering or changing the sampling rate.
It is worth mentioning that we usually set a selection criterion for PhaseNet, which is called the threshold of probability. But this threshold itself does not represent the true positive detection possibility. We regard it as the degree of similarity between the actual processed data and the training set.
The Rapid Earthquake Association and Location technology (REAL) can be used to associate seismic phases and locate seismic events quickly and automatically. Combining the advantages of arrival time picking and waveform-based detection and location methods, the REAL method associates the arrival times of one event from different stations and determines the epicenters by calculating the number of P-wave and S-wave arrival times and travel time residuals.
Based on continuous waveform data recorded by 5 stations in northeast Hainan Province, we used the REAL method to perform association and preliminary location Considering that the 5 fixed stations have a wide distribution range and the average distance between stations is more than 50 km, when at least 5P and 3S phases of a certain earthquake have been recorded, respectively, they will be associated as an event. VELEST, an absolute locating method based on a 1D velocity model and HypoDD, a double-difference locating method were applied to the REAL results to refine the location. VELEST can give an updated 1D velocity model by iteration. Our initial model incorporates previous tomography studies (Lei et al., 2009; Huang, 2014) in the Hainan region and this 1D model is further updated using VELEST to provide better-locating results.
The M&L technology developed by Zhang and Wen. (2015) can give the locations of the events while running the template cross-correlation scanning. While the waveform is being slide-scanned, M&L will search the gridded 3D space in the limited detection area. At each potential position, the travel time difference will be calculated to revise the superimposition result of the cross-correlation waveform. On this basis, Liu et al. (2019) optimized the original M&L program and parallelized processing based on GPU acceleration. The difference between GPU-M&L and M&L is 1) to add a weight factor to each component of the template to improve the detection ability; 2) to implement the M&L method on the GPU to speed up the calculation. The data-trace with a high signal-to-noise ratio will be given higher weight in the step of cross-correlation and superposition.
The operation of the MFT requires that a template is provided and its sensitivity is also highly dependent on the consistency of the waveform between the template and the event to be detected. The application of PhaseNet and REAL to the original waveform can supplement template events for the template matching method, thereby improving the ability to detect missing small earthquake events. In this study, in addition to the earthquake catalogue provided by the Hainan Earthquake Administration, the earthquakes detected by the PhaseNet and REAL methods were also screened and supplemented as template events to improve the detection capabilities of GPU-M&L.
DeepDenoiser is a seismic signal de-noising program developed by Zhu et al. (2019) based on a convolution neural network. After the training of a large number of samples, this program shows good de-noising ability and can perform well in many cases with a low signal-to-noise ratio. DeepDenoiser identifies the time-spectrum image of the input window signal, suppresses the signal which is considered as noise and provides a lossless effective seismic signal. In addition, the event phases after DeepDenoiser are easier to be picked by PhaseNet, so we use PhaseNet to re-mark the de-noised events again. This can provide more accurate and reliable arrival information for event relocation. It is worth mentioning that in previous studies, deep-learning-based frequency-domain seismic signal de-noising usually follows training using specific data (Saad and Chen, 2021; Dahmen et al., 2022; Dong et al., 2022; Yang et al., 2022). The re-trained models have better noise reduction for the data in the specific regions. In our case, we directly use the DeepDenoiser with the North California model without re-training because of the insufficiency of the seismic event data. Since the noise statistics are automatically learned from the data without any assumptions (Zhu et al., 2019), DeepDenoiser can correctly handle various noise signals, hence providing a generalization in the data from different area. It is still recommended to use fine-tuning and re-training models for denoising when sufficient data is available.
3 Results
We applied PhaseNet to scan the 5-year continuous waveforms from 2014 to 2018 at 5 stations in northeast Hainan province to pick the seismic phases. PhaseNet effectively detected the P-wave and S-wave phases in continuous seismic data as shown in Figure 3.
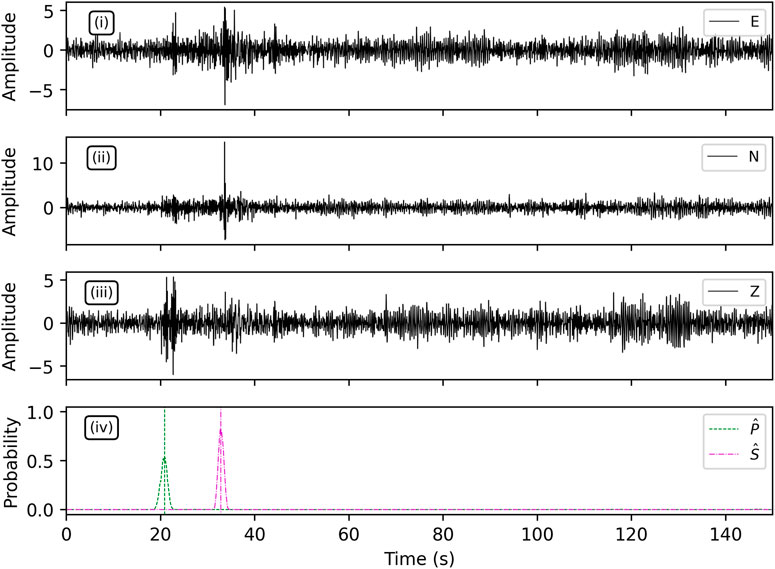
FIGURE 3. PhaseNet picking diagrams showing a new detected event with picked P (green) and S (purple) phases.
To make the data more suitable for the trained neural network parameter model, we applied the Z-score to normalize the data. The data are rearranged as two groups with 15-second-interval and 30-second-long (i.e. 3,000 data points) windows for scanning. From all continuous waveforms, a total of about 102P-wave and 60 S-wave arrivals have been detected.
The REAL earthquake association and the initial location are then calculated by grid search based on the travel time residual (Zhang et al., 2019). In this study, the horizontal direction of the search area is set to 0.4 × 0.4°with grid size of 0.02 × 0.02, and the depth ranges from 0 to 20 km with a grid size of 2 km. The grid centre is located at the station. Only events associated with over 3P-phases and over 5P- or S- phases will be retained, The selection criterion depends on the number of stations and the quality of the data. Their location will be initially determined on the grid with the largest number of phases. When there are the most identical choices, the grid with the smallest travel time will be selected. Then the absolute locating algorithm VELEST and double-difference relocation method HypoDD is applied to refine the location results.
In the study area, a total of 9 events were scanned and successfully associated. These events include all 5 events recorded in the routine catalogue provided by CENC. 7 of the events detected by the workflow with high SNR and clear phase, whose magnitudes range from 2.3 to 3.4 were relocated and used as template events. The determination of the magnitude of the detected events is calculated based on the widely used relationship between amplitude and local magnitude (Hutton and Boore, 1987).
We then applied the GPU-M&L to the continuous waveform data recorded by the five stations QSL, QXL, DAN, CHM and HSK around the fault. To improve the effect of the template matching process and the reliability of the processing results again, we make certain pre-processing for the waveforms of the continuous waveform and the template event, which includes down-sampling to 20 Hz, de-meaning, de-linearizing trend and filtering to 1–10 Hz. In addition, for the template events, the arrival time information of the P-wave and S-wave is given by the phase information picked up by PhaseNet. Based on this time information marking, the signal-to-noise ratio of each component of the template event is calculated. The data with high SNR are attached to higher weighting factors in the step of template matching, cross-correlation and stacking.
1,450 events have been detected by GPU-M&L with a magnitude larger than −1.0. The events with a weighted average cross-correlation coefficient greater than a threshold are selected as positive detection. Figure 4 shows a schematic diagram of cross-correlation threshold selection.
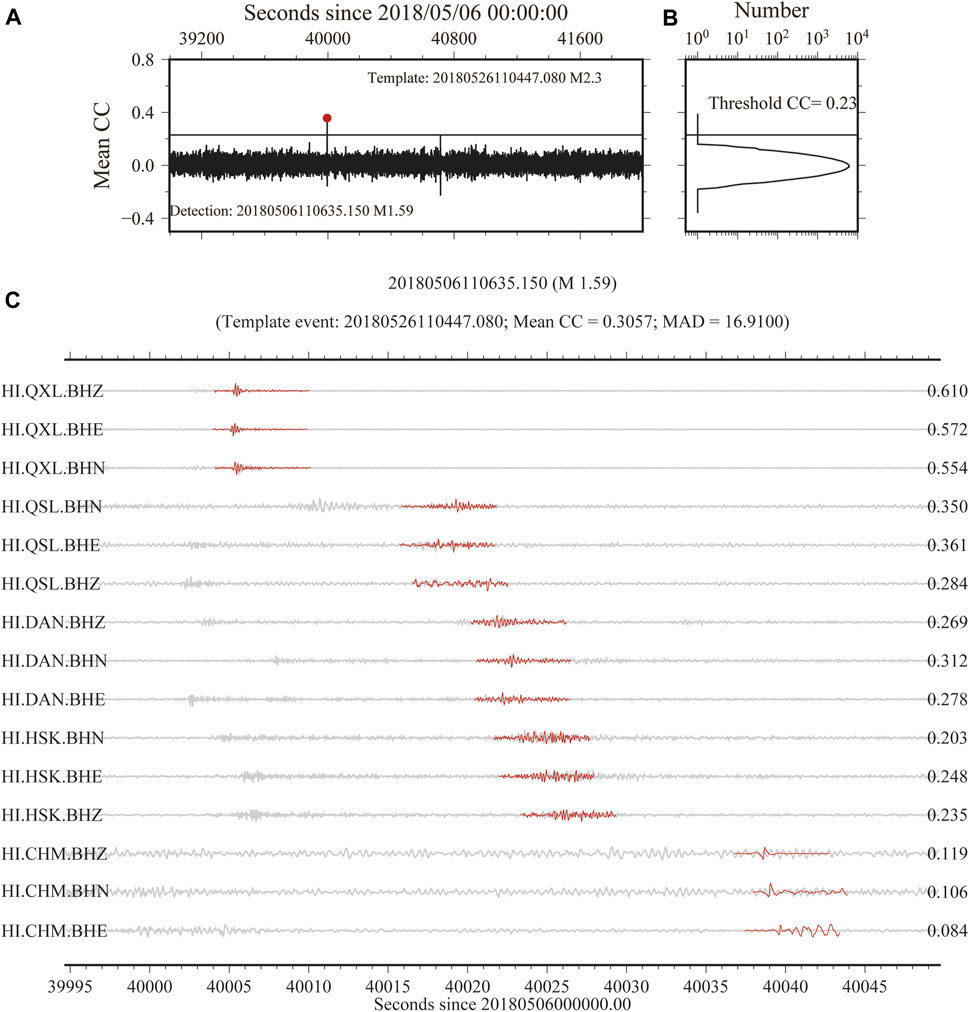
FIGURE 4. An example of template matching scan result. (A). Correlation function for template event with a 3,000-s continuous waveform. (B). A histogram of average correlation values is shown. (C). Continuous waveforms are shown in grey and template event waveforms are in red for each component of 5 CENC stations.
We first use the conventional Tau-P calculated theoretical arriving time to mark the P- and S- phases on event files. Then we apply DeepDenoiser to extract seismic signals. After that, we update the P- and S- marks with the arrival times provided by PhaseNet (Figure 5). Figure 6 shows the time-magnitude diagram of all the events scanned by GPU-M&L and those further confirmed with DeepDenoiser and PhaseNet.
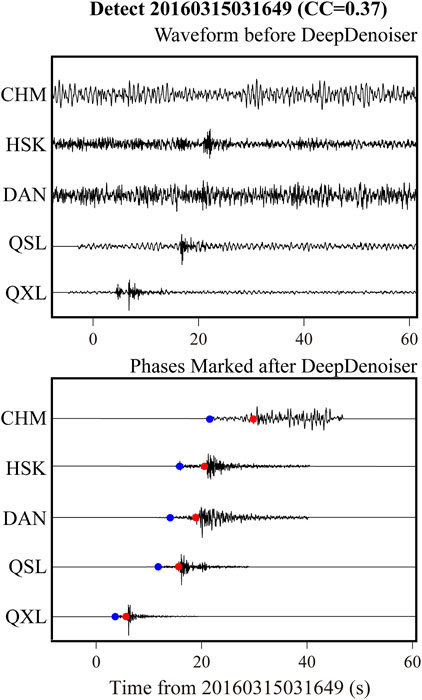
FIGURE 5. An event detected with a CC of 0.37. The arrival time has been revised by DeepDenoiser and Phasenet and the waveform signal is much clearer after de-noising.
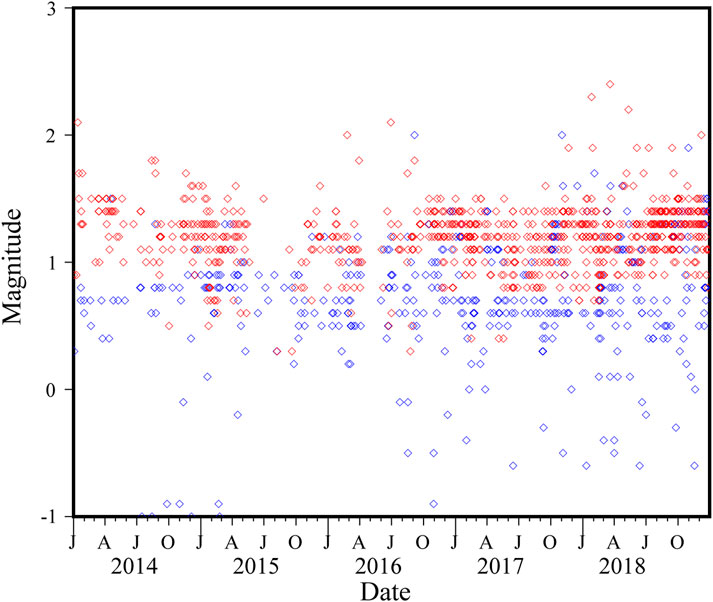
FIGURE 6. Time-magnitude diagram of all the events detected by GPU-M&L (blue) and those confirmed with DeepDenoiser and PhaseNet (red).
Then we use HypoDD to constrain and relocate events. In the HypoDD algorithm, we set the weights of the arrival of P waves and S waves as 1.0 and 0.5, respectively. A catalogue of 977 events is finally confirmed with a reliable location. Figure 7 shows the final relocation results of events. A large number of small earthquakes were detected along the boundary of the MPF and PQF zones. 228 out of 977 (23.34%) events of the catalogue are detected by the new template events by PhaseNet. They also fill a large portion of the seismic catalog spatially, providing a big database to delineate the fault feature.

FIGURE 7. Final relocation result of microseismic events. The colour of the circles represents the source depth. And the size of the circles is proportional to the magnitude.
The three-dimensional relocation results of the final complete catalogue show a complex geometry. As we can see, both MPF and PQF are composed of a series of parallel or oblique secondary faults with similar inclinations. We notice that there are inclination differences between the deep and shallow events. Combined with the historical seismic observation records (Wang et al., 2021), it can be inferred that the fault strike in the deep part of the PQF is inconsistent with the shallow part, and it is closer to the north-south direction in the deep. The fault zones in the study area are heterogeneous in seismicity accompanied by complex fault subsidence activity.
4 Discussion and conclusion
A key issue of automated small earthquake identification and detection technology based on machine learning and template matching is how to evaluate its accuracy. The identification performance of MFT for small earthquakes is powerful, but how to ensure that detected events are earthquake events is very important. Most of the constraints on detected events in the past work are limited to the setting of the cross-correlation coefficient threshold and the absolute median deviation threshold. A sufficiently high threshold usually represents higher detection reliability. However, on the other hand, it also means probably more events will be missed due to the high threshold. For different research areas and research purposes, the setting of this threshold is different. Different cross-correlation coefficient thresholds and MAD thresholds have been used in numerous previous works on MFT (Gibbons et al., 2006; Shelly David et al., 2007; Peng and Zhao, 2009; Meng et al., 2013; Liu et al., 2020b; Zhang et al., 2022; Zhou et al., 2021). These adjustments were derived from the experience of the data processors and feedback on the evaluation of the results. This has led to difficulties in establishing a systematic workflow and selecting criteria for specific research questions in specific regions. There have been some previous studies on the confirmation of the accuracy of the template matching results. Liu et al. (2019) used the methods of waveform envelope and spectrum analysis to preliminarily evaluate the robustness of event detection over a period of time. In our research, we used the DeepDenoiser method to de-noise and the PhaseNet method to re-mark, combined with the location process, to finally determine all the detection events. It seems that there is no evidence that events with higher cross-correlation values have higher credibility. The cross-correlation value only makes a certain degree of mathematical judgment on the similarity of signals. Higher than a certain cross-correlation threshold can only indicate that the event is similar to the template event to some extent, instead of proving that the event is more like an earthquake. We found a few false events with high cross-correlation values—many of which are just pulse-shaped noise. This requires us to be vigilant when using technologies like MFT. We still need to consider the application scenarios of various technologies and optimize them.
The mechanism of the Qiongshan M7.5 earthquake and the environment for the formation of the structure has always been a concern of scientists. According to Wang et al. (2021), this paleoseismic event influenced the terrestrial subsidence in northeastern Hainan, which is mainly controlled by the MPF and PQF systems. The tectonic activity of subsidence in this region is heterogeneous, characterized by significant differential lifting and subsidence. Our results show that the spatial distribution of small earthquakes is strongly correlated with these two faults and their secondary branches. As we have seen from our relocation, the network of conjugate faults consisting of the MPF and PQF zones plays a crucial role in the seismic activity which leads to a complex distribution of small earthquakes without a typical linear trend. In addition, the rise of these faults constitute a graben-horst structure, which also makes the distribution of small earthquakes have no dominant focal depth. Earthquakes that occurred on the MPF indicate that the fault system is more active in the eastern section which is influenced by the intersection with the PQF.
Lei et al. (2009) discussed in detail the effects of hot spots on Hainan Island and mantle plume activities. According to the previous subsurface velocity structure tomography (Huang, 2014; Lei et al., 2019; Lin et al., 2022) in the Hainan area, low-velocity anomalies are distributed from the lower mantle to the crust in this area, which is inferred to be related to the mantle plume. As seen in Figure 8, there is a gap zone of small earthquakes along the PQF in the range of 10–20 km. As given in Figure 7, there is a strike difference in the linear distribution of small earthquakes between the deep and shallow parts, that is, the small earthquakes in the deep part (red circles) tend to occur more in the north-south direction. We infer that may be related to fluids which could influence the tectonic activity in this area.

FIGURE 8. Final 3D relocation results of 977 events. The red dash lines indicate the distribution of the fault system. (A, C) and (B, D) have different viewpoints of the location results. In (C) and (D), grey dashed lines are used to indicate the fault position and the dip angles inferred from the fault surface locations and the distribution of the detected events.
In summary, this study proposes a systematic and automated small earthquake detection and location workflow. We introduce DeepDenoiser into the workflow to improve the reliability of detection which has not been addressed in traditional MFT and machine learning methods for identifying small earthquakes. We applied this method to a set of fault zones in Hainan, and by scanning with only 7 templates we finalized a catalogue of 977 events over a 5-year period. These earthquakes are generally distributed along the strike direction of the MPF and PQF, meanwhile also exhibit some much smaller branch faults which reveal a complex multiple conjugate fault system beneath the study area.
Data availability statement
The raw data is involved with a confidentiality agreement. Requests to access the datasets should be directed to Zeyu Ma, bWF6eUBjdWdiLmVkdS5jbg==.
Author contributions
ZM: data curation, methodology, data analysis, visualization and writing; HL: methodoogy, draft review and editing; ML: methodology, software, draft review and editing; YH: methodology, software; SZ: software and data curation; YL: methodoogy and validation.
Funding
This research is co-supported by National Key R&D Program (2022YFF0800701), the National Natural Science Foundation of China (41874063), and Beijing Natural Science Foundation No.8212041.
Acknowledgments
Thanks to the Hainan Earthquake Administration for providing the earthquake catalogue and seismic waveform data. The maps in our paper were made by the Generic Mapping Tools (Wessel et al., 2013) and the Matplotlib (Hunter, 2007). The series of programs we use are open-source by their authors. PhaseNet: https://doi.org/10.1093/gji/ggy423; REAL: https://doi.org/10.1785/0220190052; VELEST: https://www.researchgate.net/publication/240394087_VELEST_user%27%27s_guide-short_introduction; HypoDD: https://doi.org/10.7916/D8SN072H; GPU-M&L: https://doi.org/10.1785/0220190241; DeepDenoiser: https://doi.org/10.1109/TGRS.2019.2926772.
Conflict of interest
The authors declare that the research was conducted in the absence of any commercial or financial relationships that could be construed as a potential conflict of interest.
Publisher’s note
All claims expressed in this article are solely those of the authors and do not necessarily represent those of their affiliated organizations, or those of the publisher, the editors and the reviewers. Any product that may be evaluated in this article, or claim that may be made by its manufacturer, is not guaranteed or endorsed by the publisher.
References
Bergen, K. J., Johnson, P. A., de Hoop, M. V., and Beroza, G. C. (2019). Machine learning for data-driven discovery in solid Earth geoscience. Science 363 (6433), eaau0323. doi:10.1126/science.aau0323
Dahmen, N. L., Clinton, J. F., Meier, M. A., Stähler, S. C., Ceylan, S., Kim, D., et al. (2022). MarsQuakeNet: A more complete marsquake catalog obtained by deep learning techniques. J. Geophys. Res. Planets 127 (11), 7503. doi:10.1029/2022JE007503
Dong, X., Lin, J., Lu, S., Huang, X., Wang, H., and Li, Y. (2022). Seismic shot gather denoising by using a supervised-deep-learning method with weak dependence on real noise data: A solution to the lack of real noise data. Surv. Geophys 43, 1363–1394. doi:10.1007/s10712-022-09702-7
Gibbons, S. J., and Ringdal, F. (2006). The detection of low magnitude seismic events using array-based waveform correlation. Geophysical Journal International 165 (1), 149–166. doi:10.1111/j.1365-246X.2006.02865.x
Huang, J. (2014). P-and S-wave tomography of the Hainan and surrounding regions: Insight into the Hainan plume. Tectonophysics 633, 176–192. doi:10.1016/j.tecto.2014.07.007
Hunter, J. D. (2007). Matplotlib: A 2D graphics environment. Computing in science and engineering 9 (3), 90–95. doi:10.1109/MCSE.2007.55
Hutton, L., and Boore, D. M. (1987). The ML scale in Southern California. Bull. Seismol. Soc. Am. 77 (6), 2074–2094. doi:10.1785/bssa0770062074
Kissling, E., Kradolfer, U., and Maurer, H. (1995). Program VELEST user’s guide-Short Introduction. ETH Zurich: Institute of Geophysics.
Kong, Q., Trugman, D. T., Ross, Z. E., Bianco, M. J., Meade, B. J., and Gerstoft, P. (2019). Machine learning in seismology: Turning data into insights. Seismological Research Letters 90 (1), 3–14. doi:10.1785/0220180259
Lei, J., Zhao, D., Steinberger, B., Wu, B., Shen, F., and Li, Z. (2009). New seismic constraints on the upper mantle structure of the Hainan plume. Phys. Earth Planet. Interiors 173 (1-2), 33–50. doi:10.1016/j.pepi.2008.10.013
Li, J., Tian, Y., Zhao, D., Yan, D., Li, Z., and Li, H. (2023). Magmatic system and seismicity of the Arxan volcanic group in Northeast China. Geophys. Res. Lett. 50, e2022GL101105. doi:10.1029/2022GL101105
Lin, J., Xia, S., Wang, X., Zhao, D., and Wang, D. (2022). Seismogenic crustal structure affected by the Hainan mantle plume. Gondwana Res. 103, 23–36. doi:10.1016/j.gr.2021.10.029
Liu, M., Li, H., Peng, Z., Ouyang, L., Ma, Y., Ma, J., et al. (2019). Spatial-temporal distribution of early aftershocks following the 2016 Ms 6.4 Menyuan, Qinghai, China Earthquake. Tectonophysics Vol. 766, 469–479. doi:10.1016/j.tecto.2019.06.022
Liu, M., Li, H., Zhang, M., and Wang, T. (2020b). Graphics processing unit-based match and locate (GPU-M&L): An improved match and locate method and its application. Seismol. Res. Lett. 91 (2A), 1019–1029. doi:10.1785/0220190241
Liu, M., Zhang, M., Zhu, W., Ellsworth, W. L., and Li, H. (2020a). Rapid characterization of the July 2019 Ridgecrest, California, earthquake sequence from raw seismic data using machine-learning phase picker. Geophys. Res. Lett. 47, e2019GL086189. doi:10.1029/2019gl086189
Meng, X., Peng, Z., and Hardebeck, J. L. (2013). Seismicity around parkfield correlates with static shear stress changes following the 2003M<sub>w</sub>6.5 san Simeon earthquake: Stress shadow near parkfield. J. Geophys. Res. solid earth 118, 3576–3591. doi:10.1002/jgrb.50271
Mousavi, S. M., and Beroza, G. C. (2022). Deep-learning seismology. Science 377 (6607), eabm4470. doi:10.1126/science.abm4470
Peng, Z., and Zhao, P. (2009). Migration of early aftershocks following the 2004 Parkfield earthquake. Nat. Geosci. 2 (12), 877–881. doi:10.1038/ngeo697
Reichstein, M., Camps-Valls, G., Stevens, B., Jung, M., Denzler, J., Carvalhais, N., et al. (2019). Deep learning and process understanding for data-driven Earth system science. Nature 566 (7743), 195–204. doi:10.1038/s41586-019-0912-1
Ross, Z. E., Meier, M., and Hauksson, E. (2018). P-wave arrival picking and first-motion polarity determination with deep learning. J. Geophys. Res. 123 (6), 5120–5129. doi:10.1029/2017jb015251
Saad, O. M., and Chen, Y. (2021). A fully unsupervised and highly generalized deep learning approach for random noise suppression. Geophys Prospect 69 (4), 709–726. doi:10.1111/1365-2478.13062
Shelly David, R., Beroza, G. C., and Ide, S. (2007). Non-volcanic tremor and low-frequency earthquake swarms. Nature 446 (7133), 305–307. doi:10.1038/nature05666
Waldhauser, F., and Ellsworth, W. L. (2000). A double-difference earthquake location algorithm: Method and application to the northern hayward fault, California. Bull. Seism. Soc. Am. 90, 1353–1368. doi:10.1785/0120000006
Wang, C., Jia, L., Hu, D., Zhang, S., and Chen, J. (2021). miR-30b-5p inhibits proliferation, invasion, and migration of papillary thyroid cancer by targeting GALNT7 via the EGFR/PI3K/AKT pathway. Geol. China 48 (2), 618–631. doi:10.1186/s12935-021-02323-x
Wessel, P., Smith, W. H., Scharroo, R., Luis, J., and Wobbe, F. (2013). Generic mapping tools: improved version released. Eos, Transactions American Geophysical Union 94 (45), 409–410. doi:10.1002/2013EO450001
Yang, L., Liu, X., Zhu, W., Zhao, L., and Beroza, G. C. (2022). Toward improved urban earthquake monitoring through deep-learning-based noise suppression. Sci. Adv. 8 (15), eabl3564–10. doi:10.1126/sciadv.abl3564
Yen, F., William, L., Ellsworth, W. L., Zhang, M., Zhu, W., Michele, M., et al. (2021). Machine-learning-based high-resolution earthquake catalog reveals how complex fault structures were activated during the 2016–2017 central Italy sequence, Seismic Rec. 1 (1), 11–19. doi:10.1785/0320210001
Zhang, M., Ellsworth, W. L., and Beroza, G. C. (2019). Rapid earthquake association and location. Seismol. Res. Lett. 90 (6), 2276–2284. doi:10.1785/0220190052
Zhang, M., Liu, M., Feng, T., Wang, R., and Zhu, W. (2022a). LOC-FLOW: An end-to-end machine learning-based high-precision earthquake location workflow. Seismol. Soc. Am. 93 (5), 2426–2438. doi:10.1785/0220220019
Zhang, M., and Wen, L. (2015). An effective method for small event detection: Match and locate (M&L). Geophys. J. Int. 200, 1523–1537. doi:10.1093/gji/ggu466
Zhang, Q., Zhang, W., Wu, X., Zhang, J., Kuang, W., and Si, X. (2022b). Deep learning for efficient microseismic location using source migration-based imaging. J. Geophys. Res. Solid Earth 127, e2021JB022649. doi:10.1029/2021jb022649
Zhou, Y., Ghosh, A., Fang, L., Yue, H., Zhou, S., and Su, Y. (2021). A high-resolution seismic catalog for the 2021 MS6.4/MW6.1 Yangbi earthquake sequence, Yunnan,China: Application of AI picker and matched filter. Earthq. Sci. 34 (5), 390–398. doi:10.29382/eqs-2021-0031
Zhou, Y., Yue, H., Kong, Q., and Zhou, S. (2019). Hybrid event detection and phase-picking algorithm using convolutional and recurrent neural networks. Seismol. Res. Lett. 90 (3), 1079–1087. doi:10.1785/0220180319
Zhu, L., Peng, Z., McClellan, J., Li, C., Yao, D., Li, Z., et al. (2019a). Deep learning for seismic phase detection and picking in the aftershock zone of 2008 M7.9 Wenchuan Earthquake. Phys. Earth Planet. Interiors 293, 106261. doi:10.1016/j.pepi.2019.05.004
Zhu, W., and Beroza, G. C. (2019). PhaseNet: A deep-neural-network-based seismic arrival-time picking method. Geophys. J. Interna- tional 216 (1), 261–273.
Keywords: seismicity and tectonics, machine learning, seismic signal denoising, phase picking, Hainan (China), fault monitoring and diagnosis
Citation: Ma Z, Li H, Liu M, Huang Y, Zhang S and Lv Y (2023) Micro-seismic events detection and its tectonic implications in Northeastern Hainan Province. Front. Earth Sci. 11:1169877. doi: 10.3389/feart.2023.1169877
Received: 20 February 2023; Accepted: 11 April 2023;
Published: 09 May 2023.
Edited by:
Fuqiong Huang, China Earthquake Networks Center, ChinaReviewed by:
Zhuowei Xiao, Chinese Academy of Sciences, ChinaChengxin Jiang, Australian National University, Australia
Copyright © 2023 Ma, Li, Liu, Huang, Zhang and Lv. This is an open-access article distributed under the terms of the Creative Commons Attribution License (CC BY). The use, distribution or reproduction in other forums is permitted, provided the original author(s) and the copyright owner(s) are credited and that the original publication in this journal is cited, in accordance with accepted academic practice. No use, distribution or reproduction is permitted which does not comply with these terms.
*Correspondence: Hongyi Li, bGloQGN1Z2IuZWR1LmNu