 Xiaobin Li1,2,3
 Haoteng Wang
- 1School of Civil Engineering, Chongqing University, Chongqing, China
- 2Qinghai Traffic Construction Management Co., Ltd., Xining, China
- 3Qinghai Xihu Expressway Management Co., Ltd., Xining, China
- 4State Key Laboratory of Eco-hydraulics in Northwest Arid Region, Xi’an University of Technology, Xi’an, China
- 5School of Highway, Chang’an University, Xi’an, China
In deep rock engineering, evaluating the likelihood of rock burst is imperative to ensure safety. This study proposes a new metric, the post-peak dissipated energy index, which accounts for strain rate and size effects in assessment of the rock burst proneness of a rock mass. To investigate rock burst proneness, conventional compression tests were conducted on limestone and slate samples with different length to diameter (L/D) ratios (ranging from 0.3 to 1.5) at four different strain rates (0.005, 0.01, 0.5, and 1.0 s−1). Based on the testing observations, the actual rock burst proneness was classified into three categories (no risk, low risk, and high risk). A new criterion was also established using the post-peak dissipated energy index, which is the ratio of elastic energy to total dissipated energy. The impact of the strain rate and L/D ratio on rock burst proneness was analyzed. The results indicated that increased strain rates cause a strong hardening effect, leading to staged growth of rock burst proneness. However, the rock burst proneness decreases non-linearly with the increasing L/D ratio. The accuracy of the proposed criterion was validated by comparison with existing criteria, demonstrating that the energy-based index ensures a reliable evaluation of the rock burst proneness of a rock mass. The proposed method has excellent potential for practical application in deep rock engineering.
1 Introduction
Rock burst is a potential disaster that poses a significant threat to deep rock excavation and mining operations (Cook, 1976; Wang and Park, 2001; Sousa et al., 2017; Keneti and Sainsbury, 2018; Wojtecki et al., 2021; Wang et al., 2022a; Yang et al., 2022a; Wang et al., 2022b; Yang et al., 2022b). This dangerous occurrence is characterized by the high-speed ejection of rock fragments accompanied by loud cracking sounds (Kaiser and Cai, 2012; Li et al., 2021a; Li et al., 2021b; Liu et al., 2022). As ground stress increases and environmental complexity intensifies, the likelihood and impact of rock bursts also rise (Li et al., 2012; Gale, 2018). To ensure mining efficiency and safety, it is necessary to study the prediction of rock burst (Singh, 1989; Cai et al., 2022; Liu et al., 2023). Typically, rock burst proneness is regarded as a prerequisite for determining the likelihood of rock burst (Feng et al., 2015; Liu S M et al., 2020). Various criteria have been proposed to assess rock burst proneness, based on factors such as strength, deformation modulus, energy, acoustic emission, and failure characteristics (Kidybiński, 1981; Singh, 1988; Zhang et al., 2009; He et al., 2015; Khosravi and Simon, 2018; Malan and Napier, 2018; Dai et al., 2019; Gong et al., 2019; Yang et al., 2020a; Gong et al., 2020; Liu S M et al., 2020; Gong et al., 2021; Liu et al., 2022). However, the essence of rock burst is the rapid release of stored elastic strain energy (Kidybiński, 1981; Singh, 1988; Konicek and Waclawik, 2018; Dai et al., 2019), making criteria based on energy parameters particularly meaningful for determining rock burst proneness. Examples of such criteria include the stored energy index Wet (Kidybiński, 1981) and the modified bursting energy index
Considerable progress has been made in investigating the process and mechanism of rock burst from the perspective of stress path and unloading effect (He et al., 2023). However, the size of the rock has a significant impact on rock burst proneness, due to the mechanical properties and spatial structural characteristics of rock (Ai et al., 2016). The laboratory method considers the structural characteristics of a rock mass as the size of the rock sample, and the results of several experiments have shown that the size of the sample negatively affects rock strength due to the end effect (Wang and He, 2023a). However, the size effect of a rock sample on rock burst proneness has received little attention (Wang et al., 2023b). The size effect leads to stress concentration at the rock boundary and subsequently affects the stress adjustment rate of a rock mass (Kahraman, 2002). Thus, the dependence of rock burst proneness on stress adjustment rate is controlled by the size effect (Dai et al., 2022). Furthermore, the combined effect of high ground stress and external force disturbance is closely related to rock burst occurrence (Du et al., 2016). By enhancing the strain hardening effect, increasing the strain rate leads to a strong brittleness deformation of rock, making it an essential factor in energy release-induced rock burst (Liu et al., 2023).
To effectively predict rock burst, it is crucial to establish a dependable criterion for rock burst proneness. For this study, conventional compression tests were conducted on samples of limestone and slate with various length-to-diameter (L/D) ratios, under four different strain rates, to investigate proneness to rock burst. A revised index, the post-peak dissipated energy index, was introduced to assess the rock burst proneness of a rock mass, taking into account the strain rate and size effects. Correspondingly, a new criterion has been developed, which can be used to calculate the ratio of elastic energy to total dissipated energy. The practical utility and accuracy of the new criterion were validated through testing.
2 Test method
The uniaxial compressive test is widely used to assess rock burst proneness (Singh, 1988). Strain rate and size effect both influence rock burst proneness (Masoumi et al., 2016; Rybacki et al., 2016; Tang et al., 2002; Tarasov and Potvin, 2013; Yumlu and Ozbay, 1995). According to the principle of thermodynamics, it is assumed that there is no heat exchange between the external environment and the sample during the loading process. Thus, input energy is converted into elastic energy and dissipated energy. The conventional compression test was carried out on two rock types to obtain the energy parameters.
2.1 Rock material
Two types of rock, limestone (sedimentary rock) and slate (metamorphic rock), were obtained from a tunnel construction site in Qinling Mountain, Shaanxi Province, China. During the sampling process, a strong rock burst and a series of residual rock bursts were observed in the field with a burial depth of 1 km. Due to the effects of mineral distribution and composition on the mechanical properties of rock, it was necessary to conduct SEM to investigate differences in mineral composition. The SEM results indicated that the majority of mineral particles in the limestone were lime mud (accounting for 68% of mineral content) and volcanic chips (accounting for 24% of mineral content), with accompanying small amounts of pyrite (accounting for 6% of mineral content). These particles were crystallized in a manner that caused a small number of pores in the framework. The slate was composed of flake potash feldspar. In addition, the strong heterogeneity of slate was manifested in the distribution of layered structure. Since the typical layered structure has a strong effect on the mechanical properties of slate, the direction of each sample coring was perpendicular to the slate layer.
According to ISRM recommendations for compression tests (ISRM, 2007), the rock samples were processed into cylindrical shapes with different L/D ratios as follows. The rock specimens had a constant diameter of 50 mm and were of four different lengths (18, 42, 66, and 90 mm for limestone and 18, 24, 48, and 84 mm for slate), as shown in Figure 1.
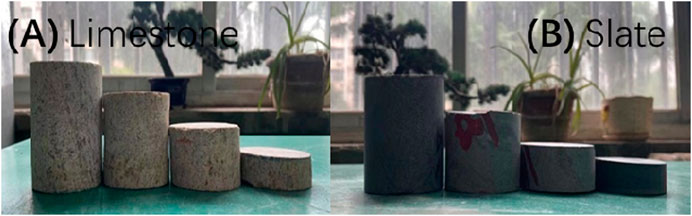
FIGURE 1. Partial group of rock samples.
2.2 Loading method
A series of unconfined compression tests were conducted on the WDT-1500 testing machine (shown in Figure 2). The maximum achieved load of 1800 kN can be applied by the bottom pressure head on the sample. The load and displacement sensors were installed in the top head, which detected a maximum axial displacement of 100 mm and lateral displacement of 5 mm. The error range of axial load and displacement was controlled within 0.1%. Moreover, the loading equipment was installed with three additional systems: a digital control system, a detection system, and a hydraulic loading system. The specific test steps satisfied the recommendations of the ISRM (2007). There was a pressure column upon the sample to concentrate the load on the center axis of the sample. In order to minimize the friction caused by the increased load, a spherical seat was located between the upper surface of the pressure column and the top pressure head. Similarly, two thermally hardened plates were placed on the upper and lower surfaces of the sample to eliminate friction. The conventional compression test was conducted at different loading rates to obtain the uniaxial compressive strength and elastic modulus of the rock. To ensure the consistency of the loading effect on samples of different sizes (ISRM, 2007), the strain rate εe was introduced as
where εe represents the strain rate, u is the loading rate, and l is the length of the rock sample.
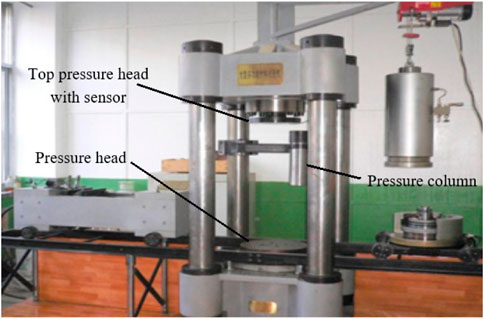
FIGURE 2. WDT- 1500 test machine.
To study the variation of rock burst proneness according to different strain rates, four strain rates (0.005, 0.01, 0.5, and 1.0 s−1) were considered based on the typical range of strain rate εe associated with rock burst (Wasantha et al., 2015). The specific test plan is listed in Table 1. Moreover, to avoid the heterogeneity of the rock material (especially the layered structure of slate), the average mechanical parameter from more than three samples under the same conditions was used in subsequent investigation.
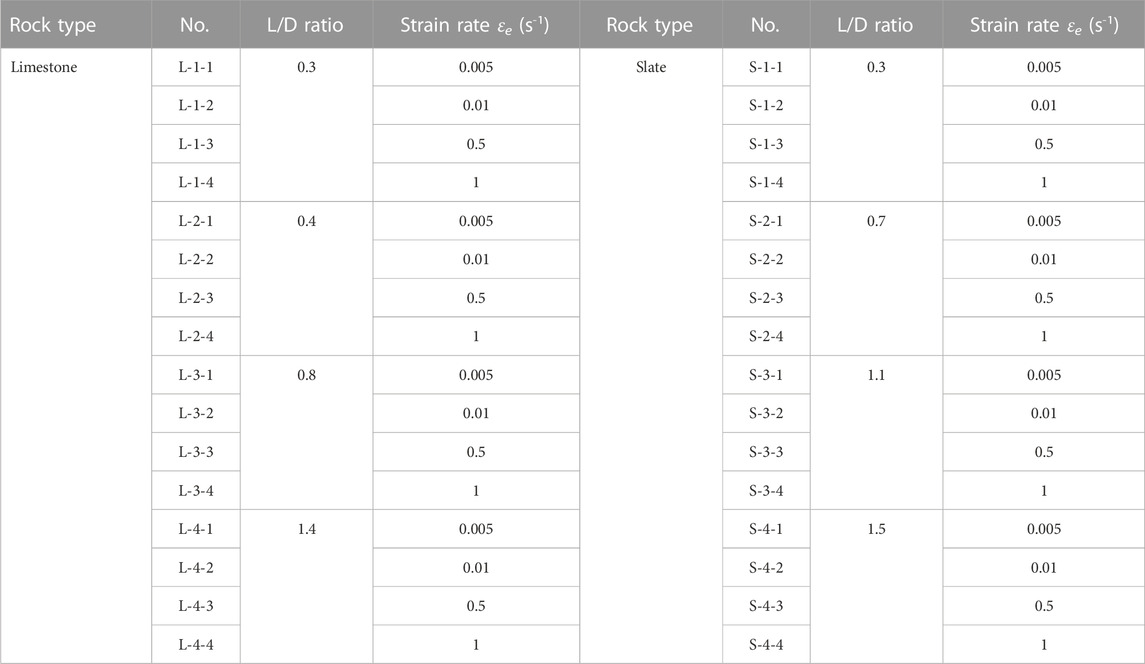
TABLE 1. Test method and sample serial number.
3 Revised criteria for rock burst proneness
Several criteria indicating rock burst proneness (Kidybiński, 1981; Singh, 1988; Zhang et al., 2009; He et al., 2015; Khosravi and Simon, 2018; Malan and Napier, 2018; Yang et al., 2018; Dai et al., 2019; Gong et al., 2019; Gong et al., 2020; Gong et al., 2021; Liu X L et al., 2020) have been reported. Although these criteria analyze the actual conditions of rock burst from different perspectives, the rapid release of stored energy is the essence of rock burst (Cook, 1976; Khosravi and Simon, 2018). During rock burst, the stored elastic energy is consumed by the ejection of rock fragments and dissipated through crack deformation of the rock mass. In particular, the ratio of elastic energy the dissipated energy, namely, Wet, is widely used to evaluate rock brittleness (Gong et al., 2019) and rock burst proneness (Kidybiński, 1981). The Wet index is determined when rock undergoes yield deformation until failure (the corresponding stress level progresses from 80% to 90%). According to Figure 3, Wet can be obtained by
where σc and ε1 are the UCS and corresponding failure strain, respectively, E is the elastic modulus, and Wet is the stored energy index. There are three categories of rock burst proneness quantified by Wet (Kidybiński, 1981):
The Wet index reveals the essence of rock burst occurrence from a theoretical perspective. Nevertheless, the determination of the Wet index is only dependent on the pre-peak energy storage characteristic corresponding to the most violent rock burst. During the excavation process, rock failure induced by stress disturbance is manifested in two modes, spalling and rock burst (Diederichs et al., 2004). Spalling (the progressive failure of a rock mass) is identified as a precursor to rock burst (Martin and Maybee, 2000; Diederichs, 2007). As ground stress increases, spalling evolves into rock burst (Mazaira and Konicek, 2015). Owing to the instability of the stress adjustment during the excavation process, it is believed that spalling and rock burst occur at the same time until the stress state is stabilized (Gong et al., 2018a; b). This judgment of rock burst should involve the rock deformation before entering the residual stage. The dissipated energy consumed after peak is considered the post-peak dissipated energy
where σr is the residual strength and ε2 is the strain when first entering the residual stage. The post-peak dissipated energy index
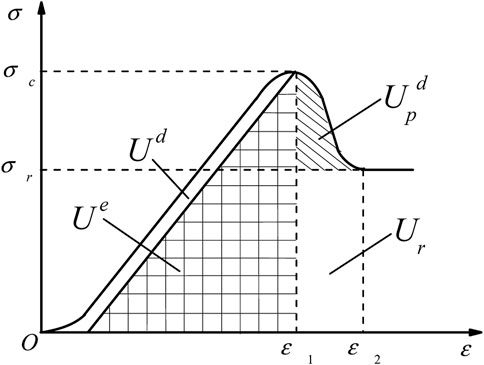
FIGURE 3. Energy evolution and calculation method of the post-peak dissipated energy index.
4 Analysis and results
4.1 Mechanical properties and energy storage characteristics
To obtain the energy characteristics during rock deformation to failure, the stress–strain curve under different strain rates and L/D ratios is shown in Figure 4. Several deformation stages can be identified in the stress–strain curve: the compaction stage, elastic stage, yield stage, and residual stage. For limestone, the curve of the initial compaction stage is longer than that for slate. This indicates that the mineral composition and structure of limestone are relatively loose. Limestone specimens have been shown to undergo greater deformation until they are at maximum density (Konsztowicz, 2010). The elastic modulus of rock was calculated as the slope of the second stage of the curve in investigation of the influence of scale effect and strain rate. An obvious yield stage was observed in the stress–strain curve of limestone. This phenomenon indicated a strong plastic deformation in this stage. Due to strong brittleness, slate demonstrated a rapid stress drop after the elastic deformation stage. The energy parameters U, Ue, Ud, and
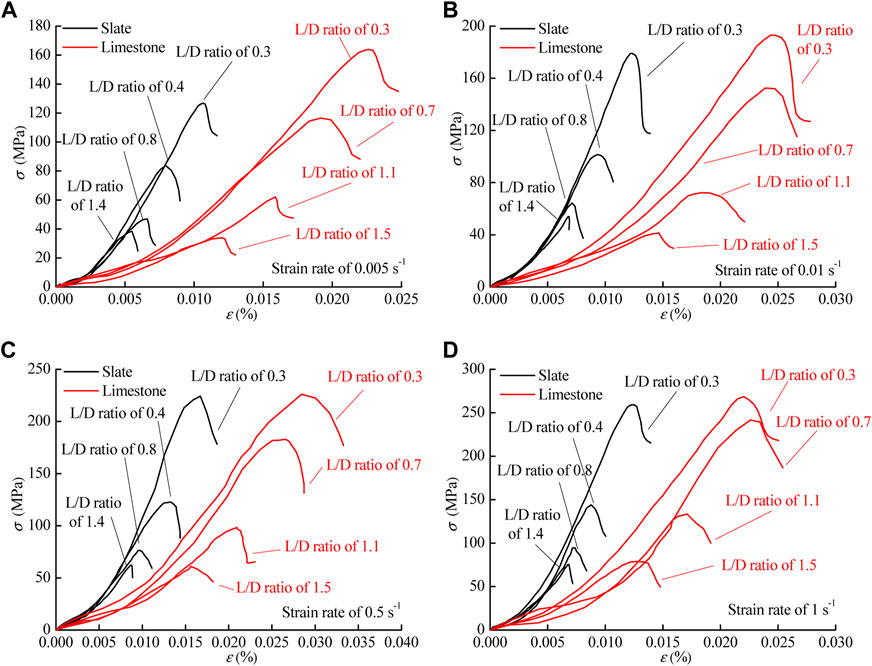
FIGURE 4. Stress–strain curve of slate and limestone under different loading rates. (A) 0.005s−1, (B) 0.01s−1, (C) 0.5s−1, and (D) 1s−1.
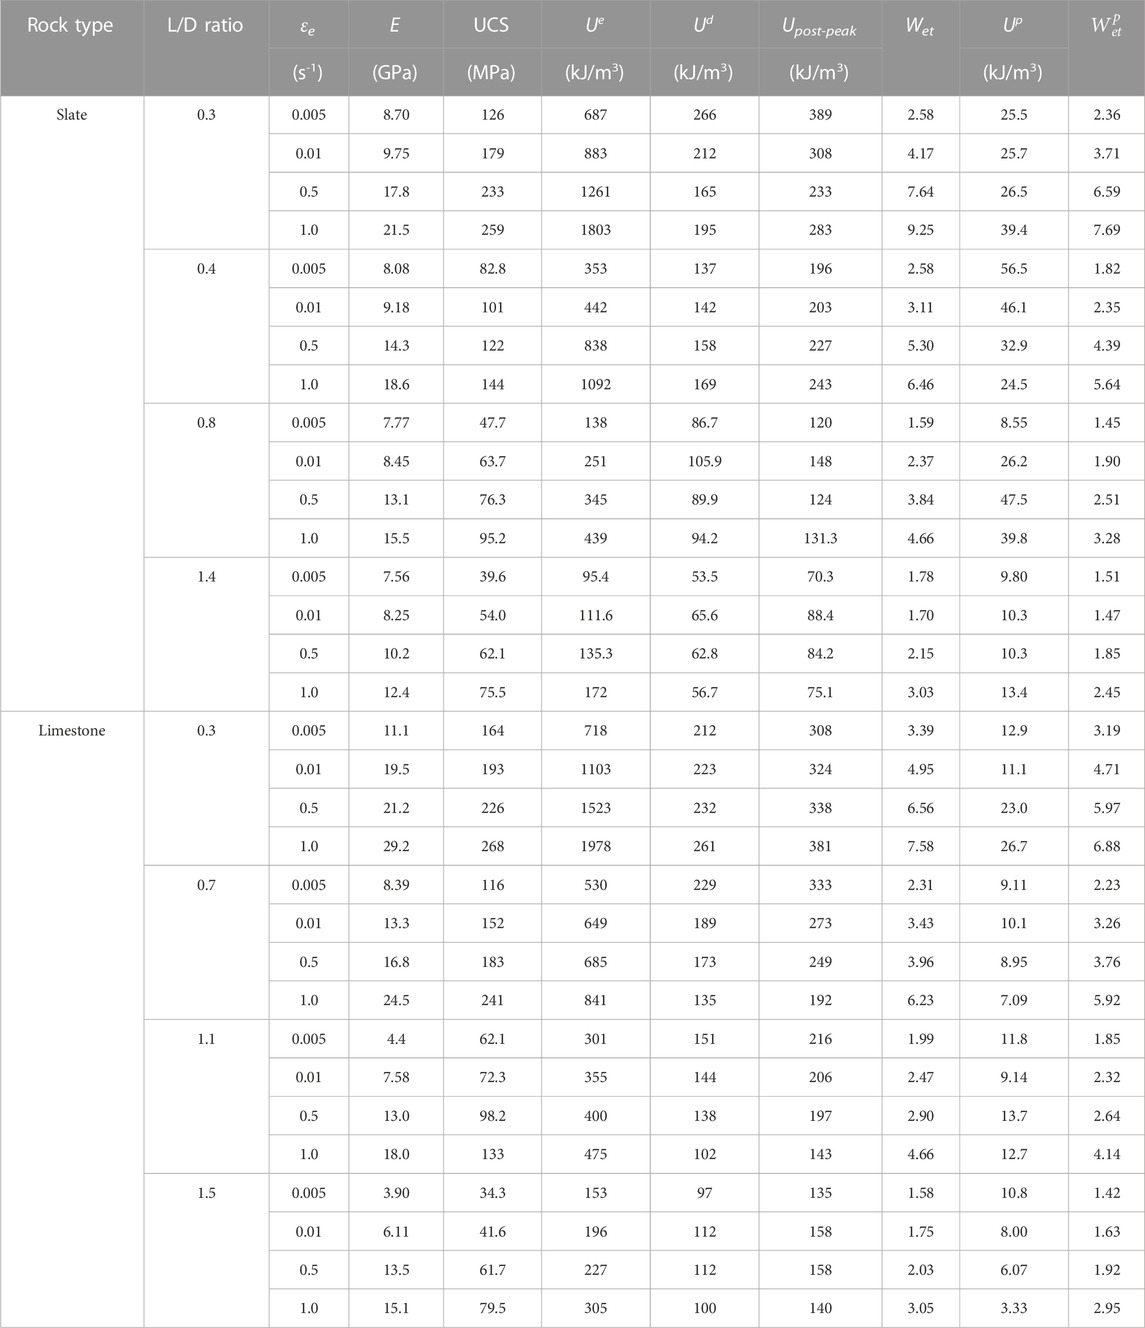
TABLE 2. Mechanical properties and two indices, Wet and
The relationship between the UCS and L/D ratio is shown in Figure 5. As the L/D ratio increased, the UCS showed a non-linear decreasing trend. The L/D ratio-dependent variation of UCS gradually stabilized when the L/D ratio reached 1.5. The elastic modulus presented a decreasing trend with increasing L/D, similar to that of UCS, as shown in Figure 6. This indicates that the L/D ratio has a negative effect on the mechanical performance of limestone and slate. It is worth noting that the elastic modulus of limestone decreased linearly. To explain this result, the typical failure characteristics of samples with different L/D ratios are presented in Table 3. For slate and limestone, the failure characteristic changed from complex to single with the increasing L/D ratio. Due to the relatively short stress path of the specimen with a low L/D ratio, the stress concentration phenomenon at the end of the specimen generated a large amount of friction between the pressure head and the end face of the sample (Tekalur and Sen, 2011). This end friction effect reflects a heterogeneous stress distribution at the end face. In order to maintain the integrity of the rock under mechanical compression, the stress distribution is frequently adjusted. Therefore, there are various failure characteristics observed in rock samples (Walton et al., 2019). When the L/D ratio reaches 1.5, limestone and slate undergo split failure and shear failure, respectively. The typical failure characteristic can be explained in terms of mineral composition and structure. For slate, its typical clastic structure contains a lot of pores at the clastic junction. When the sample enters the critical state of elastoplastic deformation, the stress path passes the weak area of the clastic structure and forms a plastic deformation zone (Qui˜nones et al., 2017). As the axial load increased constantly to exceed the yield limit of the rock, the stress path penetrated the specimen to form a shear sliding surface. The microstructural properties of the limestone skeleton suggested a muddy supporting texture. When a compressive load was applied, cracks expanded along the cemented boundary of lime mud particles. Therefore, the limestone exhibited splitting failure under compressive load.
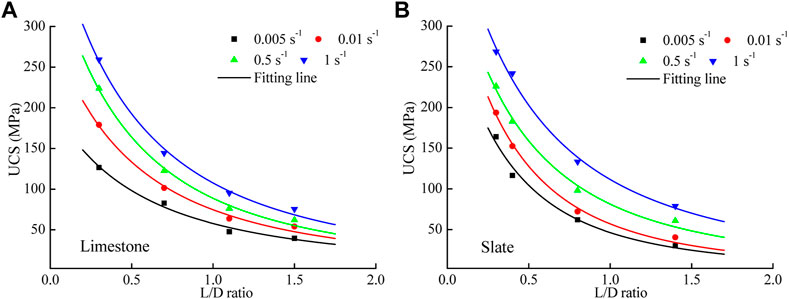
FIGURE 5. Relationship between the UCS and the L/D ratio for (A) limestone and (B) slate.
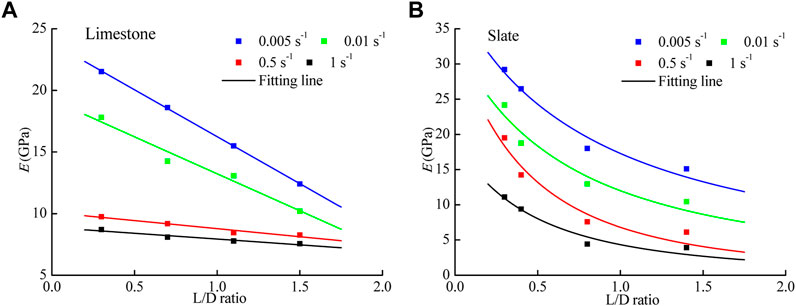
FIGURE 6. Relationship between the elastic modulus and the L/D ratio under different strain rates. (A) Limestone and (B) Slate.
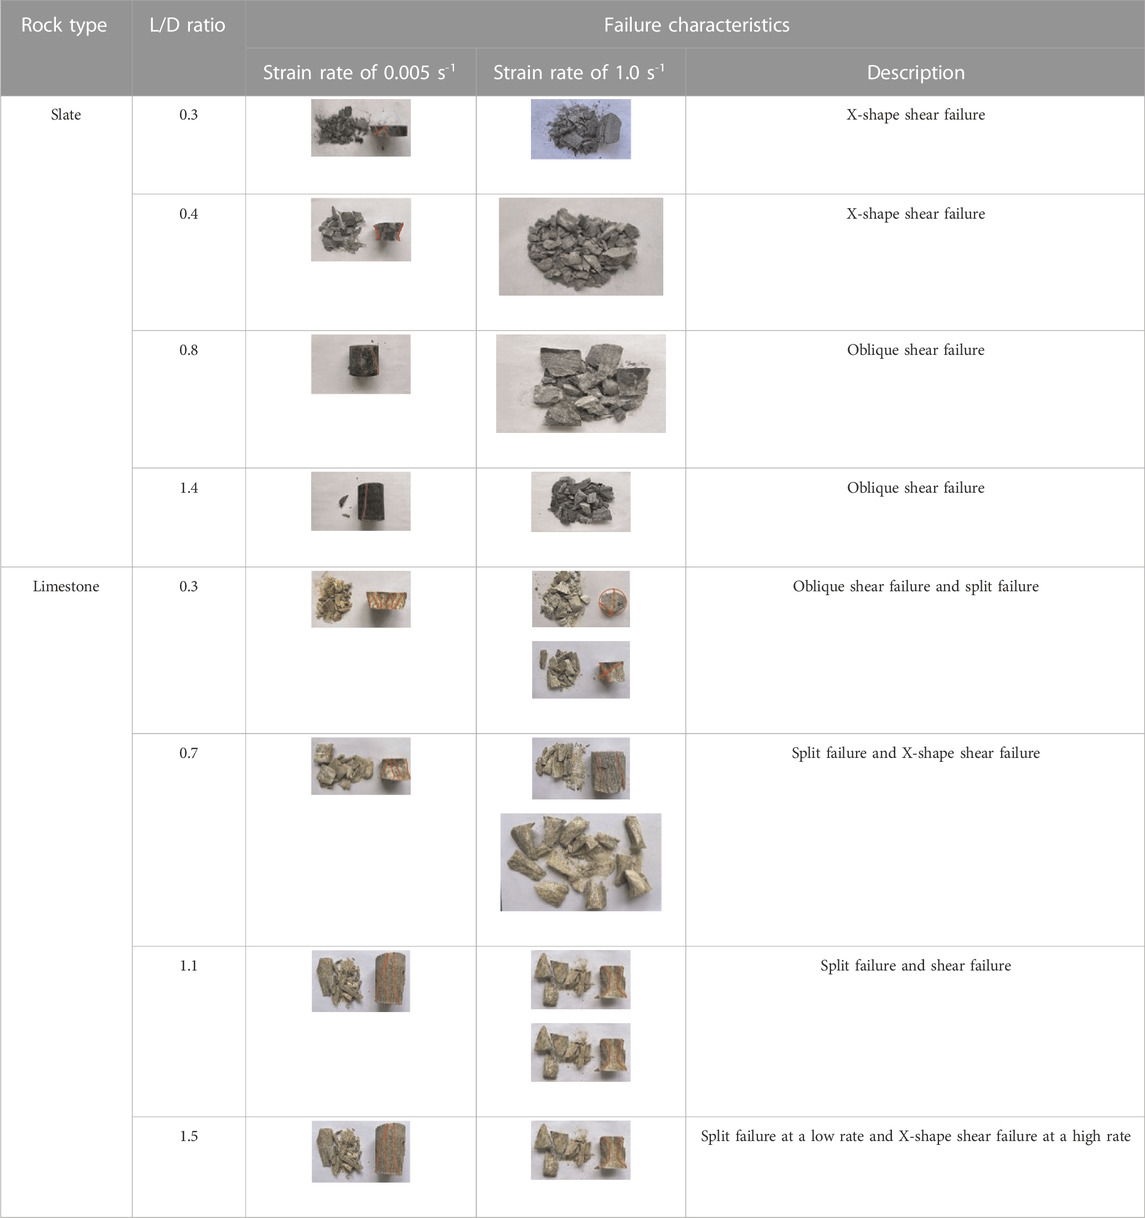
TABLE 3. Failure characteristics of slate and limestone with different L/D ratios under different strain rates.
The energy indices U, Ue, Ud, and
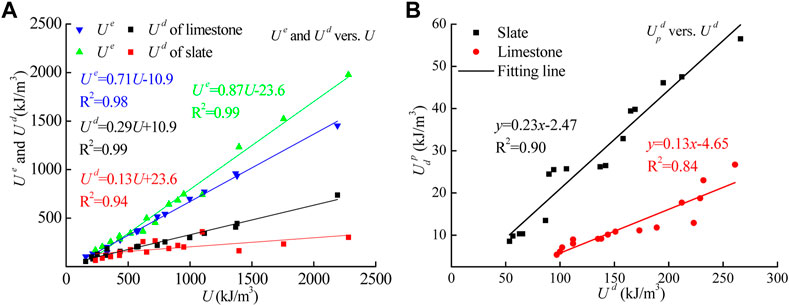
FIGURE 7. Relationship between (A) Ue and Ud versus U and (B)
To obtain the effects of L/D and strain rate on these linear energy characteristics, the correlation between the ratio of elastic energy to input energy and two influence factors are presented in Figure 8. Due to the large range of strain rates, the variation of strain rate is usually described as a semi-log equation. The error bar represents the range of the Ue/U values under the same condition to emphasize the influence of individual factors. The effects of L/D and strain rate on the linear energy characteristics were observed in limestone and slate. As the strain rate εe increased, Ue/U increased in segments. When εe had a range from 0.01 to 0.5 s−1, the increased value of Ue/U averaged 8% for slate and limestone. The elastic deformation capacity of rock can be characterized by Ue/U. With increasing εe, the strain rate-hardening effect becomes more significant, resulting in a reinforcement of elastic deformation under compressive load. The size effect of rock on the linear energy characteristic is demonstrated as a linear trend. The difference in slope values between slate and limestone (33.3%) revealed the effect of slate brittleness on the failure characteristics induced by the size of the sample. There was an apparent stress concentration at end face caused by size effect. Stress concentrations not only created cracks but also caused friction to dissipate energy. The detrital distribution of slate was beneficial for crack propagation and energy dissipation. Therefore, the decreased Ue/U of slate was more obvious than that of limestone.
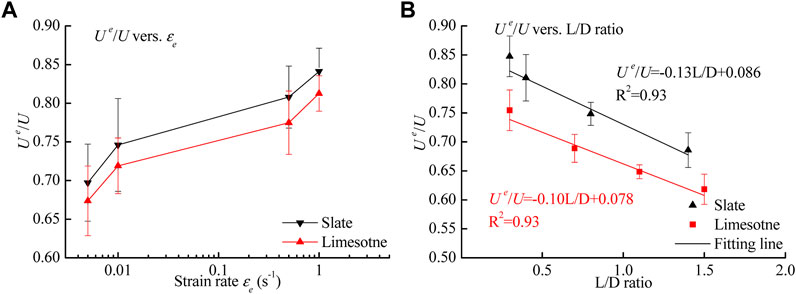
FIGURE 8. Effect of the strain rate and L/D ratio on the linear energy characteristics. (A) strain rate and (B) L/D ratio.
4.2 Proposed criteria for rock burst proneness
Failure of rock specimens is accompanied by the rapid propagation of cracks and ejection of rock chips (Małkowski and Niedbalski, 2020). The failure characteristics are affected by the energy storage property of a rock mass. Pre-stored energy releases rapidly and transforms into the kinetic energy consumed by the ejection of rock chips (Feng et al., 2021). The rapid energy conversion is similar to the mechanism of rock burst in a mine (Cai et al., 2021). Nevertheless, it is difficult to capture rock fragments and calculate the total kinetic energy to determine rock burst proneness (Gong et al., 2021). In the actual rock burst, failure sound, observed size distribution of rock fragments, and failure characteristics are considered the standard. To establish criteria for rock burst proneness based on the

TABLE 4. Fitting formula of
No risk of rock burst: At a low strain rate, the slate specimens with an L/D ratio of 1.5 and 1.8 had only one oblique shear crack, accompanied by a few scattered slate particles, as shown in Table 4. There was no obvious sound upon specimen failure. Moreover, the rock fragments slid down along the failure surface under the action of gravitational potential energy instead of being ejected.
Low risk of rock burst: For most slate and limestone specimens, large fragments could be observed to fall off, but the specimens retained their main shape. The limestone with low-risk rock burst proneness showed typical split failure. Only a small amount of rock particles had been observed to eject at low velocity. Taking the limestone specimen with an L/D ratio of 1.1 at low strain rate, a majority of limestone flakes were distributed on the pressure head, and only a few small pieces were ejected on the pressure platform.
High risk of rock burst: The failure modes of slate specimens and limestone specimens with the L/D ratio of 1.1 under high strain rate presented typical failure characteristics of rock burst. The specimens were broken into many rock chunks and particles that were no more than 3.0 cm in size, which were ejected on the platform at high velocity. Therefore, the failure characteristics of high risk of rock burst can be described as a large amount of rock debris and particles ejected at a high speed, accompanied by a strong crackling sound and fall on the platform when the specimen disintegrated.
According to the actual rock burst proneness determined by the failure characteristics, the post-peak dissipated energy index
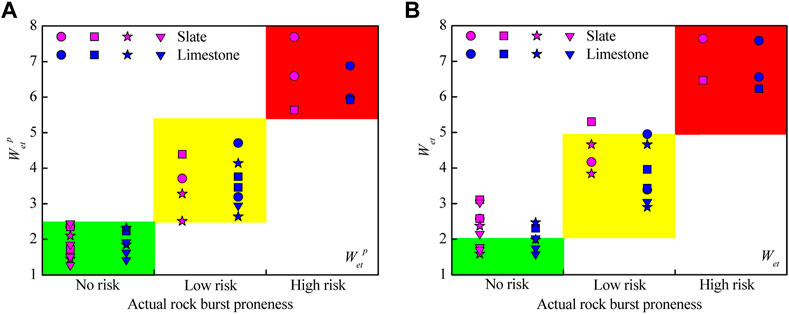
FIGURE 9. (A) Relationship between
The occurrence of rock burst is closely associated with stored energy release. By considering post-peak energy dissipation, the rock burst proneness can be modified to adapt to the actual situation. Compared with the criterion for rock burst proneness using Wet, the three criterion categories of the revised rock burst proneness, determined using the
4.3 Effect of the L/D ratio and strain rate on rock burst
Based on the relationship between the post-peak energy dissipation and failure characteristics, the criterion for rock burst proneness has three categories: no risk, low risk, and high risk. The
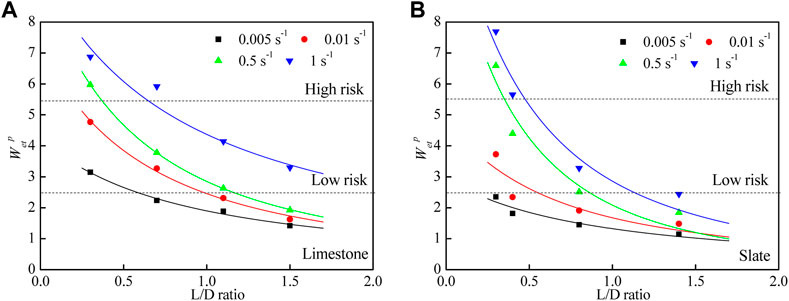
FIGURE 10. Correlation between
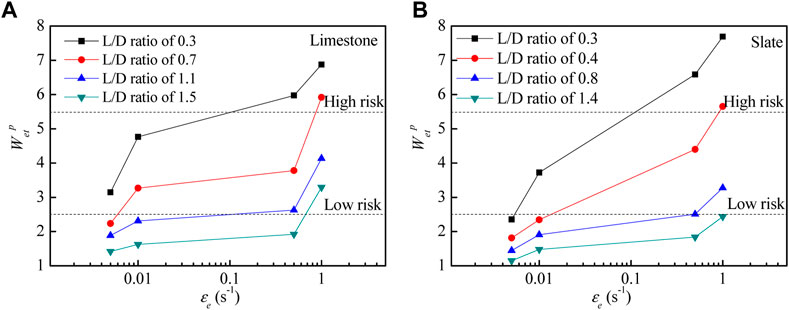
FIGURE 11. Correlation between
For most conditions of limestone and slate, the increase in
Comparing the curves in Figures 10, 11, it can be observed that the effects of strain rate and scale effect on
where a, b, and c are the fitting parameters with values of 3.05, 3.67, and 2.62 for limestone and 3.12, 4.27, and 2.21 for slate, respectively. The fitting result is shown in Figure 12, which is marked with a dashed line representing the risk grades of rock burst. The fitting coefficients R2 of the two rocks were 0.91 and 0.93, indicating an accurate determination of
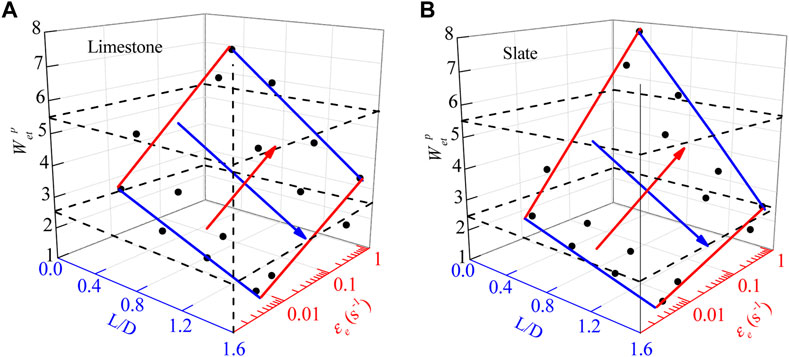
FIGURE 12. Variation of
5 Discussion
5.1 Effect of strain rate and L/D ratio on linear energy characteristics
The process of rock failure is closely related to energy dissipation and storage during energy evolution. Previous studies have indicated that the characteristics of energy dissipation and storage are essential in determining rock burst proneness (Kidybiński, 1981; Li et al., 2014; Wasantha et al., 2015; Gale, 2018; Liu X L, et al., 2020; Gong et al., 2021). To investigate the critical state of rock burst occurrence, this study proposed the post-peak dissipated energy index
To examine the validity of the linear energy principle, data from various types of rocks and rock-like materials (such as coal and concrete) from other literature sources have been introduced. The materials considered in this analysis include gas coal (Gong et al., 2020), TJH coal (Liu S M et al., 2020), ordinary concrete, EPS concrete, and AHB concrete (Lu et al., 2017), as well as shale (Iman et al., 2018), as shown in Figure 13. The results indicate a strong linear correlation between Ue and U, with a fitting coefficient R2 over 0.95. The difference in the slope values for different materials reflects their unique energy storage characteristics.
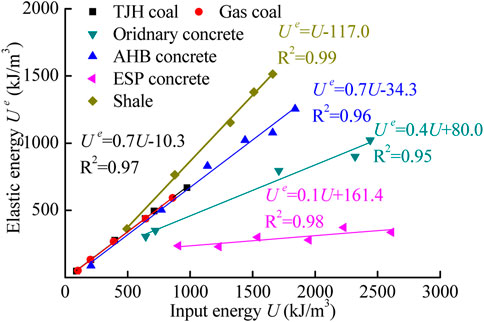
FIGURE 13. Relationship between Ue and U. Sources: shale, Iman et al. (2018); TJH coal, Liu S M et al. (2020); gas coal, Gong et al. (2020); and ordinary, ESP, and AHB concrete, Lu et al. (2017).
Although gas coal and TJH coal are obtained from different regions (Shaanxi and Shandong provinces, respectively), their energy storage trends are fitted to the same function (marked in black). This suggests that the energy distribution of coal is relatively stable compared to shale and concrete. However, due to the different properties of additive materials in concrete, the energy storage characteristics differ significantly. Under compressive load, the addition of AHB material causes the concrete to undergo crushed failure earlier, thus dissipating a portion of the input energy instead of storing it in the sample. Furthermore, the addition of AHB matrix generates pores at the contact surface, leading to further crack deformation and energy dissipation (Luo et al., 2014). Conversely, the addition of EPS material in concrete plays a key role in buffering the compressive loading to enhance elastic deformation, thereby improving the energy storage ability of the concrete sample (Kirane et al., 2015). The comparative analysis indicates that shale has a stronger ability to store energy than coal or concrete. This is related to the strong brittleness of shale and its elastic energy storage performance.
5.2 Comparative analysis of
Rock burst is characterized by the sudden release of stored elastic strain energy, which results in the high-speed ejection of rock fragments. The intensity of a rock burst depends on the rate of release of elastic energy. After stress adjustment in the rock mass, the stress concentration occurs at the rock mass to generate a rock burst (Feng et al., 2015). To better estimate rock burst proneness, we propose the post-peak dissipated energy index, which is based on the linear energy storage characteristics of rocks. This index accounts for the strain energy dissipation after failure, resulting in improved accuracy in estimating rock burst proneness.
To assess the effectiveness of the proposed
where
Małkowski and Niedbalski (2020) found that the tendency for rock burst under pressure load can be evaluated by the storage of potential elastic energy. On this basis, the potential elastic energy index PES was derived using the UCS and elastic modulus as
where PES (kJ) classifies the rock burst tendency into four grades: PES < 40 indicates no proneness, 40 < PES < 100 indicates weak proneness, 100 < PES < 200 indicates high proneness, and PES > 200 indicates extreme proneness.
The characteristics of the geo-mechanical system (coal seam-surrounding rock) were analyzed to develop the criterion for rock burst tendency. In accordance with the stress–strain curves of rock mass, post-failure deformation modulus M and Young’s modulus E were introduced to assess the rock burst tendency (Bukowska M, 2005):
where WTG < 1 indicates no proneness to rock burst, 1 < WTG < 2 indicates little proneness to rock burst, and WTG > 2 indicates strong proneness to rock burst.
The modified bursting energy index
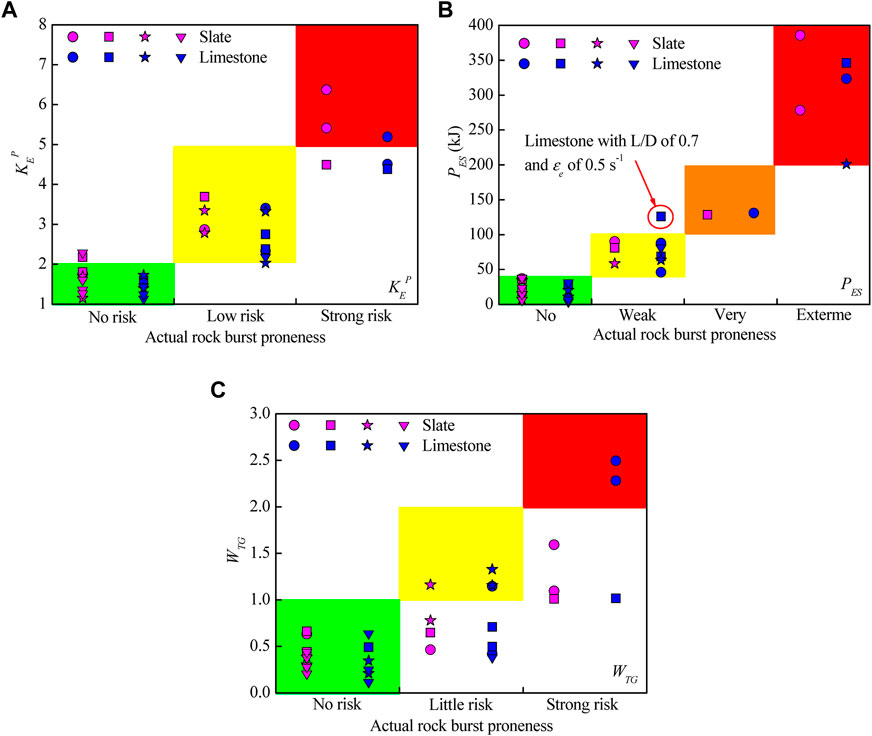
FIGURE 14. Relationship between the three indices, (A)
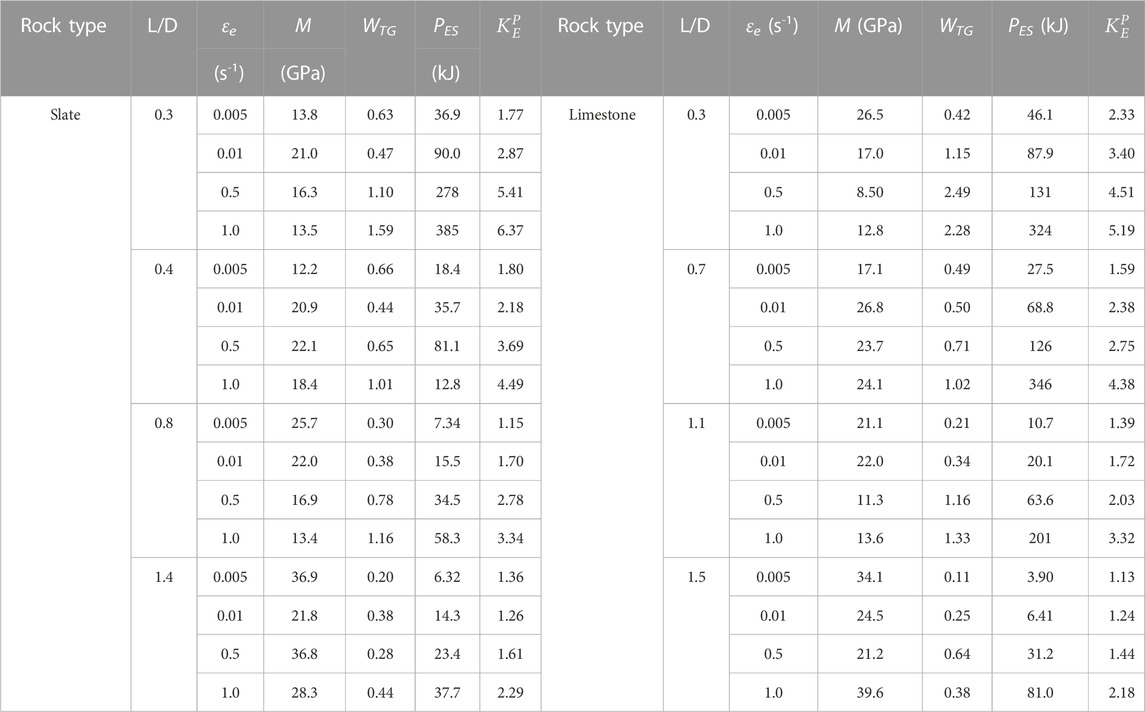
TABLE 5. Summary of rock burst proneness based on three indices from Liu S M et al. (2020), Małkowski and Niedbalski (2020), and Bukowska (2005).
6 Conclusion
Conventional compression tests were carried out on limestone and slate samples under different conditions (including variations in strain rate and sample size). By considering the energy dissipated in the post-peak stage, the
(1) Under different L/D ratios and strain rates, the typical failure characteristics of limestone and slate were obtained to analyze the effect of L/D ratios and strain rates on rock mechanical parameters. As the L/D ratio increases, UCS and elastic modulus show a non-linear decreasing trend, which is caused by the end effect of the rock sample. Variation of the strain rate changed the failure path, leading to the complexity of the rock failure type.
(2) A linear correlation between Ue and U, namely, the linear energy storage law, was found, along with a relationship between Ud and Up. The linear energy characteristic has different correlations with strain rate and L/D as it is positively correlated with strain rate and negatively correlated with L/D. The Wet index was modified to the
(3) L/D ratio-dependent variation of the
Data availability statement
The original contributions presented in the study are included in the article/Supplementary Material; further inquiries can be directed to the corresponding author.
Author contributions
XL: methodology and writing—original draft. YZ: software and formal analysis. HX: investigation and resources. LL: investigation and resources. HW: conceptualization, methodology, supervision, and writing—review and editing.
Acknowledgments
The authors acknowledge the financial support provided by the Key R&D and Transformation Plan of Qinghai Province (Grant No. 2021-SF-167).
Conflict of interest
Author XL was employed by Qinghai Traffic Construction Management Co., Ltd., and authors XL, HX, and LL were employed by Qinghai Xihu Expressway Management Co., Ltd.
The remaining authors declare that the research was conducted in the absence of any commercial or financial relationships that could be construed as a potential conflict of interest.
Publisher’s note
All claims expressed in this article are solely those of the authors and do not necessarily represent those of their affiliated organizations, or those of the publisher, the editors, and the reviewers. Any product that may be evaluated in this article, or claim that may be made by its manufacturer, is not guaranteed or endorsed by the publisher.
References
Ai, C., Zhang, J., Li, Y. W., Zeng, J., Yang, X. L., and Wang, J. G. (2016). Estimation criteria for rock brittleness based on energy analysis during the rupturing process. Rock Mech. Rock Eng. 49 (12), 4681–4698. doi:10.1007/s00603-016-1078-x
Bukowska, M. (2005). Indicative methods for assessment of liability of rocks and rock mass to rock-bumps. Res. Rep. Min. Environ. 2, 95–107.
Cai, W., Dou, L. M., Si, G. Y., and Hu, Y. W. (2021). Fault-induced coal burst mechanism under mining-induced static and dynamic stresses. Engineering-Prc. 7 (5), 687–700. doi:10.1016/j.eng.2020.03.017
Cai, W. Q., Zhu, H. H., and Liang, W. H. (2022). Three-Dimensional tunnel face extrusion and reinforcement effects of underground excavations in deep rock masses. Int. J. Rock Mech. Min. Sci. 150, 104999. doi:10.1016/j.ijrmms.2021.104999
Cook, N. G. W. (1976). Seismicity associated with mining. Eng. Geol. 10, 99–122. doi:10.1016/0013-7952(76)90015-6
Dai, L. P., Pan, Y. S., Zhang, C. G., Wang, A. W., Canbulat, I., Shi, T. W., et al. (2022). New criterion of critical mining stress index for risk evaluation of roadway rockburst. Rock Mech. Rock Eng. 55 (8), 4783–4799. doi:10.1007/s00603-022-02888-7
Dai, S., Wang, X., Pan, Y., and Liu, L. (2019). Experimental study on the evaluation of coal burst tendency utilizing modulus index. J. China Coal Soc. 44 (6), 1726–1731.
Darbor, M., Faramarzi, L., and Sharifzadeh, M. (2019). Size-dependent compressive strength properties of hard rocks and rock-like cementitious brittle materials. Geosystem Eng. 22 (4), 179–192. doi:10.1080/12269328.2018.1431961
Diederichs, M. S. (2007). The 2003 Canadian geotechnical colloquium: Mechanistic interpretation and practical application of damage and spalling prediction criteria for deep tunnelling. Can. Geotech. J. 44 (9), 1082–1116. doi:10.1139/t07-033
Diederichs, M. S., Kaiser, P. K., and Eberhardt, E. (2004). Damage initiation and propagation in hard rock during tunnelling and the influence of near-face stress rotation. Int. J. Rock Mech. Min. Sci. 41 (5), 785–812. doi:10.1016/j.ijrmms.2004.02.003
Du, K., Tao, M., Li, X. B., and Zhou, J. (2016). Experimental study of slabbing and rockburst induced by true-triaxial unloading and local dynamic disturbance. Rock Mech. Rock Eng. 49 (9), 3437–3453. doi:10.1007/s00603-016-0990-4
Feng, G. L., Chen, B. R., Jiang, Q., Xiao, Y. X., Niu, W. J., and Li, P. X. (2021). Excavation-induced microseismicity and rockburst occurrence: Similarities and differences between deep parallel tunnels with alternating soft-hard strata. J. Cent. South. Univ. 28, 582–594. doi:10.1007/s11771-021-4623-z
Feng, G. L., Feng, X. T., Chen, B. R., Xiao, Y. X., and Yu, Y. (2015). A microseismic method for dynamic warning of rockburst development processes in tunnels. Rock Mech. Rock Eng. 48 (5), 2061–2076. doi:10.1007/s00603-014-0689-3
Gale, W. J. (2018). A review of energy associated with coal bursts. Int. J. Min. Sci. Technol. 28 (5), 755–761. doi:10.1016/j.ijmst.2018.08.004
Gong, F. Q., Luo, S., and Yan, J. Y. (2018c). Energy storage and dissipation evolution process and characteristics of marble in three tension-type failure tests. Rock Mech. Rock Eng. 51 (11), 3613–3624. doi:10.1007/s00603-018-1564-4
Gong, F. Q., Luo, Y., Li, X. B., Si, X. F., and Tao, M. (2018a). Experimental simulation investigation on rockburst induced by spalling failure in deep circular tunnels. Tunn. Undergr. Space. Technol. 81, 413–427. doi:10.1016/j.tust.2018.07.035
Gong, F. Q., Si, X. F., Li, X. B., and Wang, S. Y. (2018b). Experimental investigation of strain rockburst in circular caverns under deep three-dimensional high-stress conditions. Rock Mech. Rock Eng. 52, 1459–1474. doi:10.1007/s00603-018-1660-5
Gong, F. Q., Wang, Y. L., and Luo, S. (2020). Rockburst proneness criteria for rock materials: Review and new insights. J. Cent. South Univ. 27 (10), 2793–2821. doi:10.1007/s11771-020-4511-y
Gong, F. Q., Wang, Y. L., Wang, Z. G., Pan, J. F., and Luo, S. (2021). A new criterion of coal burst proneness based on the residual elastic energy index. Int. J. Min. Sci. Tec. 31, 553–563. doi:10.1016/j.ijmst.2021.04.001
Gong, F. Q., Yan, J. Y., Li, X., and Luo, S. (2019). A peak-strength strain energy storage index for rock burst proneness of rock materials. Int. J. Rock Mech. Min. Sci. 117, 76–89. doi:10.1016/j.ijrmms.2019.03.020
He, M. C., Sousa, L. R. E., Miranda, T., and Zhu, G. L. (2015). Rockburst laboratory tests database-application of data mining techniques. Eng. Geol. 185, 116–130. doi:10.1016/j.enggeo.2014.12.008
He, M. M., Wang, J., Yuan, Z. Y., Wang, H. T., Ma, X. D., and Luo, B. (2023). Evaluating the anisotropy of drilling mechanical characteristics of rock in the process of digital drilling. Acta geophys., doi:10.1007/s00603-023-03242-1
Iman, R., Kivi, I. R., Ameri, M., and Molladavoodi, H. (2018). Shale brittleness evaluation based on energy balance analysis of stress-strain curves. J. Pet. Sci. Eng. 167, 1–19. doi:10.1016/j.petrol.2018.03.061
Kahraman, S. (2002). Correlation of TBM and drilling machine performances with rock brittleness. Eng. Geol. 65 (4), 269–283. doi:10.1016/s0013-7952(01)00137-5
Kaiser, P. K., and Cai, M. F. (2012). Design of rock support system under rockburst condition. J. Rock Mech. Geotech. Eng. 4, 215–227. doi:10.3724/sp.j.1235.2012.00215
Keneti, A., and Sainsbury, B. A. (2018). Review of published rockburst events and their contributing factors. Eng. Geol. 246, 361–373. doi:10.1016/j.enggeo.2018.10.005
Khosravi, A., and Simon, R. (2018). Verification of the CSDS model in estimating the postpeak behavior of hard rocks. Int. J. Geomech. 18 (3), 04017166. doi:10.1061/(asce)gm.1943-5622.0001090
Kidybiński, A. (1981). Bursting liability indices of coal. Int. J. Rock Mech. Min. Sci. 18, 295–304. doi:10.1016/0148-9062(81)91194-3
Kirane, K., Su, Y., and Bazˇant, Z. P. (2015). Strain-rate-dependent micro plane model for high rate comminution of concrete under impact based on kinetic energy release theory. Proc. R. Soc. A Math. Phys. Eng. Sci. 471, 20150535. doi:10.1098/rspa.2015.0535
Konicek, P., and Waclawik, P. (2018). Stress changes and seismicity monitoring of hard coal longwall mining in high rockburst risk areas. Tunn. Undergr. Space Technol. 81, 237–251. doi:10.1016/j.tust.2018.07.019
Konsztowicz, K. J. (2010). Crack growth and acoustic emission in ceramics during thermal shock. J. Am. Ceram. Soc. 73 (3), 502–508. doi:10.1111/j.1151-2916.1990.tb06545.x
Li, S. J., Feng, X. T., Li, Z. H., Chen, B. R., Zhang, C. Q., and Zhou, H. (2012). In situ monitoring of rockburst nucleation and evolution in the deeply buried tunnels of Jinping II hydropower station. Eng. Geol. 137 (7), 85–96. doi:10.1016/j.enggeo.2012.03.010
Li, X. L., Chen, S. J., Liu, S. M., and Li, Z. H. (2021a). AE waveform characteristics of rock mass under uniaxial loading based on Hilbert-Huang transform. J. Cent. South Univ. 28 (6), 1843–1856. doi:10.1007/s11771-021-4734-6
Li, X. L., Chen, S. J., and Wang, S. (2021b). Study on in situ stress distribution law of the deep mine taking Linyi Mining area as an example. Adv. Mater Sci. Eng. 9 (4), 5594181.
Li, X. L., Zhang, X. Y., Shen, W. L., Zeng, Q., Chen, P., Qin, Q., et al. (2023). Research on the mechanism and control technology of coal wall sloughing in the ultra-large mining height working face. Int. J. Env. Res. Pub He 20 (2), 868. doi:10.3390/ijerph20010868
Li, Y., Huang, D., and Li, X. A. (2014). Strain rate dependency of coarse crystal marble under uniaxial compression: Strength, deformation and strain energy. Rock Mech. Rock Eng. 47 (4), 1153–1164. doi:10.1007/s00603-013-0472-x
Liu, H. Y., Zhang, B. Y., Li, X. L., Liu, C., Wang, C., Wang, F., et al. (2022). Research on roof damage mechanism and control technology of gob-side entry retaining under close distance gob. Eng. Fail Anal. 138 (5), 106331. doi:10.1016/j.engfailanal.2022.106331
Liu, S. M., Li, X. L., and Wang, D. K. (2020). Investigations on the mechanism of the microstructural evolution of different coal ranks under liquid nitrogen cold soaking. Energy Sources, Part A Recovery, Util. Environ. Eff. 17, 1. doi:10.1080/15567036.2020.1841856
Liu X L, X. L., Liu, Q., Liu, B., and Kang, Y. (2020). A modified bursting energy index for evaluating coal burst proneness and its application in ordos coalfield, China. China. Energies 13 (7), 1729. doi:10.3390/en13071729
Liu, X. Q., Wang, G., Song, L. B., Han, G. S., Chen, W. Z., and Chen, H. (2023). A new rockburst criterion of stress-strength ratio considering stress distribution of surrounding rock. B Eng. Geol. Environ. 82 (1), 29. doi:10.1007/s10064-022-03042-x
Lu, S., Xu, J, Y., Bai, E. L., and Luo, X. (2017). Effect of particles with different mechanical properties on the energy dissipation properties of concrete. Constr. Build. Mat. 144, 502–515. doi:10.1016/j.conbuildmat.2017.02.161
Lundborg, N. (1967). The strength-size relation of granite. Int. J. Rock Mech. Min. Sci. Geomech. Abstr. 4 (3), 269–272. doi:10.1016/0148-9062(67)90011-3
Luo, X., Xu, J. Y., Bai, E. L., and Li, W. (2014). Study on the effect of basalt fiber on the energy absorption characteristics of porous material. Constr. Build. Mat. 68 (6), 384–390. doi:10.1016/j.conbuildmat.2014.06.072
Malan, D. F., and Napier, J. A. L. (2018). Rockburst support in shallow-dipping tabular stopes at great depth. Int. J. Rock Mech. Min. Sci. 112, 302–312. doi:10.1016/j.ijrmms.2018.10.026
Małkowski, P., and Niedbalski, Z. (2020). A comprehensive geomechanical method for the assessment of rockburst hazards in underground mining. Int. J. Min. Sci. Tech. 30 (3), 345–355. doi:10.1016/j.ijmst.2020.04.009
Martin, C. D., and Maybee, W. G. (2000). The strength of hard-rock pillars. Int. J. Rock Mech. Min. Sci. 37 (8), 1239–1246. doi:10.1016/s1365-1609(00)00032-0
Masoumi, H., Saydam, S., and Hagan, P. C. (2016). Unified size-effect law for intact rock. Int. J. Geomech. 16 (2), 04015059. doi:10.1061/(asce)gm.1943-5622.0000543
Mazaira, A., and Konicek, P. (2015). Intense rockburst impacts in deep underground construction and their prevention. Can. Geotech. J. 52 (10), 1426–1439. doi:10.1139/cgj-2014-0359
Qui˜nones, J., Arzúa, J., Alejano, L., García-Bastante, F., Ivars, D. M., and Walton, G. (2017). Analysis of size effects on the geomechanical parameters of intact granite samples under unconfined conditions. Acta. Geotech. 12 (6), 1229–1242. doi:10.1007/s11440-017-0531-7
Rybacki, E., Meier, T., and Dresen, G. (2016). What controls the mechanical properties of shale rocks? – Part II: Brittleness. J. Pet. Sci. Eng. 144, 39–58. doi:10.1016/j.petrol.2016.02.022
Singh, S. P. (1989). Classification of mine workings according to their rockburst proneness. Min. Sci. Technol. 8, 253–262. doi:10.1016/s0167-9031(89)90404-0
Singh, S. P. (1988). Burst energy release index. Rock Mech. Rock Eng. 21 (2), 149–155. doi:10.1007/bf01043119
Sousa, L. R. E., Miranda, T., Sousa, R. L. E., and Tinoco, J. (2017). The use of data mining techniques in rockburst risk assessment. Engineering-Prc 3 (4), 552–558. doi:10.1016/j.eng.2017.04.002
Su, C. D. (2004). Testing study on the effect of crystal size and specimen length on the rockburst tendency. China. J. Rock Mech. Eng. 23 (22), 3750–3753.
Tang, L. Z., Pan, C. L., and Wang, W. X. (2002). Surplus energy index for analyzing rock burst proneness. J. Cent. South Univ. Technol. 33, 129–132.
Tarasov, B., and Potvin, Y. (2013). Universal criteria for rock brittleness estimation under triaxial compression. Int. J. Rock Mech. Min. 59, 57–69. doi:10.1016/j.ijrmms.2012.12.011
Tekalur, S. A., and Sen, O. (2011). Effect of specimen size in the Kolsky bar. Procedia Eng. 10, 2663–2671. doi:10.1016/j.proeng.2011.04.444
ISRM (2007). “The complete ISRM suggested methods for rock characterization, testing and monitoring: 1974–2006,” in Prepared by the commission on testing methods. Editors R. Ulusay, and J. A. Hudson (Ankara: ISRM).
Walton, G., Labrie, D., and Alejano, L. R. (2019). On the residual strength of rocks and rock masses. Rock Mech. Rock Eng. 52, 4821–4833. doi:10.1007/s00603-019-01879-5
Wang, H. T., He, M. M., Pang, F., Chen, Y., and Zhang, Z. (2021). Energy dissipation-based method for brittleness evolution and yield strength determination of rock. J. Pet. Sci. Eng. 200, 108376. doi:10.1016/j.petrol.2021.108376
Wang, H. T., He, M. M., Zhang, Z. Q., and Zhu, J. (2022a). Determination of the constant mi in the Hoek-Brown criterion of rock based on drilling parameters. Int. J. Min. Sci. Techno. 32 (4), 747–759. doi:10.1016/j.ijmst.2022.06.002
Wang, H. T., He, M. M., Zhu, J. W., Guo, S., and Chen, Y. (2022b). Experimental investigation of linear damping characteristics on granite and red sandstone under dynamic cyclic loading. Eur. J. Environ. Civ. En. 26 (11), 5259–5278. doi:10.1080/19648189.2021.1890230
Wang, H. T., and He, M. M. (2023a). Determining method of tensile strength of rock based on friction characteristics in the drilling process. Rock Mech. Rock Eng, doi:10.1007/s00603-023-03276-5
Wang, J., He, M. M., Yuan, Z. Y., Luo, B., and Ma, Y. D. (2023b). Ductile-brittle failure transition of rocks in process of drilling with high confining pressure: Model and experiment. J. Pet. Sci. Eng. 2023, 211505. doi:10.1016/j.geoen.2023.211505
Wang, J. A., and Park, H. D. (2001). Comprehensive prediction of rockburst based on analysis of strain energy in rocks. Tunn. Undergr. Space Technol. 16, 49–57. doi:10.1016/s0886-7798(01)00030-x
Wang, S. F., Li, X. B., Yao, J. R., Gong, F. Q., Li, X., Du, K., et al. (2019). Experimental investigation of rock breakage by a conical pick and its application to non-explosive mechanized mining in deep hard rock. Int. J. Rock Mech. Min. 122, 104063. doi:10.1016/j.ijrmms.2019.104063
Wasantha, P. L. P., Ranjith, P. G., Zhao, J., Shao, S. S., and Permata, G. (2015). Strain rate effect on the mechanical behaviour of sandstones with different grain sizes. Rock Mech. Rock Eng. 48 (5), 1883–1895. doi:10.1007/s00603-014-0688-4
Wei, M. D., Dai, F., Liu, Y., Li, A., and Yan, Z. L. (2021). Influences of loading method and notch type on rock fracture toughness measurements: From the perspectives of T-stress and fracture process zone. Rock Mech. Rock Eng. 54 (9), 4965–4986. doi:10.1007/s00603-021-02541-9
Wojtecki, L., Iwaszenko, S., Apel, D. B., and Cichy, T. (2021). An attempt to use machine learning algorithms to estimate the rockburst hazard in underground excavations of hard coal mine. Energies 14 (21), 6928. doi:10.3390/en14216928
Yang, B. B., He, M. M., Zhang, Z. Q., Zhu, J. W., and Chen, Y. S. (2022a). A new criterion of strain rockburst in consideration of the plastic zone of tunnel surrounding rock. Rock Mech. Rock Eng. 55 (3), 1777–1789. doi:10.1007/s00603-021-02725-3
Yang, F. J., Hui, Z., Xiao, H. B., Azhar, M. U., Yong, Z., and Chi, F. D. (2022b). Numerical simulation method for the process of rockburst. Eng. Geol. 306, 106760. doi:10.1016/j.enggeo.2022.106760
Yang, X., Ren, T., Tan, L., Remennikov, A., and He, X. (2018). Developing coal burst propensity index method for Australian coal mines. Int. J. Min. Sci. Technol. 28 (5), 783–790. doi:10.1016/j.ijmst.2018.08.008
Yumlu, M., and Ozbay, M. U. (1995). A study of the behaviour of brittle rocks under plane strain and triaxial loading conditions. Int. J. Rock Mech. Min. Sci. 32 (7), 725–733. doi:10.1016/0148-9062(95)00025-c
Zhang, X., Feng, G., Kang, L., and Yang, S. (2009). Method to determine burst tendency of coal rock by residual energy emission speed. J. China Coal. Soc. 34 (9), 1165–1168.
Keywords: rock burst proneness, post-peak dissipated energy index, strain rate, size effect, failure characteristics
Citation: Li X, Wang H, Zhao Y, Xue H and Li L (2023) Experimental investigation into rock burst proneness of rock materials considering strain rate and size effect. Front. Earth Sci. 11:1169750. doi: 10.3389/feart.2023.1169750
Received: 20 February 2023; Accepted: 17 March 2023;
Published: 13 April 2023.
Edited by:
Xuelong Li, Shandong University of Science and Technology, ChinaReviewed by:
Jiuyang Huan, Yangzhou Polytechnic Institute, ChinaYonggang Zhang, Tongji University, China
Copyright © 2023 Li, Wang, Zhao, Xue and Li. This is an open-access article distributed under the terms of the Creative Commons Attribution License (CC BY). The use, distribution or reproduction in other forums is permitted, provided the original author(s) and the copyright owner(s) are credited and that the original publication in this journal is cited, in accordance with accepted academic practice. No use, distribution or reproduction is permitted which does not comply with these terms.
*Correspondence: Haoteng Wang, SXJvbmhvb2ticm90aGVyQGdtYWlsLmNvbQ==