 Yazhou Liu1,2
 Jianhui Zeng
- 1State Key Laboratory of Petroleum Resources and Prospecting, China University of Petroleum (Beijing), Beijing, China
- 2College of Geosciences, China University of Petroleum (Beijing), Beijing, China
The Dongying Sag in eastern China is a mature exploration area and contains a wide variety of accumulations ranging from extra heavy oil to light oil. This multi-source lacustrine rift basin provides meaningful insights into the relationships between organofacies, maturity, charging, mixing, and oil properties. The Es3 source rocks are in the immature to mid-mature stage, while the Es4 source rocks are in the immature to late mature stage. Among them, Es4 source rocks were deposited in an anoxic, stratified, brackish water environment. Based on the kinetic model, it appears that the oil generation rate of Es4 source rocks is higher than that of Es3 source rocks, and the oil generation time of Es4 source rocks was earlier than that of Es3 source rocks. Whether in Es4 or Es3 members, source rocks with the kerogen type I have the greatest oil yield compared with other kerogens. The variations in oil physical and geochemical properties can be attributed to differences in organofacies and thermal maturity, which is in agreement with the results of source rock geochemistry and macerals analysis. Because the concentrations of maturity-related biomarkers or non-biomarkers show several orders of magnitude variation across maturity windows, these maturity parameters do not reliably characterize the maturity signals in mixed oil scenarios. Maturity parameters based on biomarker ratios can produce biases that overemphasize the contribution of low maturity oils and thus track the signals of low maturity end-member oils. In contrast, maturity parameters based on aromatic isomers are more sensitive to mixing processes and reflect the mixing degree of the accumulated oils. The same series of maturity parameters can track hydrocarbon migration pathways and relative maturity, while multiple series of maturity parameters can reconstruct hydrocarbon charging and mixing histories.
1 Introduction
Migration and accumulation models have evolved from simply predicting the presence or absence of hydrocarbons to predicting the hydrocarbon phase behavior, as well as their physical properties. Among these qualities, oil physical properties such as API gravity, dynamic viscosity and sulfur content can be used not only to evaluate the market value of oil, but also to decipher the processes of oil generation, migration, accumulation and alteration (Stainforth, 2004; Jahn et al., 2008; Dembicki, 2022). Unfortunately, no universal classification standard has been established worldwide for crude oils (Dandekar, 2006; Baur, 2019). In this work, the crude oil classification scheme of Feng et al. (2021) is followed: extra heavy oil (<10° API), heavy oil (10°–22.3° API), medium oil (22.3°–31.1° API), light oil (31°–50° API) and gas/condensate (>50° API). The expelled and captured oil shows a progressive evolution of physical properties and compositions at different maturity stages (Pepper and Corvi, 1995; di Primio and Horsfield, 2006). Generally, oil with low API gravity and high dynamic viscosity is either derived from products of low maturity source rocks, especially sulfur-rich source rocks, or the result of secondary alteration, such as biodegradation and water washing (Evans et al., 1971; Hughes, 1984; Jones, 1984; Orr, 1986). In contrast, oil with high API gravity and low dynamic viscosity often implies the products of high maturity or gas-prone source rocks (Hunt, 1991; Katz et al., 1991). Therefore, oil API gravity and dynamic viscosity depend not only on maturity or organofacies, but also on secondary alteration. Cornford et al. (1983) attributed the variations in petroleum properties in the United Kingdom. North Sea to differences in maturity of a single marine source rock (the Kimmeridge Clay Formation hot shales), followed by secondary alteration during migration or within the reservoir. Feng et al. (2021) compared the variations in API gravity of crude oils from three sags in the Erlian rift basin, attributing their differences to organofacies and thermal maturity of the same lacustrine source rock. However, there is a lack of systematic investigations on fluid properties and distribution in lacustrine multiple source systems.
Hydrocarbon accumulation is a dynamic balancing process, and accumulations are always in the process of adjustment and modification. The charging and leaking of hydrocarbons are mutually constrained and define the scale of hydrocarbon accumulations. Oil mixing has always been a characteristic of petroleum systems (Wilhelms and Larter, 2004; Larter et al., 2012; Wang et al., 2021; Huang et al., 2022). Reconstructing the charging and mixing histories cannot only provide insight into the hydrocarbon accumulation histories, but also guide the exploration of the next prospects. However, mixed oil generally includes the characteristics of each end member oil, resulting in conflicting or even opposite evaluation results of different geochemical parameters (Ross et al., 2010; Zhang et al., 2014). This also causes ambiguity in both reservoir accumulation process analysis and remaining resource potential evaluation. The obvious scenario for mixing is the charging of fresh oil into heavily biodegraded oil (Holba et al., 1996; George et al., 1998). Migration-contamination is another example of oil mixing (Curiale, 2002; Peters and Fowler, 2002). Nevertheless, not all end-member oils can be easily identified. For example, if a low-maturity oil is mixed with a high- or over-maturity oil, the biomarker maturity parameters of the mixed oil will show the characteristics of the low-maturity oil without reflecting the information of the high- or over-mature oil (Wilhelms and Larter, 2004; Wang et al., 2021; Huang et al., 2022).
The Dongying Sag is a typical lacustrine rift basin in eastern China. The multi-cyclic properties of sedimentary evolution and the diversity of source rock organic matter inevitably result in the complexity of hydrocarbon accumulation processes. Firstly, products generated at different maturity stages of source rocks have different geochemical properties and compositions; secondly, traps developed at different stages can capture hydrocarbons generated at different maturity stages; furthermore, accumulations can experience various secondary alteration processes, which make the composition and properties of hydrocarbons more complicated. Although many researchers have conducted in-depth studies on accumulation description and resource evaluation in this area (Li et al., 2003; Pang et al., 2005; Zhan et al., 2019; Niu et al., 2022), a comprehensive understanding of the oil properties is not available. In this work, there is also an attempt to decipher the deeper concepts of oil maturity using molecular maturity parameters based on biomarkers and aromatics, and to reconstruct oil charging and mixing histories.
2 Geological settings
The Bohai Bay Basin is considered to be one of the most important petroliferous basins in eastern China. The Dongying Sag is situated in the southeastern part of the Bohai Bay Basin (Figure 1A), covering an area of about 5,700 Km2, and is characterized by a “dustpan-shaped” lacustrine basin (Zhan et al., 2019; Wang et al., 2021). It is bordered by the Qingtuozi and Guangrao bulges to the east, the Luxi Uplift to the south, the Qingcheng and Binxian bulges to the west, and the Chenjiazhuang bulge to the north (Figure 1B). From north to south, the basin can be divided into five secondary tectonic zones: the northern steep-slope zone, the northern subsidence zone, the central fault-anticline zone, the southern subsidence zone, and the southern gentle-slope zone (Zhang et al., 2009; Guo et al., 2012). Furthermore, the depression can be further divided into five sags, namely, Minfeng, Niuzhuang, Guanglinan, Lijin, and Boxing sags (Figure 1B). The study area is located in the eastern part of the Dongying Depression, with an area of about 1900 Km2. It mainly includes Niuzhuang and Guanglinan sags, Wangjiagang and Bamianhe fault zones, and the southern gentle-slope zone.
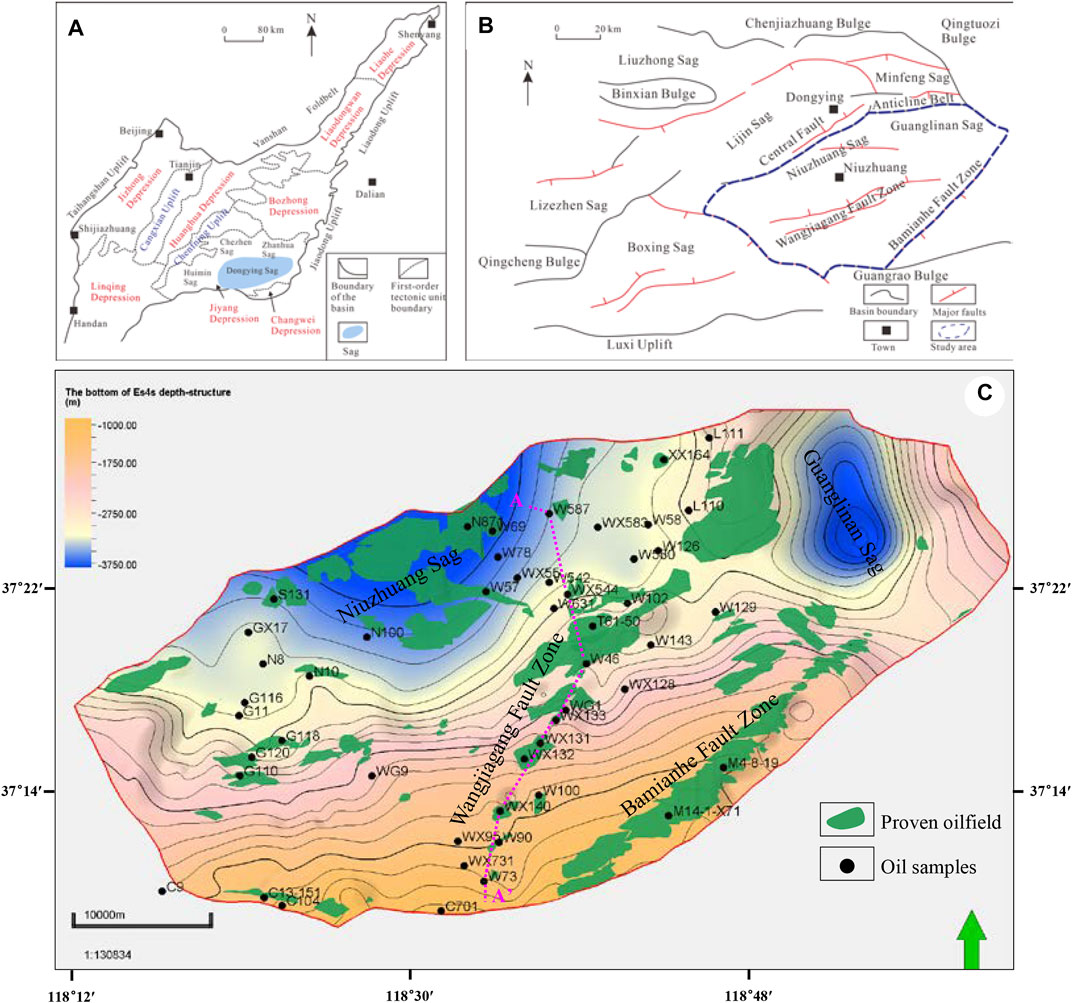
FIGURE 1. Geological map of the study area and oil samples. (A) Location map of the Dongying Sag (revised from Wang et al., 2019); (B) The major tectonic units in the Dongying Sag (revised from Shi et al., 2021); (C) Bottom the Es4s member depth structure map and oil sample location in the study area.
The Paleogene formations in the Dongying Sag are unconformably overlaid on Paleozoic crystalline basement (Figure 2). Based on the tectonic evolution history and sedimentary sequence, the Dongying Sag can be divided into two stages: syn-rift (65.0–24.6 Ma) and post-rift (24.6 Ma-present) (Xie et al., 2006). During the syn-rift stage, the sediments are mainly developed in the lacustrine environment. Sediments from the Paleogene Kongdian (Ek), Shahejie (Es), and Dongying (Ed) formations, as well as the Neogene Guantao (Ng), Minghuazhen (Nm), and Quaternary Pingyuan (Qp) formations, fill the Dongying Sag. The Kongdian formation mainly consists of shallow lake shale and siltstone interbedded with some sandstone, along with the development of different levels of red beds (Zhan et al., 2019; Tao et al., 2022). The Shahejie formation is dominated by semi-deep to deep lake mudstone and siltstone sediments and coarse deltic sandstone interbedded with conglomerates. The Dongying formation comprises sandstones, mudstones and some conglomerates that developed in deltaic and shallow lacustrine environments. The Guantao and Minghuazhen formations are characterized by braided stream conglomerates, sandstones and floodplain siltstones. During the late Oligocene and early Miocene, regional tectonic uplift caused different degrees of erosion throughout the Dongying Sag (Chang et al., 2018; Liu et al., 2018).
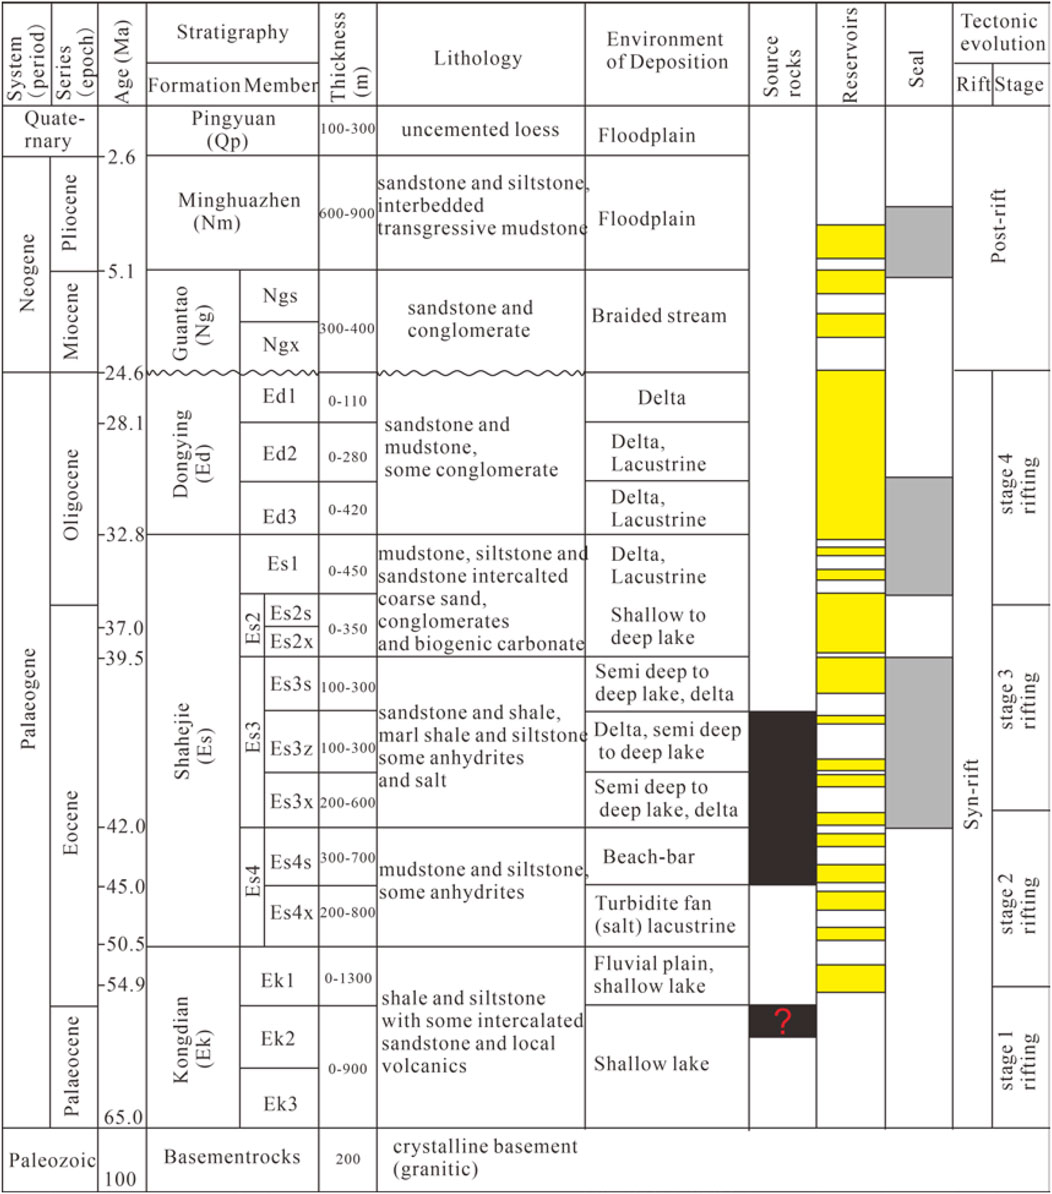
FIGURE 2. Generalized Palaeogene-Quaternary tectonic and sedimentary evolution stages and major petroleum system elements in the Dongying Sag (revised from Zahid et al., 2016).
Hydrocarbon generation and accumulation in the Dongying Sag is mainly distributed in the Paleogene formations (Tao et al., 2022). Previous studies have shown that three sets of primary source rocks were developed in the Eocene Shahejie formation, namely, Es4s, Es3x, and Es3z (Zhang et al., 2019; Song et al., 2020; You et al., 2020) (Figure 2). In addition, the Ek2 member is a potential set of source rocks (Wang et al., 2018). The source rocks of the Es3 and Es4 members were deposited in different paleoclimates. Among them, the Es4 member is characterized by hypersaline lacustrine sediments deposited under arid conditions, while the Es3 member is characterized by freshwater lacustrine sediments deposited under humid conditions (Wang et al., 2008; Hao et al., 2009; Wang et al., 2021). The turbidite fans and deltaic sandstones in the Es4 and Es3 members constitute the main reservoirs in the Dongying Sag (Guo et al., 2016; Wang et al., 2016; Tao et al., 2022).
3 Materials and methods
The database comprises 1020 crude oil samples and 550+ source rock samples, from which physical properties, reservoir saturation pressure, gas chromatography-mass spectrometry (GC-MS), and total organic carbon (TOC), Rock-Eval pyrolysis and vitrinite reflectance were available. The locations of the oil samples are shown in Figure 1C. There is a typical oil sample for almost every proven oilfield in the basin. Compounds in the saturated and aromatic hydrocarbon fractions were analyzed in the PRG laboratory at the University of Calgary using an Agilent 7890B gas chromatograph attached to an Agilent 5977A MSD system. The detailed procedures and experimental settings are the same as those described by Bennett et al. (2022). Two internal standards, cholestane-d4 was used to calculate the absolute concentrations of steranes, while dibenzothiophene-d8 was used to calculate the absolute concentration of methyl-dibenzothiophene. The relative response factors of the target compounds to the internal standards were considered to be one. To ensure the accuracy of the data, one blank sample and one duplicate sample were treated in the same way as the other samples. Organic petrographic observations of the source rocks were made with a Leica DMRXP microscope under reflected light and fluorescent light.
4 Results
4.1 Fluid characteristics
4.1.1 Physical properties
The physical properties of crude oil at each formation in the study area are presented in Table 1 and Figure 3, indicating good correlations between API gravity and other physical parameters and bulk chemical properties including dynamic viscosity, sulfur content, pour point and wax content. In Figure 4, the proven reservoir pressures are higher than the saturation pressures, indicating that the present reservoirs are unsaturated and secondary alteration processes have had little effect on the physical properties of the crude oil. The physical properties of crude oil from different formations in the study area show significant variations; therefore, this provides the opportunity to explore the factors influencing the physical properties in the natural laboratory.
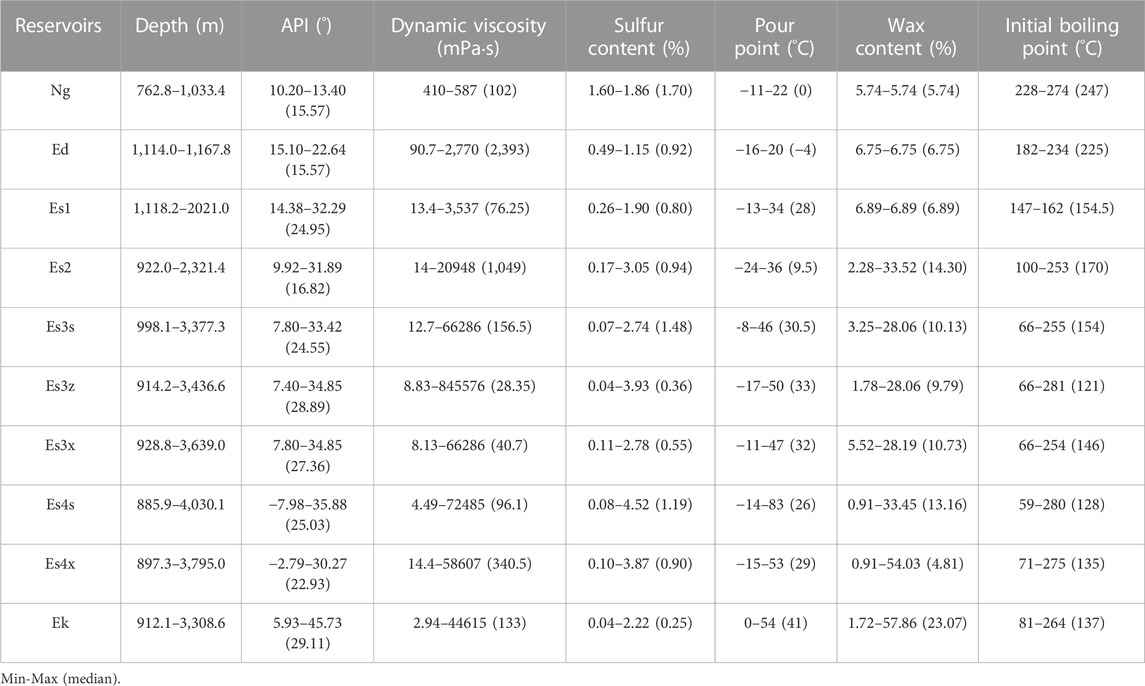
TABLE 1. Physical properties of crude oil from different formations in the study area.
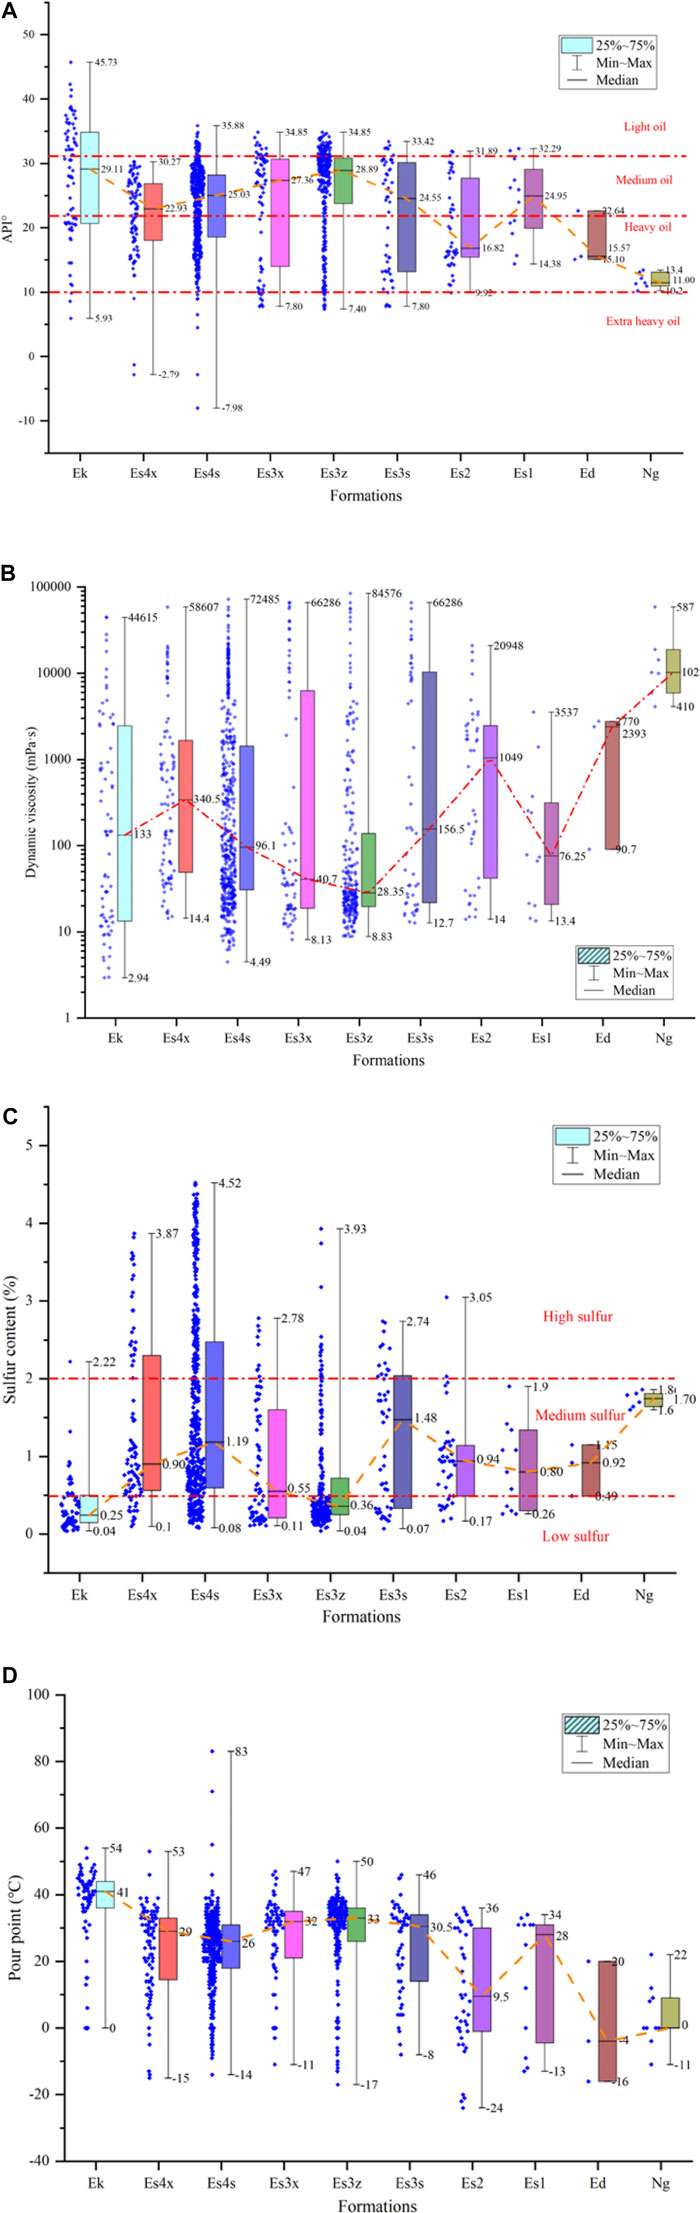
FIGURE 3. Box plots showing the variation of crude oil physical properties in different formations. (A) API gravity. (B) Dynamic viscosity. (C) Sulfur content. (D) Pour point.
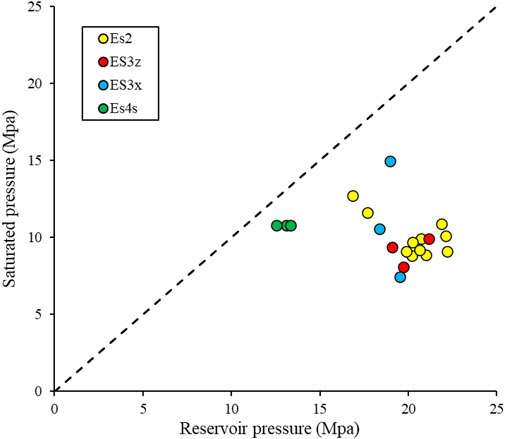
FIGURE 4. Plot of reservoir pressure versus saturation pressure for different formations in the study area.
In terms of crude oil density (Figure 3A), the crude oil in the study area is dominated by heavy-medium oil; among them, crude oil in the Es4, Es3s and above members are heavier compared with the crude oil in other members. In terms of dynamic viscosity (Figure 3B), the dynamic viscosity of crude oils in Es3x [8.13–66286 (40.7) mPas] and Es3z [8.83–84576 (28.35) mPas] members are lower than that of other members. In terms of sulfur content (Figure 3C), the crude oil in the study area is characterized by medium sulfur. Among them, the Ek [0.04–2.22 (0.25)%], Es3x [0.11–2.78 (0.55)%] and Es3z [0.04–3.93 (0.36)%] crude oils have lower sulfur contents compared with other members. In terms of pour point (Figure 3D), the Ek [0–54 (41)°C], Es3x [−11–47 (32)°C] and Es3z [−17–50 (33)°C] crude oils have higher pour points compared with other members. This series of phenomena indicates some variations in organofacies, thermal maturity and charging and mixing processes. The API gravity of crude oil shows a poor correlation with present-day reservoir depth (Figure 5A). Likewise, the dynamic viscosity of the oil correlates poorly with current depth (Figure 5B). Some oil samples at the same depth differ in dynamic viscosity by several orders of magnitude. Interestingly, the density and dynamic viscosity of some oil samples from the Ek Formation are lower than those of crude oil from other formations at the same depth.
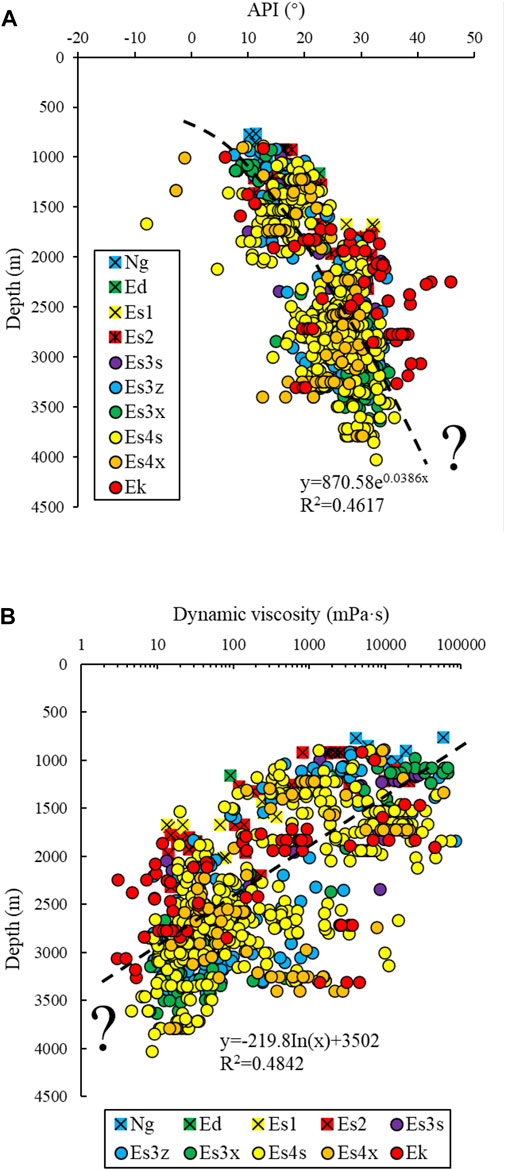
FIGURE 5. Trends of (A) API gravity and (B) dynamic viscosity of oil samples with present-day reservoir depth.
4.1.2 Geochemistry characteristics
Figure 6 and Table 2 present representative mass chromatograms of the aliphatic fractions for representative crude oil samples and the related biomarker ratios. Most of the crude oil samples show no biodegradation and have complete normal alkane distributions. However, crude oils in shallow reservoirs (<1,300 m) show slight biodegradation and mixing (Figure 6). For example, crude oil from well C104 experienced multiple episodic charges of varying maturities and origins, where highly mature crude oil was mixed into immature fractions (Wang et al., 2021). The crude oil samples from different formations do not show odd-to-even carbon number predominance, revealing that these oils are considered to be expelled from source rocks with a maturity equivalent to a vitrinite reflectance (% Ro) higher than 0.5%. Moreover, the relative abundances of acyclic isoprenoids, tricyclic terpenes, gammacerane, and C30 4α-methylsteranes in crude oil from different formations show different degrees of variation. A small number of crude oil samples from the Ek formation show high relative abundances of gammacerane due to the cracking of hopanes (Zhang et al., 2020).
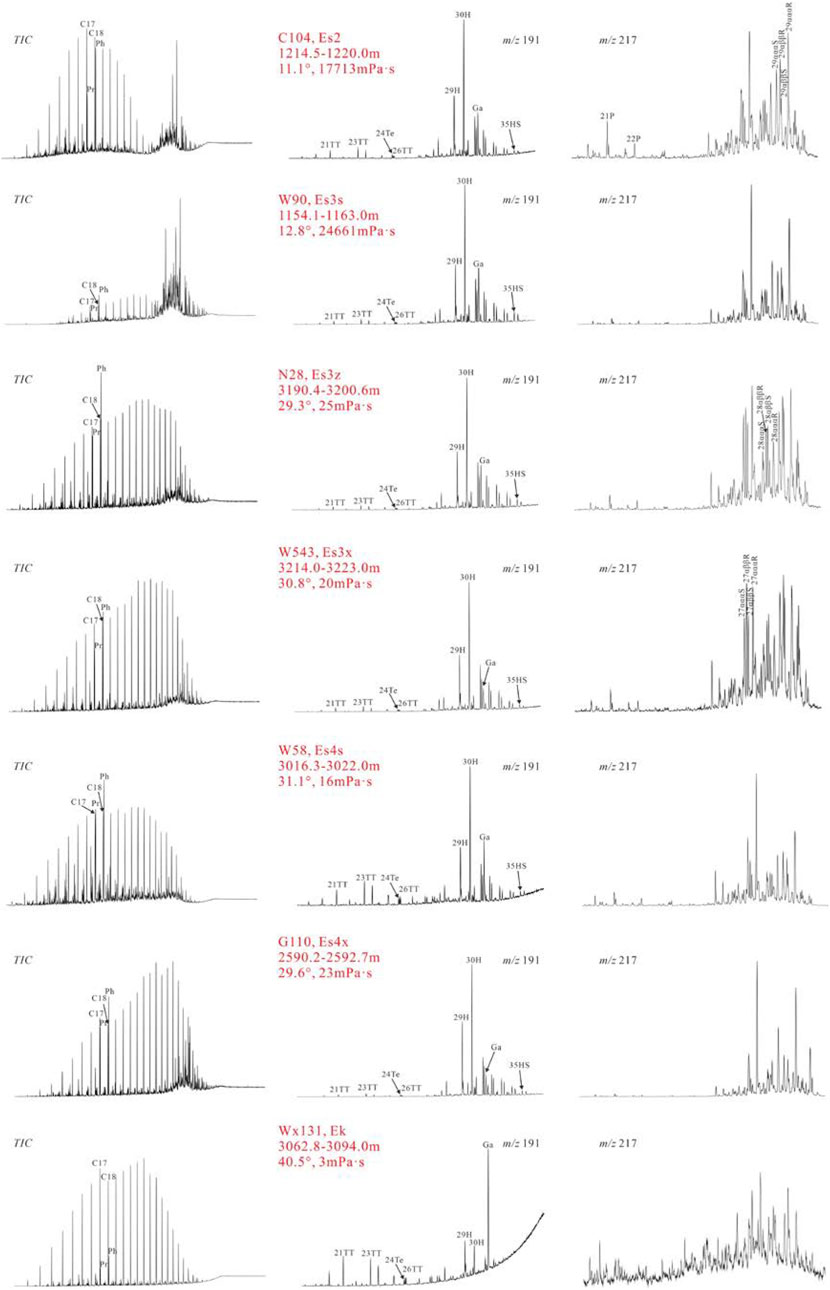
FIGURE 6. Representative gas chromatograms, m/z 191 and 217 mass chromatograms from oil samples showing the distribution of aliphatic fractions. Key: C17, C17 normal alkane; Pr, Pristane, Ph, Phytane; 21TT, C21 tricyclic terpane; 24Te, C24 tetracyclic terpane; 30H, C30 αβ hopane; Ga, Gammacerane; 35HS, C35 αβ 22S homohopane; 21P, C21 ααα pregnane; 22P, C22 ααα homopregnane; 27αααS, C27 ααα 20S sterane.
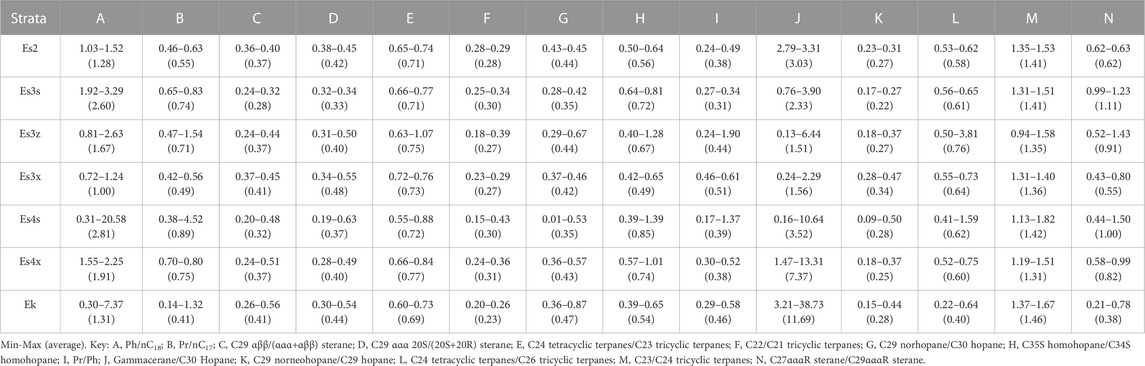
TABLE 2. Maturity-, lithology-, depositional environment- and source-related biomarker ratios for crude oil samples from different formations in the study area.
The maturity parameters [Pr/n-C17 and Ph/n-C18, C29 ααα 20S/(20S + 20R) and C29 αββ/(ααα + αββ)] also indicate variations in the maturity of crude oils from different formations (Figures 7A, B). The C29 sterane isomerization parameters, Pr/n-C17 and Ph/n-C18, of the crude oil from the Ek formation reveal the highest maturity among all the formations. These crude oils are considered to have been expelled from source rocks with vitrinite reflectance (% Ro) above 1.0. The number of crude oil samples from the Es4s member is relatively high and is a mixture of maturity products (a full maturity spectrum oil) ranging from immature to late-mature. Furthermore, oil samples from the Es3x and above formations are dominated by early-mature to peak-mature. Various tricyclic terpanes and hopanes ratios, such as C22/C21TT, C24/C23TT (Figure 7C) and C29/C30 hopane, C35S/C34S homohopane (Figure 7D) are employed to differentiate the lithologies of source rocks (Zumberge, 1984; Connan et al., 1986; Mello et al., 1988). Based on these, it can be inferred that all oil samples in the study area are derived from lacustrine shale depositional environments. Obvious differences in biomarker ratios reflecting variations in water column stratification can be observed between oil samples from different formations. The Pr/Ph and Ga/C30H ratios are widely used as indicators of redox conditions and water column stratification during source rock formation (Moldowan et al., 1985; Ten Haven et al., 1987). The Pr/Ph ratios of crude oil in different formations are almost all lower than 0.8, representing anoxic conditions (Figure 7E). Gammacerane is more abundant in most of the crude oils from the Ek and Es4 formations compared to those from other formations, suggesting that the source rocks are formed in water column stratification or hypersaline environments. Other depositional environmental indicators, such as C29Ts/C29H and C29/C30H, also indicate that these crude oils originate from source rocks in anoxic environments (Figure 7F). These depositional environmental indicators illustrate an anoxic environment when the source rocks were formed. Among them, the source rocks for the crude oil in the Es4 and Ek formations were deposited in an anoxic, stratified, brackish water environment. The Pr/n-C17 and Ph/n-C18 ratios in Figure 7A demonstrate that the crude oil samples from the different formations are distributed in the area interpreted as the algal source. The higher C23TT/C24TT ratio is compatible with the lower C24Te/C26TT ratio (<1), further suggesting that these crude oils are derived from source rocks containing algal organic matter and were deposited under anoxic environmental conditions (Figure 7G). The relative abundances of C27 αααR sterane and C29 αααR sterane in the analyzed crude oil samples demonstrate the contribution of algae and terrestrial land plants to the source rocks. Among them, oil samples from the Ek formation have more terrigenous organic matter input, while oil samples from the Es4s and Es3z members have more algal organic matter input, and other oil samples are intermediate between them (Figure 7H).
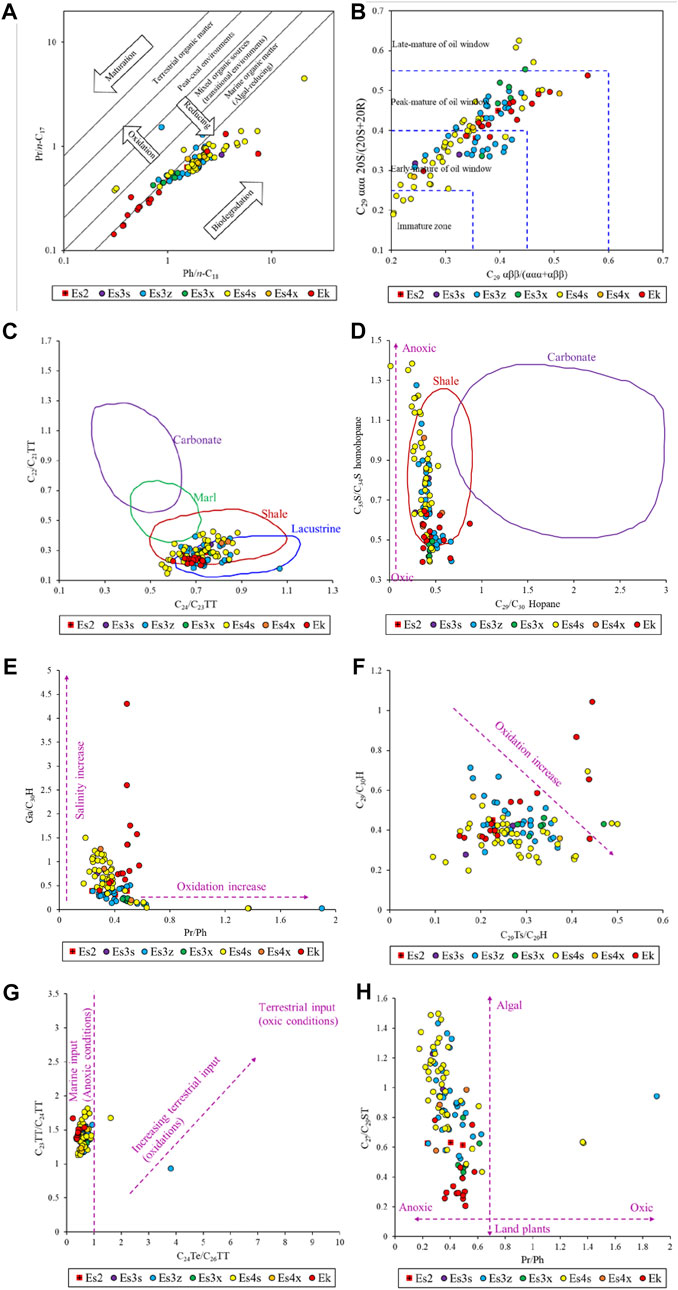
FIGURE 7. Scatter plots of maturity, lithology depositional environment and source indicators showing the variations of oil samples from different formations. (A) Pr/n-C17 and Ph/n-C18. (B) C29 αββ/(ααα+αββ) and C29 ααα 20S/(20S+20R). (C) C24/C23 TT and C22/C21 TT. (D) C29/C30 Hopane and C35S/C34S homohopane. (E) Pr/Ph and Ga/C30H. (F) C29Ts/C29H and C29/C30H. (G) C24Te/C26TT and C23TT/C24TT. (H) Pr/Ph and C27/C29ST. [(A) revised from Shanmugam, 1985; (B) revised from Hakimi et al., 2022; (C,D) revised from Al-Khafaji et al., 2022].
4.2 Source rock characteristics
4.2.1 Natural maturity shale sequences
Plots of source rock geochemical parameters such as %Ro, S1/TOC and HI as a function of burial depth or formation temperature are commonly employed to characterize petroleum formation within source rocks under natural maturity sequences (Wilhelms et al., 1998). These curves can quantitatively show the process of petroleum (C15+ hydrocarbons) generation and delineate maturity zones (Cornford et al., 1983). Figures 8A, B show the geochemical parameters of the source rocks in the Es3 and Es4 members under natural conditions as a function of burial depth. Based on the shape of the bell curve, some differences in the maturity zones of the source rocks in the Es3 and Es4 members can be found. The maturity zones of source rocks in the Es4 member can be divided into four zones, namely, immature zone—no significant increase in hydrocarbon generation (<2800 m); early mature zone-increase in hydrocarbon generation (2800–3000 m); mid mature zone—peak hydrocarbon generation (3000–3500 m); late mature zone—heavy hydrocarbon cracking to lighter products (>3500 m). The maturity zones of source rocks in the Es3 member can be classified into three zones, i.e., immature zone (<3000 m); early mature zone (3000–3300 m); mid mature zone (>3300 m). From this, it can also be found that the source rocks from the Es4 member enter the thresholds of their respective maturity zones earlier than those from the Es3 member. Assuming that the hydrocarbons generated from source rocks are retained in situ and there is no disturbance of migrating hydrocarbons, the S1/(S1+S2) ratio can approximately characterize the transformation ratio of source rocks. Although this assumption is difficult to validate, it can also be observed from Figure 8 that the transformation ratio of source rocks in the Es4 member is higher than that of the Es3 member source rocks. Interestingly, the vitrinite reflectance and molecular thermal maturity indicators are not consistently distributed in the study area, especially for source rocks entering the hydrocarbon generation threshold. Previous studies have shown that the high hydrogen-rich alginite content has a suppressive effect on the vitrinite reflectance in the studied lacustrine shales (Guo et al., 2010; Chen et al., 2019). As discussed above, this phenomenon is consistent with the results of the interpretation of molecular source parameters from crude oil samples (Figure 7A, G, H).
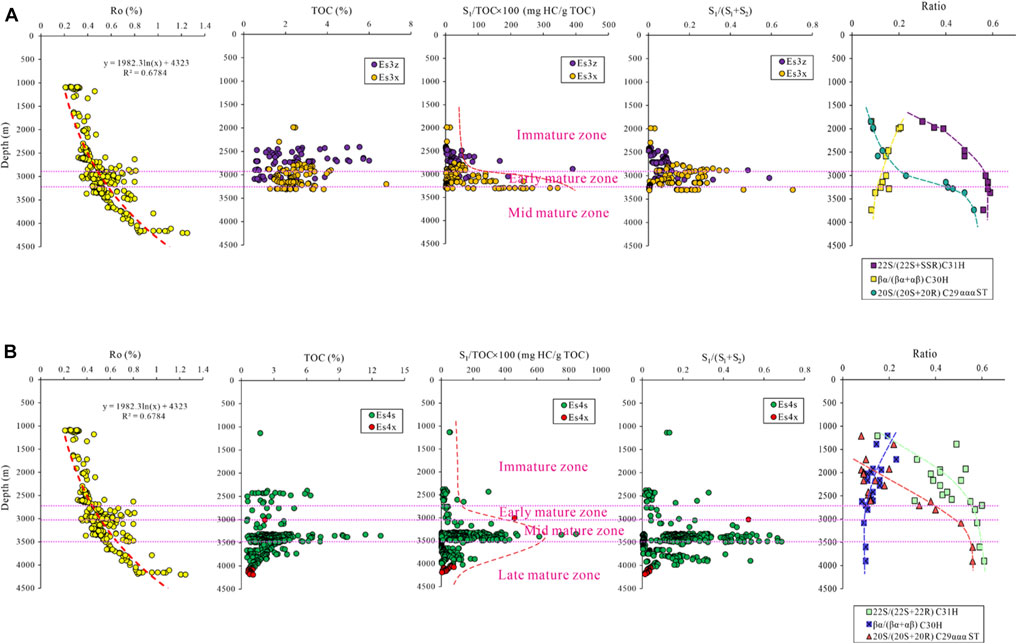
FIGURE 8. Oil generation expressed by %Ro, TOC, S1/TOC, S1/(S1+S2), and biomarker maturity ratios of source rocks with burial depth. The maturity zones are determined by the shape of the curves, and the sterane and hopane ratios of the source rock extracts (Wilhelms et al., 1998). (A) Es3 member. (B) Es4 member.
4.2.2 Kinetic modeling
Table 3 and Figure 9 illustrate the Rock-Eval pyrolysis results and associated activation energy distributions for source rock samples of different organic matter types in the Es3 and Es4 members. Hydrocarbon generation kinetic data differ for samples from different organic matter types and members. When fixing the frequency factor A at 5.0E+15/min, the activation energy of the whole rock ranges from 49 to 54 kcal/mol (Figures 9A, B); And, when the frequency factor A is at 1.0E+18/min, the activation energy of the whole rock is between 45 and 75 kcal/mol (Figures 9C–J). Under the conditions of similar frequency factors, the main peaks of activation energy distributions of the Es4 source rocks are lower than those of the Es3 source rocks, revealing that the Es4 source rocks generate oil earlier than the Es3 source rocks. The distribution of activation energy becomes broader and more scattered in order from kerogen type I to II2. The whole rock of FY1-6 has narrower activation energy distributions (63–74 kcal/mol) than the other samples, indicating that the organic matter in the FY1-6 whole rock samples has higher thermal stability than the other samples (Figure 9F). These kinetic experimental results are extrapolated to geological conditions at a constant geological heating rate (3°C/Ma) using the KMOD program. Figure 10 shows the oil generation rate and transformation ratio from different source rocks under geological conditions. It can be observed that the kerogen type I in Es4 source rocks reaches the peak oil generation earlier than in Es3 source rocks (Figures 10A, B). The oil generation rate decreases sequentially from kerogen type I to II2, regardless of whether it is in the Es3 or Es4 member. Given a surface temperature of 15°C and a geothermal gradient of 30°C/km, the products of kerogen type I from the Es3 and Es4 source rocks are both dominated by oil, and more than 90% of the kerogen has been transformed into oil at 120°C, corresponding to a depth of ca. 3,600 m (Figures 10C, D). However, the conversion of kerogen type II1 and II2 to oil needs to occur at greater depths. The transformation ratio curves of both Es3 and Es4 source rocks suggest that kerogen type I makes a major contribution to the distribution of hydrocarbon resources in the study area.
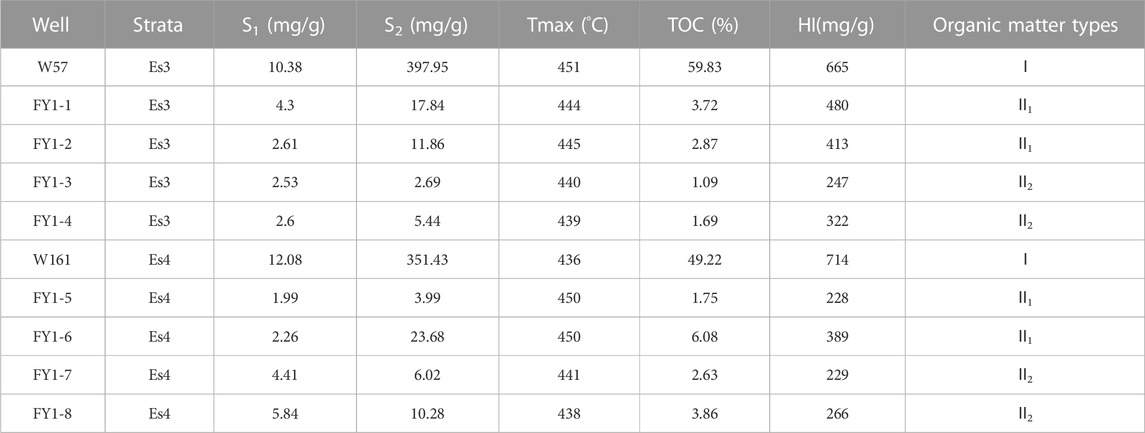
TABLE 3. Results of Rock-Eval pyrolysis of source rocks with different organic matter types in the Es3 and Es4 members. The determination of organic matter types is based on Tmax and HI (Espitalié et al., 1985). Note that the data for these samples were obtained from the published literature (Li et al., 2018; Sun et al., 2019).
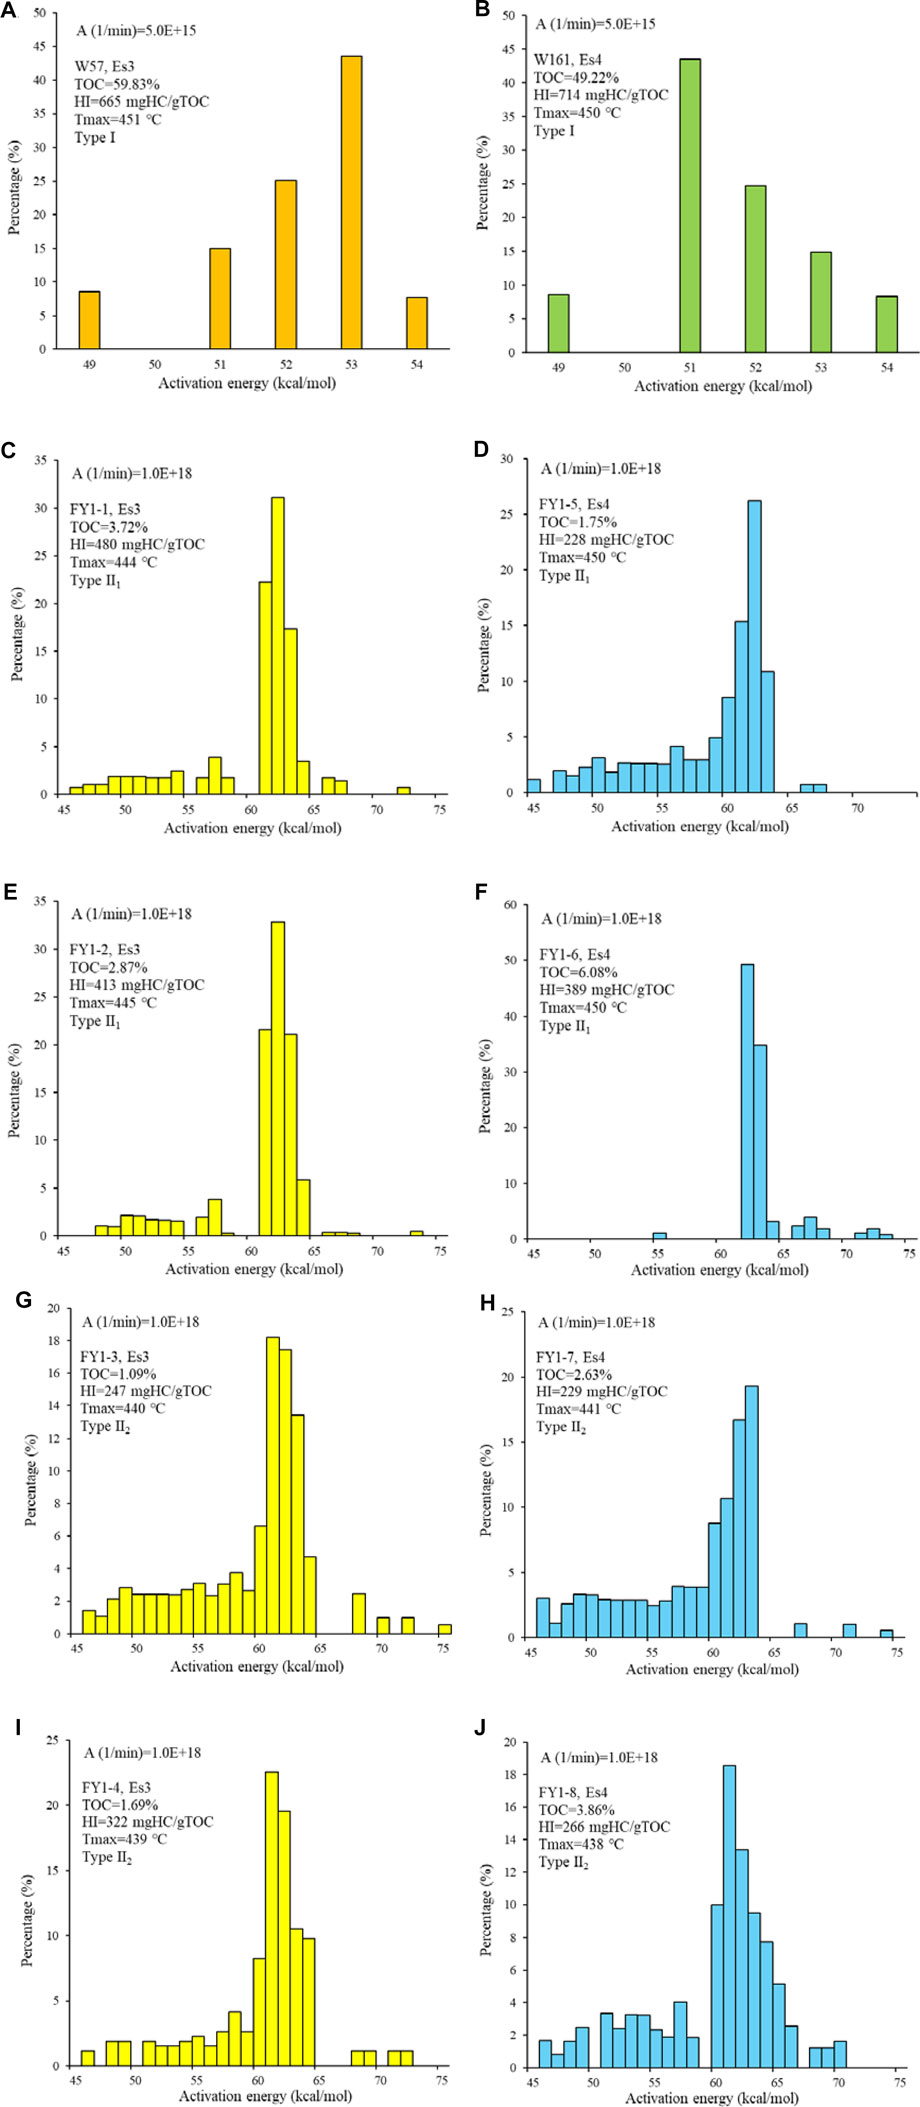
FIGURE 9. Activation energy distribution and frequency factor of source rocks with different organic matter types in the Es3 and Es4 members. (A) W57. (B) W161. (C) FY1-1. (D) FY1-5. (E) FY1-2. (F) FY1-6. (G) FY1-3. (H) FY1-7. (I) FY1-4. (J) FY1-8. The determination of organic matter types is based on Tmax and HI (Espitalié et al., 1985). Note that the data for these samples were obtained from the published literature (Li et al., 2018; Sun et al., 2019).
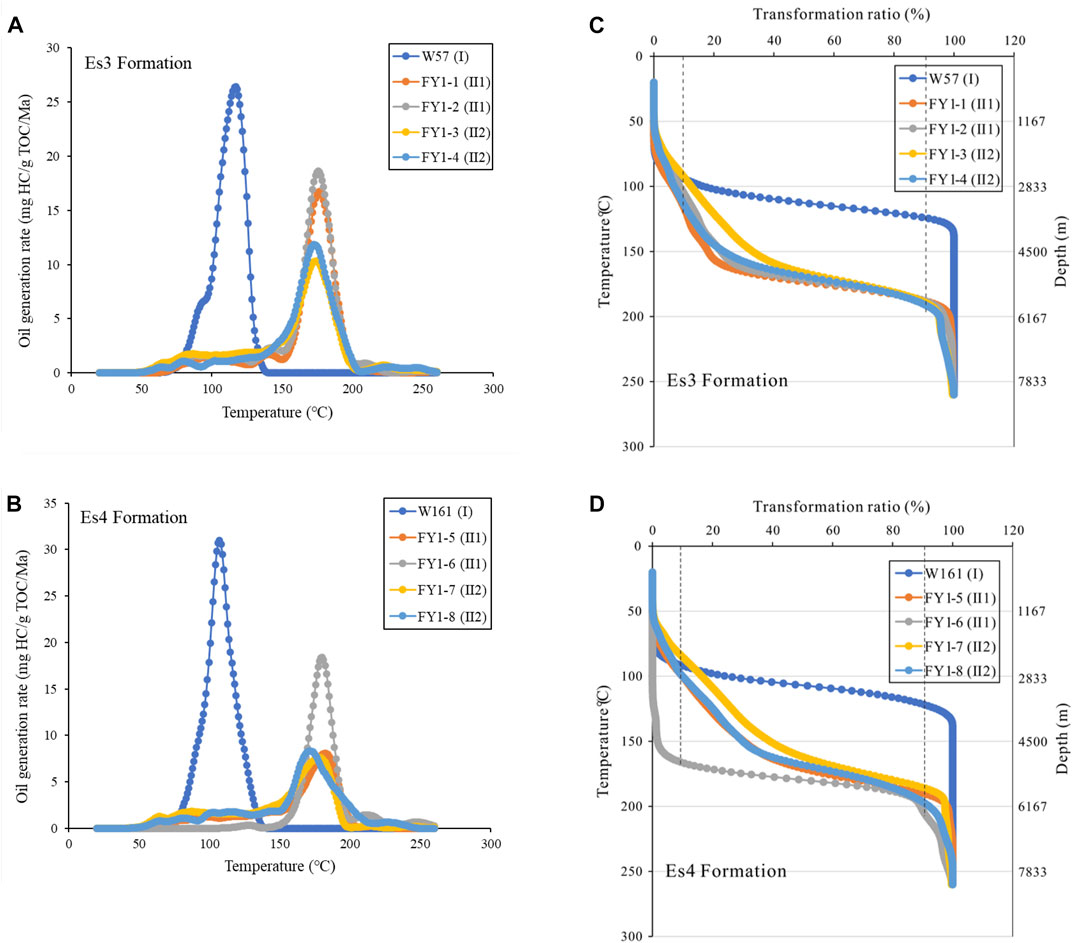
FIGURE 10. Geological extrapolation to obtain oil generation rates and transformation ratios from kinetic experimental results of the Es3 and Es4 samples assuming a geological heating rate of 3°C/Ma. (A) Oil generation rate versus temperature in the Es3 formation; (B) Oil generation rate versus temperature in the Es4 formation; (C) Transformation ratio versus temperature and depth in the Es3 formation; (D) Transformation ratio versus temperature and depth in the Es4 formation.
The hydrocarbon generation characteristics of lacustrine source rocks containing type I kerogen have been extensively studied in different basins around the world. Degradation of kerogen in the study area is characterized by extremely narrow activation energy distributions with peaks at 53 and 51 kcal/mol, respectively, indicating that type I kerogen is more stable (Figures 9A, B). Similar, very narrow activation energy distributions have been observed for the Qingshankou Mudstone in the Songliao Basin (Zhou and Littke., 1999), the Green River Shale in the Uinta Basin (Dieckmann, 2005), the Bryne Mudstone in the SØGNE Basin (Petersen et al., 2011), the Wenchang Mudstone in the Pearl River Mouth Basin (Li et al., 2016), the Yacoraite Shale in the Salta Basin (Romero-Sarmiento et al., 2019) and the Sleipner Mudstone of Utsira High (Killops et al., 2022) (Table 4). The narrow activation energy distribution is usually associated with the predominance of aliphatic chains in type I kerogen (Behar and Vandenbroucke, 1987). Compared with other lacustrine source rocks containing type I kerogen, there are some differences in the petroleum generation kinetic parameters of the study area. The lower values of single activation energy of the source rocks in the study area indicate slightly lower thermal stability, which is beneficial to the formation of abundant hydrocarbon resources (Table 4).
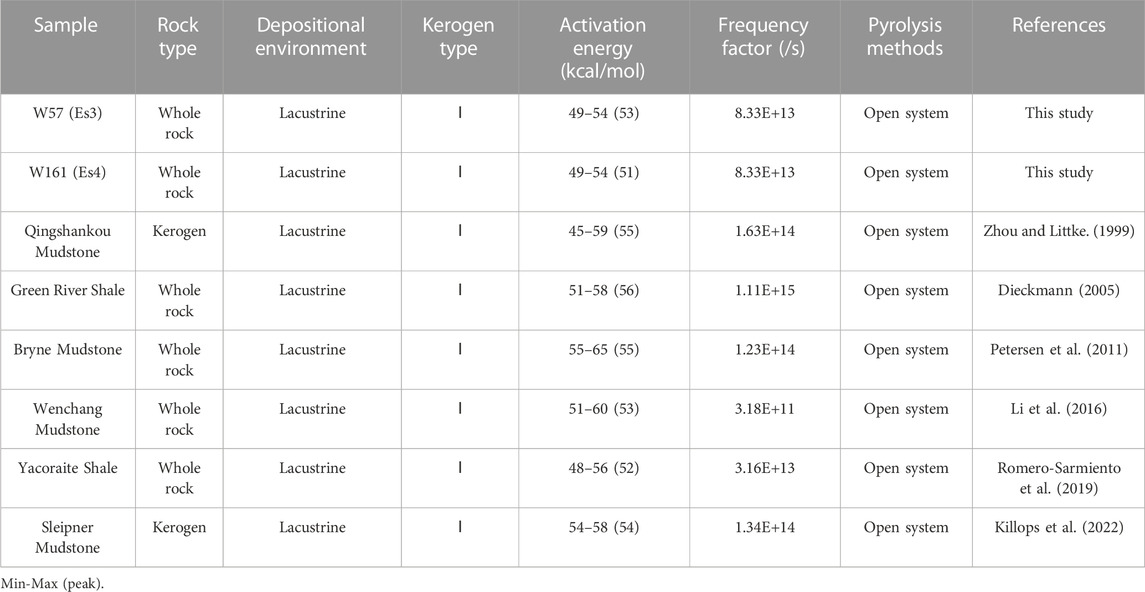
TABLE 4. Summary of some published kinetic experiments on lacustrine source rocks containing type I kerogen.
5 Discussion
5.1 Thermal maturity and physical properties
The compositional variations in molecular structure, attributed to maturation, were previously identified by plotting source rock extraction data versus sample depth (Mackenzie et al., 1981; Chandra et al., 1994). Based on these, a large number of maturity indicators are built (Tissot et al., 1987). However, care must also be taken in the interpretation of such indicators, as reservoir oils are often mixtures, derived from products of different evolutionary stages of the same source rock or multiple source rocks (Wilhelms and Larter, 2004). Thus, reservoirs at different locations in the basin may successively capture the products of early, early + medium, and early + medium + late mature source rocks (Figures 8A, B). The type of hydrocarbons ultimately captured in the reservoir depends on the hydrocarbon generation, hydrocarbon expulsion, migration pathways and the effectiveness of the traps. In the absence of effective hydrocarbon expulsion, the hydrocarbons may be retained in situ until the products saturate the source rocks, with the eventual expulsion of mid to late mature products. In addition, the retained hydrocarbon amount depends largely on the hydrocarbon generation and carrier systems in many lacustrine depositional systems. The potentially greater hydrocarbon generation and lack of well-developed carrier systems can result in a more limited ability to expel and mobilize oils, thereby increasing the viability of these potential unconventional plays (Katz and Lin, 2014). It is to be noted when using maturity molecular parameters that the early mature oils are relatively small in volume but usually contain high concentrations of biomarkers. The medium- and late-mature oils are relatively large in volume, but the concentrations of biomarkers are decreased by multiple orders of magnitude (Wilhelms and Larter, 2004; Huang et al., 2022). Thus, the maturity molecular indicators obtained from the reservoir oils are only a qualitative indicator of the range of the source rock maturities indicating their contribution to the oils captured in the reservoirs (Cornford et al., 1983). The two C29 sterane isomerization parameters [20S/(20S+20R) and αββ/(αββ+ααα)] are effective in assessing maturity from immature to late maturity windows (Mackenzie et al., 1983; Beaumont et al., 1985; Peters et al., 1996). However, Seifert and Moldowan (1981) suggested αββ/(αββ+ααα) C29 steranes as a migration indicator based on laboratory simulations. Therefore, the 20S/(20S+20R) C29 ααα steranes are adopted in this paper to characterize the oil maturity. Based on the relationships between the 20S/(20S+20R) C29 ααα and API gravity and dynamic viscosity of crude oils, It can be seen that the density and dynamic viscosity of the crude oils decrease with increasing crude oil maturity (Figures 11A, B). It further indicates that capturing crude oils with medium to late maturity is beneficial to improve reservoir oil physical properties. It is worth noting that crude oils in the early mature or peak oil windows have significantly different API gravities and dynamic viscosities, suggesting that their physical properties are also influenced by other factors.
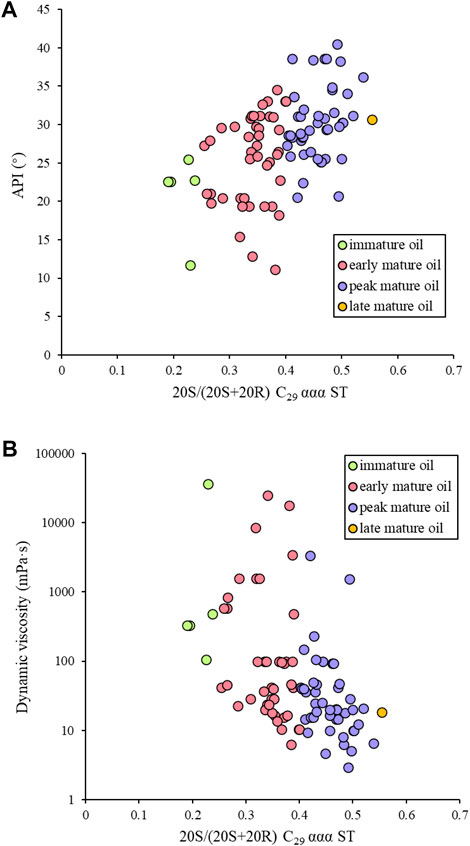
FIGURE 11. Scatter plots of the 20S/(20S+20R) C29 ααα ST against API gravity (A), dynamic viscosity (B).
5.2 Organofacies variation and physical properties
Organicfacies refer to a class of kerogen assemblages that originate from the same organic precursors and have experienced similar depositional environments and early diagenesis (Pepper and Corvi, 1995). Source rocks with different organicfacies generate distinctly different products during thermal evolution, including physical and geochemical properties (di Primio and Horsfield, 2006; Baur, 2019; Feng et al., 2021). In this paper, the classification scheme of lacustrine source rocks proposed by Pepper and Corvi (1995) is adopted, namely, organicfacies C, D/E, and F. Organicfacies C are oil-prone source rocks. The organic matter in these source rocks is mainly derived from algae and bacteria, and large quantities of lamalginites and telalginites can be observed under the microscope. In the immature stage, the hydrogen index (HI) of organicfacies C source rocks generally exceeds 400 mg HC/g TOC. Organicfacies D/E and F are gas-prone source rocks that are mainly developed in environments with high terrestrial organic matter input. The HI of organicfacies D/E source rocks generally ranges from 200 to 400 mg HC/g TOC in the immature stage, while the HI of organicfacies F source rocks is generally less than 200 mg HC/g TOC. The maceral composition of these two organofacies is dominated by vitrinite and inertinite. The relative frequency distribution histograms of HI for source rocks in different members are shown in Figure 12. The source rocks in Es4s and Es4x mainly consist of organicfacies C (Figures 12C, D), while those in Es3z and Es3x are characterized by organicfacies D/E and F (Figures 12A, B), suggesting that the input of terrigenous organic matter increases from Es4 to Es3 members. The organic macerals of the source rocks in the study area are mostly composed of algal-derived liptinite macerals, including lamalginite, bituminite, and vitrinite (Figure 13). These characteristics are consistent with the geochemical characteristics of the crude oils (Figures 7A, G, H). The analysis of organicfacies and organic petrology of source rocks suggests that the quality of source rocks in different members is mainly due to the different relative proportions of algae and terrigenous organic matter in kerogens. Source rocks with different organicfacies present different oil expulsion thresholds and physical properties of crude oils (Pepper, 1991; Petersen, 2017). The source rocks with greater HI values expel oil earlier and more efficiently (Pepper, 1991; Feng et al., 2021), which is consistent with the actual conditions in the study area. Compared with Es3 crude oils, Es4 crude oils have higher density, dynamic viscosity and sulfur content, covering a wide thermal maturity range from immature to late mature.
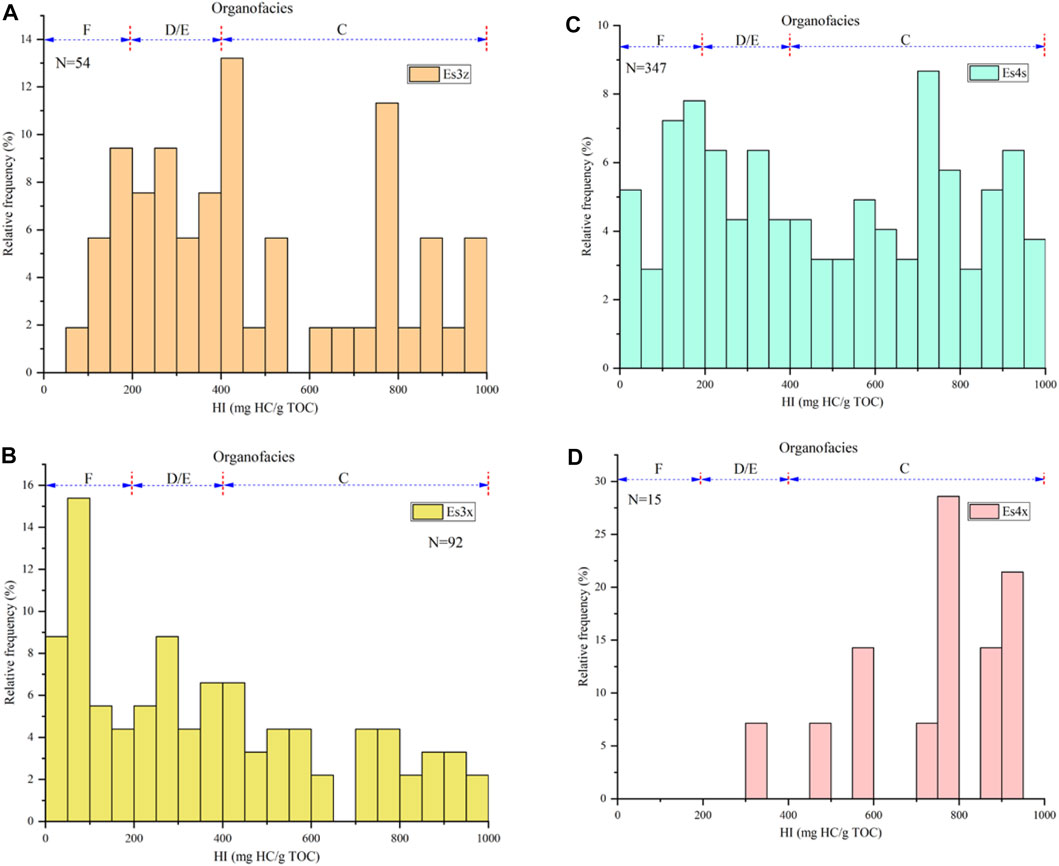
FIGURE 12. Relative frequency distribution histogram of HI for source rocks in different members. (A) Es3z member; (B) Es3x member; (C) Es4s member; (D) Es4x member.
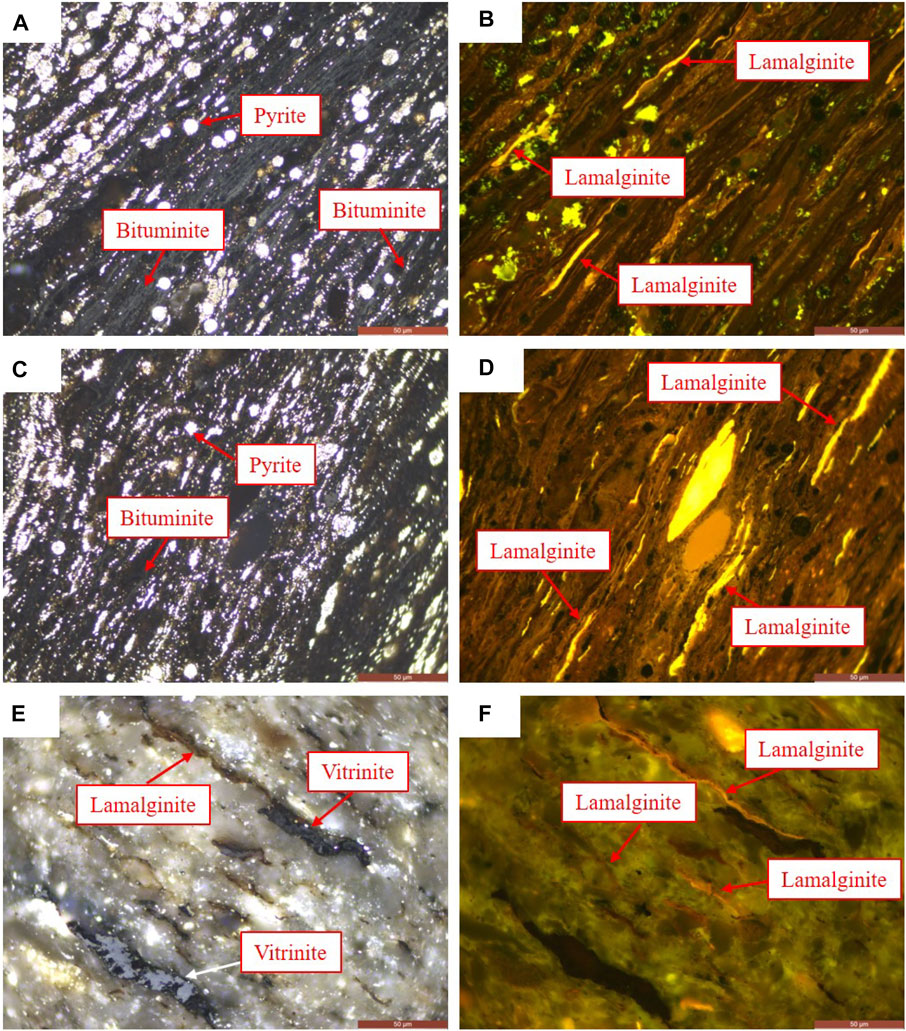
FIGURE 13. Organic macerals in source rocks from the study area, including lamalginite, bituminite and vitrinite; (A,C,E) under reflected light; (B,D,F) under fluorescent light.
5.3 Charging and mixing process
Thermal maturation of organic matter is a temperature/time-driven disproportionation reaction that converts sedimentary organic matter into oil and gas (Peters and Cassa, 1994). Although maturity is one of the most widely used terms in petroleum geology, its actual meaning is rarely defined, resulting in many confusing and conflicting evaluation results. However, determining the oil maturity is important for understanding the oil generation and expulsion process, accumulation history and exploration potential evaluation. Because crude oils are fluid, oils captured in the reservoirs may originate from products formed in different evolutionary stages of a single uniform source rock or from multiple source systems. Thus, nearly all reservoir oils are complex mixtures that have experienced charging at different times or with different source rock types. Those different molecular maturity parameters (biomarkers and non-biomarkers) represent different maturity levels, but none of them reflect the maturity of crude oil. The molecular maturity parameters currently utilized to assess crude oil maturity are based on the relative abundance of two stereoisomers (Seifert and Moldowan, 1978; Radke et al., 1982; Grantham, 1986; Radke et al., 1986). During thermal evolution, the absolute concentration of the less stable isomers decreases relatively, while the absolute concentration of the more stable isomers increases relatively. The absolute concentrations of different compounds in crude oil vary greatly from the dead oil to the condensate stage (Wilhelms and Larter, 2004). While the concentrations of n-alkanes and isoprenoid hydrocarbons (pristane and phytane) in crude oils vary essentially by 1-2 orders of magnitude, the absolute concentrations of aromatics (methylphenanthrenes) and light hydrocarbons in most oils vary by more than two orders of magnitude. Among these compounds, biomarkers (hopanes and steranes) and diamondoid hydrocarbons (dimethyl diamantanes) showed the largest range of absolute concentration variation. The absolute concentrations of biomarkers change by nearly five orders of magnitude, while the diamondoid hydrocarbons change by three orders of magnitude.
Oil mixing is a common phenomenon in oil and gas fields (Wilhelms and Larter, 2004; Larter et al., 2012; Wang et al., 2021; Huang et al., 2022). Because the concentrations of maturity-related biomarkers or non-biomarkers vary greatly across maturity levels, deeper concepts of petroleum maturity need to be elucidated. Different oil maturity parameters often record information about different stages of charging and mixing. The maturity parameters related to saturated and aromatic hydrocarbons are the most common evaluation parameters in the field of petroleum geology. Here, we use two cases to illustrate how biomarkers and aromatics concentration-related maturity parameters are recorded for oil charging and mixing histories. The concentration data for these specific components are derived from a mature source rock sequence. During the process of source rock maturation, the concentrations of biomarker compounds drop sharply or even disappear. If the reservoir receives charge from multiple oils, maturity parameters based on biomarker ratios will produce a bias to overemphasize the contribution of low maturity oils, indicating the oil captured in earlier reservoirs. Here, C29 ααα 20S/(20S+20R) is taken as an example, which is highly specific for the immature to the late mature range (Mackenzie et al., 1983; Beaumont et al., 1985; Peters et al., 1996). Figure 14A shows cross-plots of C29 ααα 20S/(20S+20R) and mixing ratios for end-member oils of different maturities, and the concentrations of each component in the mixed oil. When immature, early mature or mid-mature oil is mixed with late mature oil, respectively, the biomarker parameters show signatures of lower maturity end member oil even when this mixture contains 95% late mature oil (Figure 14A). In contrast, maturity parameters based on aromatic isomers are more sensitive to the mixing process and even biased towards the signatures of higher maturity end-member oils. As the thermal maturity increases, the kerogen becomes increasingly enriched in aromatic structures and the concentrations of the generated free alkylated aromatics usually also increase before oil-to-gas cracking (Huang et al., 2022). The MDR (MDR=4-MDBT/1-MDBT) ratio is well suited for assessing maturity from immature to the end of the condensate/wet gas maturity window (Radke, 1988; Chakhmakhchev and Suzuki, 1995; Chakhmakhchev et al., 1997). When immature, early mature or mid-mature oils are mixed with late-mature oils, respectively, the MDR ratio easily resolves the effect of the mixing process (Figure 14B). Thus, maturity parameters based on aromatic isomers tend to reflect the degree of mixing of captured crude oils in mid-to late-stage reservoirs.
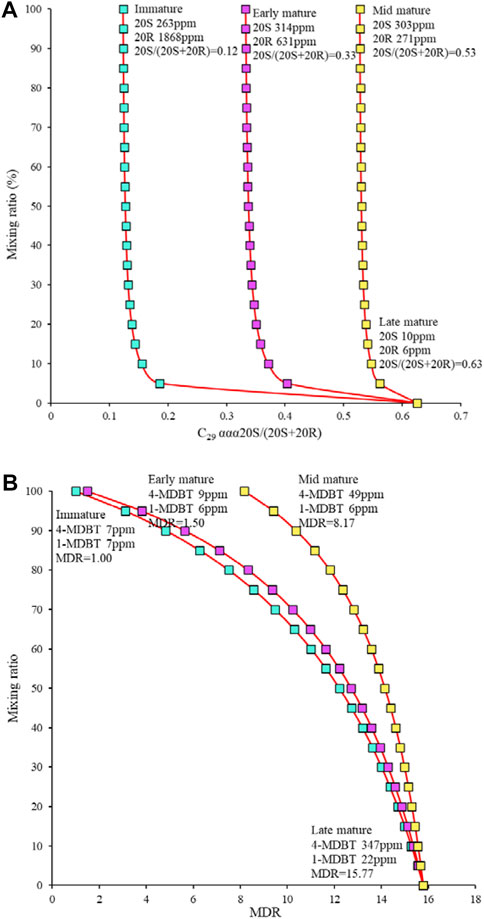
FIGURE 14. Variations of C29 αααα 20S/(20S+20R) (A) and MDR (B) ratios after mixing with different maturity crude oils.
As discussed previously, the charging and mixing histories of the study area are reconstructed based on molecular maturity parameters. Firstly, the biomarkers and aromatic maturity parameters need to be converted to generally accepted vitrinite reflectances (%Ro). The %Ro cutoff values for maturity windows vary in the literature (Dow, 1977; Lewan, 1987; Dembicki, 2009; Srinivasan et al., 2022). The following %Ro cutoff values are used in this study: 0.25–0.5 for immature, 0.5–0.7 for early oil window, 0.7–1.0 for peak oil window, 1.0–1.35 for late oil window, 1.35–2.0 for condensate/wet gas window, and 2.0 and above for dry gas window (Lewan, 1983). Based on the C29 ααα 20S/(20S+20R) values, the maturity window of lower maturity end member oils captured by the reservoir is determined (Mackenzie et al., 1983; Beaumont et al., 1985; Peters et al., 1996). Generally, there is a direct relationship between aromatic molecular maturity parameters and equivalent %Ro values. Six equations (for Eqs 1–6) for calculating the equivalent %Ro are adopted based on the relationship between multiple %Ro values and MDR (Jarvie et al., 2001; Wust et al., 2013; Evenick, 2021; Lohr and Hackley, 2021; Srinivasan et al., 2022). In order to more accurately assess the oil maturity, the six equivalent %Ro values are averaged to obtain the final equivalent %Ro. Comparing the maturity windows obtained from biomarkers [Ro% (Bio)] and the equivalent %Ro gained from MDR [Ro% (MDR)], three geological scenarios can be identified. Scenario 1: If the Ro% (MDR) value is higher than the maturity window defined by the Ro% (Bio) value, it indicates that crude oil with the maturity of Ro% (Bio) is captured in the early reservoir, and oil with the maturity higher than Ro% (MDR) is continuously charged and mixed in the mid-to late-stage reservoir and accounts for a significant contribution; Scenario 2: If the Ro% (MDR) value falls within the maturity window defined by the Ro% (Bio) value, it means that the reservoir has only captured oil from that maturity window, where the larger the Ro% (MDR) value the higher the maturity of the oil; Scenario 3: If the Ro% (MDR) value is lower than the maturity window defined by the Ro% (Bio) value, it means that the Ro% (MDR) is an invalid value and the reservoir may be charged and mixed with high maturity oil. Figure 15 illustrates the oil charging and mixing model from sag to slope in the study area. Peak oil is captured early in the reservoir near well W587, accompanied by late oil charging in the mid to late stages. The reservoirs near wells WX544, W46 and WX140 only capture peak oil, and the oil maturity decreases from sag to slope. In contrast, the reservoir near well W73 only captures early oil. The relatively anomalous Ro% (MDR) values from the Ek reservoir are smaller than the maturity window defined by the Ro% (Bio) values, suggesting high maturity oil charging and mixing.
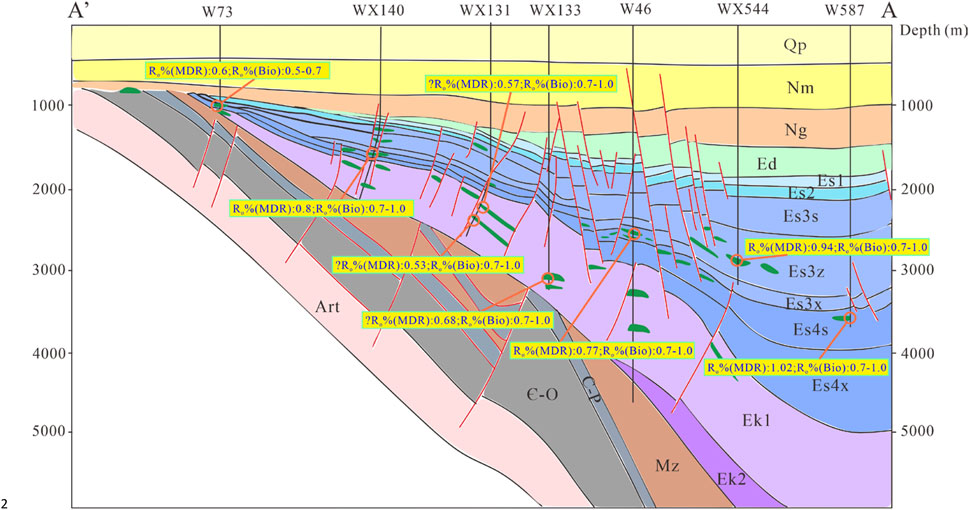
FIGURE 15. Oil charging and mixing model from sag to slope in the study area (Profile location in Figure 1C). The maturity window defined by Ro% (Bio) values is derived from C29 ααα 20S/(20S+20R) values, while Ro% (MDR) values are derived from MDR values.
5.4 Recommendations for the future
In terms of oil charging and mixing models, the oils captured in the reservoirs are a mixture and maturity parameters in light hydrocarbons, biomarkers and aromatics can be considered to comprehensively characterize the oil maturity. Integrating methods such as oil maturity and tectonic evolution to reconstruct hydrocarbon migration and accumulation processes, constrain basin models and reduce exploration risk. At present, only the charging and mixing of two end-member oils are considered, and the number and amount of multiple episodes or continuous charging need to be further explored. Moreover, the contribution of different oil maturities to the reservoir requires quantification. The same series of maturity parameters trace hydrocarbon migration pathways and relative maturity, while multiple series of maturity parameters provide a good characterization of the hydrocarbon charging and mixing histories.
6 Conclusion
The Es3 lacustrine source rocks in the study area are in the immature to mid-mature stage, while the Es4 source rocks are in the immature to late mature stage. Among them, the source rocks in the Es4 and Ek formations were deposited in an anoxic, stratified, brackish water environment. Based on the activation energy distribution of different organic matter types, it can be observed that the main peaks of the activation energy distribution of Es4 source rocks are lower than those of Es3 source rocks, revealing that Es4 source rocks generate oil earlier than Es3 source rocks. Whether in Es4 or Es3 members, source rocks with the kerogen type I have the greatest oil yield compared with other kerogens. The orderly spatial distribution of crude oil physical properties can reflect the results of hydrocarbon generation and expulsion of organofacies C, D/E and F at different maturity stages. Generally, the density and dynamic viscosity of oil decrease with increasing oil maturity.
Basically, all oil is a mixture of different compositions charged from a single uniform source rock or multiple source systems at different maturity stages. Because the concentrations of maturity-related biomarkers or non-biomarkers display several orders of magnitude variations across maturity stages, deeper concepts of oil maturity need to be elucidated. Maturity parameters based on biomarker ratios can produce a bias to overemphasize the contribution of low-maturity oils, revealing information about the oils captured early in the reservoir. In contrast, maturity parameters based on aromatic isomers are more sensitive to the mixing process reflecting the degree of mixing of oil captured in mid-to late-stage reservoirs. The oil charging and mixing histories of the study area from sag to slope are reconstructed based on molecular maturity parameters. Peak oil is captured early in the reservoir in the sag, accompanied by late oil charging in the mid to late stages. Reservoirs in the slope area capture only peak to early oil in sequence and the oil maturity decreases from sag to slope. The same series of maturity parameters can trace the direction of hydrocarbon migration and relative maturity, while multiple series of maturity parameters can reconstruct the hydrocarbon charging and mixing histories.
Data availability statement
The original contributions presented in the study are included in the article/Supplementary Material, further inquiries can be directed to the corresponding author.
Author contributions
YL: conceptualization, methodology, writing—original draft, writing—review and editing. JZ: conceptualization, methodology, supervision, funding acquisition, resources. SL: guidance, editing. HL: supervision, editing.
Funding
This work was financially supported by the National Natural Science Foundation of China (Grant No. 41972147), the 2020 AAPG Foundation Grants-in-Aid Program (The Institut Français du Pétrole Grant) and the 2021 AAPG Foundation Grants-in-Aid Program (The Roger W. Stoneburner Memorial Grant).
Acknowledgments
We sincerely thank Prof. Steve Larter, Prof. Haiping Huang and Qianru Wang from the University of Calgary for their help in promoting the process of this study. Meanwhile, I would like to express my gratitude and miss to my grandmother who passed away during the COVID-19 epidemic.
Conflict of interest
The authors declare that the research was conducted in the absence of any commercial or financial relationships that could be construed as a potential conflict of interest.
Publisher’s note
All claims expressed in this article are solely those of the authors and do not necessarily represent those of their affiliated organizations, or those of the publisher, the editors and the reviewers. Any product that may be evaluated in this article, or claim that may be made by its manufacturer, is not guaranteed or endorsed by the publisher.
References
Al-Khafaji, A. J., Al-Najm, F. M., Al-Refaia, R. A., Sadooni, F. N., Al-Owaidi, M. R., and Al-Sultan, H. A. (2022). Source rock evaluation and petroleum generation of the Lower Cretaceous Yamama Formation: Its ability to contribute to generating and expelling petroleum to cretaceous reservoirs of the Mesopotamian Basin, Iraq. J. Petroleum Sci. Eng. 217, 110919. doi:10.1016/j.petrol.2022.110919
Baur, F. (2019). Predicting petroleum gravity with basin modeling: New kinetic models. AAPG Bull. 103, 1811–1837. doi:10.1306/12191818064
Beaumont, C., Boutilier, R., Mackenzie, A. S., and Rullkoetter, J. (1985). Isomerization and aromatization of hydrocarbons and the paleothermometry and burial history of Alberta Foreland Basin. AAPG Bull. 69, 546–566.
Behar, F., and Vandenbroucke, M. (1987). Chemical modeling of kerogen. United Kingdom: Org. Geochem.
Bennett, B., Larter, S. R., and Taylor, P. N. (2022). Geochemical rationalisation for the variable oil quality in the Orcutt reservoir, California, USA. OG 163, 104348. doi:10.1016/j.orggeochem.2021.104348
Chakhmakhchev, A., Suzuki, M., and Takayama, K. (1997). Distribution of alkylated dibenzothiophenes in petroleum as a tool for maturity assessments. OG 26, 483–489. doi:10.1016/s0146-6380(97)00022-3
Chakhmakhchev, A., and Suzuki, N. (1995). Saturate biomarkers and aromatic sulfur compounds in oils and condensates from different source rock lithologies of Kazakhstan, Japan and Russia. OG 23, 289–299. doi:10.1016/0146-6380(95)00018-a
Chandra, K., Mishra, C., Samanta, U., Gupta, A., and Mehrotra, K. (1994). Correlation of different maturity parameters in the Ahmedabad-Mehsana block of the Cambay basin. OG 21, 313–321. doi:10.1016/0146-6380(94)90193-7
Chang, J., Qiu, N., Zhao, X., Shen, F., Liu, N., and Xu, W. (2018). Mesozoic and Cenozoic tectono-thermal reconstruction of the Western Bohai Bay Basin (East China) with implications for hydrocarbon generation and migration. J. Asian Earth Sci. 160, 380–395. doi:10.1016/j.jseaes.2017.09.008
Chen, Z., Chai, Z., Cao, Y., Liu, Q., Zhang, S., and Yuan, G. (2019). Suppression of thermal maturity indicators in lacustrine source rocks: A case study of dongying depression, eastern China. Mar. Petroleum Geol. 109, 108–127. doi:10.1016/j.marpetgeo.2019.05.041
Connan, J., Bouroullec, J., Dessort, D., and Albrecht, P. (1986). The microbial input in carbonate-anhydrite facies of a sabkha palaeoenvironment from Guatemala: A molecular approach. OG 10, 29–50. doi:10.1016/0146-6380(86)90007-0
Cornford, C., Morrow, J., Turrington, A., Miles, J., and Brooks, J. (1983). Some geological controls on oil composition in the UK North Sea. Geol. Soc. Lond. Spec. Publ. 12, 175–194. doi:10.1144/gsl.sp.1983.012.01.16
Curiale, J. (2002). A review of the occurrences and causes of migration-contamination in crude oil. OG 33, 1389–1400. doi:10.1016/s0146-6380(02)00109-2
Dandekar, A. Y. (2006). Petroleum reservoir rock and fluid properties. Florida, United States: CRC Press.
Dembicki, H. (2009). Three common source rock evaluation errors made by geologists during prospect or play appraisals. AAPG Bull. 93, 341–356. doi:10.1306/10230808076
Dembicki, H. (2022). Practical petroleum geochemistry for exploration and production. Amsterdam, Netherlands: Elsevier.
di Primio, R., and Horsfield, B. (2006). From petroleum-type organofacies to hydrocarbon phase prediction. AAPG Bull. 90, 1031–1058.
Dieckmann, V. (2005). Modelling petroleum formation from heterogeneous source rocks: The influence of frequency factors on activation energy distribution and geological prediction. Mar. Petroleum Geol. 22, 375–390. doi:10.1016/j.marpetgeo.2004.11.002
Dow, W. G. (1977). Kerogen studies and geological interpretations. J. Geochem. Explor. 7, 79–99. doi:10.1016/0375-6742(77)90078-4
Espitalié, J., Deroo, G., and Marquis, F. (1985). La pyrolyse Rock-Eval et ses applications. Deuxième partie. Rev. l'Institut français Pétrole 40, 755–784. doi:10.2516/ogst:1985045
Evans, C., Rogers, M., and Bailey, N. (1971). Evolution and alteration of petroleum in Western Canada. Chem. Geol. 8, 147–170. doi:10.1016/0009-2541(71)90002-7
Evenick, J. C. (2021). Examining the relationship between Tmax and vitrinite reflectance: An empirical comparison between thermal maturity indicators. J. Nat. Gas Sci. Eng. 91, 103946. doi:10.1016/j.jngse.2021.103946
Feng, W., Wang, F., Shi, Y., Jiang, T., Wang, Y., Zhou, H., et al. (2021). Oil properties variation among the China Erlian Rift Basin petroleum systems: Correlation with organofacies and maturity. Mar. Petroleum Geol. 127, 104960. doi:10.1016/j.marpetgeo.2021.104960
George, S. C., Lisk, M., Summons, R. E., and Quezada, R. A. (1998). Constraining the oil charge history of the South Pepper oilfield from the analysis of oil-bearing fluid inclusions. OG 29, 631–648. doi:10.1016/s0146-6380(98)00085-0
Grantham, P. (1986). Sterane isomerisation and moretane/hopane ratios in crude oils derived from Tertiary source rocks. OG 9, 293–304. doi:10.1016/0146-6380(86)90110-5
Guo, X., He, S., Liu, K., Song, G., Wang, X., and Shi, Z. (2010). Oil generation as the dominant overpressure mechanism in the cenozoic dongying depression, Bohai Bay Basin, China. AAPG Bull. 94, 1859–1881. doi:10.1306/05191009179
Guo, X., Liu, K., He, S., Song, G., Wang, Y., Hao, X., et al. (2012). Petroleum generation and charge history of the northern dongying depression, Bohai Bay Basin, China: Insight from integrated fluid inclusion analysis and basin modelling. Mar. Petroleum Geol. 32, 21–35. doi:10.1016/j.marpetgeo.2011.12.007
Guo, X., Liu, K., Jia, C., Song, Y., Zhao, M., and Lu, X. (2016). Effects of early petroleum charge and overpressure on reservoir porosity preservation in the giant Kela-2 gas field, Kuqa depression, Tarim Basin, northwest China. AAPG Bull. 100, 191–212. doi:10.1306/11181514223
Hakimi, M. H., Gharib, A. F., Abidin, N. S. Z., Ahmed, A., Nady, M. M. E., Yahya, M., et al. (2022). Biomarker and carbon isotope composition of the oil stains from the north hadramaut high area of eastern Yemen: Implications on the nature of organic matter input and their characteristics. Arabian J. Sci. Eng. 47, 709–723. doi:10.1007/s13369-021-05772-8
Hao, F., Zhou, X., Zhu, Y., Zou, H., Bao, X., and Kong, Q. (2009). Mechanisms of petroleum accumulation in the Bozhong sub-basin, Bohai Bay Basin, China. Part 1: Origin and occurrence of crude oils. Mar. Petroleum Geol. 26, 1528–1542. doi:10.1016/j.marpetgeo.2008.09.005
Holba, A., Dzou, L., Hickey, J., Franks, S., May, S., and Lenney, T. (1996). Reservoir geochemistry of south pass 61 field, gulf of Mexico: Compositional heterogeneities reflecting filling history and biodegradation. OG 24, 1179–1198. doi:10.1016/s0146-6380(96)00101-5
Huang, H., di Primio, R., Pedersen, J. H., Silva, R., Algeer, R., Ma, J., et al. (2022). On the determination of oil charge history and the practical application of molecular maturity markers. Mar. Petroleum Geol. 139, 105586. doi:10.1016/j.marpetgeo.2022.105586
Hughes, W. B. (1984). “Use of thiophenic organosulfur compounds in characterizing crude oils derived from carbonate versus siliciclastic sources,” in Petroleum Geochemistry and Source Rock Potential of Carbonate Rocks. Editor J. G. Palacas (American Association of Petroleum Geologists), 181–196.
Hunt, J. M. (1991). Generation of gas and oil from coal and other terrestrial organic matter. OG 17, 673–680. doi:10.1016/0146-6380(91)90011-8
Jahn, F., Cook, M., and Graham, M. (2008). Hydrocarbon exploration and production. Amsterdam, Netherlands: Elsevier.
Jarvie, D., Claxton, B., Henk, F., and Breyer, J. (2001). “Oil and shale gas from the barnett shale, ft, worth basin, Texas (abs.),” in AAPG annual meeting Program, 3 june 2001 (Denver, Colorado, USA.
Katz, B., Kelley, P., Royle, R., and Jorjorian, T. (1991). Hydrocarbon products of coals as revealed by pyrolysis-gas chromatography. OG 17, 711–722. doi:10.1016/0146-6380(91)90015-c
Katz, B., and Lin, F. (2014). Lacustrine basin unconventional resource plays: Key differences. Mar. Petroleum Geol. 56, 255–265. doi:10.1016/j.marpetgeo.2014.02.013
Killops, S., Stefanowicz, S., Frey, B., Øygard, K., and Beattie, T. (2022). Occurrence of mid jurassic, organic-rich, lacustrine deposits on the southern Utsira high. Mar. Petroleum Geol. 143, 105784. doi:10.1016/j.marpetgeo.2022.105784
Larter, S., Huang, H., Adams, J., Bennett, B., and Snowdon, L. R. (2012). A practical biodegradation scale for use in reservoir geochemical studies of biodegraded oils. OG 45, 66–76. doi:10.1016/j.orggeochem.2012.01.007
Lewan, M. (1983). Effects of thermal maturation on stable organic carbon isotopes as determined by hydrous pyrolysis of Woodford Shale. Geochimica Cosmochimica Acta 47, 1471–1479. doi:10.1016/0016-7037(83)90306-x
Lewan, M. (1987). Petrographic study of primary petroleum migration in the Woodford Shale and related rock units. Francis: Collection colloques et séminaires-Institut français du pétrole, 113–130.
Li, M., Chen, Z., Ma, X., Cao, T., Li, Z., and Jiang, Q. (2018). A numerical method for calculating total oil yield using a single routine rock-eval program: A case study of the eocene Shahejie formation in dongying depression, Bohai Bay Basin, China. Int. J. Coal Geol. 191, 49–65. doi:10.1016/j.coal.2018.03.004
Li, S., Pang, X., Li, M., and Jin, Z. (2003). Geochemistry of petroleum systems in the Niuzhuang south slope of Bohai Bay Basin—part 1: Source rock characterization. OG 34, 389–412. doi:10.1016/s0146-6380(02)00210-3
Li, Y., Jiang, Z., Liang, S., Zhu, J., Huang, Y., and Luan, T. (2016). Hydrocarbon generation in the lacustrine mudstones of the Wenchang formation in the baiyun sag of the Pearl River Mouth basin, northern south China Sea. Energy & Fuels 30, 626–637. doi:10.1021/acs.energyfuels.5b02034
Liu, Q., He, L., and Chen, L. (2018). Tectono-thermal modeling of Cenozoic multiple rift episodes in the Bohai Bay Basin, eastern China and its geodynamic implications. Int. J. Earth Sci. 107, 53–69. doi:10.1007/s00531-017-1550-1
Lohr, C. D., and Hackley, P. C. (2021). Relating Tmax and hydrogen index to vitrinite and solid bitumen reflectance in hydrous pyrolysis residues: Comparisons to natural thermal indices. Int. J. Coal Geol. 242, 103768. doi:10.1016/j.coal.2021.103768
Mackenzie, A., Hoffmann, C., and Maxwell, J. (1981). Molecular parameters of maturation in the toarcian shales, Paris Basin, France—iii. Changes in aromatic steroid hydrocarbons. Geochimica Cosmochimica Acta 45, 1345–1355. doi:10.1016/0016-7037(81)90227-1
Mackenzie, A. S., Disko, U., and Rullkötter, J. (1983). Determination of hydrocarbon distributions in oils and sediment extracts by gas chromatography—High resolution mass spectrometry. OG 5, 57–63. doi:10.1016/0146-6380(83)90003-7
Mello, M., Gaglianone, P., Brassell, S., and Maxwell, J. (1988). Geochemical and biological marker assessment of depositional environments using Brazilian offshore oils. Mar. petroleum Geol. 5, 205–223. doi:10.1016/0264-8172(88)90002-5
Moldowan, J. M., Seifert, W. K., and Gallegos, E. J. (1985). Relationship between petroleum composition and depositional environment of petroleum source rocks. AAPG Bull. 69, 1255–1268.
Niu, Z., Meng, W., Wang, Y., Wang, X., Li, Z., Wang, J., et al. (2022). Characteristics of trace elements in crude oil in the east section of the south slope of Dongying Sag and their application in crude oil classification. J. Petroleum Sci. Eng. 209, 109833. doi:10.1016/j.petrol.2021.109833
Orr, W. L. (1986). Kerogen/asphaltene/sulfur relationships in sulfur-rich Monterey oils. OG 10, 499–516. doi:10.1016/0146-6380(86)90049-5
Pang, X., Li, M., Li, S., and Jin, Z. (2005). Geochemistry of petroleum systems in the Niuzhuang south slope of Bohai Bay Basin: Part 3. Estimating hydrocarbon expulsion from the Shahejie formation. OG 36, 497–510. doi:10.1016/j.orggeochem.2004.12.001
Pepper, A. S., and Corvi, P. J. (1995). Simple kinetic models of petroleum formation. Part I: Oil and gas generation from kerogen. Mar. petroleum Geol. 12, 291–319. doi:10.1016/0264-8172(95)98381-e
Pepper, A. S. (1991). Estimating the petroleum expulsion behaviour of source rocks: A novel quantitative approach. Geol. Soc. Lond. Spec. Publ. 59, 9–31. doi:10.1144/gsl.sp.1991.059.01.02
Peters, K. E., and Cassa, M. R. (1994). “Applied source rock geochemistry,” in The Petroleum System: From Source to Trap. Editors L. B. Magoon, and W. G. Dow (Tulsa: American Association of Petroleum Geologists), 93–120.
Peters, K. E., and Fowler, M. G. (2002). Applications of petroleum geochemistry to exploration and reservoir management. OG 33, 5–36. doi:10.1016/s0146-6380(01)00125-5
Peters, K. E., Moldowan, J. M., McCaffrey, M. A., and Fago, F. J. (1996). Selective biodegradation of extended hopanes to 25-norhopanes in petroleum reservoirs. Insights from molecular mechanics. OG 24, 765–783. doi:10.1016/s0146-6380(96)00086-1
Petersen, H., Holme, A., Thomsen, E., Whitaker, M., Brekke, T., Bojesen-Koefoed, J., et al. (2011). Hydrocarbon potential of middle jurassic coaly and lacustrine and upper jurassic–lowermost cretaceous marine source rocks in the søgne basin, north Sea. J. Petroleum Geol. 34, 277–304. doi:10.1111/j.1747-5457.2011.00506.x
Petersen, H. I., Hertle, M., and Sulsbrück, H. (2017). Upper Jurassic–lowermost Cretaceous marine shale source rocks (Farsund Formation), North Sea: Kerogen composition and quality and the adverse effect of oil-based mud contamination on organic geochemical analyses. Int. J. Coal Geol. 173, 26–39. doi:10.1016/j.coal.2017.02.006
Radke, M. (1988). Application of aromatic compounds as maturity indicators in source rocks and crude oils. Mar. petroleum Geol. 5, 224–236. doi:10.1016/0264-8172(88)90003-7
Radke, M., Welte, D. H., and Willsch, H. (1982). Geochemical study on a well in the western Canada basin: Relation of the aromatic distribution pattern to maturity of organic matter. Geochimica Cosmochimica Acta 46, 1–10. doi:10.1016/0016-7037(82)90285-x
Radke, M., Welte, D., and Willsch, H. (1986). Maturity parameters based on aromatic hydrocarbons: Influence of the organic matter type. OG 10, 51–63. doi:10.1016/0146-6380(86)90008-2
Romero-Sarmiento, M.-F., Rohais, S., and Littke, R. (2019). Lacustrine type I kerogen characterization at different thermal maturity levels: Application to the late cretaceous yacoraite formation in the Salta Basin–Argentina. Int. J. Coal Geol. 203, 15–27. doi:10.1016/j.coal.2019.01.004
Ross, A. S., Farrimond, P., Erdmann, M., and Larter, S. R. (2010). Geochemical compositional gradients in a mixed oil reservoir indicative of ongoing biodegradation. OG 41, 307–320. doi:10.1016/j.orggeochem.2009.09.005
Seifert, W. K., and Moldowan, J. M. (1978). Applications of steranes, terpanes and monoaromatics to the maturation, migration and source of crude oils. Geochimica cosmochimica acta 42, 77–95. doi:10.1016/0016-7037(78)90219-3
Seifert, W. K., and Moldowan, J. M. (1981). Paleoreconstruction by biological markers. Geochimica cosmochimica acta 45, 783–794. doi:10.1016/0016-7037(81)90108-3
Shanmugam, G. (1985). Significance of coniferous rain forests and related organic matter in generating commercial quantities of oil, Gippsland Basin, Australia1. AAPG Bull. 69, 1241–1254.
Shi, C., Dong, C., Lin, C., Ren, L., Luan, G., and Li, Y. (2021). A semi-confined turbidite system in the eocene lacustrine: An example from Niuzhuang Sag, Bohai Bay Basin, Eastern China. J. Petroleum Sci. Eng. 206, 108924. doi:10.1016/j.petrol.2021.108924
Song, M., Liu, H., Wang, Y., and Liu, Y. (2020). Enrichment rules and exploration practices of Paleogene shale oil in jiyang depression, Bohai Bay Basin, China. Petroleum Explor. Dev. 47, 242–253. doi:10.1016/s1876-3804(20)60043-x
Srinivasan, P., Jacobi, D., Atwah, I., Karg, H., and Azzouni, A. (2022). Integration of methyldibenzothiophene and pyrolysis techniques to determine thermal maturity in sulfur-rich Type II-S source rocks and oils. OG 163, 104333. doi:10.1016/j.orggeochem.2021.104333
Stainforth, J. G. (2004). New insights into reservoir filling and mixing processes. Geol. Soc. Lond. Spec. Publ. 237, 115–132. doi:10.1144/gsl.sp.2004.237.01.08
Sun, J., Liang, T., Lin, X., Wang, Y., Zhang, Z., and Zou, Y. (2019). Oil generation and retention kinetics from the upper Es4 source rock in the Dongying Depression. Geochimica 48, 370–377.
Tao, Z., He, Z., Alves, T. M., Guo, X., Gao, J., He, S., et al. (2022). Structural inheritance and its control on overpressure preservation in mature sedimentary basins (Dongying depression, Bohai Bay Basin, China). Mar. Petroleum Geol. 137, 105504. doi:10.1016/j.marpetgeo.2021.105504
Ten Haven, H., De Leeuw, J., Rullkötter, J., and Damsté, J. S. (1987). Restricted utility of the pristane/phytane ratio as a palaeoenvironmental indicator. Nature 330, 641–643. doi:10.1038/330641a0
Tissot, B., Pelet, R., and Ungerer, P. (1987). Thermal history of sedimentary basins, maturation indices, and kinetics of oil and gas generation. AAPG Bull. 71, 1445–1466.
Wang, G., Wang, T.-G., Simoneit, B. R., Chen, Z., Zhang, L., and Xu, J. (2008). The distribution of molecular fossils derived from dinoflagellates in Paleogene lacustrine sediments (Bohai Bay Basin, China). OG 39, 1512–1521. doi:10.1016/j.orggeochem.2008.07.013
Wang, H., Wu, W., Chen, T., Yu, J., and Pan, J. (2019). Pore structure and fractal analysis of shale oil reservoirs: A case study of the Paleogene Shahejie formation in the dongying depression, Bohai Bay, China. J. Petroleum Sci. Eng. 177, 711–723. doi:10.1016/j.petrol.2019.02.081
Wang, Q., Huang, H., and Li, Z. (2021). Mixing scenario of a vagarious oil in the dongying depression, Bohai Bay Basin. Fuel 294, 120589. doi:10.1016/j.fuel.2021.120589
Wang, X., He, S., Wei, A., Liu, Q., and Liu, C. (2016). Typical disequilibrium compaction caused overpressure of Paleocene Dongying formation in northwest Liaodongwan depression, Bohai Bay Basin, China. J. Petroleum Sci. Eng. 147, 726–734. doi:10.1016/j.petrol.2016.09.014
Wang, Y., Hao, X., and Hu, Y. (2018). Orderly distribution and differential enrichment of hydrocarbon in oil-rich sags: A case study of dongying sag, jiyang depression, Bohai Bay Basin, east China. Petroleum Explor. Dev. 45, 840–850. doi:10.1016/s1876-3804(18)30087-9
Wilhelms, A., and Larter, S. (2004). Shaken but not always stirred. Impact of petroleum charge mixing on reservoir geochemistry. Geol. Soc. Lond. Spec. Publ. 237, 27–35. doi:10.1144/gsl.sp.2004.237.01.03
Wilhelms, A., Teln, N., Steen, A., and Augustson, J. (1998). A quantitative study of aromatic hydrocarbons in a natural maturity shale sequence—The 3-methylphenanthrene/retene ratio, a pragmatic maturity parameter. OG 29, 97–105. doi:10.1016/s0146-6380(98)00112-0
Wust, R. A., Nassichuk, B. R., Brezovski, R., Hackley, P. C., and Willment, N. (2013). Vitrinite Reflectance Versus Pyrolysis Tmax Data: Assessing Thermal Maturity in Shale Plays with Special Reference to the Duvernay Shale Play of the Western Canadian Sedimentary Basin, Alberta, Canada, SPE Unconventional Resources Conference and Exhibition-Asia Pacific. Brisbane, Australia: Society of Petroleum Engineers.
Xie, X., Fan, Z., Liu, X., and Lu, Y. (2006). Geochemistry of formation water and its implication on overpressured fluid flow in the Dongying Depression of the Bohaiwan Basin, China. J. Geochem. Explor. 89, 432–435. doi:10.1016/j.gexplo.2005.11.026
You, B., Ni, Z., Zeng, J., Luo, Q., Xiao, H., Song, G., et al. (2020). Oil-charging history constrained by biomarkers of petroleum inclusions in the Dongying Depression, China. Mar. Petroleum Geol. 122, 104657. doi:10.1016/j.marpetgeo.2020.104657
Zahid, M. A., Chunmei, D., Lin, C., Gluyas, J., Jones, S., Zhang, X., et al. (2016). Sequence stratigraphy, sedimentary facies and reservoir quality of Es4s, southern slope of Dongying Depression, Bohai Bay Basin, East China. Mar. Petroleum Geol. 77, 448–470. doi:10.1016/j.marpetgeo.2016.06.026
Zhan, Z.-W., Lin, X.-H., Zou, Y.-R., Li, Z., Wang, D., Liu, C., et al. (2019). Chemometric differentiation of crude oil families in the southern dongying depression, Bohai Bay Basin, China. OG 127, 37–49. doi:10.1016/j.orggeochem.2018.11.004
Zhang, H., Huang, H., Li, Z., and Liu, M. (2020). Impact of maturation on the validity of paleoenvironmental indicators: Implication for discrimination of oil genetic types in lacustrine shale systems. Energy & Fuels 34, 6962–6973. doi:10.1021/acs.energyfuels.0c00868
Zhang, L., Liu, Q., Zhu, R., Li, Z., and Lu, X. (2009). Source rocks in mesozoic–cenozoic continental rift basins, east China: A case from dongying depression, Bohai Bay Basin. OG 40, 229–242. doi:10.1016/j.orggeochem.2008.10.013
Zhang, P., Lu, S., and Li, J. (2019). Characterization of pore size distributions of shale oil reservoirs: A case study from dongying sag, Bohai Bay Basin, China. Mar. Petroleum Geol. 100, 297–308. doi:10.1016/j.marpetgeo.2018.11.024
Zhang, S., Huang, H., Su, J., Zhu, G., Wang, X., and Larter, S. (2014). Geochemistry of paleozoic marine oils from the tarim basin, NW China. Part 4: Paleobiodegradation and oil charge mixing. OG 67, 41–57. doi:10.1016/j.orggeochem.2013.12.008
Zhou, Y., and Littke, R. (1999). Numerical simulation of the thermal maturation, oil generation and migration in the Songliao Basin, Northeastern China. Mar. Petroleum Geol. 16, 771–792. doi:10.1016/s0264-8172(99)00043-4
Keywords: oil properties, organofacies, thermal maturity, oil maturity, charging and mixing, Dongying Sag
Citation: Liu Y, Zeng J, Liu S and Long H (2023) Physical properties variation of crude oil under natural laboratory and its geological implications: Dongying Sag, eastern China. Front. Earth Sci. 11:1169318. doi: 10.3389/feart.2023.1169318
Received: 19 February 2023; Accepted: 10 April 2023;
Published: 20 April 2023.
Edited by:
Leibo Bian, Aarhus University, DenmarkReviewed by:
Zhe Cao, SINOPEC Petroleum Exploration and Production Research Institute, ChinaGuo Chen, Yangtze University, China
Copyright © 2023 Liu, Zeng, Liu and Long. This is an open-access article distributed under the terms of the Creative Commons Attribution License (CC BY). The use, distribution or reproduction in other forums is permitted, provided the original author(s) and the copyright owner(s) are credited and that the original publication in this journal is cited, in accordance with accepted academic practice. No use, distribution or reproduction is permitted which does not comply with these terms.
*Correspondence: Jianhui Zeng, emVuZ2poQGN1cC5lZHUuY24=