 Xiaoqing Zhao
 Quansheng Miao
 Ruipu Zhao3
95% of researchers rate our articles as excellent or good
Learn more about the work of our research integrity team to safeguard the quality of each article we publish.
Find out more
ORIGINAL RESEARCH article
Front. Earth Sci. , 20 March 2023
Sec. Solid Earth Geophysics
Volume 11 - 2023 | https://doi.org/10.3389/feart.2023.1169258
This article is part of the Research Topic Advances in Petrophysics and Formation Evaluation of Unconventional Resources View all 9 articles
The target formation in the study area of the Pearl River Mouth Basin is characterized by complex lithology and thin interbedded layers, with a large pore-permeability distribution range and strongly heterogeneous characteristics, which makes the reservoir pore structure and production capacity significantly different and brings research difficulties for reservoir logging evaluation and desert identification. The conventional reservoir classification method is mainly based on physical research, which requires developing extremely accurate formulas for calculating porosity and permeability; the calculation accuracy of pore permeability of low-porosity and low-permeability reservoirs is difficult to guarantee; and the conventional logging data cannot be comprehensively applied in reservoir classification. In this paper, taking Zhujiang and Zhuhai Formation reservoirs in the Huizhou M oilfield as an example, we integrated core analysis data such as core cast thin section, pore permeability data, rock electrical parameters, grain size, and relative permeability curves and combined with petrophysical parameters and pore structure characteristics to classify the reservoirs. The artificial neural network is used to predict the resistivity of saturated pure water (R0) to remove the influence of oil and gas on reservoir resistivity. The natural gamma ray (GR) “fluctuation” is used to calculate the variance root of variation (GS) to reflect the lithological variability and sedimentary heterogeneity of the reservoir, and then the conventional logging preferences, R0 and Gs (based on GR), are classified based on the automatic clustering MRGC algorithm to classify the logging facies. To classify the petrophysical phase reservoirs under the constraint of pore structure classification, we proposed a petrophysical classification logging model based on the natural gamma curve “fluctuation” intensity for strongly heterogeneous reservoirs. The learning model is extended to the whole area for training and prediction of desert identification, and the prediction results of the model are in good agreement with the actual results, which is important for determining favorable reservoirs in the area and the adjustment of oilfield development measures.
With the deepening of exploration and development, the object of logging interpretation gradually shifts to complex reservoirs such as heterogeneity, and the pore structure and production capacity of such reservoirs are influenced by many factors and the production capacity varies significantly, so the identification of strongly heterogeneous reservoir deserts is crucial. The production capacity of oil and gas reservoirs is mainly influenced by many factors such as lithology, physical properties, oil content, mud content, and pore structure. However, production capacity is a comprehensive reflection of various influencing factors. The logging method is the main means of desert identification due to its advantages of high wellbore resolution and comparability of multiple wells. The logging response can visually reflect the lithology, physical properties, seepage characteristics, and production capacity of oil and gas reservoirs to a certain extent, and the petrophysical classification of reservoirs is essential.
Reservoirs have experienced the combined effects of sedimentation, diagenesis, and late tectonic action during their long geological history, resulting in heterogeneous variations in the spatial distribution and various internal properties of the reservoirs, manifesting as reservoir heterogeneity. The integrated characterization method of reservoir heterogeneity is a research method based on core, logging, seismic, and production dynamic data, which is a multi-method and multi-disciplinary synthesis to characterize reservoir non-homogeneity. It is based on traditional heterogeneous characterization parameters; integrated geological understanding; and geological, geophysical, and geochemical means to carry out systematic and comprehensive heterogeneous characterization (Wang et al., 2022; Yue et al., 2022). Cheng et al. (2022) studied the distribution of reservoir inhomogeneity strengths and weaknesses in the Ordos Basin and quantitatively characterized the reservoir heterogeneity in the study area based on core data, reservoir physical properties, and logging data to guide oil and gas exploration work in the area. Hydrocarbon-bearing basins in China are rich in hydrocarbon resources and contain more heterogeneous reservoirs. The petrophysical characterization and reservoir classification of strongly heterogeneous reservoirs is a hot topic in the current hydrocarbon research.
Petrophysical research is the link between reservoir and reservoir parameters and geophysical properties and is an effective means of integrating core, logging, and seismic data for comprehensive quantitative characterization of hydrocarbon-bearing reservoirs. Overseas, the Rock Physics Laboratory at the University of Houston, the Rock Physics and Borehole Geophysics Project at Stanford University, and CoreLab (United States) are some of the research institutions dedicated to the Rock Physics and Borehole Geophysics Project at Stanford University and CoreLab, Inc. Lai et al. (2013a; 2013b) proposed that the petrophysical phase is mainly controlled by the sedimentary phase, diagenetic phase, and rock formation phase. Soete et al. (2014) took eight wells in the Paleozoic study area of the Irish Sea as an example and calculated and compared the porosity, permeability, clay volume, and other parameters of each well and classified the different petrophysical facies types to find the better dominant formation in the reservoir. Huang et al. (2017) proposed a comprehensive logging evaluation and interpretation method based on petrophysical studies, which combines macroscopic sedimentary, diagenetic, and tectonic factors with microscopic rock characteristics, physical characteristics, and pore throat structural characteristics, making the logging interpretation more comprehensive and free from the limitation of “one-hole view.”Liu et al. (2021) classified four types of petrophysical facies based on the classification of petrophysical facies, extracted sensitive curves based on the logging response characteristics of different petrophysical facies, and established logging identification criteria for different types of petrophysical facies by discriminant analysis. Fan et al. (2022a); Fan et al. (2022b) proposed a semi-supervised learning model of petrophysical facies division for the low porosity and permeability reservoir of the third member of the Shahejie Formation in the M oilfield of the Paleogene in the Bohai Sea. Using data such as mercury injection, core casting thin sections, and logging facies division, the semi-supervised learning model combined with the “unsupervised and supervised” models was extended to the training and prediction of the whole area for sweet spot identification and showed good application effect.
With the rise of intelligent emerging technologies, artificial intelligence logging evaluation techniques have also emerged, and intelligent algorithms such as neural networks, machine learning, and automatic clustering have been applied in the field of logging, which have improved the efficiency of reservoir classification and the accuracy of desert identification by leaps and bounds. Tian et al. (2016) used the multi-resolution clustering analysis based on graph theory for the carbonate Tainai Tan gas field in the right bank area of the Amu Darya Basin to carry out a study on logging facies clustering and quantitative petrographic prediction based on conventional logging data. Rahsepar et al. (2016) used multi-resolution graph-based clustering (MRGC), agglomerative hierarchical clustering (AHC), self-organizing map neural network method (SOM), and dynamic clustering (DYN) for the Arabian section reservoir in Salman oilfield, using natural gamma ray log (GR), acoustic log (AC), density log (DEN), and compensated neutron log (CNL) curves, and the results show that the best clustering algorithm is MRGC clustering, which has the best classification effect. Shi et al. (2018) combined geological, logging, and core cast thin section data and successfully classified the logging facies using graph-theoretic multi-resolution clustering algorithm, which significantly improved the calculation accuracy compared with the traditional method, and determined the logging phase and rock phase correspondence in the study area, and a permeability evaluation model based on the logging facies constraint was established. Zhang. (2018) used the nuclear attraction theory in the MRGC method to initially obtain the coarse classification results of lithology and then used the SOM algorithm and dynamic neuron splitting technique to realize the classification of lithology from coarse to fine according to the multi-level classification scheme provided by the MRGC method. Liu et al. (2020) addressed the problems of logging facies identification and petrophysical characteristic classification by analyzing the petrophysical characteristics of various mud shale petrographic phases and using the MRGC method for logging identification of petrographic facies, and the main logging parameter patterns of terrestrial mud shale petrographic facies were obtained. Wu et al. (2020) proposed an adaptive multi-resolution graph clustering analysis method to analyze multi-dimensional logging curves and then perform clustering and prediction on the basis of previous research, which is an improved MRGC clustering algorithm, and the results show that multi-resolution graph clustering analysis has higher operational efficiency and stability, and the effect is significantly better than that of other common clustering methods, such as self-organizing neural network (SOM), dynamic clustering (DYN), and hierarchical clustering (AHC), without prior data knowledge. In order to solve the limitations of conventional lithology identification methods for more fine lithology identification and complex lithology identification difficulties, a logging facies analysis and lithology identification method based on the MRGC clustering method and its process are proposed by discussing the basic principles of the MRGC clustering method and the KNN algorithm propagator (Yu, 2022).
In this paper, taking Zhujiang and Zhuhai Formation reservoirs in the Huizhou M oilfield as an example to address the problem of the difficult identification of strongly heterogeneous reservoir deserts, on the basis of comprehensive core experimental data analysis of scaled reservoir pore structure classification, analysis of conventional logging response characteristics, and selecting sensitive logging parameters, a neural network model is constructed to predict the resistivity of saturated pure water R0 in the reservoir to eliminate the influence of oil and gas on the resistivity value of the reservoir, and using natural gamma, we calculated the variance root of variation (Gs) reflecting the sediment hydrodynamic stability to characterize the reservoir heterogeneity and to realize the pre-processing of log phase analysis of logging data. The MRGC algorithm is used to classify the log facies with the constraints of pore structure, and a petrophysical facies classification model based on the natural gamma curve “fluctuation” intensity is innovatively established to realize the evaluation of petrophysical classification of strongly heterogeneous reservoirs.
The Pearl River Mouth Basin is located in the northern part of the South China Sea (Figure 1), with an area of about 26.6 × 10⁴ km2 and overall NE–SW spreading, and is one of the important hydrocarbon-bearing basins offshore China, mainly including five secondary tectonic units from south to north: the Southern Uplift Belt, the Southern Depression Belt, the Central Uplift Belt, the Northern Depression Belt, and the Northern Uplift Belt (Huizinga and Lomando, 1990; Leyla et al., 2018; Tian et al., 2020; Jiang et al., 2022; Shi et al., 2018).
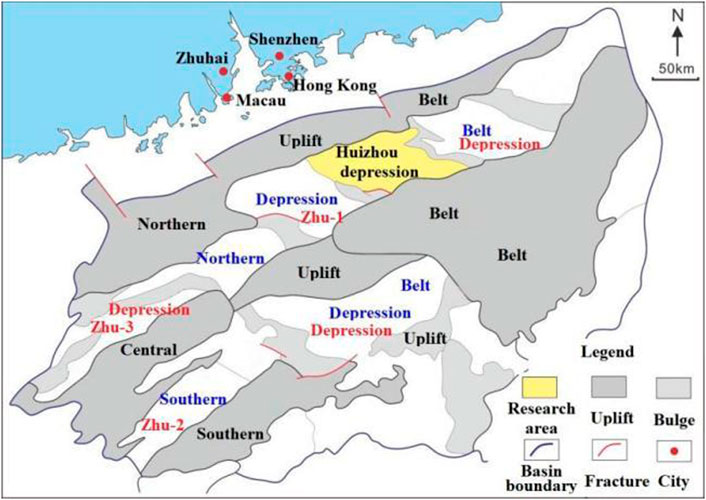
FIGURE 1. Map of tectonic unit delineation in the Pearl River Mouth Basin and location of Huizhou depression (According to Shi et al., 2014; Cao T., 2020, modified).
The Huizhou M oil field is located on the northwest slope of the Dongsha Uplift in the central uplift belt of the Pearl River Mouth Basin, south of the Huizhou depression, with reservoir depths of 2,284–2,620 m, which belongs to the middle depth. The field is mainly developed by the Neoproterozoic Zhujiang Formation and the Paleoproterozoic Zhuhai Formation, which are a set of clastic sediments in the deltaic-shallow shelf system, with several sets of reservoirs developed. Longitudinally, the sandy mudstone is interbedded, including six oil layers with good separation between layers; horizontally, each oil layer has good comparability. Drilling confirms that this well area is one of the most favorable hydrocarbon enrichment areas in the South China Sea and has superior geological conditions for hydrocarbon accumulation and reservoir formation. The reservoirs of Zhujiang and Zhuhai formations have obvious lithological inhomogeneity and a wide distribution of rock grain size, mainly rock chip subfeldspathic sandstone and locally feldspathic sandstone. It has medium roundness, mainly subangular to subrounded, with relatively average sorting. The pore type is mainly primary intergranular pores, followed by secondary dissolution pores (Cao T., 2020; Cao X., 2020). The pore permeability spans a wide range, and the physical heterogeneity is obvious, with porosity (PORE) distribution ranging from 6.2–23.8% and permeability (PERM) distribution ranging from 0.1–1246.0 mD, and medium-to-high pore permeability to low-pore permeability reservoirs are developed (Figure 2). Although the overall physical properties of these reservoirs are good, the complex lithology and thin interbedded features make the reservoir pore structure and production capacity significantly different, with strong heterogeneous characteristics, making the reservoir logging evaluation and desert identification difficult.
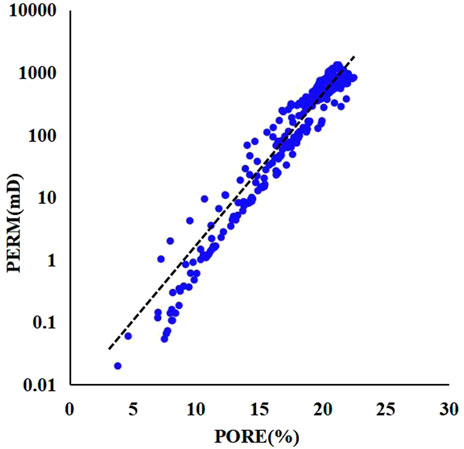
FIGURE 2. Crossplot of porosity and permeability of the main oil reservoirs in the Huizhou M oil field.
The lithology of the reservoir in the study area is relatively complex, with a wide range of physical distribution, from low porosity and low permeability to high porosity and high permeability, and the difference in permeability corresponding to the same porosity can be up to two orders of magnitude, which indicates that although the percolation characteristics of the rock are closely related to porosity, they cannot be characterized by a single pore–permeability relationship. The reservoir types in this area are diverse and the pore structure is complex, and a pore structure classification study is needed to provide a reliable basis for accurate description of the reservoir characteristics and subsequent exploration and development.
Tulsa (1992) proposed the classification of petrophysical types on single-well profiles in 1992, and Dai et al. (2004) pointed out that petrophysical facies is a reservoir genesis unit with certain petrophysical characteristics, which is the combined effect of sedimentation, diagenesis, and late tectonic activity, and finally manifests itself in present-day pore geometry. The classification and evaluation of reservoirs from the perspective of petrophysics can achieve good application results. According to the geological characteristics of the reservoir in the study area, porosity, permeability, cast thin section, particle size curve, relative permeability curve, and petrophysical parameters are selected for the study of pore structure classification.
The physical characterization parameters of rocks are ultimately the characteristics of the reservoir pore structure, which refers to the geometry, size, distribution, and interconnection of pores and throats that rocks have, and is a general term for the variation of pore structure within the reservoir unit. In the process of reservoir formation, different diagenetic effects have a certain influence on the destruction and preservation of primary pore space and the generation of secondary pore space. Through the observation of core cast thin section and regional lithology statistics, the feldspar and rock chip dissolution phenomenon is observed in the Zhujiang and Zhuhai formations of Huizhou depression, mainly developing compaction, cementation, and dissolution. The average content of quartz (Q pole) is 71.6%, mainly single-crystal quartz, and the interference color is grayish white under orthogonal polarization; the average content of feldspar (F pole) is 16.5%, including potassium feldspar and a small amount of plagioclase and streak feldspar, and the karst bicrystal, polysheet bicrystal, and streak bicrystal can be observed under orthogonal polarization; the average content of rock debris (R pole) is high, up to 11.9% (Table 1), consisting mainly of magmatic rocks and metamorphic rock debris and sedimentary rocks. The rock chip content is high, with an average content of 11.9% (Table 1), comprising mainly magmatic and metamorphic rock chips and sedimentary rock chips. According to the particle size analysis data of the samples in the study area and the statistical results of the particle size of the debris in the thin section, the particle size of the sandstone particles of the Zhujiang and Zhuhai formations was studied by using the commonly used grain size classification standards. The particle size distribution of the sandstone grains of the Zhujiang and Zhuhai formations in the Huizhou Depression is significant, and the grain size ranges from chalk to gravel, with mainly medium–fine sand. It can be observed in the cast thin section that the sandstone in this area is poorly sorted as a whole, with medium rounding, and the clastic particles are mostly subangular to subrounded, with relatively low structural maturity.
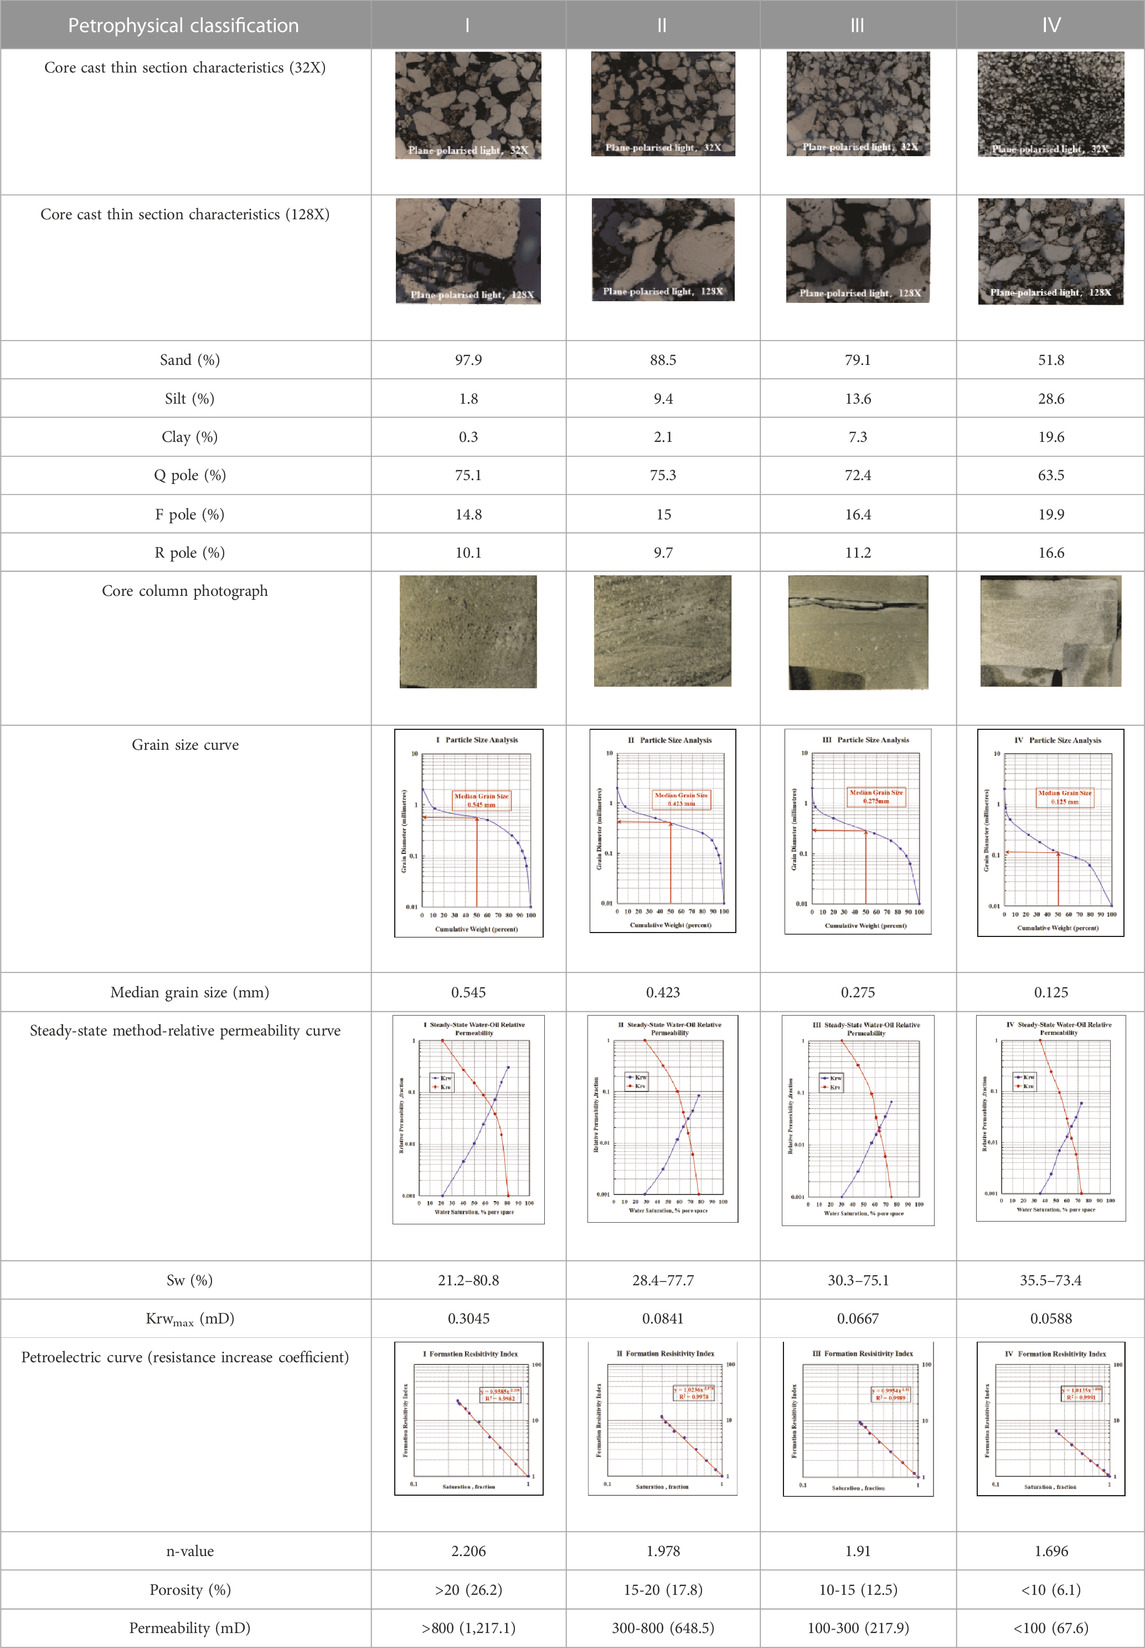
TABLE 1. Criteria for the classification of petrophysical parameters of the reservoir in the target layer in the study area.
Based on the characteristics of the diagenetic stage, diagenetic type, and type of diagenetic minerals under the mirror, formation sequence, and the strength of dissolution, it can be divided into four types of diagenetic types: secondary dissolution pore, transitional type combined with weak dissolution–weak compaction, deformation by compaction, and carbonate cementation. The core data such as different formation types, grain size, relative permeability experiments, and petrophysical parameters of core cast thin sections are integrated, and the pore structure types of the target reservoirs in the study area are studied according to different petrophysical parameters and divided into Ⅰ, Ⅱ, Ⅲ, and Ⅳ(classes) (Table 1).
The formation type of the Class I reservoir is dominated by secondary dissolution pores, mainly developing intragrain dissolution pores of feldspar. Typical core cast thin sections can be observed in which individual feldspar dissolution is more complete, forming cast pores and precipitating kaolinite crystals near the pores. The grains are mainly coarse–medium sands, with a median size of 0.545 mm, moderate sorting and rounding, and a low clay content of 0.3%. The porosity is greater than 20%, of which the representative core porosity is 26.2%; the permeability is greater than 800 mD, of which the representative core permeability is 1,217.1 mD, which belongs to the medium–high porosity permeability layer; the saturation range of the relative permeability curve by the steady-state method (Sw) is from 21.2 to 80.8%; the maximum water-relative permeability (Krw) is 0.3045 mD; and the n-value of rock resistivity curve regression is 2.206, which proves it to be an exceptionally good reservoir (Class I).
The rock formation type of the Class II reservoir is mainly the transitional type combined with weak dissolution–weak compaction, containing part of the feldspar intra-grain solution pores; the clastic particles are in point contact and line contact relationship; the particles are loosely arranged; and the plastic mineral deformation is not obvious. The particles are mainly coarse–medium sand, with a median size of 0.423 mm, average sorting and rounding, and low clay content of 2.1%. The range of porosity is from 15 to 20 %, of which the representative core porosity is 17.8%; the range of permeability is from 300 to 800 mD, of which the representative core permeability is 648.5 mD, which belongs to the medium pore medium permeability layer; the saturation range of the relative permeability curve by the steady-state method (Sw) is from 28.4 to 77.7%; the maximum water-relative permeability (Krw) is 0.0841 mD; and the regression of the rock resistivity curve of n-value is 1.978, which make it a good reservoir (Class II).
The rock formation type of the Class III reservoir is mainly deformed by compaction, and it can be observed in the cast thin section that the rock particles of this reservoir are in close contact, mostly in line contact to the concave–convex contact relationship; the plastic rock chips are seriously deformed by compaction; and the mica is also seen to be significantly deformed by strong compaction. The particles are mainly medium–fine sand, with a median size of 0.275 mm and serious size differentiation; they are mostly angular to subangular, with poor sorting and rounding; and the clay content is 7.3%. The range of porosity is from 10 to 15%, of which the representative core porosity is 12.5%; the range of permeability is from 100 to 300 mD, of which the representative core permeability is 217.9 mD, which belongs to the medium–low porosity layer; the saturation range of the relative permeability curve by the steady-state method (Sw) is from 30.3% to 75.1%; the maximum water-relative permeability (Krw) is 0.0667 mD; and the regression of the rock resistivity curve of n-value is 1.910, which makes it a medium-quality reservoir (Class III).
The rock formation type of the Class IV reservoir is dominated by carbonate cementation with high calcareous content and the development of silica, kaolinite, illite, chlorite, and carbonate cementation. The grains are mainly fine sand, with a median size of 0.125 mm, with poor sorting and rounding, and a relatively high clay content of 19.6%. The pore permeability span is large; the porosity is less than 10%, among which the representative core porosity is 6.1%; the permeability is less than 100 mD, among which the representative core permeability is 67.6 mD, mostly belonging to the low pore and low permeability reservoir; the saturation range of the relative permeability curve by the steady-state method (Sw) is from 35.5% to 73.4%; the maximum water-relative permeability (Krw) is 0.0588 mD; the regression of the rock resistivity curve of n-value is 1.696; and the throat channel is fine, which makes it a poor-quality reservoir (Class IV).
In general, the formation of a certain type of lithology in the same depositional environment has a specific set of logging parameter values. Logging data can be used to divide the entire drilling section of the formation into a number of geologically significant logging facies, and similar logging facies reservoirs generally have similar lithology, physical properties, pore structure, and logging response characteristics. It is extremely important to use the log data to divide the logging facies and then identify the petrophysical phases and optimize the sensitive parameters. The optimization of sensitive parameters based on petrophysical characterization is achieved by optimizing conventional log data, constructing saturated water-bearing resistivity values (R0) curves to eliminate the influence of multiple factors on reservoir resistivity, and using natural gamma ray log (GR) curves to calculate the variance root of variation (GS) to observe the variability of sedimentary heterogeneity and then introducing the input curves for log phase delineation.
The logging method is the main means of desert identification due to its advantages of high wellbore resolution and comparability of multiple wells. Logging can obtain the information of petrophysical formation, including various physicochemical properties of rocks, such as rock density, resistivity, hydrogen content index, natural gamma, spontaneous potential, and longitudinal wave propagation velocity. Moreover, different reservoirs have their own petrophysical characteristics. Logging response can directly reflect the lithology, physical properties, seepage characteristics, and production capacity of oil and gas reservoirs to a certain extent, so it is essential to classify the petrophysics of the reservoir.
The natural gamma ray log (GR) curve and the spontaneous potential log (SP) curve are logging curves that mainly reflect lithology in the formation (Figure 4). The GR curve reflects the lithological changes of the formation by measuring the radioactivity of the formation and has outstanding advantages in distinguishing muddy and non-muddy formations,; it can also be used to comprehensively judge the mud content of a formation and has obvious advantages in judging the characteristics of lithological changes of the marker layer. The SP curve measures the lithological changes of the formation. The SP curve measures the potential difference of the stratum under electrochemical conditions, and its shape can well-reflect the cyclonic development of the sediment. At the same time, it can reflect the physical properties to a certain extent, which helps judge the sediment fluctuation of the microphase section. However, the spontaneous potential curve values in the target section are relatively flat and cannot evaluate lithological changes, so it is not involved in reservoir classification.
The acoustic log (AC) curve, compensated neutron log (CNL) curve, and density (DEN) curve are triple porosity curves, which are used to reflect the physical characteristics of the reservoir. Although the three methods have different physical measurement principles, they are all related to formation porosity calculation. For example, CNL measurement is mainly hydrogen cross-section, which mainly includes information of fluid and clay-bound water in pore space. Acoustic log is mainly based on the propagation characteristics of sound waves in downhole formations and media, and its propagation velocity is related to pore size and fluid in pore space. Density log is mainly measured by radioactive gamma source, as an important logging method to determine lithology and rock density. The combination of three porosity logging techniques can also be applied to gas reservoir identification and formation pressure prediction. Therefore, the method of three-porosity combination can be applied to well logging facies division.
Double lateral resistivity log (RLLD) and (RLLS) are deep and shallow resistivity log curves, respectively, which mainly reflect the reservoir fluid characteristics in the “four-property relationship,” but due to the characteristics of non-homogeneous reservoirs such as complex lithology and thin interlayer, reservoir resistivity values are affected by multiple factors. In addition to the influence of oil and gas, the resistivity is also affected by pore structure, physical properties, and clay. Poor physical properties and complex pore structure will cause the resistivity value to increase, and high clay content will cause the resistivity value to decrease. Therefore, it is necessary to further treat the resistivity curve before participating in the division of petrophysical facies.
As mentioned previously, reservoir resistivity values are affected by multiple factors, and to eliminate the influence of these factors on reservoir resistivity values, calculation of the saturated pure water resistivity R0 is required. R0 is the resistivity curve when the water content in the reservoir reaches 100%. In conventional reservoirs, R0 is usually calculated using the Alchian formula or the conductive model formula for muddy sandstones, but the pore structure of strongly inhomogeneous reservoirs is complex, and the R0 values calculated using the aforementioned methods are not applicable in low-porosity and low-permeability reservoirs, and the model parameters are difficult to find the law (Li and Li, 1997). Therefore, an artificial neural network is used to model and learn the resistivity values of the well section in the pure water layer to predict the R0 values of the whole well section by the machine learning method.
Based on the artificial neural network algorithm to achieve quantitative prediction of the R0 value, conventional information is divided into two processes (Graupe, 1997; Aminian and Ameri, 2005; Graupe, 2019): first, the GR, AC, CNL, and DEN curves of the standard saturated pure water interval are selected from the standard well as the modeling curve, and the RLLD curve of the water layer section is taken as the learning curve for modeling. Also, the prediction model of R0 is established through artificial neural network training and learning. Then, the GR, AC, CNL, and DEN curves of the non-saturated pure water interval are used as input curves for prediction, and the established prediction model is used to learn and predict. Finally, the R0 value of the whole well section is predicted (Figure 3).
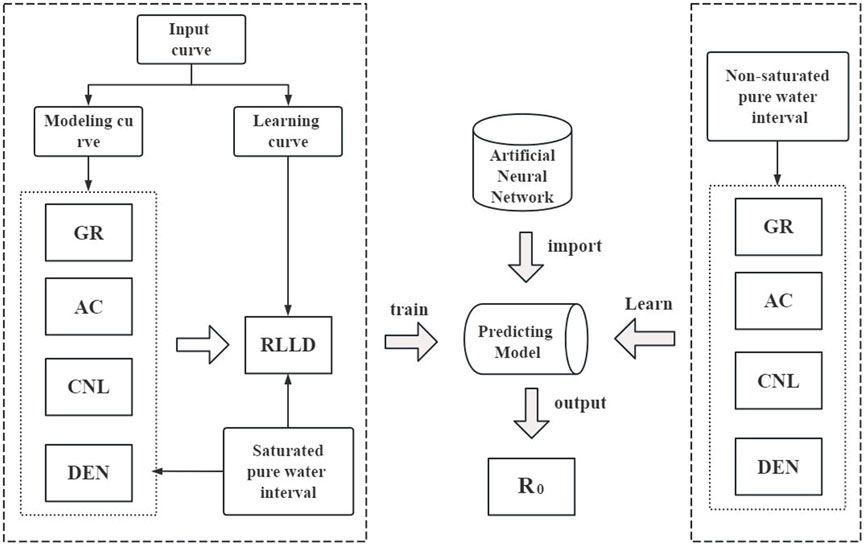
FIGURE 3. Architecture figure of R0 predicted by the artificial neural network.
By using the artificial neural network to model and learn the resistivity value of the well section of pure water layer, we can predict the R0 value of the whole well section (Figure 4), and the R0 value predicted by the neural network is overlaid with the RLLD value of the formation, according to the magnitude difference and the direction of curve change can clearly determine the fluid nature of the well and delineate the oil–water interface. When the R0 curve of the permeable layer is significantly lesser than the RLLD curve amplitude, the one with amplitude difference is green filled and interpreted as oil layer, and when the R0 curve of the permeable layer and the RLLD curve amplitude basically overlap, the reservoir is interpreted as water layer, and the oil–water interface delineation is very obvious. The results demonstrate that the predicted R0, by using artificial neural network, can well-remove the influence of oil and gas fluids on resistivity, and the results of identifying fluid properties by overlaying with deep lateral resistivity are in good agreement with the actual results, which provides basic data for identifying strongly heterogeneous reservoir deserts with complex pore structure.

FIGURE 4. Result figure of R0 predicted by the artificial neural network.
The GR curve reflects the lithological and physical information of the stratum, and its shape can reflect the development of sediment rotation, help judge the hydrodynamic stability of the microphase section to characterize the heterogeneity of the reservoir, and can also be used to judge the mud content of the stratum. It has obvious advantages in judging the lithological changes of the marker layer.
The variance root of variation (GS) can reflect the degree of serration and the variation of sediment heterogeneity in the microphase section. A strong degree of serration in the logging curve indicates intermittent deposition of sediments. The greater the fluctuation of the value, the greater the number of sawtooths, and the greater the value of GS; conversely, the smaller the value of GS. The variation of GR curve values can reflect the lithological variation of sandstone and mudstone, and the sandstone values are lower than the mudstone values. Within the sandstone layer, the fluctuation of the GR value is related to whether the sandstone is hydrodynamically stable during deposition, so this paper uses the variance root of variation (GS) calculated by the GR curve to observe the change status of sedimentary heterogeneity (Jin et al., 2006; Han, 2019; Wood, 2022).
The formula for GS is as follows.
In Eq. 1: GR (i) is the GR value of the logging curve and M is the number of data points in the well section.
The GR was used to calculate the variance root of variation (GS) to observe the lithological variation and sedimentary heterogeneity variation characteristics of the formation section (Figures 5, 6). Well X has four main perforation oil formation groups, namely, ZJ3, ZJ4, ZH1, and ZH2, of which ZJ3 shot three small layers, namely, ZJ3-1, ZJ3-2, and ZJ3-3. Among them, the mean values of GS for ZJ3 (ZJ3-1, ZJ3-2, and ZJ3-3); ZJ4; ZH1; and ZH2 were 1.44 (2.78, 1.15, and 1.15), respectively. ZJ3 (ZJ3-1, ZJ3-2, and ZJ3-3); ZJ4; ZH1; and ZH2 mean values of GS are 1.44 (2.78, 1.15, and 1.28), 0.64, 0.97, and 0.88, respectively. Combined with the curve fluctuations of GS of the main oil layers (Figure 5), it can be qualitatively seen that the curve fluctuations of layer ZJ4 are weak and the reservoir is relatively good; ZH1 and ZH2 layers are on the same level with obvious fluctuations. The curve fluctuation of ZJ3 is larger, it is hydrodynamically unstable, and sedimentation heterogeneity is stronger. Therefore, the GS can well-reflect the heterogeneous variation characteristics of the reservoir, which has obvious advantages in assisting the judgment of favorable reservoirs and provides data support for classification of petrophysical facies of strongly heterogeneous reservoirs.

FIGURE 5. Result figure of the GS of the main oil reservoir of well X.
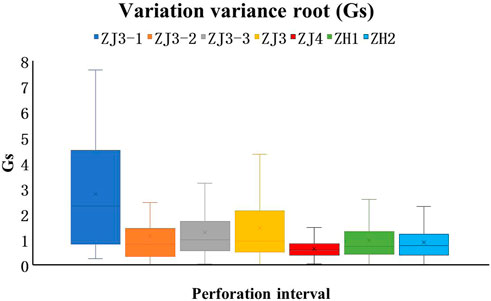
FIGURE 6. Box plot of GS of the main oil reservoirs in well X.
The study of reservoir logging facies is carried out to transform the non-homogeneous and non-linear problems of complex reservoirs into homogeneous and linear problems, which can better identify the petrophysical facies. MRGC is used as an unsupervised clustering algorithm to classify log phases, which provides an experimental basis and theoretical basis for identifying petrophysical facies in the heterogeneous reservoirs in the area. Combined with the pore structure classification table of the core scale, the log facies are classified under the pore structure classification constraint to identify petrophysical phases.
The MRGC algorithm is based on characterizing each depth logging sample point with two indices describing the relationship between adjacencies: the neighborhood index (NI) and the Kernel representation index (KRI). Based on the relationship between the two indices, NI and KRI, small natural data groups are formed that may differ significantly in size, shape, separation, and number. These groups are then gradually fused into a higher proportion of groups. Mutations in the KRI correspond to the optimal number of clusters at different resolutions, and the optimal number of splits is determined using mutations on decreasingly ordered KRI curves for automated cluster analysis (Gan, 1994; Ye and Rabiller, 2000).
The formula for the proximity index NI is as follows.
In Eq. 2: S (x) is the minimum neighborhood value relative to each of x, Smax is the maximum neighborhood value, and Smin is the minimum neighborhood value.
The number of optimal classes is actually a function of “resolution,” the clustering result with more classification results (high resolution) is obtained by subdividing one of the classes from the clustering result with fewer classification results (low resolution), and then the optimal class selection can be made according to the actual demand.
The KRI is a combined function of the NI(x), the number of neighbors M(x, y), and the distance function D (x, y).
In Eq. 3: M (x,y)=n; y is the nth neighboring value of x; and D (x,y) is the distance between point x and point y.
The MRGC algorithm is carried out as follows (Figure 7): first, a representative key well is selected as the standard well for modeling; then, different parameter combination curves are input as learning curves, and data normalization and anomaly removal are performed to equalize the weights of different input curves; second, the MRGC algorithm is used to calculate the (NI) and (KRI). The optimal number of log facies is determined by using the KRI to cluster the sample data and output the optimal clustering results; finally, the optimal combination of parameters to classify the log facies is determined by comparing the results of different combinations of parameters.
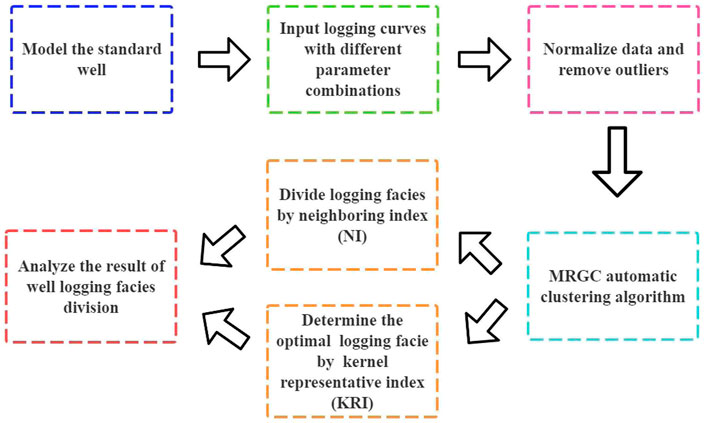
FIGURE 7. Flow chart of the MRGC algorithm logging facies division.
The preferred conventional logging curve, the constructed saturated pure water resistivity value (R0), and the GR curve to calculate the variance root of variation (GS) were used as the petrophysical sensitivity parameters of the target area by the previous section. Based on the analysis of the logging curve mechanism, the optimal combination of GR, AC, CNL, DEN, R0, and GS was determined to classify the logging facies, and then the MRGC algorithm was used to classify the logging facies. The layer interface between the delineated reservoir and non-reservoir by this combination of logging parameters using MRGC clustering is basically consistent with the manually delineated layer interface, and the different logging facies types within the delineated reservoir are clearly defined, which can subdivide different non-homogeneous layer types within the reservoir, and the same logging phase types have similar logging response characteristics, which well-reflect the reservoir heterogeneity characteristics of the target formation (Figure 8).
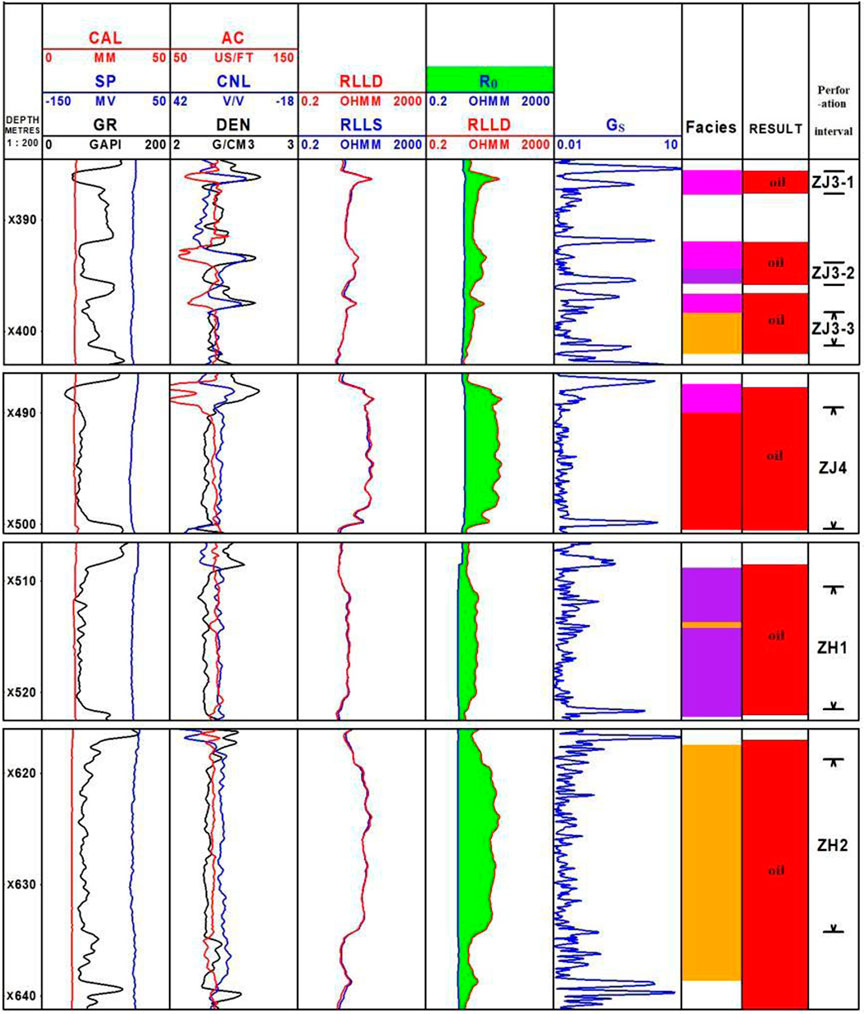
FIGURE 8. Figure of logging facies delineation results of well X.
Based on the pore structure classification of the core scale (Table 1), the phases with very similar characteristics among the log facies classified by the MRGC algorithm were optimized and merged after automatic clustering using log data, and finally five types of petrophysical facies were identified and combined with petrophysical nomenclature to ensure that the corresponding log phases have consistent petrophysical facies characteristics in the geological sense. After the five types of petrophysical facies are named, There are four types of sandstone petrophysical facies, namely, coarse–medium sandstone corrosion facies, coarse–medium sandstone transition facies, medium–fine sandstone compaction facies, and fine sandstone calcareous cementation facies, plus mudstone (Figure 8 and Table 2).
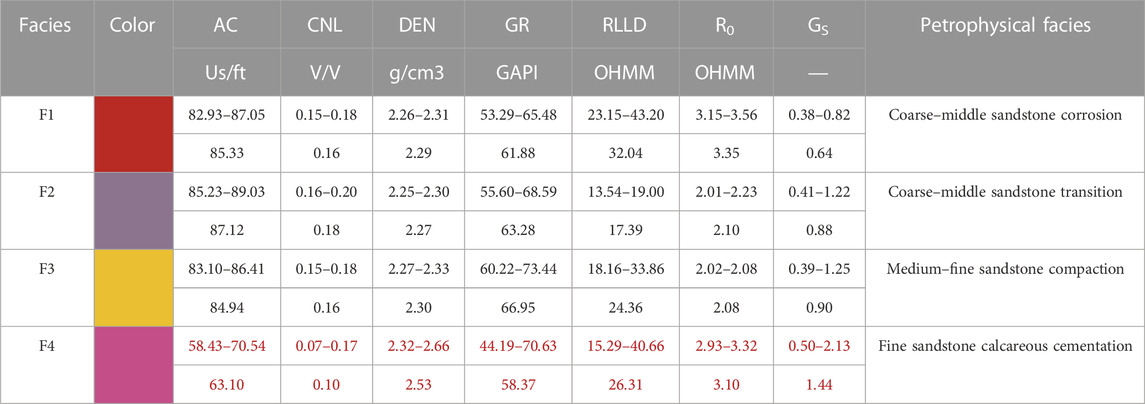
TABLE 2. | Analysis of different petrophysical facies logging responses of the target reservoir in the study area.
F1 is coarse–medium sandstone corrosion facies (Figure 8 and Table 2), the reservoir has a medium–high pore permeability, good physical properties, is a good-quality reservoir, has high production capacity, and logging response with low DEN, CNL, and GR values and high AC and RD values of “three low and two high” characteristics. The distribution range of the AC value is from 82.93 to 87.05 us/ft, the distribution range of the CNL value is from 0.15 to 0.18 V/V, the distribution range of the GR value is from 53.29 to 65.48 GAPI, the distribution range of the DEN value is from 2.26 to 2.31 g/cm3, the distribution range of the RLLD value is from 23.15 to 43.20 Ω m, the distribution range of the R0 value is from 3.15 to 3.56 Ω m, the distribution range of the GS value is from 0.38 to 0.82 with a mean value of 0.64, and Gs values were low.
F2 is a coarse–medium sandstone transition facies, the reservoir is of medium pore medium permeability, shows medium preference for physical properties, is a good-quality reservoir, has high production capacity and logging response, and has low DEN and GR values, medium RLLD value, and high AC and CNL values of “two low, one medium, and two high” characteristics. The distribution range of the AC value is from 85.23 to 89.03 us/ft, the distribution range of the CNL value is from 0.16 to 0.20 V/V, the distribution range of the GR value is from 55.60 to 68.59 GAPI, the distribution range of the DEN value is from 2.25 to 2.30 g/cm3, the distribution range of the RLLD value is from 6.54 to 9.00 Ω m, the distribution range of the R0 value is from 2.01 to 2.23 Ω m, the distribution range of GS value is from 0.41 to 1.22 with a mean value of 0.88, and Gs value is larger than F1.
F3 is a medium–fine sandstone compaction facies, the reservoir is of low-to-medium pore permeability, has medium physical properties, is a medium-quality reservoir, has general production capacity and logging response with low AC and CNL values and medium RLLD, DEN, and GR values of “two low and three medium” characteristics. The distribution range of the AC value is from 83.10 to 86.41 us/ft, the distribution range of the CNL value is from 0.15 to 0.18 V/V, the distribution range of the GR value is from 60.22 to 73.44 GAPI, the distribution range of the DEN value is from 2.27 to 2.33 g/cm3, the distribution range of the RLLD value is from 18.16 to 33.86 Ω m, the distribution range of the R0 value is from 2.02 to 2.08 Ω m, the distribution range of the GS value is from 0.39 to 1.25 with a mean value of 0.90, and the Gs value is slightly larger than F2.
F4 is a fine sandstone calcareous cementation facies, this reservoir has low pore and low permeability, poor physical properties, is a poor-quality reservoir, has low production capacity and logging response, and has low AC, CNL, and GR values and high RLLD and DEN values of “three low and two high” characteristics. The distribution range of the AC value is from 58.43 to 70.54 us/ft, the distribution range of the CNL value is from 0.07 to 0.17 V/V, the distribution range of the GR value is from 44.19 to 70.63 GAPI, the distribution range of the DEN value is from 2.32 to 2.66 g/cm3, the distribution range of the RLLD value is from 15.29 to 40.66 Ω m, the distribution range of the R0 value is from 2.93 to 3.32 Ω m, and the distribution range of the GS value is from 0.50 to 2.13 with a mean value of 1.44 and high Gs values.
Combining the aforementioned results, we can classify the log facies reservoir under the pore structure classification constraint well so as to delineate different petrophysical facies. The petrophysical facies classification results obtained by this process correspond to the actual geological significance of the petrophysical facies, which is more comprehensive and practical, and the classification results are more effective than those of the traditional physical methods that directly evaluate the theoretical significance of the petrophysical facies.
Based on reservoir pore structure characterization for log facies reservoir classification, evaluation of petrophysical facies and full exploitation of the pore permeability characteristics and capacity differences of different petrophysical facies have high practical production significance. Using the pore permeability model in reservoir classification, the accuracy is often not high in the calculation of low-pore and low-permeability reservoirs. However, the classification method in this paper directly adopts conventional logging data and pretreatment data, avoiding the calculation of pore permeability data, which has the advantage of the method. The coarse–medium sandstone corrosion facies F1 is the dominant facies zone, and the reservoir with the best physical properties and strong pore throat connectivity of this type of petrophysical facies is developed, and its pore permeability value is relatively high (Figure 9), with the porosity generally greater than 20%, permeability greater than 800 mD, and low pore permeability slope, KF1 = 0.2894. The fine sand calcareous cementation facies F4 is mainly affected by carbonate cementation in the diagenetic stage, with poor physical property and weak dissolution transformation, resulting in poor reservoir physical property and lowest porosity and permeability. Affected by heterogeneity, it has a large porosity and permeability span, with the porosity between 5 and 20% and permeability between 0.1 and 100 mD, and the highest porosity and permeability slope. KF4=0.6215. The medium–fine sandstone compaction facies F3 is mainly influenced by compaction and has average physical properties, its pore permeability is lower than F1 and F2 as a whole, the pore permeability slope is between F2 and F4, KF3 =0.4967, the porosity is between 10% and 17%, and the permeability is between 50 and 700 mD. The coarse–medium sandstone transition facies F2 has reservoir properties between coarse–medium sandstone corrosion facies F1 and medium–fine sandstone compaction facies F3, with a lower slope relationship of pore permeability, slightly higher than F1 (overall slope KF1 <KF2 <KF3 <KF4), KF2 =0.3563. The pore permeability is relatively good, with porosity generally greater than 15% and permeability greater than 300 mD.
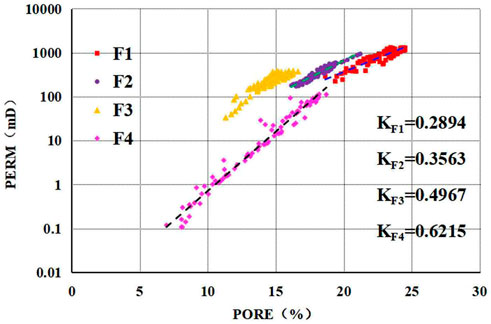
FIGURE 9. Relationship between porosity and permeability of different petrophysical facies.
It is found that the heterogeneous reservoir sweet spot is mostly gathered in the secondary pore space with large primary porosity or developed by local dissolution, represented by the coarse–middle sandstone corrosion facies with a better pore structure and higher production capacity (Figure 10) (Pan et al., 2018; Feng et al., 2020). The effective thickness of the F1 representative layer is 12 m, the daily output production can reach 807.4 m3/d, and the ratio oil productivity index is 41.53 m3/(MPa.d.m). The effective thickness of the F3 representative layer is 15.5 m, the daily output production is 667.8 m3/d, and the ratio oil productivity index is 23.54 m3/(MPa.d.m). The coarse–medium sandstone transition facies has complex components, and the physical properties are between coarse–medium sandstone corrosion facies and coarse–medium sandstone compaction facie. The representative layer of F2 with effective thickness is 11 m, daily output production is 620.1 m3/d, and the ratio oil productivity index is 33.56 m3/(MPa.d.m). Due to the “calcium content,” the resistivity of fine sandstone calcareous cementation facies is high, but due to the influence of carbonate cement, the physical property is very poor and the productivity is low. The effective thickness of the F4 representative layer is 7 m, the daily output production is 369.5 m3/d, and the ratio oil productivity index is 18.72 m3/(MPa.d.m), which is only one-third of the productivity of coarse–medium sandstone corrosion facies. By comparing the difference of production capacity of different petrophysical facies, it is important to predict the reservoir sweet spot of strongly heterogeneous reservoirs and the adjustment of oil field development measures.

FIGURE 10. Analysis comparison of productivity capacity of different petrophysical facies.
This paper starts from conventional logging data; integrates core analysis data such as core cast thin section, pore permeability data, rock electrical parameters, grain size, and relative permeability curves to classify the pore structure of reservoirs; classifies logging facies based on the automatic clustering MRGC algorithm for conventional logging preference curves, R0 and Gs (based on GR); and innovatively proposes a natural gamma curve based on “fluctuation” intensity for strongly non-homogeneous reservoirs. The wave intensity petrophysical classification logging model for strongly heterogeneous reservoirs improves the efficiency and accuracy of petrophysical facies classification for heterogeneous reservoirs, thus solving the problem of predicting the dominant section of heterogeneous reservoirs.
(1) Comprehensive core analysis information is used to carry out core-scale pore structure characterization and establish petrophysical facies classification criteria, thus realizing the systematic and comprehensive research on heterogeneous reservoirs. Petrophysical phases can comprehensively characterize the pore structure and diagenesis of rocks, and it is more practical to classify reservoirs and identify deserts by classifying different petrophysical phases.
(2) Based on the artificial neural network algorithm, we can quantitatively predict the resistivity of saturated pure water R0 based on conventional data, remove the influence of oil and gas fluids on resistivity, and superimpose the resistivity of saturated pure water (R0) with deep lateral resistivity to assist in identifying fluid properties, which is in good agreement with the actual results and provides basic data for the identification of strongly heterogeneous reservoir deserts with complex pore structure.
(3) The GR “fluctuation” is used to calculate the variance root of variation (GS), which can well-reflect the lithological variation characteristics of the reservoir and the sedimentary heterogeneity variation status; has obvious advantages in assisting the judgment of favorable reservoirs; and provides data support for the classification of petrophysical facies of strongly heterogeneous reservoirs.
(4) The MRGC clustering algorithm divides log facies by clustering analysis of sample data, which operates quickly and significantly improves the accuracy of clustering results, and is currently an ideal method for reservoir log facies delineation. Based on the classification of pore structure, the log facies classification and evaluation of petrophysical facies can fully exploit the pore permeability characteristics and capacity differences of different petrophysical facies, which is of high practical production significance. Under the constraint of “phase control”, the pore permeability model is established to analyze the pore permeability relationship of different petrophysical facies, which can improve the accuracy of reservoir interpretation by transforming the non-homogeneous and non-linear problems of complex reservoirs into homogeneous and linear problems. By analyzing the pore permeability relationship and production capacity of different petrophysical facies, it is important to predict the desert of strongly heterogeneous reservoirs and adjust oil field development measures.
The original contributions presented in the study are included in the article/Supplementary Material. Further inquiries can be directed to the corresponding author.
All authors have made a substantial, direct, and intellectual contribution to the work. XZ conceived and supervised the project. QM and XZ wrote the manuscript. All authors contributed to the article and approved the submitted version.
Author TT was employed by Shenzhen Branch of CNOOC Ltd.
The remaining authors declare that the research was conducted in the absence of any commercial or financial relationships that could be construed as a potential conflict of interest.
All claims expressed in this article are solely those of the authors and do not necessarily represent those of their affiliated organizations, or those of the publisher, the editors, and the reviewers. Any product that may be evaluated in this article, or claim that may be made by its manufacturer, is not guaranteed or endorsed by the publisher.
Aminian, K., and Ameri, S. (2005). Application of artificial neural networks for reservoir characterization with limited data. J. Petroleum Sci. Eng. 49 (3-4), 212–222. doi:10.1016/j.petrol.2005.05.007
Cao, T. (2020). Characteristics of diagenesis and pore evolution of the sandstone reservoir of the paleozoic Zhuhai Formation in the Huizhou depression. Beijing: China University of Petroleum. doi:10.27643/d.cnki.gsybu.2020.000288
Cao, X. (2020). Petrological characteristics of the sandstone reservoirs of the Paleoproterozoic Zhuhai Formation in the Huizhou Depression and their geological significance. Beijing: China University of Petroleum. doi:10.27643/d.cnki.gsybu.2020.000215
Cheng, K., Zhang, F., Yan, F., Wu, F., Liu, Y., Zhang, B., and Xie, H. (2022). Macroscopic inhomogeneity characteristics of dense sandstone reservoirs and control of hydrocarbons in the Long 4+5 and Long 6 oil formations in the WL area of Ordos Basin. J. Hebei Univ. Geosciences 45 (03), 31–38. doi:10.13937/j.cnki.hbdzdxxb.2022.03.005
Dai, J., Zhang, Y., Xiong, Q., Zhang, C., Bai, X., and Liang, C. (2004). Classification of petrophysical phases by fuzzy clustering method. J. Petroleum Univ. Nat. Sci. Ed. 28 (2), 12–16. doi:10.3321/j.issn:1000-5870.2004.02.004
Fan, H., Zhao, X., Liang, X., Miao, Q., Jin, Y., and Wang, X. (2022a). Semi-supervised learning-based petrophysical facies division and " sweet spot" identification of low-permeability sandstone reservoir. Front. Earth Sci. 9, 805342. doi:10.3389/feart.2021.805342
Fan, H., Zhao, X., Wang, Z., Zhang, Z., and Chang, A. (2022b). Quantitative prediction of low-permeability sandstone grain size based on conventional logging data by deep neural network-based BP algorithm. Geofluids 2022, 1–24. doi:10.1155/2022/7498449
Feng, J., Zhao, B., Zhang, Z., and Zhang, C. (2020). Methodology of reservoir logging capacity classification and identification in Huizhou Depression, Zhujiangkou Basin. Phys. Chem. Explor. 44 (01), 81–87 doi:10.11720/wtyht.2020.1199
Gan, C. (1994). Une approche de classification non supervisée basée sur la notion des K plus proches voisins, Amiens, France: University of Technology of Compiegne.
Graupe, D. (1997). Principles of artificial neural networks. Chicago, United states:World Scientific.
Graupe, D. (Singapore: World Scientific Publishing Co. Pte. Ltd., (2019). Principles of artificial neural networks: Basic designs to deep learning.
Han, Y. (2019). Research on automatic identification model of sedimentary micro-phase of PI2 sand formation in South-West Zone 2, Lama Dian Oilfield. East China: China University of Petroleum. doi:10.27644/d.cnki.gsydu.2019.001635
Huang, Y., Wan, J., Sun, P., Ma, Q., Zhang, M., Bai, S., He, Y., and Cheng, D. (2017). Comprehensive evaluation of complex reservoir logging based on petrophysical phase analysis-a case study of a section of reservoir in the Liushagang Formation in Yong'an area of Fushan Oilfield. J. Changjiang Univ. (Self Sci. Ed. 14 (11), 32–39+5. doi:10.16772/j.cnki.1673-1409.2017.11.007
Huizinga, B., and Lomando, A. (1990). Petroleum geology of the zhu-1 depression, Pearl River Mouth basin, people's republic of China: ABSTRACT. AAPG Bull. 74 (5). doi:10.1306/44B4ABCC-170A-11D7-8645000102C1865D
Jiang, M., Chen, D., Chang, X., Shu, L., and Wang, F. (2022). Controlling effect of tectonic-paleogeomorphology on deposition in the South of lufeng sag, Pearl River Mouth basin. Adv. Geo-Energy Res. 6 (5), 363–374. doi:10.46690/ager.2022.05.02
Jin, S., Zhu, X., and Zhong, D. (2006). Application of variance function in automatic identification of sedimentary microphase. J. Petroleum 27 (3), 57–60. doi:10.3321/j.issn:0253-2697.2006.03.012
Lai, J., Wang, G., Chen, M., Wang, S., Chai, Y., Cai, C., Zhang, Y., and Li, J. (2013). Evaluation of reservoir pore structure classification based on petrophysical phases: An example of the long 8 oil formation in ji plateau area of Ordos Basin. Petroleum Explor. Dev. 40 (005), 000566–000573. doi:10.11698/PED.2013.05.08
Lai, J., Wang, G., Wang, S., Xin, Y., Wu, Q., Zheng, Y., Li, J., and Cang, D. (2013). A review of rock-forming phase logging identification methods for clastic reservoirs and research progress. J. Central South Univ. Nat. Sci. Ed. 44 (12), 12.
Leyla, B., Zhang, J., and Yang, L. (2018). Quantitative analysis of faults in Huizhou sub-basin, Pearl River Mouth basin. J. Earth Sci. 29 (1), 169–181. doi:10.1007/s12583-018-0823-3
Li, Q., and Li, Y. (1997). Application of synthetic R0 technology to identify oil and water layers. Sci. Technol. Eng. 12 (15), 3738–3740. doi:10.3969/j.issn.1671-1815.2012.15.044
Liu, B., Zhao, X., Fu, X., Yuan, B., Bai, L., Zhang, Y., and Ostadhassan, M. (2020). Petrophysical characteristics and log identification of lacustrine shale lithofacies: A case study of the first member of qingshankou Formation in the songliao basin, northeast China. Interpretation 8 (3), SL45–SL57. doi:10.1190/int-2019-0254.1
Liu, J., Wang, Q., Feng, J., et al. (2021). Classification and evaluation of complex sandstone reservoirs based on petrophysical phase - an example of Huizhou depression in the Pearl River mouth basin. China Pet. Explor. 26 (2), 92–102 doi:10.3969/j.issn.1672-7703.2021.02.010
Pan, B., Fang, C., Guo, Y., Zhang, L., Lei, J., and Fan, Y. (2018). Evaluation of logging and capacity prediction of Sulig tight sandstone reservoir based on petrophysical conversion model. J. Geophys. 61 (12), 5115–5124. doi:10.6038/cjg2018L0724
Rahsepar, A., Kadkhodaie, A., and Nabi-Bidhendi, M. (2016). Determination of reservoir electrofacies using clustering methods (MRGC, AHC, SOM,DYNCLUST) throughout arab part in salman oil field 2S-05 well Tehran, Iran: Petroleum research. doi:10.22078/pr.2016.634
Shi, H., He, M., Zhang, L., Yu, Q., Pang, X., Zhong, Z., and Liu, L. (2014). Geological characteristics of oil and gas in the Zhujiangkou Basin (East), formation pattern and next exploration strategy. China Offshore Oil Gas 26 (03), 11–22.
Shi, X., Lv, H., Cui, Y., Meng, L., and Ye, X. (2018). Log phase delineation and permeability evaluation based on graph-theoretic multi-resolution clustering method-an example of the Guantao Formation in the W well area of the P oilfield in the Bohai Sea. China Offshore Oil Gas 030 (001), 81–88. doi:10.11935/j.issn.1673-1506.2018.01.010
Soete, J., Huysmans, M., Claes, H., Claes, H., Mehmet, O., and Swennen, R. (2014). Petrophysical and geostatistical analysis of porosity-permeability and occurrence of facies types in continental carbonates of the Ballık area. Denizli, Turkey, London, Englanda: The Geological Society.
Tian, L., Shi, He., Liu, J., Zhang, X., Liu, J., and Dai, Y. (2020). Significant discovery and significance of new field exploration in Huizhou Depression, Zhujiangkou Basin. China Pet. Explor. 25 (04), 22–30.
Tian, Y., Xu, H., Zhang, X., Wang, H. J., Guo, T. C., Zhang, L. J., et al. (2016). Multi-resolution graph-based clustering analysis for lithofacies identification from well log data: Case study of intraplatform bank gas fields, Amu Darya Basin. Appl. Geophys. 13 (04), 598–607. doi:10.1007/s11770-016-0588-3
Tulsa, D. (1992). Petrophysical evaluation of a slope fan/basin-floor fan complex: Cherry Canyon Formation, Ward County, Texas. Aapg Bull. 76 (6), 19–29. doi:10.1159/000121526
Wang, H., Wang, M., Bai, C., He, Z., Bai, H, D., and Bai, H, Y. (2022). Non-homogeneity of long 6 reservoir and its influencing factors in Zizhang oilfield Z128 well area. J. Xi'an Univ. Petroleum Nat. Sci. Ed. 37 (04), 17–25.
Wood, D. (2022). Gamma-ray log derivative and volatility attributes assist facies characterization in clastic sedimentary sequences for formulaic and machine learning analysis. Adv. Geo-Energy Res. 6 (1), 69–85. doi:10.46690/ager.2022.01.06
Wu, H., Wang, C., Feng, Z., Yuan, Y., and Xu, B. S. (2020). Adaptive multi-resolution graph-based clustering algorithm for electrofacies analysis. Appl. Geophys. 17 (01), 13–25. doi:10.1007/s11770-020-0806-x
Ye, S., and Rabiller, P. (2000). A new tool for electro-facies analysis: Graph-based clustering. Spwla annual logging symposium Dallas, TX: The SPWLA 41st Annual Logging Symposium.
Yu, Q. (2022). Logging phase analysis and lithology identification based on MRGC clustering method - an example of submerged mountain formation in Z oilfield. Petroleum Geol. Eng. 36 (01), 31–38 doi:10.3969/j.issn.1673-8217.2022.01.006
Yue, L., Meng, Q., Liu, Z., Yang, W., Jin, H., Shen, F., Zhang, J., and Liu, S. (2022). Physical properties and non-homogeneous characteristics of dense sandstone reservoirs: An example from section 6 of the upper triassic sujiahe Formation in the central sichuan basin, guang'an area. Petroleum Nat. Gas Geol. 43 (03), 597–609.
Keywords: heterogeneity, petrophysics, MRGC, reservoir classification, Pearl River Mouth Basin, the variance root of variation
Citation: Zhao X, Miao Q, Zhao R, Liang X, Wang X and Tian T (2023) Evaluation of petrophysical classification of strongly heterogeneous reservoirs based on the MRGC algorithm. Front. Earth Sci. 11:1169258. doi: 10.3389/feart.2023.1169258
Received: 19 February 2023; Accepted: 27 February 2023;
Published: 20 March 2023.
Edited by:
Xinmin Ge, China University of Petroleum, ChinaReviewed by:
Shaoqun Dong, China University of Petroleum, Beijing, ChinaCopyright © 2023 Zhao, Miao, Zhao, Liang, Wang and Tian. This is an open-access article distributed under the terms of the Creative Commons Attribution License (CC BY). The use, distribution or reproduction in other forums is permitted, provided the original author(s) and the copyright owner(s) are credited and that the original publication in this journal is cited, in accordance with accepted academic practice. No use, distribution or reproduction is permitted which does not comply with these terms.
*Correspondence: Quansheng Miao, MTE3OTgwMzkxOEBxcS5jb20=
Disclaimer: All claims expressed in this article are solely those of the authors and do not necessarily represent those of their affiliated organizations, or those of the publisher, the editors and the reviewers. Any product that may be evaluated in this article or claim that may be made by its manufacturer is not guaranteed or endorsed by the publisher.
Research integrity at Frontiers
Learn more about the work of our research integrity team to safeguard the quality of each article we publish.