 Qiufen Zhang1,2
 Xizhi Lv
 Yongxin Ni
 Jianwei Wang
- 1Yellow River Institute of Hydraulic Research, Henan Key Laboratory of Yellow Basin Ecological Protection and Restoration, Zhengzhou, China
- 2Henan Key Laboratory of Yellow Basin Ecological Protection and Restoration, Zhengzhou, China
- 3College of Hydrology and Water Resources, Hohai University, Nanjing, China
- 4College of Surveying and Geo-Informatics, North China University of Water Resources and Electric Power, Zhengzhou, China
Previous studies have found that climate change and underlying surface change are the most direct and important drivers of the streamflow change in the Yellow River Basin. However, there are significant spatial differences in climate and underlying surface in the Yellow River Basin, especially in the Loess Plateau, attribution analysis of runoff evolution in the Loess Plateau from the perspective of spatial heterogeneity was rarely reported. Therefore, in order to further reveal the causes of runoff evolution in the Loess Plateau, this study have quantitatively revealed the spatial differences of climate and underlying surface changes driving streamflow changes in 34 main Loess Plateau basins from 1956 to 2020 basing on the Budyko equation with fixed parameters. Results show that the streamflow on the Loess Plateau decreased significantly from 1956 to 2020, and streamflow decreased by 17.19 mm (26.95%) after abrupt change in 1990. The sensitivity coefficients of streamflow change on the Loess Plateau to precipitation, potential evapotranspiration and underlying surface parameters are 0.30, −0.08 and −69.26 respectively. The contributions of precipitation, potential evapotranspiration and underlying surface change to streamflow change were 26.24%, 2.15% and 73.01%, respectively, and showed significant spatiotemporal differences. The spatial variability of streamflow is mainly controlled by underlying surface. For 29 of the whole 34 tributaries, underlying surface change was the dominant driver of streamflow change with the contribution of 52.50%–98.22%. The temporal variability of streamflow on the Loess Plateau is mainly controlled by precipitation. The wetter the climate is, the more sensitive of the streamflow changes are to climate change. And the smaller the underlying surface parameters are, the more sensitive the streamflow changes are to the underlying surface change. The results further deepen our understanding for the response of streamflow to climate and underlying surface changes in the Loess Plateau and can provide theoretical support for systematic regulation of basin water resources in the future.
1 Introduction
The shortage of global water resources is the main challenge for human beings to achieve sustainable development, the driving factors of water resources shortage and its impact on the global or regional have also been the focus of hydrological research. With the rapid change of climate and underlying surface, the global water cycle process accelerates (Olmedo et al., 2022), significantly changing the temporal and spatial distribution of water resources (Yang D. et al., 2021). Streamflow is an important part of water resources, and under the influence of gradually intensifying human activities, streamflow changes in major basins around the world are obvious (Wang et al., 2020). Streamflow of major rivers in China shows a downward trend (Zhang et al., 2020b), of which the streamflow of the Loess Plateau involved in the Yellow River basin has decreased most significantly, further intensifying the contradiction between supply and demand of water resources in the region (Li, 2018). However, the cause of streamflow change on the Loess Plateau is still uncertain, and accurate identification of the main driving factors of streamflow change is of great significance for scientific management of water resources and prediction of water resources change (Berghuijs and Woods, 2016).
A large number of studies have been conducted on streamflow change attribution analysis and drivers identification (Li and Quiring, 2021; Zhang et al., 2021; Zheng et al., 2021; Wang et al., 2022). The global scale studies divide the streamflow change of major rivers into growth type and attenuation type, and then point out that precipitation, evapotranspiration and human activities are the main factors driving the streamflow change, the dominant driver of growth-type rivers is precipitation, and the dominant driver of attenuation-type rivers is human activities (He et al., 2021; Hu et al., 2021; Villarini and Wasko, 2021). Subsequent studies found that the dominant driver of river streamflow change was regional differences. For example, most rivers in the Americas were affected by climate change, while the dominant driver of streamflow change in the Asian basin was the underlying surface change. Similar studies also found that the dominant drivers of streamflow change in different regions within the same basin are also different. For example, the streamflow change in the source region of the Yellow River is mainly dominated by climate change, and the streamflow change in the middle and lower reaches of the Yellow River is mainly dominated by the change of underlying surface (Ni et al., 2022). Recent studies also indicated that climate and underlying surface changes had different impacts on streamflow in different regions of the basin (Khan et al., 2016). For example, climate change leads to the streamflow increase in the source region but the decrease of streamflow in the middle and lower reaches of the Loess Plateau.
The driving factors of the dominant streamflow evolution also have obvious time-varying characteristics (Wang et al., 2019). Similar to the hydrological process, the climatic factors also have a non-stationary trend, which leads to the obvious time-varying characteristics in climate input (Wang et al., 2020). According to the latest IPCC AR6 (IPCC, 2021), the global temperature generally shows an increasing trend in the future, which will further affect the current situation of water cycle by increasing the water holding capacity of the atmosphere, accelerating the water cycle process, and then affecting the spatial and temporal distribution of water cycle elements such as precipitation, evaporation, streamflow and soil moisture content (Jin et al., 2013). In addition to climate change factors, the characteristics of underlying surface of watershed, such as vegetation cover and land use, would also change along with time. Especially since the 1970s, large-scale soil and water conservation measures, such as terraced fields, check dams and Returning Farmland to Forest and Grassland Project have been implemented on the Loess Plateau, and significantly changed the underlying surface morphology of the Loess Plateau. Due to the impact of above soil and water conservancy projects, the measured streamflow has decreased sharply. In addition, many studies showed that climate change was another main driving factor for streamflow reduction in the middle reaches of the Yellow River from 1980 to 2000. While after 2000, the change of underlying surface change caused by the implementation of large-scale soil and water conservation measures was the main reason for streamflow change. Similar studies have also revealed that the time variation of artificial water intake such as farmland irrigation was another reason for the time difference of streamflow change.
Statistical analysis, hydrological model and water heat coupling are three common methods for attribution of streamflow evolution. The statistical analysis method is simple in calculation. But it can only empirically analyze the causes of streamflow changes of climatic and non climatic factors from the perspective of mathematical statistics but a lack of physical mechanism explanation. By contrast, the hydrological model method can describe the physical process of water cycle in detail, but it involves too many parameters, which made the calculation and calibration process complicated. In addition, the water heat coupling methods have been widely used due to its advantages in physical significance expression, less parameters and relatively simple calculation process compared with the hydrological model method. Among them, the Budyko equation is the most representative. In previous studies, the Budyko equation with fixed parameters was used to quantify the impact of climate change and underlying surface change on streamflow, and it was found that in general, the underlying surface change had a more far-reaching impact on streamflow in the study area (Liang et al., 2015; Zhao et al., 2018; Wang et al., 2019; Yang Z. et al., 2021). However, we found that previous studies often took the entire study basin as the research object, and analyzed the streamflow stage changes in the base period and change period throughout the study period. Different periods and different mutation testing methods often led to different streamflow attribution conclusions (Wu et al., 2017; Yu et al., 2021). Ignoring the time-varying characteristics of underlying surface parameters will inevitably lead to one-sided research conclusions.
Previous studies quantitatively analyzed the impacts of climate change and underlying surface change on streamflow from different perspectives. However, few studies have revealed the law of spatial difference of dominant factors of streamflow change, and the mechanism of how spatial change of driving factors affects streamflow evolution is still unclear. Recent studies also emphasize that it is necessary to analyze the time variation of streamflow generation mechanism to identify the time difference of dominant factors of streamflow variation. Therefore, it is also a research gap to identify the time difference of the dominant driving factors of streamflow change.
To fill the above research gaps, the main objectives of this study are to 1) analyze the temporal and spatial differences of streamflow changes on the Loess Plateau, 2) reveal the spatial differences of driving effects of climate and underlying surface changes on streamflow changes based on the fixed parameter Budyko equation, 3) use the time-varying parameter Budyko equation to evaluate the time differences of the dominant drivers of streamflow evolution. The research results can provide theoretical support for water resources management and planning of the basin.
2 Data and methods
2.1 Study area
The Loess Plateau (Figure 1) is located in the northwest of China, spanning 289 counties and cities in 7 provinces, including Shanxi, Ningxia, Gansu, Shaanxi and Henan, with a total area of 62.4×10⁴ km2. It includes five different geomorphic regions. The terrain is high in the northwest and low in the southeast, with an altitude of 85–5,210 m. It has a temperate continental climate with an average temperature of 9.72°C–12.87°C during 1961–2017 (An et al., 2021). The water resources on the Loess Plateau are congenitally deficient. The average annual precipitation is about 400–600 mm during 1965–2014 and mainly from June to September (Xu et al., 2018). The Loess Plateau is located in the transitional zone between the semi humid climate and the arid and semi-arid climate in China. It is very sensitive to climate change and human activities. The ecological environment is fragile, and water and soil loss is serious. In order to improve the ecological environment of the Loess Plateau and improve the regional vegetation conditions, since the 1980s, the Loess Plateau has implemented large-scale watershed management projects, such as returning farmland to forests and grasslands, terraced fields and check dam construction, and achieved good social and ecological benefits.
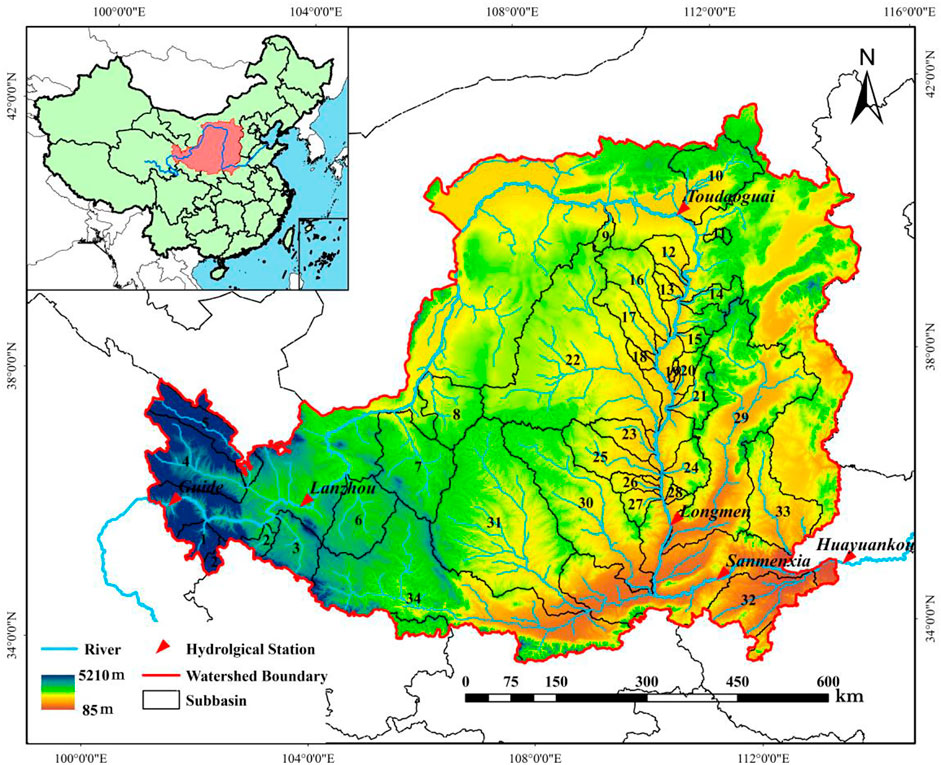
FIGURE 1. The location of the Loess Plateau.
2.2 Data
The hydrological data of the Loess Plateau from 1956 to 2020 are derived from the hydrological yearbook of the Yellow River basin, using the annual streamflow data of 34 basins between Guide and Huayuankou Shuiwen Station (Table 1). The meteorological data of 101 meteorological stations around the Loess Plateau from 1956 to 2020 are from China Meteorological Data Network (http://data.cma.cn) including daily average pressure, precipitation, evapotranspiration, average relative humidity, sunshine hours, average temperature, maximum temperature, minimum temperature and average wind speed. The potential evapotranspiration is calculated by Penman-Monteith formula (Gao et al., 2020). NDVI, soil, land use and GDP, Population data from 1980 to 2020 are from the Resource and Environmental Science and Data Center (www.resdc.cn). The 90 m resolution DEM data comes from the geospatial data cloud (www.giscloud.cn), which is used to represent the terrain distribution characteristics and extract the watershed boundary.
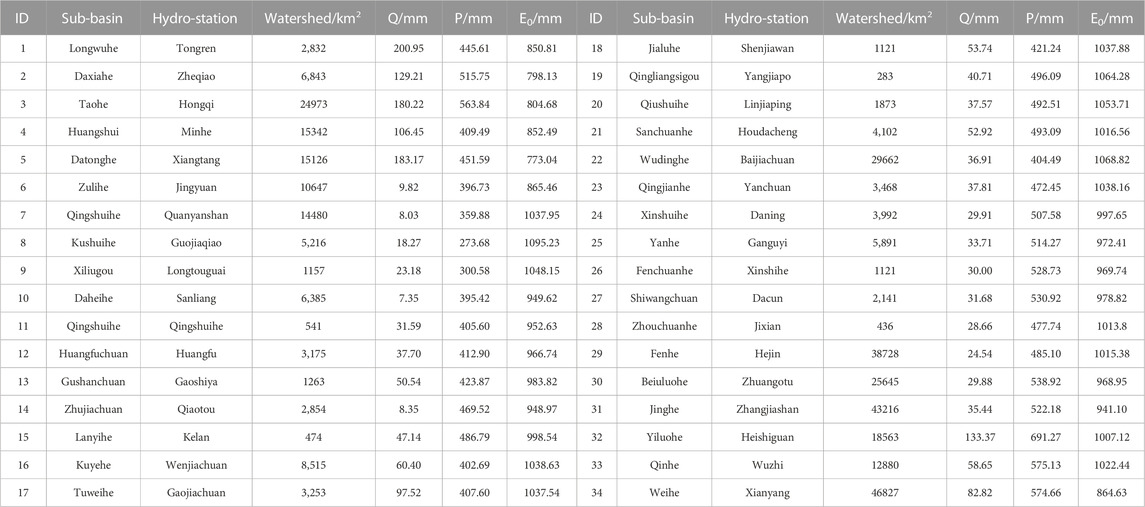
TABLE 1. Characteristics of the main tributaries of the Loess Plateau.
2.3 Methods
2.3.1 Trend and mutation analysis
Mann Kendall test (MK) is a common trend analysis method for hydrometeorological series (Mann, 1945; Kendall, 1975; Jin et al., 2021). This study adopts MK test method to test the trend of hydrological and meteorological series of the Loess Plateau. The cumulative anomaly analysis and double cumulative curve method are used to detect the abrupt point of the annual streamflow series, and the sliding t-test method is used to verify whether there is a significant difference between the average values of the samples of the two sub series. The streamflow series is divided into base period and change period at the abrupt point, and the hydrological climate characteristic value and stage change degree of the two sub series are calculated respectively.
2.3.2 Linear regression analysis
Linear regression analysis can simulate the change trend of each grid, and use the least square method to fit the change slope pixel by pixel within a certain time to comprehensively reflect the spatio-temporal evolution characteristics of elements (A et al., 2017). The spatial change trend of precipitation, evapotranspiration and vegetation coverage in this study is obtained through linear regression analysis, and the calculation formula is as follow:
where slope is the change trend, and the positive and negative represent the increase or decrease trend; n is the time series length of the study;
To further evaluate the significance of the change trend, this study uses the F test method to analyze the significance of the change trend. The formula for calculating the statistical value F is:
where
This study divides the change trend into three grades according to the statistical value of 95% significance level: significant decrease (
2.3.3 Attribution analysis of streamflow change
The attribution analysis adopts the coupled balance equation of water and heat based on the Budyko hypothesis. On a long-term scale, evapotranspiration is mainly determined by the balance relationship between water supply conditions and radiation energy (Lv et al., 2019). The actual streamflow of the basin can be calculated by combining the equation of water balance (P=Q+E). The functional form
Where E, E0 and P represent annual average actual evapotranspiration, annual average potential evapotranspiration and annual average precipitation respectively, mm; and n represent underlying surface characteristic, which is a nondimensional parameter and related to vegetation, terrain, soil and other factors of the basin (Zhou et al., 2015).
Combining the definition of sensitivity coefficient and water balance equation, the partial derivative of Yang formula is used to obtain the sensitivity coefficient of streamflow to precipitation, potential evapotranspiration and underlying surface parameter. And underlying surface parameter is obtained by the least square method, specifically combined with the single variable solution method in Excel.
Where Q represent annual average streamflow, mm. According to the changes of the two stages before and after the mutation of each factor ΔX, and combined with the sensitivity coefficient derived from the above formula, the influence amount of each factor to streamflow change ΔQX and its contribution rate ηX, %, can be calculated:
3 Results
3.1 Temporal and spatial change characteristics of streamflow
From 1956 to 2020, streamflow on the Loess Plateau showed a decreasing trend (−0.42 mm/yr), precipitation showed a decreasing trend (−0.38 mm/yr), and evapotranspiration showed an increasing trend (0.04 mm/yr) (Figure 2). In the context of global warming, the reduction of precipitation indicates that the climate has a trend of warming and drying, and the increase of evapotranspiration consumption caused by temperature rise directly leads to the reduction of streamflow on the Loess Plateau. In terms of time, the statistical value of MK trend analysis of streamflow series is −3.99, and the statistical value of streamflow series has passed the 99% significance test. And that of precipitation and evapotranspiration are −0.18 and 0.35, respectively, which means the change trend is not significant. From the perspective of space (Figure 3), except for two watersheds (Qingshui River and Kushui River) showed an increasing trend, the remaining 32 watersheds showed a decreasing trend, of which 30 showed a significant decreasing trend, which exceeded the 95% significance test, indicating that the spatial change trend of streamflow was significant.
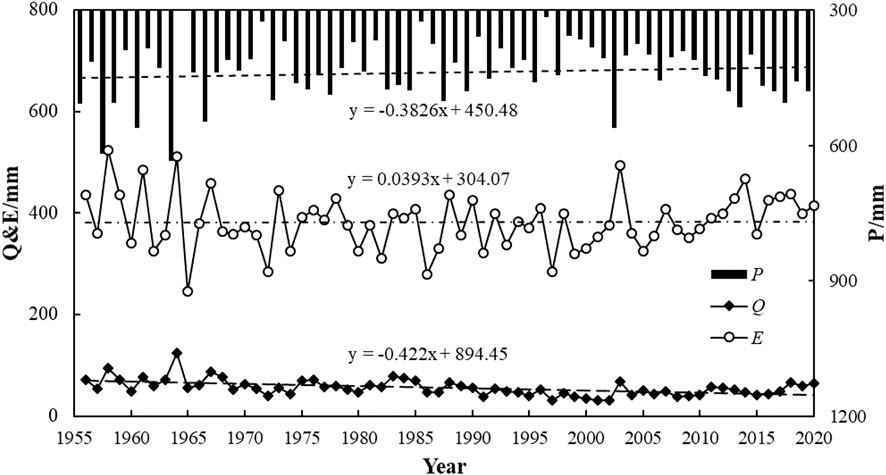
FIGURE 2. Change trend of hydrological elements on the Loess Plateau.
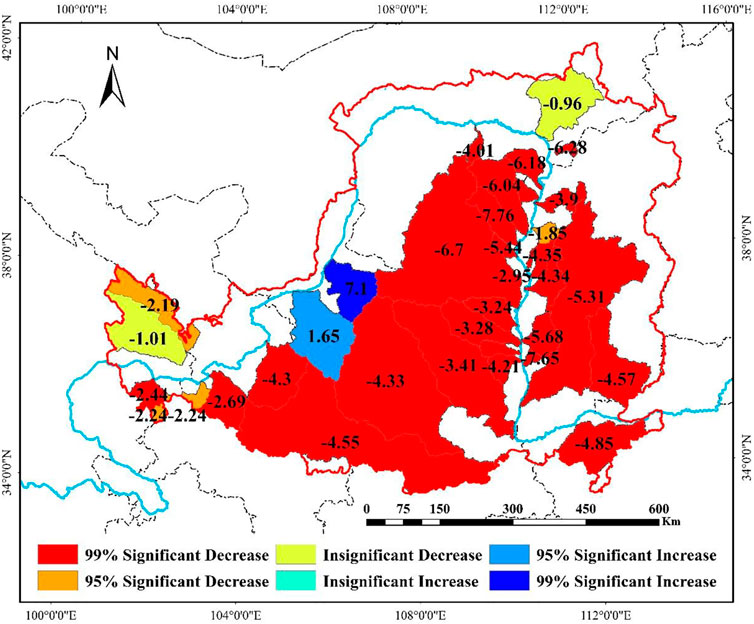
FIGURE 3. MK test of streamflow variation trend in 34 basins of the Loess Plateau.
Based on the anomaly analysis of the streamflow series on the Loess Plateau from 1956 to 2020 (Figure 4), we found that the years from 1956 to 1990 were mainly wet years, and the years after 1990 were mainly dry years. The cumulative anomaly and double cumulative curve were used to conduct the mutation test for the streamflow from 1956 to 2020 (Figure 5), and the sliding t-test was used to verify the significance. The results showed that the streamflow series had a sudden change in 1990, and the sliding t-test value of the abrupt change point was 4.99, which exceeded the significance level of 0.001, indicating that the streamflow had a significant abrupt change in 1990. The abrupt change point divides the streamflow series into base period (1956–1989) and change period (1990–2020). Compared with the base period, the average annual streamflow in the change period decreases by 17.19 mm (26.94%) (Figure 6A).
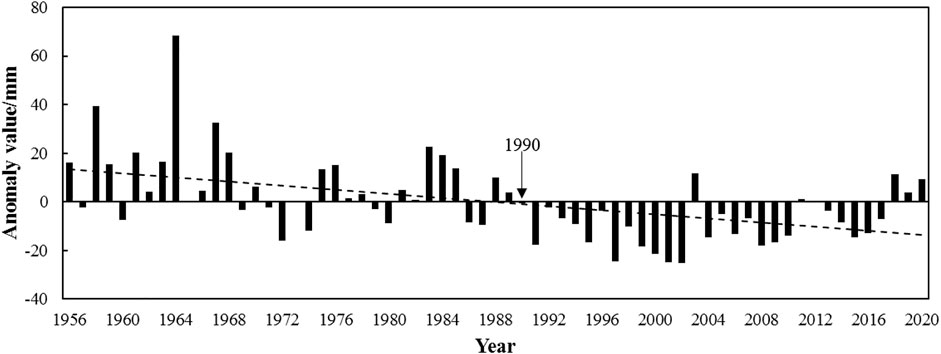
FIGURE 4. Analysis of streamflow anomaly in Loess Plateau.
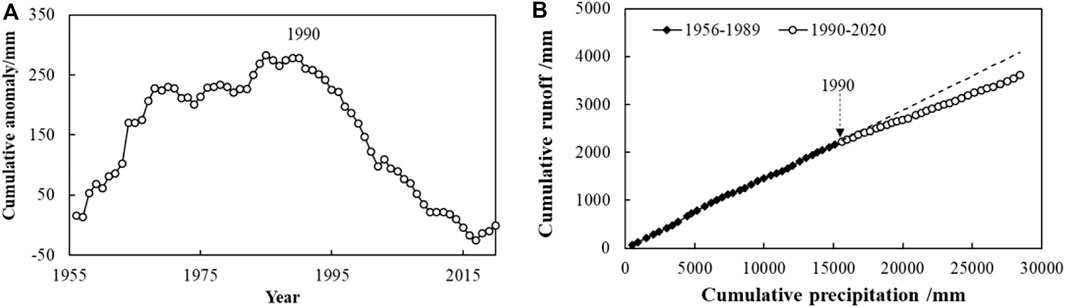
FIGURE 5. Cumulation anomaly curve of runoff (A) and double accumulation curve of runoff and precipitation (B).
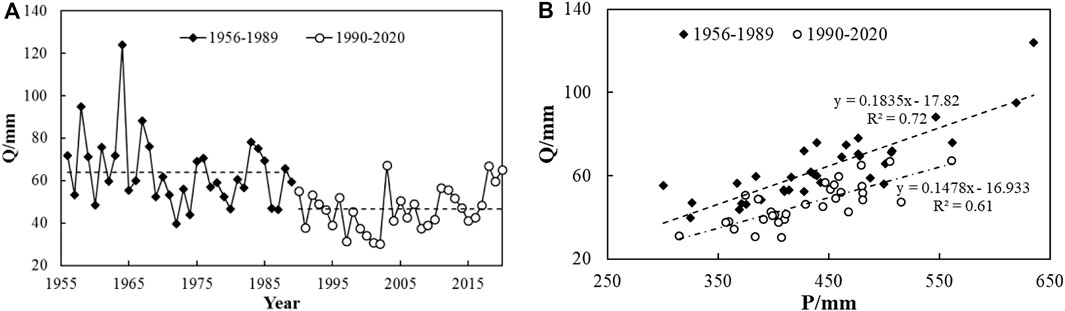
FIGURE 6. The interannual variation trend of streamflow (A) and the relationship between streamflow and precipitation (B) before and after abrupt change.
Analyzing the precipitation-streamflow relationship on the Loess Plateau before and after the mutation (Figure 6B), we found that the precipitation-streamflow relationship was well matched before 1990, with the decisive coefficient R2 of 0.72. It can be considered that the streamflow in the basin is in a natural state and is less affected by human beings. The year of streamflow abrupt change basically coincides with the time when soil and water conservation measures such as returning farmland to forests, terraces and check dams were implemented on the Loess Plateau, indicating that streamflow has been affected by human activities since then. The streamflow under the same precipitation conditions after the abrupt change is significantly lower than that before the abrupt change, reflecting the impact of human activities on the streamflow generation process by changing the underlying surface conditions.
3.2 Attribution analysis of streamflow change
According to the average precipitation, streamflow and potential evapotranspiration of each stage, the least square method is used to calculate the underlying surface parameter n (Table 2) of each stage according to Eq. 5. Combining Eqs 6–8, the sensitivity coefficients of streamflow change on the Loess Plateau to precipitation, potential evapotranspiration and underlying surface parameters are 0.30, −0.08 and −69.26 respectively, indicating that every 1 mm increase in precipitation on the Loess Plateau will lead to a 0.30 mm increase in streamflow, Each 1 mm increase in potential evapotranspiration will reduce streamflow by 0.08mm, and each unit increase in underlying surface parameters will reduce streamflow by 69.26 mm. As far as the sensitivity coefficient is concerned, streamflow change on the Loess Plateau is more sensitive to precipitation and underlying surface change.
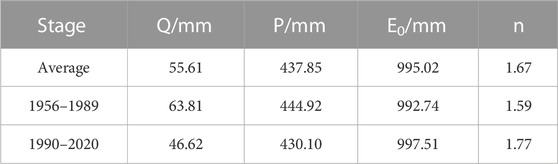
TABLE 2. Characteristic values and changes of water cycle elements at different stages.
Combined with the sensitivity coefficient of streamflow change and the stage change of driving factors, the streamflow change caused by the change of each factor can be calculated by Eq. 7. The streamflow variation caused by precipitation, potential evapotranspiration and underlying surface parameters on the Loess Plateau is −4.51mm, −0.37 mm and −12.55 mm. The total streamflow variation simulated by the Budyko equation is 17.43 mm, and the error between the simulated and measured streamflow variation is only 0.24 mm (1.40%), which indicates that the stage variation results of the Budyko hypothesis applied to the simulated streamflow on the Loess Plateau are basically consistent with the measured values. According to Eq. 8, the contribution rates of climate change and underlying surface change to streamflow change are 28.39% and 73.01% respectively, of which the contribution rate of precipitation change is 26.24%, and the contribution rate of potential evapotranspiration change is only 2.15%. Precipitation change and underlying surface change are the main driving factors of streamflow change. Therefore, for the whole Loess Plateau, the dominant driver of streamflow change from 1956 to 2020 is the change of underlying surface.
3.3 Spatiotemporal differences in attribution of streamflow changes
Taking 1990 as the break point, the streamflow series of 34 basins on the Loess Plateau are divided into base period and change period, and the attribution analysis of streamflow changes is carried out by using the fixed Budyko equation parameter method (Figure 7). We found that 29 of the 34 basins on the Loess Plateau are dominated by the change of underlying surface (52.50%–98.22%), only Zuli River (6) in the west of the Loess Plateau, and Qingjian River (23), Yanhe River (25), Fenchuan River (26), Shiwangchuan River (27), Beiluo River (30) in the middle of the Loess Plateau is dominated by precipitation changes.
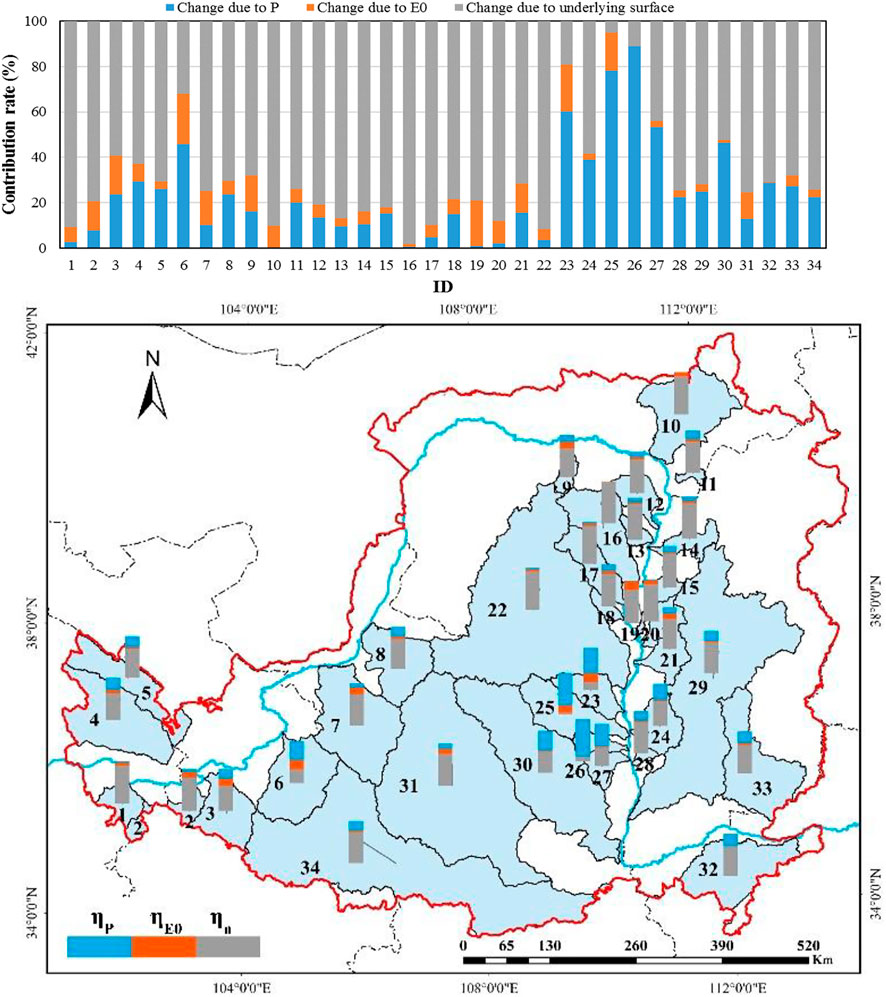
FIGURE 7. Spatial difference of streamflow variation contribution and dominant factors on the Loess Plateau.
Using the Budyko equation with time-varying parameters and taking 5 years as a stage, the attribution analysis of streamflow changes in 12 stages from 1956 to 2020 is carried out (Table 3), we found that the contribution rate of precipitation change to streamflow change in 8 time periods (1970–1975, 1985–1990, 1990–2020) exceeded 50% (50.72%–84.68%), and the streamflow change in this period is dominated by precipitation change. The contribution rate of the underlying surface in the other four time periods (1961–1970,1981–1985,1991–1995) is 52.18%–66.97%, and the streamflow change is dominated by the underlying surface change.
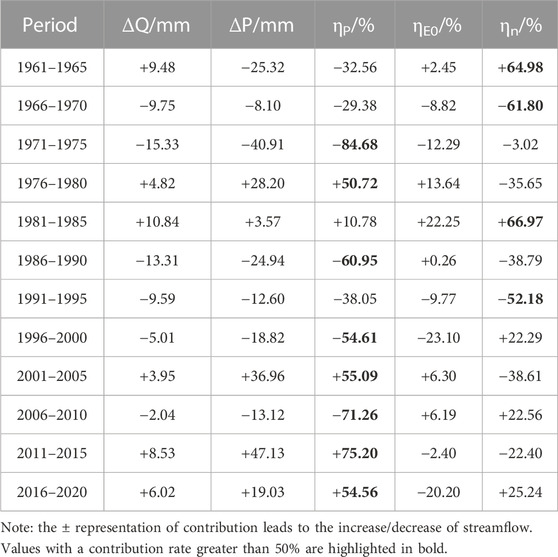
TABLE 3. Streamflow quantity and contribution rate of influencing factors at different time periods.
4 Discussion
4.1 Temporal difference analysis
Previous studies have proved that the dominant drivers of streamflow change in different periods are different. The Chinese government recognized this problem and initiated the “Grain for Green Program” (GFGP) in the late 1990s. This large-scale vegetation restoration engineering converted slope farmlands into forests or grasslands to minimize soil water loss, mitigate flood risk, and improve livelihoods in the area (Fu et al., 2017). Thus, many studies assessed the impact of climate change and underlying surface changes such as land use on streamflow on the Loess Plateau and concluded that climate was the dominant factor affecting streamflow before 1990, but the impact of climate factors on streamflow changes gradually decreased over time (Zhang et al., 2017; Kang et al., 2019; Gao et al., 2020; Lu et al., 2020; Wang et al., 2021). The implementation of water and soil conservation measures after 1990 can explain more than 80% of streamflow reduction (Li B. et al., 2016; Zhang et al., 2020a). Human interference, especially land use change caused by returning farmland to forests, has become the main reason for streamflow change (Zhao et al., 2014; Li Y. et al., 2016; Gao et al., 2016; Li Q. et al., 2017; Shi et al., 2019; Zheng et al., 2019; Chen et al., 2020; Sun et al., 2020), Moreover, the impact of human activities tends to increase (Wang et al., 2016; Li Z. et al., 2017). However, it needs to be pointed out that these studies select a mutation point to divide the whole streamflow series into two stages for attribution analysis. Due to the difference in mutation testing methods and the length of time series, the mutation point is often uncertain and not unique, and there may be human errors in the selection process of mutation points, so the research conclusions may be one-sided.
In this study, the time-varying Budyko equation is used to divide the whole research series into 12 stages with a unit of 5 years. The time difference of the dominant drivers of streamflow change is analyzed to avoid errors that may be caused by stage division. We found that the dominant driver of streamflow change is vary over different time. Streamflow change on the Loess Plateau is mainly dominated by precipitation change (8/12 stages), and only 4 stages are dominated by underlying surface change. It indicates that the underlying surface dominated periods (1961–1965, 1966–1970, 1981–1985, 1991–1995) were greatly affected by human activities. From 1958 to 1970, due to population growth and the “Great Leap Forward in Production,” a large number of grasslands have been reclaimed as farmland and forests have been cut down, the vegetation coverage decreased to 42.5% (Xu et al., 2013). At the same time, this stage and the subsequent 1980s were the two peak stages of the construction of terraces and check dams on the Loess Plateau, and their construction had a significant impact on the streamflow formation process. In addition, due to the impact of the large-scale project of returning farmland to forests and grasslands since the 1990s, the characteristics of underlying surface and the process of streamflow generation and concentration have changed significantly, resulting in a significant reduction of streamflow. Therefore, in general, the underlying surface factors such as vegetation, terrain and soil have little change under the condition of no human disturbance (Feng et al., 2016), which shows that most stages are dominated by precipitation changes.
Therefore, we infer that the periodic fluctuation of precipitation controls the change of streamflow in the basin in the whole time domain. In order to verify our inference, the E0/P∼E/P relation curve (Figure 8) from 1956 to 2020 was drawn in this study, we find that the point of E0/P∼E/P basically fluctuates around the Budyko curve with n=1.6, where n is the underlying surface characteristic parameter in the Budyko hypothesis, and a fixed n value means that the underlying surface changes little or remains unchanged. Therefore, from the perspective of time scale, the streamflow change on the Loess Plateau is mainly controlled by precipitation.
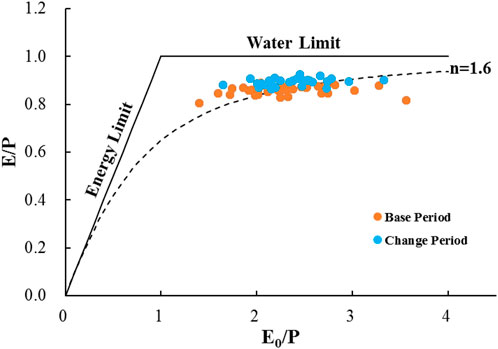
FIGURE 8. Budyko curve of streamflow series on the Loess Plateau from 1956 to 2020.
4.2 Spatial difference analysis
Influenced by the spatial distribution of climate and underlying surface factors and the non-uniformity of spatial change, the contribution of driving factors of streamflow change on the Loess Plateau shows obvious spatial difference. On the annual average time scale, streamflow is most sensitive to precipitation and underlying surface parameters. The underlying surface is the dominant driver of streamflow change in most basins (29 out of 34,∼76.42%), which is consistent with the research conclusions of Yang L. et al. (2021); Zhang et al. (2020a) (Figure 9). They found that the average contribution of streamflow change on the Loess Plateau basin dominated by the underlying surface is 74.09%, although there are differences in contribution rates, the ranking order and identification of dominant factors in our study are stable and consistent with those of Yang L. et al. (2021) and Zhang et al. (2020a).
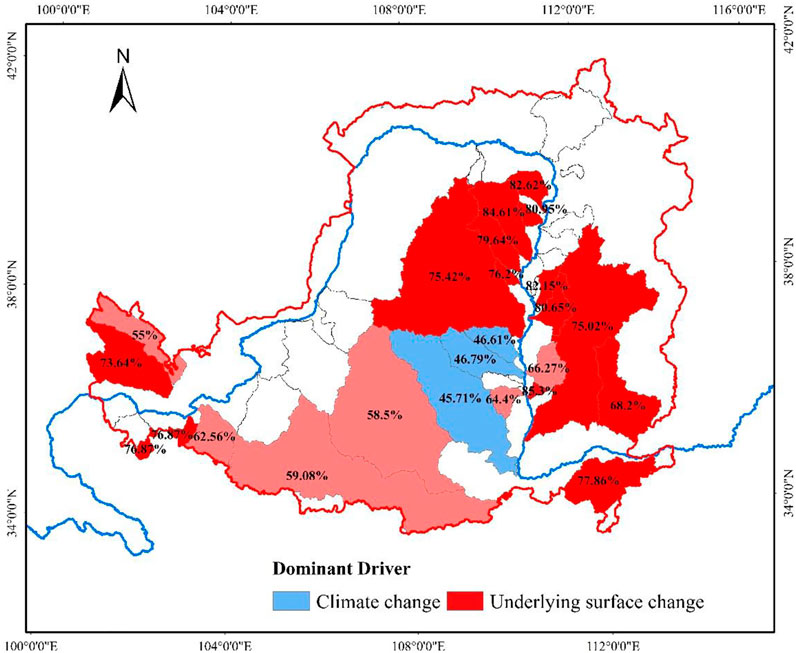
FIGURE 9. Contribution rate of underlying surface change to streamflow change on the Loess Plateau in previous studies. Red indicates that streamflow change is dominated by underlying surface change, and color depth indicates difference in contribution rate; Blue indicates that streamflow change is dominated by climate change.
In terms of climate conditions, all the selected Loess Plateau basins in this study are water limited region, and the climatic water supply is the main climatic factor affecting streamflow. However, during the period 1956–2020, the annual precipitation of most basins only showed slight and insignificant changes. In contrast, changes in streamflow and vegetation are more obvious. Therefore, we speculate that large-scale ecological restoration measures may be an important reason for streamflow reduction on the Loess Plateau. The research shows that the ecological restoration measures of the Loess Plateau began to be implemented in the 1970s. The large-scale construction of terraced fields and check dams (Figure 10), coupled with the impact of vegetation restoration such as returning farmland to forests and grasslands, significantly changed the underlying surface conditions of the Loess Plateau, and then led to the change of watershed streamflow. Therefore, from the perspective of spatial scale, the change of underlying surface is the dominant factor of streamflow change.
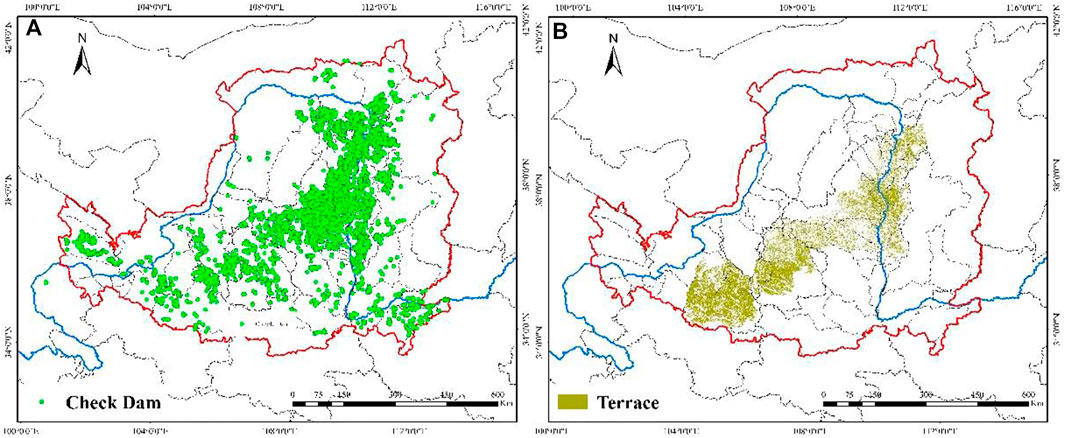
FIGURE 10. Distribution of check dams (A) and terraces (B) on the Loess plateau.
In addition, we also found that the streamflow change in the middle part of the Loess Plateau is dominated by climate change, which changed and expanded our understanding of the dominant driving factors of streamflow change on the Loess Plateau. The climate dominated drainage basin radiates outward from the center of Yan’an in the central region of the Loess Plateau. Yan’an is the first region on the Loess Plateau to start soil erosion control, the vegetation restoration effect in this region is remarkable (Figure 11A), and the construction of ecological restoration measures was basically completed in 1990 at the mutation point determined in this study. Since then, the underlying surface in this region tends to be stable gradually, so it is concluded that the streamflow change is dominated by climate change. At the same time, we infer that the intensive vegetation restoration in the central region of the Loess Plateau may change the microclimate of the region (Figure 11B), which leads to the climate becoming the dominant factor of streamflow change.
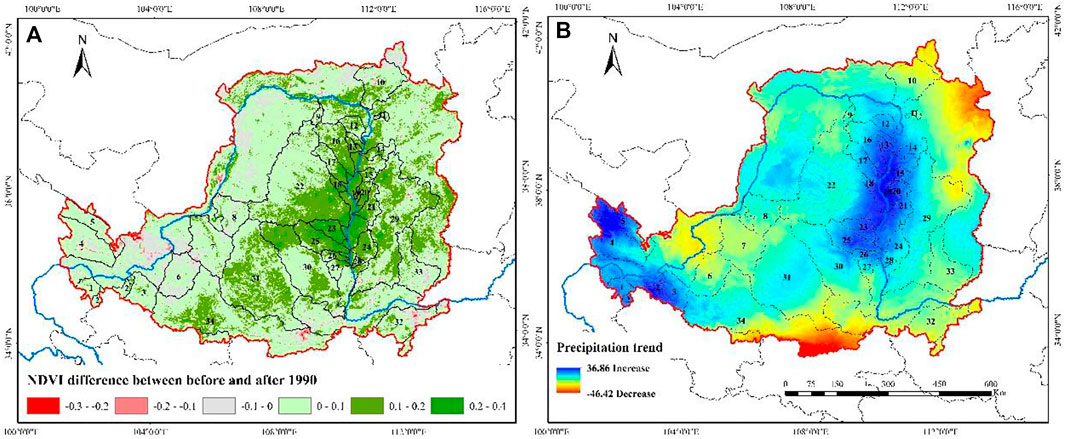
FIGURE 11. (A) Difference of NDVI between base period and change period on the Loess Plateau, (B) Trend of precipitation on the Loess Plateau.
4.3 Uncertainty
In addition to changes in climate and underlying surface, changes in watershed storage also contribute to streamflow changes. The attribution analysis based on Budyko theory ignores the influence of soil water storage change on a multi-year scale, which may lead to some errors in the calculation results. Besides, the method based on Budyko uses the assumption that climate change and underlying surface change have independent effects. However, the interaction mechanism among climate, vegetation and soil is complex, which may also have a certain impact on the research results. Therefore, in the future, it can be considered to use the remote sensing data of surface soil water for short-term attribution analysis on an annual or monthly scale, and further strengthen the research on the interaction mechanism of climate, vegetation, soil, and hydrology.
5 Conclusion
To quantitative analysis the spatiotemporal differences in dominant drivers of streamflow evolution on the Loess Plateau, this study conducted attribution analysis on streamflow changes at different time and space scales in 34 basins of the Loess Plateau during 1956–2020 based on the Budyko equation with fixed and time-varying parameters. The main conclusions are as follows.
(1) The streamflow of the Loess Plateau showed a significant decreasing trend and had an abrupt change point in 1990; compared to 1956–1990, the average streamflow in 1990–2020 was reduced by 17.19 mm (26.95%).
(2) Climate change and underlying surface change are major drivers of streamflow changes. The sensitivity coefficients of streamflow change on the Loess Plateau to precipitation, potential evapotranspiration and underlying surface parameters are 0.30, −0.08 and −69.26 respectively, while the contribution rate of which was 26.24%, 2.15% and 73.01% respectively.
(3) The influence of climate and underlying surface parameters on streamflow of Loess Plateau have spatiotemporal heterogeneity. For the whole Loess Plateau, the dominant driver of streamflow change from 1956 to 2020 is underlying surface change, but the contribution rate varies greatly and ranged from 52.50% to 98.22% in different tributaries. Differences of regional wet/dry conditions would also affect the sensitivity of streamflow to climate and underlying surfaces changes. The temporal variation of streamflow on the Loess Plateau is mainly controlled by precipitation. The spatial variation of streamflow on the Loess Plateau is mainly controlled by the underlying surface.
The results can further deepen our understanding for the response of streamflow to climate and underlying surface changes in the Loess Plateau. However, the underlying surface factors considered in this paper are still vague. In the future, it is necessary to consider the specfic composition of the underlying surface on the basis of this study, and further reveal the influence mechanism of vegetation, terraces, silt dams and other underlying surface components on the streamflow changes of the Loess Plateau, which might provide more feasible theoretical support for the water resources regulation on the Loess Plateau in the future.
Data availability statement
The data analyzed in this study is subject to the following licenses/restrictions: Using the data in this paper needs to be authorized by the author himself. Requests to access these datasets should be directed to bmlodWx2eGl6aGlAMTYzLmNvbQ==.
Author contributions
QZ composed the paper. YN, LM, and JW analyzed the data. DZ and SW assisted in data collection. XL supervised this work. All authors contributed to the article and approved the submitted version.
Funding
This work was supported by the National Natural Sciences Foundation of China (52209023, 52209022, U2243234, U2243601), the Excellent Youth Foundation of Henan Scientific Committee (202300410541), and Youth Talent Support Program of Zhongyuan and Ministry of Water Resources in China.
Conflict of interest
The authors declare that the research was conducted in the absence of any commercial or financial relationships that could be construed as a potential conflict of interest.
Publisher’s note
All claims expressed in this article are solely those of the authors and do not necessarily represent those of their affiliated organizations, or those of the publisher, the editors and the reviewers. Any product that may be evaluated in this article, or claim that may be made by its manufacturer, is not guaranteed or endorsed by the publisher.
References
An, B., Xiao, W., Zhang, S., Zhao, X., and Zhao, Y. (2021). Spatial and temporal characteristics of surface temperature in the Loess Plateau during 1961-2017. Arid. Land Geogr. 44 (3), 778–785. doi:10.12118/j.issn.1000–6060.2021.03.20
Berghuijs, W. R., and Woods, R. A. (2016). Correspondence: Space-time asymmetry undermines water yield assessment. Nat. Commun. 7, 11603. doi:10.1038/ncomms11603
Chen, H., Fleskens, L., Baartman, J., Wang, F., Moolenaar, S., and Ritsema, C. (2020). Impacts of land use change and climatic effects on streamflow in the Chinese Loess Plateau: A meta-analysis. Sci. Total Environ. 703, 134989. doi:10.1016/j.scitotenv.2019.134989
Feng, X., Cheng, W., Fu, B., and Lu, Y. (2016). The role of climatic and anthropogenic stresses on long-term runoff reduction from the Loess Plateau, China. Sci. Total Environ. 571, 688–698. doi:10.1016/j.scitotenv.2016.07.038
Fu, B., Wang, S., Liu, Y., Liu, J., Liang, W., and Miao, C. (2017). Hydrogeomorphic ecosystem responses to natural and anthropogenic changes in the Loess Plateau of China. Annu. Rev. Earth Planet. Sci. 45, 223–243. doi:10.1146/annurev-earth-063016-020552
Gao, G., Fu, B., Wang, S., Liang, W., and Jiang, X. (2016). Determining the hydrological responses to climate variability and land use/cover change in the Loess Plateau with the Budyko framework. Sci. Total Environ. 557-558, 331–342. doi:10.1016/j.scitotenv.2016.03.019
Gao, X., Yan, C., Wang, Y., Zhao, X., Zhao, Y., Sun, M., et al. (2020). Attribution analysis of climatic and multiple anthropogenic causes of runoff change in the Loess Plateau—a case-study of the jing River Basin. Land Degrad. Dev. 31, 1622–1640. doi:10.1002/ldr.3557
He, S, K., Chen, K, B., Liu, Z, J., and Deng, L, L. (2021). Exploring the impacts of climate change and human activities on future runoff variations at the seasonal scale. J. Hydrology 619, 129382. doi:10.1016/j.jhydrol.2023.129382
Hu, Y., Duan, W, L., Chen, Y, L., Zou, S., Kayumba, P, M., and Sahu, N. (2021). An integrated assessment of runoff dynamics in the Amu Darya River Basin: Confronting climate change and multiple human activities, 1960–2017. J. Hydrology 603, 126905. doi:10.1016/j.jhydrol.2021.126905
IPCC (2021). “Summary for policymakers,” in Climate change 2021: The physical science basis. Contribution of working group I to the sixth assessment report of the intergovernmental panel on climate change (Cambridge: Cambridge University Press).
Jin, J., Wang, G., Liu, C., He, R., and Hu, Q. (2013). Responses of hydrology and water resources to the climate change in the Yellow River source region. J. Arid Land Resour. Environ. 27 (5), 137–143. doi:10.13448/j.cnki.jalre.2013.05.029
Jin, S., Zheng, Z., and Ning, L. (2021). Separating variance in the runoff in Beijing's river system under climate change and human activities. Phys. Chem. Earth 123, 103044. Parts A/B/C 123. doi:10.1016/j.pce.2021.103044
Kang, Y., Gao, J., Shao, H., and Zhang, Y. (2019). Quantitative analysis of hydrological responses to climate variability and land-use change in the hilly-gully region of the Loess Plateau, China. Water 12, 82. doi:10.3390/w12010082
Khan, M. Y. A., Daityari, S., and Chakrapani, G. J. (2016). Factors responsible for temporal and spatial variations in water and sediment discharge in Ramganga River, Ganga Basin, India. Environ. Earth Sci. 75, 283. doi:10.1007/s12665-015-5148-2
Li, B., Liang, Z., Zhang, J., Wang, G., Zhao, W., Zhang, H., et al. (2016a). Attribution analysis of runoff decline in a semiarid region of the Loess Plateau, China. Theor. Appl. Climatol. 131, 845–855. doi:10.1007/s00704-016-2016-2
Li, N. (2018). Study on the mechanism of runoff production and confluence on the Loess Plateau under the change of underlying surface. China: Zhengzhou University.
Li, Q., Sun, Y., Yuan, W., Lyu, S., and Wan, F. (2017a). Streamflow responses to climate change and LUCC in a semi-arid watershed of Chinese Loess Plateau. J. Arid Land 9, 609–621. doi:10.1007/s40333-017-0095-2
Li, Y., Liu, C., Zhang, D., Liang, K., Li, X., and Dong, G. (2016b). Reduced runoff due to anthropogenic intervention on the Loess Plateau, China. Water 8, 458. doi:10.3390/w8100458
Li, Z., Ning, T., Li, J., and Yang, D. (2017b). Spatiotemporal variation in the attribution of streamflow changes in a catchment on China's Loess Plateau. Catena 158, 1–8. doi:10.1016/j.catena.2017.06.008
Li, Z., and Quiring, S. M. (2021). Identifying the dominant drivers of hydrological change in the contiguous United States. Water Resour. Res. 57, e2021WR029738. doi:10.1029/2021wr029738
Liang, W., Bai, D., Wang, F., Fu, B., Yan, J., Wang, S., et al. (2015). Quantifying the impacts of climate change and ecological restoration on streamflow changes based on a Budyko hydrological model in China's Loess Plateau. Water Resour. Res. 51, 6500–6519. doi:10.1002/2014wr016589
Lu, B., Lei, H., Yang, D., and Fu, X. (2020). Separating the effects of revegetation and sediment-trapping dams construction on runoff and its application to a semi-arid watershed of the Loess Plateau. Ecol. Eng. 158, 106043. doi:10.1016/j.ecoleng.2020.106043
Lv, X., Zuo, Z., Ni, Y., Sun, J., and Wang, H. (2019). The effects of climate and catchment characteristic change on streamflow in a typical tributary of the Yellow River. Sci. Rep. 9, 14535. doi:10.1038/s41598-019-51115-x
Mann, H. B. (1945). Nonparametric tests against trend. Econometrica 13, 245–259. doi:10.2307/1907187
Ni, Y., Yu, Z., Lv, X., Qin, T., Yan, D., Zhang, Q., et al. (2022). Spatial difference analysis of the runoff evolution attribution in the Yellow River Basin. J. Hydrology 612, 128149. doi:10.1016/j.jhydrol.2022.128149
Olmedo, E., Turiel, A., Gonzalez-Gambau, V., Gonzalez-Haro, C., Garcia-Espriu, A., Gabarro, C., et al. (2022). Increasing stratification as observed by satellite sea surface salinity measurements. Sci. Rep. 12, 6279. doi:10.1038/s41598-022-10265-1
Shi, P., Zhang, Y., Ren, Z., Yu, Y., Li, P., and Gong, J. (2019). Land-use changes and check dams reducing runoff and sediment yield on the Loess Plateau of China. Sci. Total Environ. 664, 984–994. doi:10.1016/j.scitotenv.2019.01.430
Sun, P., Wu, Y., Wei, X., Sivakumar, B., Qiu, L., Mu, X., et al. (2020). Quantifying the contributions of climate variation, land use change, and engineering measures for dramatic reduction in streamflow and sediment in a typical loess watershed, China. Ecol. Eng. 142, 105611. doi:10.1016/j.ecoleng.2019.105611
Villarini, G., and Wasko, C. (2021). Humans, climate and streamflow. Nat. Clim. Chang. 11, 725–726. doi:10.1038/s41558-021-01137-z
Wang, F., Duan, K., Fu, S., Gou, F., Liang, W., Yan, J., et al. (2019). Partitioning climate and human contributions to changes in mean annual streamflow based on the Budyko complementary relationship in the Loess Plateau, China. Sci. Total Environ. 665, 579–590. doi:10.1016/j.scitotenv.2019.01.386
Wang, G., Zhang, J., and Yang, Q. (2016). Attribution of runoff change for the xinshui river catchment on the Loess Plateau of China in a changing environment. Water 8, 267. doi:10.3390/w8060267
Wang, J., Wu, T., Li, Q., and Wang, S. (2021). Quantifying the effect of environmental drivers on water conservation variation in the eastern Loess Plateau, China. Ecol. Indic. 125, 107493. doi:10.1016/j.ecolind.2021.107493
Wang, S., McVicar, T. R., Zhang, Z., Brunner, T., and Strauss, P. (2020). Globally partitioning the simultaneous impacts of climate-induced and human-induced changes on catchment streamflow: A review and meta-analysis. J. Hydrology 590, 125387. doi:10.1016/j.jhydrol.2020.125387
Wang, Z., Xu, M., Liu, X., Singh, D. K., and Fu, X. (2022). Quantifying the impact of climate change and anthropogenic activities on runoff and sediment load reduction in a typical Loess Plateau watershed. J. Hydrology Regional Stud. 39, 100992. doi:10.1016/j.ejrh.2022.100992
Wu, J., Miao, C., Wang, Y., Duan, Q., and Zhang, X. (2017). Contribution analysis of the long-term changes in seasonal runoff on the Loess Plateau, China, using eight Budyko-based methods. J. Hydrology 545, 263–275. doi:10.1016/j.jhydrol.2016.12.050
Xu, J., Chen, Y., Li, W., Peng, P. Y., Yang, Y., Song, C. n., et al. (2013). Combining BPANN and wavelet analysis to simulate hydro-climatic processes-a case study of the Kaidu River, North-west China. Front. Earth Sci. 7, 227–237. doi:10.1007/s11707-013-0354-2
Xu, T., Miao, C., Yang, X., Duan, Q., Lei, X., and Li, H. (2018). Analysis of precipitation characteristics on the loess plateau between 1965 and 2014, based on high-density gauge observations. Atmos. Res. 213, 264–274. doi:10.1016/j.atmosres.2018.06.013
Yang, D., Sun, F., Liu, Z., Cong, Z., Ni, G., and Lei, Z. (2007). Analyzing spatial and temporal variability of annual water-energy balance in nonhumid regions of China using the Budyko hypothesis. Water Resour. Res. 43, W04426. doi:10.1029/2006wr005224
Yang, D., Yang, Y., and Xia, J. (2021a). Hydrological cycle and water resources in a changing world: A review. Geogr. Sustain. 2, 115–122. doi:10.1016/j.geosus.2021.05.003
Yang, H., Yang, D., Lei, Z., and Sun, F. (2008). New analytical derivation of the mean annual water-energy balance equation. Water Resour. Res. 44, 893–897. doi:10.1029/2007wr006135
Yang, L., Zhao, G., Mu, X., Tian, P., Gao, P., Sun, W., et al. (2021b). Attribution of runoff variations in tao River and daxia river based on Budyko hypothesis. Acta Ecol. Sin. 41, 8421–8429. doi:10.5846/stxb202007221924
Yang, Z., Song, J., Jiang, C., Wang, K., Zhao, L., and Hao, R. (2021c). Contribution analysis of the streamflow changes in selected catchments on the Loess Plateau, China, using multiple budyko-based approaches. Water 13, 2534. doi:10.3390/w13182534
Yu, K., Zhang, X., Xu, B., Li, P., Zhang, X., Li, Z., et al. (2021). Evaluating the impact of ecological construction measures on water balance in the Loess Plateau region of China within the Budyko framework. J. Hydrology 601, 126596. doi:10.1016/j.jhydrol.2021.126596
Zhang, J., Gao, G., Li, Z., Fu, B., and Gupta, H. V. (2020a). Identification of climate variables dominating streamflow generation and quantification of streamflow decline in the Loess Plateau, China. Sci. Total Environ. 722, 137935. doi:10.1016/j.scitotenv.2020.137935
Zhang, J., Wang, G., Jin, J., He, R., Liu, C., Lei, A., et al. (2020b). Pluripotent stem cell-derived CAR-macrophage cells with antigen-dependent anti-cancer cell functions. Adv. Water Sci. 13 (2), 153–161. doi:10.1186/s13045-020-00983-2
Zhang, L., Karthikeyan, R., Bai, Z., and Srinivasan, R. (2017). Analysis of streamflow responses to climate variability and land use change in the Loess Plateau region of China. Catena 154, 1–11. doi:10.1016/j.catena.2017.02.012
Zhang, X., Yu, Y., Hu, C., and Ping, J. (2021). Study on the influence of vegetation change on runoff generation mechanism in the Loess Plateau, China. Water Supply 21, 683–695. doi:10.2166/ws.2020.361
Zhao, J., Huang, S., Huang, Q., Wang, H., and Leng, G. (2018). Detecting the dominant cause of streamflow decline in the Loess Plateau of China based onthe latest Budyko equation. Water 10, 1277. doi:10.3390/w10091277
Zhao, Y., Tu, Z., Jia, J., and Yu, X. (2014). Estimating the sensitivity of annual runoff to changes in climate and land use in the Loess Plateau, China. J. Soil Water Conservation 69, 221–230. doi:10.2489/jswc.69.3.221
Zheng, H., Miao, C., Wu, J., Lei, X., Liao, W., and Li, H. (2019). Temporal and spatial variations in water discharge and sediment load on the Loess Plateau, China: A high-density study. Sci. Total Environ. 666, 875–886. doi:10.1016/j.scitotenv.2019.02.246
Zheng, H., Miao, C., Zhang, G., Li, X., Wang, S., Wu, J., et al. (2021). Is the runoff coefficient increasing or decreasing after ecological restoration on China’s Loess Plateau? Int. Soil Water Conservation Res. 9, 333–343. doi:10.1016/j.iswcr.2021.04.009
Keywords: streamflow evolution, dominant driver, spatio-temporal differences, Budyko hypothesis, Loess Plateau
Citation: Zhang Q, Lv X, Ni Y, Ma L, Wang J, Zhu D and Wang S (2023) Spatiotemporal differences in dominant drivers of streamflow evolution on the Loess Plateau. Front. Earth Sci. 11:1168260. doi: 10.3389/feart.2023.1168260
Received: 17 February 2023; Accepted: 05 June 2023;
Published: 16 June 2023.
Edited by:
Frédéric Frappart, INRAE Nouvelle-Aquitaine Bordeaux, FranceReviewed by:
Dengfeng Liu, Xi’an University of Technology, ChinaWeili Duan, Chinese Academy of Sciences (CAS), China
Copyright © 2023 Zhang, Lv, Ni, Ma, Wang, Zhu and Wang. This is an open-access article distributed under the terms of the Creative Commons Attribution License (CC BY). The use, distribution or reproduction in other forums is permitted, provided the original author(s) and the copyright owner(s) are credited and that the original publication in this journal is cited, in accordance with accepted academic practice. No use, distribution or reproduction is permitted which does not comply with these terms.
*Correspondence: Xizhi Lv, bmlodWx2eGl6aGlAMTYzLmNvbQ==