 Xiaohan Li
 Jianchang Zheng
 Haijiang Zhang
 Huawei Cui1,3
95% of researchers rate our articles as excellent or good
Learn more about the work of our research integrity team to safeguard the quality of each article we publish.
Find out more
ORIGINAL RESEARCH article
Front. Earth Sci. , 11 May 2023
Sec. Solid Earth Geophysics
Volume 11 - 2023 | https://doi.org/10.3389/feart.2023.1168043
This article is part of the Research Topic Pre-, Co-, and Post-Seismic Processes of Recent Earthquakes in Mainland China View all 9 articles
On 21 May 2021, the MS 6.4 earthquake struck Yangbi County, Dali City, Yunnan Province. Minor seismic activities were common both before and after the earthquake; the foreshock sequence activity characteristics of this earthquake were studied to gain a better understanding and more perspective. First, between May 18 and 5 July 2021, we collected data of the seismic events from the Yangbi MS 6.4 earthquake sequence, determined the minimum magnitude of completeness of the sequence based on the magnitude-frequency relationship, filtered out the more complete earthquake sequences, and performed double-difference earthquake relocation using the HypoDD method. Then, we improved the nearest-neighbor distance algorithm and used it in conjunction with the Gaussian mixed model fitting method to conduct a comprehensive multiple factor analysis of the Yangbi MS 6.4 earthquake sequence. The main findings of our preliminary analysis are as follows: 1) We distinguished the foreshocks, mainshocks, and aftershocks of the Yangbi earthquake sequence as well as their higher-order aftershocks, using the method described in this paper, and we can obtain clear intergenerational relationships between them. We identified eight “foreshocks” with statistically greater physical significance than the others and found that majority of the shocks occurred shortly after the mainshock were direct aftershocks, with secondary or higher-order aftershocks gradually increasing in the later stage of the sequence. 2) Combining the double-difference earthquake relocation and the event distribution on the fault plane, we found that the b-value of the Yangbi foreshock sequence was clearly on the lower end of the spectrum, with an obvious nonlinear amplification process, and can be divided into three foreshock sub-sequences: sub-sequence I with the lowest b-value and a concentrated spatial distribution, which is an F-value foreshock sequence; subsequence II with an overall shallower source depth and an obvious rebound in b-value, which is an explosive aftershock sequence; subsequence III with a lower b-value and a rapid rupture spread, which is a typical U-F-ρ foreshock. 3) We constructed a topological tree of the Yangbi foreshock sequence in Yunnan Province using the nearest-neighbor distance algorithm, combining the correlation between earthquake sequence type and fault rupture intensity. We analyzed the distribution and topology of the three sub-sequences (combined) of the Yangbi MS 6.4 foreshock sequence and found the following: the topology of subsequence I was more linear than the sequence II, each was the parent event of the subsequent event, and its rupture mode was similar to the fluid intrusion rupture in a specific channel; sequence II had a relatively simple topology, exhibiting a spray topology, and independently formed a main-aftershock mini-sequence, probably triggered by its shallow brittle rupture, which caused the fluid intrusion rupture to spread faster and eventually triggered the Yangbi MS6.4 mainshock.
On 21 May 2021, at 21:48:34, an MS 6.4 earthquake occurred in Yangbi County, Dali Bai Autonomous Prefecture, Yunnan Province, with an epicenter at (25.67°N, 99.87°E) and a focal depth of 8 km. This earthquake was a typical foreshock–mainshock–aftershock-type seismic event. From 18 to 21 May 2021, before the MS 6.4 mainshock, 10 MS ≥3.0 earthquakes occurred in the region, of which the largest foreshock of MS 5.6 occurred 27 min prior to the mainshock.
The analysis of characteristics and distinguishing of foreshock activity have been topics of interest among both local and international seismologists for many years—they also constitute significant scientific challenges. Relevant overseas studies include the following: Lucile and Peter (1979) discussed the characteristics of foreshocks and their relationships with mainshocks. Lucile (1984) identified that the length of foreshock sequences is inversely proportional to depth. Pechmann and Thorbjarnardottir (1990) and Terry (1994) identified that foreshocks are characterized by spatial clustering through the use of waveform cross-correlation. Rachel and Jim (1996) concluded that the possibility of foreshocks decreases as the depth of the mainshock source increases; the occurrence of foreshocks depends on the slip orientation of the mainshock; and foreshock activity is independent of the nucleation process of the mainshock. Paul (1999) and Christine et al. (2011) statistically investigated the relationship between the mainshock and foreshock magnitudes. Sebastian et al. (1999), based on a spring-block model, conducted simulations and identified that the rate of increase of foreshocks follows an exponential distribution, and that the b values of foreshock sequences are significantly smaller. In recent years, a series of major global earthquakes have been preceded by significant foreshock events [e.g., the 5 July 2019 Ridgecrest, California Mw 7.1 earthquake foreshock; Hui et al. (2020) and Xue et al. (2021) statistics]. Accordingly, research on foreshocks is again becoming topical, especially with the application of new technologies. For example, using the same high-resolution seismic catalog on Southern California seismicity, Daniel and Zachary (2019) suggested that foreshocks exist in 72% of the mainshocks in Southern California, whereas van den Ende and Ampuero (2020) considered this to be less than 18%. Moutote et al. (2021) used the ETAS model to study foreshocks in the Southern California region; Eugenio et al. (2019) suggested that the ETAS model was unable to reproduce a few of the common features of foreshock sequences. Additionally, studies by Peng and Mori (2022) and Bi and Jiang (2022) explored the statistical characteristics of foreshock sequences in the North–South Seismic Zone regions of Japan and China.
It has long been noted in China that foreshock sequences have the characteristics of concentrated spatial distribution, low b values, and consistent source mechanisms (Chen and Knopoff, 1978). After considering the spatial and temporal distributions of sequences activity, Yan et al. (2012) suggested that foreshock activity has a concentrated spatial distribution. The study by Cai and Wang (1994), and other similar studies, suggested that earthquake sequences are characterized by a small spatial distribution. However, there are different views on this. Zhao et al. (1990) and other similar studies suggested that the average focal depth of foreshock sequences may be deeper and occupy a larger and less concentrated space than the average earthquake swarm.
Foreshock activity may also show certain statistical features in the time sequence. For example: Liu et al. (1998) (a) used a modified Omori formula to fit foreshock sequences and concluded that there is a non-linear increase in earthquake magnitude with time. Luo et al. (2000) defined a time coefficient of variation (δ) for earthquake sequences and identified that the time coefficient of variation was δ ≈ 1 for foreshock sequences. Cai and Wang (1994) indicated that foreshock sequences have significant fluctuations in terms of event intensity.
In terms of foreshock cluster and sequence determination, local researchers have conducted many studies. For example, the commonly used prescribed values in daily tracking analysis by the Department of Forecasting and Prediction, China Earthquake Administration (2020) of b, h, U, K, ρ; parameters such as generalized foreshock sequence time and spatial distribution, spectrum of generalized dimension, and scaling index spectrum (Zhu and Wang, 1996); and later discriminant methods using a combination of parameters based on the aforementioned research (Lin et al., 1994; Dou et al., 2020). These parameters and methods continue to impact the distinguishing of sequences and earthquake swarm group types.
Many Scholars have studied the foreshock sequence of the Yangbi earthquake in Yunnan. Lei et al. (2021) analyzed the tectonic background of the Yangbi earthquake sequence according to the distribution of foreshock and aftershocks. Yan et al. (2022) constructed a more complete earthquake catalogue through deep learning and template matching techniques, and analyzed the seismicity based on the catalogue. Wang et al. (2021) Use the short-period seismograph network to analyze the earthquake sequence. Zhang et al. (2023) analyzed the spatio-temporal distribution characteristics of the Yangbi earthquake sequence. It is very necessary to use different methods and perspectives thinking angles to verify the results of the earthquake and supply new understandings.
In this study, we focus on the foreshock sequence of the 2021 MS 6.4 earthquake in Yangbi, Yunnan Province, and analyze the internal spatio-temporal structure of this significant foreshock sequence from multiple perspectives using the nearest event distance algorithm based on the relocation results. Additionally, we analyze and discuss its related statistical features, hoping that it facilitates identifying a few foreshocks prior to strong earthquakes, and provides a basis for the short-term prediction of moderate to strong earthquakes.
The 2021 Yangbi MS 6.4 earthquake sequence occurred near the Weixi–Qiaohou Fault in the Southern Yunnan block (Figure 1)—a region of intersecting faults, complex tectonics, and susceptibility to frequent and numerous small and medium-sized earthquakes. This MS 6.4 earthquake is the largest earthquake to occur in the region in the past 45 years. As demonstrated by numerous studies (Yang et al., 2021; Zhao et al., 2022), this was a strike-slip event with a shallow source depth that occurred on a cryptic fault.
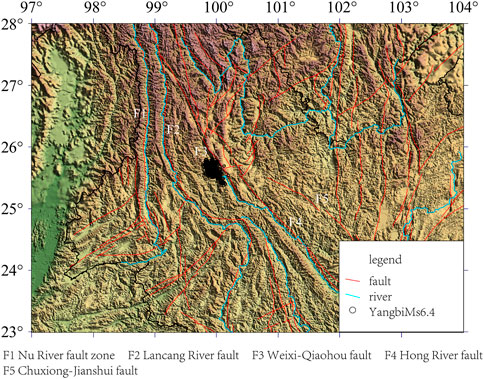
FIGURE 1. Distribution of 2021 Yangbi 6.4 earthquake sequence and surrounding faults.
Based on the collection of catalogs and observations, we first relocated the 7,092 seismic events of the Yangbi MS 6.4 earthquake sequence between 18 May and 5 July 2021 (Figure 2A) using HypoDD, based on the arrival time data from the China Earthquake Networks Center (Figure 2B). The results showed a NW–SE sequence trend, with possible bifurcation of the fault at its SE-end. Additionally, the main earthquake rupture triggered the activity of small-scale secondary faults that intersected it, with specific analysis presented in a separate study (Cui et al., 2022). Thereafter, we determined the minimum magnitude of completeness (MC) of the sequence based on the magnitude–frequency relationship (Figure 2C) and with reference to the study by Zhang et al. (2021): MC = 0.9 ± 0.1 for the Yangbi MS 6.4 earthquake sequence. Hence, ML 1.0 was chosen as the minimum magnitude of completeness of the sequence. Additionally, the fitting results of the G–R relationship showed that the b value of the full sequence was approximately 0.691.
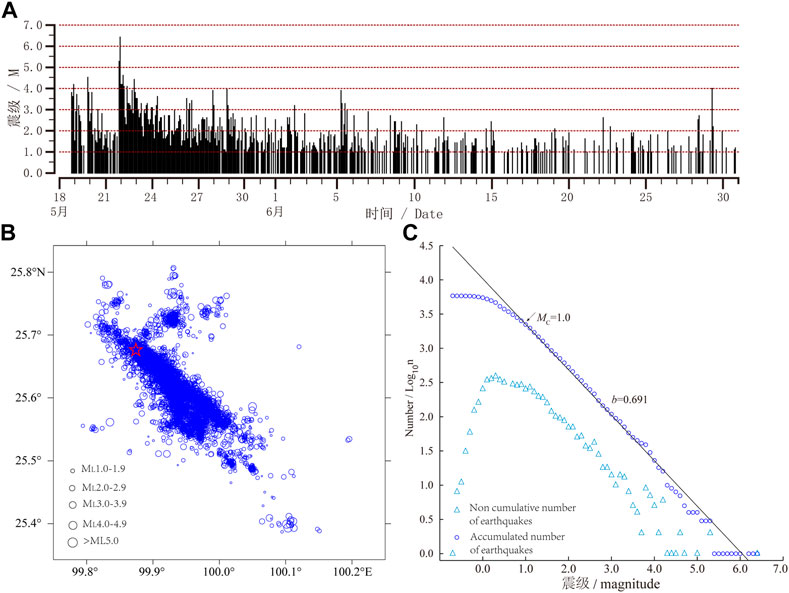
FIGURE 2. Relocation and preliminary statistical analysis of the Yangbi MS 6.4 earthquake sequence. (A) sequence ML ≥ 1.0 magnitude M-t diagram; (B) distribution of sequence epicenters after relocation (five-pointed red star indicates the main earthquake); (C) sequence G-R relationship and fitting results.
To study the Yangbi earthquake sequence, we used a cluster seismic analysis method that was newly developed in recent years (Zaliapin and Ben-Zion, 2016, which is based on the proposed generalized definition of the distance between any two earthquakes in the space-time-magnitude domain, i.e., the nearest-neighbor distance
A brief description of the methodology is as follow.
For a given seismic catalog, where each record
where
According to Zaliapin et al. (2008), the nearest-neighbor distance
the number of persons who have been granted the right to vote
Clearly,
In the one-dimensional representation of the distance
Furthermore, as the distance
The nearest-neighbor distance of the Yangbi 6.4 earthquake sequence was calculated using the method previously described; the results are shown in Figure 3. Based on the statistical findings of the nearest-neighbor distance
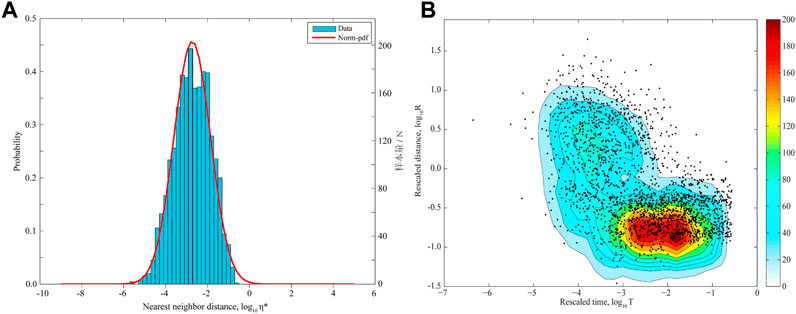
FIGURE 3. Statistical results of the nearest neighbor distance
Many theoretical studies addressing seismic sequence activity (Song and Wang, 1998) have concluded that there is self-similarity in aftershock activity—that is, any one earthquake in the aftershock sequence can generate its own higher-order aftershocks. The aftershock sequence activity mainly includes three characteristics: time evolution, spatial distribution, and intensity distribution, and the nearest-neighbor distance
Based on the calculated nearest-neighbor distances for each event
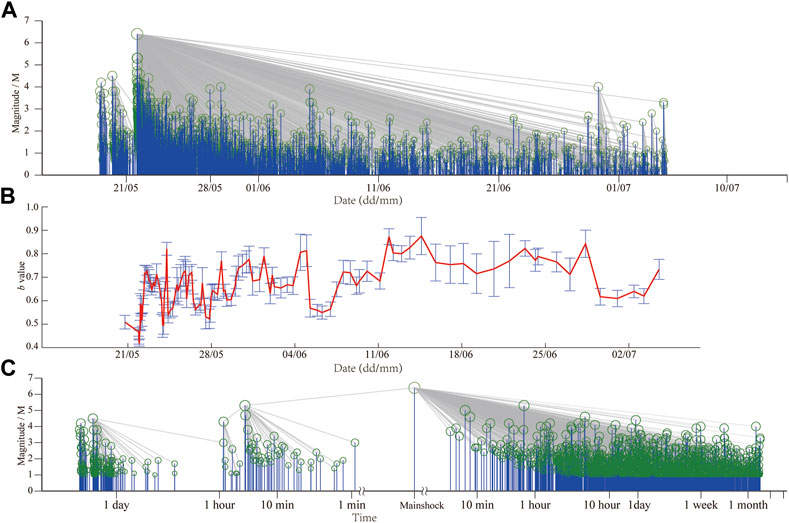
FIGURE 4. Family links of the Yangbi MS 6.4 earthquake sequence. Circles indicate earthquakes, and gray lines correspond to parent links. (A) Family links of magnitude over time. (B) The change of b value. (C) Family links of magnitude over time (data processed).
Figure 4B shows the changes of the sequence b value with time (equal seismic number, window length 200, step size 50); it was found that the b value gradually increases as the sequence develops. The b value of the foreshock sequence was 0.568, and the b value of the aftershock sequence as of July 4 was 0.739. The development of the b value of the aftershock sequence after the mainshock also showed a gradually increasing trend (Table 1). The b value of the foreshock sequence was notably low, which is consistent with the previous understanding (Sebastian et al., 1999; Xue et al., 2021).

TABLE 1. Yangbi MS 6.4 earthquake sequence b values.
To better visualize the changes of the foreshock activity prior to the mainshock, we took the logarithm of the time of the sequence activity from the time of the mainshock and processed it appropriately, depicting this information in Figure 4C. It can be seen, the parent event of the Yangbi 6.4 mainshock was the MS 5.6 foreshock that occurred at 21:21:25, and more than 40 events between the M5.6 foreshock and the MS 6.4 mainshock were all aftershocks or higher-order aftershocks of the M5.6 foreshock. In general, it appears that the foreshock sequence showed phases of fluctuations. We will specifically analyze the foreshock sequence changes in the subsequent section.
In the foreshock sequence of the Yangbi MS 6.4 earthquake (Figure 5), the first significant foreshock event—the MS 4.2 earthquake—occurred at 21:39:35 on 18 May; the second significant foreshock event—MS 4.5 earthquake—occurred at 20:05:56 on 19 May. Subsequently, the intensity of the earthquake escalated, with the highest magnitude foreshock of this sequence—MS 5.3 earthquake—occurring at 21:21:25 on 21 May, followed 27 min later by the sequence mainshock—MS 6.4 earthquake. The smaller earthquakes before the mainshock showed a phenomenon of progressive gradual increasing, weakening, followed by increase, and both the frequency of smaller earthquakes and strain energy release showed an increasingly obvious acceleration (Figure 5), which is in line with the previous understanding of foreshock sequences (Liu et al., 1998).
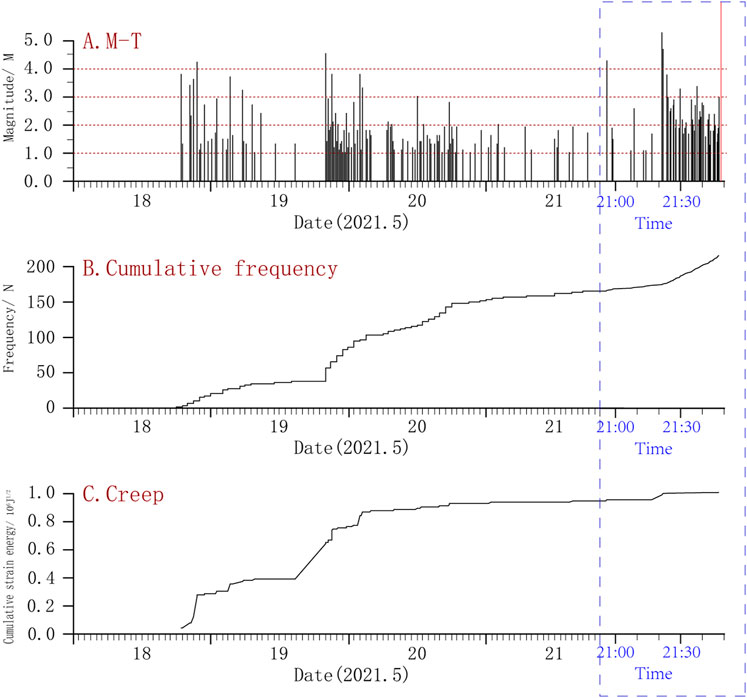
FIGURE 5. M-t diagram (A), cumulative frequency diagram (B) and creep diagram (C) of Yangbi 6.4 foreshock sequence. Red line is the MS 6.4 mainshock; data from the hour before the mainshock have been magnified on the horizontal coordinates for ease of analysis (blue dotted box).
The activity of the Yangbi 6.4 foreshock sequence can be divided into three phases (or sub-sequences): from the beginning of the sequence until the MS 4.5 earthquake on 19 May at 20:05:56; from that, until the MS 3.0 earthquake on 21 May at 20 is 20:55:43; and thereafter, until the MS 6.4 mainshock (see Figure 5).
Song and Wang (1998) proposed a comprehensive judgment index based on the eigenvalues of earthquake swarms. This indicator can identify whether the earthquake swarm that occurred is a precursor earthquake swarm, and determines the three elements of future earthquakes. Details as follows.
U value: In an earthquake swarm sequence, the ratio of the shortest time T′ required to release 90% of the strain energy to the duration T of the entire sequence is called the U value of the earthquake swarm. It denoted by U (Lin et al., 1984). The formula is as follows:
The U value describes the way in which earthquake swarms release strain energy, known as uniformity of energy release. Its value range is before 0 and 1, and the unit of
K value: The K value of the earthquake swarm is the normalized information entropy of the earthquake swarm, which characterizes the uniformity of the seismic energy distribution in the earthquake swarm (Zhu and Wang, 1996). The formula is as follows:
In the formula,
In the formula, μ and ρ are undetermined parameters. Among them, ρ is an earthquake occurrence mode parameter, which characterizes the degree of clustering of earthquake sequences in time.
b value: The magnitude-frequency relationship of earthquake swarm sequences usually obeys the G-R formula. The b value represents the proportional relationship of different magnitude earthquakes in an earthquake sequence. The formula is as follows:
h value: The change of earthquake frequency over time in earthquake swarm sequences generally obeys the Omori formula. The h value indicates the degree of attenuation of the earthquake frequency in the earthquake sequence. The formula is as follows:
F value: The F value indicates the uniformity of energy release of earthquake sequences with different average intensities.
We calculated each of these three sub-sequences using the traditional cluster sequence parameters (U, F, ρ, K, h, b, etc.), and the results showed (Table 2): sub-sequence I has the smallest b value (0.358), and the F value characterizing the uniformity of the sequence energy release exceeds the cut-off criteria, indicating a foreshock sequence; the b value (0.641) of sub-sequence II showed a notable rebounding, and was comparable to the b value of aftershock activity on the first day after the mainshock (0.648), and all parameters exceeded the cut-off criteria, indicating an aftershock sequence; the b value of sub-sequence III significantly decreased again (0.455), whereas the three parameters: U, F, and P met the criteria, indicating a typical foreshock sequence.
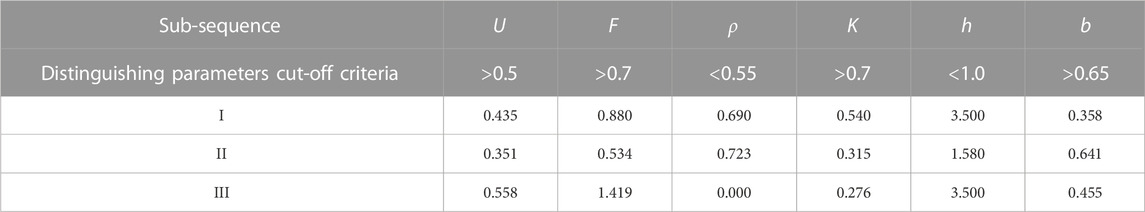
TABLE 2. Traditional foreshock cluster distinguishing parameters of the Yangbi 6.4 foreshock sequence.
There were 217 ML ≥ 1.0 events in the relocated foreshock sequence, including 42 events of magnitude 2.0 ≤ ML ≤ 2.9; 15 events of magnitude 3.0 ≤ ML ≤ 3.9; four events of magnitude 4.0 ≤ ML ≤ 4.9, and one earthquake of magnitude MS 5.6. We analyzed the foreshock sequences using the method previously discussed.
Figure 6 is obtained by taking the spatial distance from the first event of the sequence as the vertical coordinate, the interval between the time of onset and time of mainshock as the horizontal coordinate, and connecting each event with its parent event according to the distance from the nearest event. Figure 6A shows the development of the Yangbi MS 6.4 earthquake foreshock sequence and the triggering relationship between different events; to better observe the changes in the activity before the mainshock, the logarithm derived from the interval between the time of the onset and time of mainshock was technically processed to obtain Figure 6B.
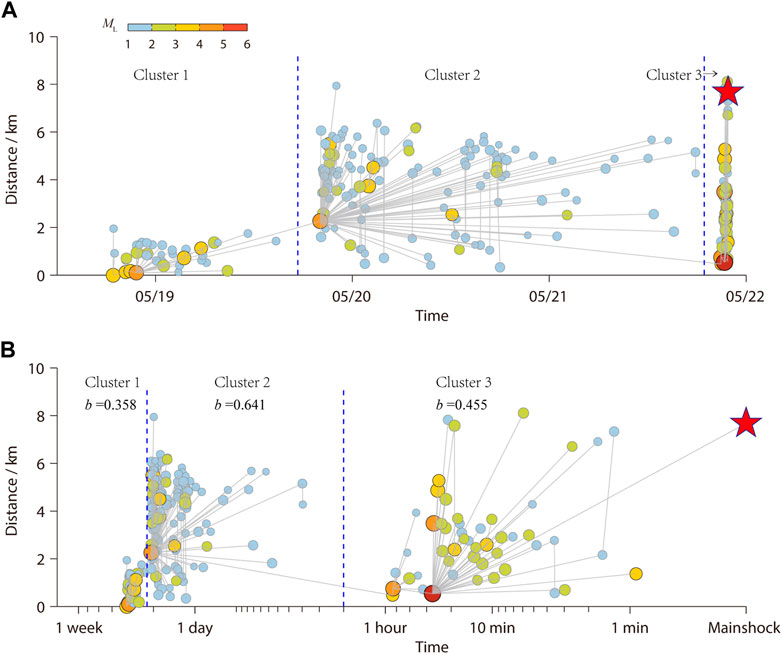
FIGURE 6. D-t diagram of Yangbi 6.4 foreshock sequence. The five-pointed red star indicates the mainshock and the grey line corresponds to the parent link. (A) The development process of foreshocks and the trigger relationship between events. (B) The development process of foreshocks and the trigger relationship between events (data processed).
From Figure 6, the Yangbi 6.4 foreshock sequence can be divided into three small clusters (refer to Clusters—1, 2, and 3 in the figure) based on the nearest-neighbor distances between all foreshock events, which exactly correspond to the three preceding sub-sequences.
Cluster—1: There were 37 ML ≥1.0 events, with the main event being MS 4.2 at 21:39 on 18 May, and most of the subsequent events in this cluster were aftershocks of this notable earthquake, except for the six small earthquakes that occurred before that event. Three of the initial six events were ML 3 magnitude earthquakes, plus the main event of MS 4.2, which were, in turn, the parents of the latter event.
Cluster—2: There were 129 ML ≥1.0 events, and the main event—that is, the first event of the sequence, was MS 4.4 at 20:05 on 19 May; all other events in this cluster were aftershocks of this earthquake (including a few higher-order aftershocks).
Cluster—3: There were 51 ML ≥1.0 events, with the main event being M 5.6 at 21:21 h on 21 May, followed by five 3s and one 4, which were all direct aftershocks of this magnitude 5 earthquake; this magnitude 5 earthquake was preceded by a sub-level foreshock sequence of 8 ML ≥1.0 events, of which MS 4.3 at 20:56 h on 21 May was the parent event of this 5.3 main event. The MS 3.0 at 20:55 on 21 May was again the parent event of this MS 4.3; this cluster was the last set of cluster before the Yangbi 6.4 mainshock, which occurred less than a minute later.
From the spatial distribution of foreshock sequences (Figure 7): the foreshock sequences fundamentally all occurred in the southeast direction of the epicenter of the Yangbi 6.4 magnitude mainshock; the sequence spreading was essentially consistent with the rupture direction of the fault and the mainshock source mechanism. Studies by Rachel and Jim (1996) and Reymond et al. (2003) identified that the rupture initiation point of the mainshock was located at the edge of the foreshock rupture zone, and the rupture initiation point of the Yangbi MS 6.4 mainshock was also consistent with this finding (Figure 7A). Norihito et al. (2002) conducted cross-spectral analysis and found that the foreshock sequence has a deep to shallow rupture process, which is thought to be related to the nucleation process of the mainshock. Based on our results, the mainshock events in the three clusters, except Cluster—2, are deeper in the other two clusters, and the subsequent sub-events are essentially at more shallow locations, which is consistent with the findings of Norihito et al. (2002).
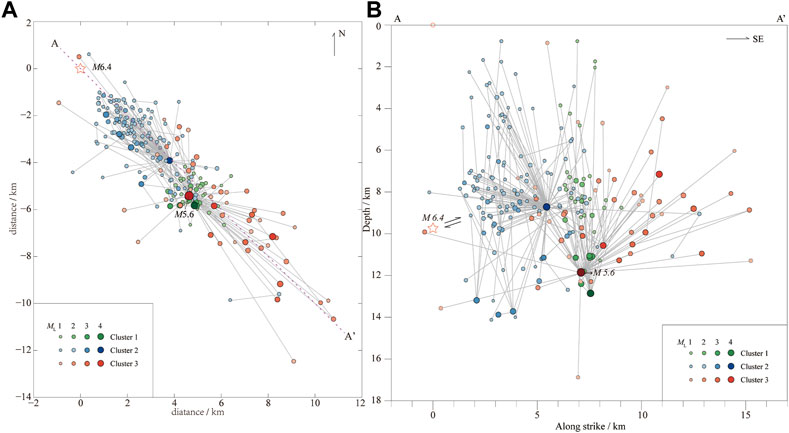
FIGURE 7. Spatial distribution of three small earthquake clusters in the Yangbi 6.4 foreshock sequence. The five-pointed red star indicates the source (starting rupture point) of the MS 6.4 mainshock obtained by relocation, and the two-way arrow is the rupture direction. (A) Spatial distribution of foreshock sequences. (B) Distribution of foreshock sequences on the fault plane.
With reference to the results of the study by Yang et al. (2021), “A-A” in the figure is the fault plane of the Yangbi 6.4 mainshock. Of the three clusters, Cluster—1 occurred in the center of the foreshock concentration zone, with a more concentrated spatial location, as well as an increase in depth from the beginning of several events to the MS 4.2 mainshock at 21:39 on 18 May. Cluster—2 occurred in the northwest of Cluster—1, closer to the future 6.4 mainshock epicenter, and was overall more shallow in depth. Cluster—3 partially overlapped with Cluster—1 but was more extensive and showed rapid spreading; expansion on the fault plane occurred noticeably in a lateral direction, especially toward the southeast. From the foreshock distribution on the fault surface in Figure 7B, it can be clearly seen that the rupture activity was sparse in the area between the initial rupture point of the Yangbi MS 6.4 mainshock and the M5.6 maximum foreshock, and this area was also, basically, the distribution range of the maximum dislocation of the Yangbi MS 6.4 mainshock rupture (Yang et al., 2021).
Observing Cluster—1 reveals that it can well satisfy the previous knowledge about the concentrated spatial distribution of foreshocks and the small spatial distribution (James and Bergthora, 1990; Terry, 1994; Cai and Wang, 1994; Yan et al., 2012). However, the entire foreshock sequence does not fit these characteristics: on the fault plane, the distribution of the foreshock sequence covers most of the future 6.4 mainshock rupture zone. Two events are worth highlighting: ML 2.2, which occurred at 21:42:39 on 21 May at a depth of 9.91 km, immediately adjacent to the initial rupture point of the future MS 6.4 mainshock; and ML 1.9, which occurred 1 minute prior to the mainshock at a depth of 13.56 km; perhaps these two earthquakes are somehow related to the initial rupture of the MS 6.4 mainshock.
We unify time and space to analyze the characteristics of earthquake sequences. This method has more physical and statistical significance, and can obtain the temporal and spatial distribution characteristics of earthquake sequences more intuitively. Furthermore, we can divide the sub-sequences based on their characteristics, and study the spatial distribution of the divided three sub-sequences combined with the direction of fault rupture. This method is more intuitive and innovative.
Based on the calculated nearest-neighbor distances, we plotted the topology tree of this Yangbi earthquake sequence (Figure 8). The topology tree describes the order of connection of seismic events within the sequence, reflecting the transmission depth of the children of each event. The topology tree depth of the entire Yangbi MS 6.4 earthquake sequence is 16, but the maximum depth of the aftershock after the MS 6.4 mainshock was only 8. The average leaf depth is less than 5, which is consistent with theoretical estimates (Zaliapin and BenZion, 2013).
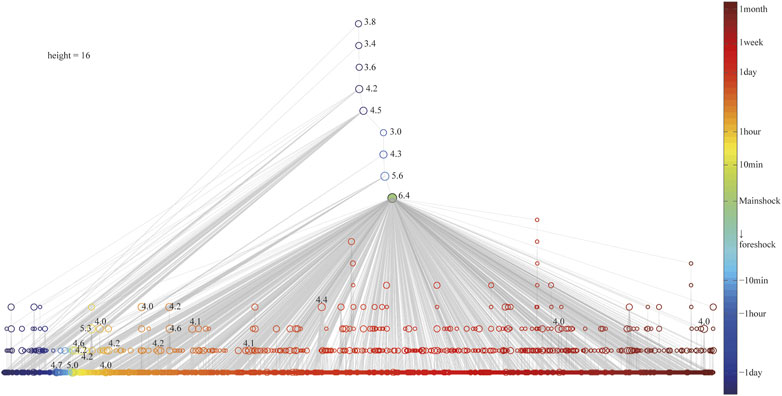
FIGURE 8. Topology tree of the Yangbi 6.4 earthquake sequence. All aftershocks of magnitude 4 or higher are marked on the graph.
Combining the sequence activity process reveals that the same magnitude 4 aftershock, which has no sub-events or few transmission depths of the sub-events early in the sequence activity, triggers more of its higher-order aftershocks and increases its transmission depth as the sequence develops. There are two possible reasons for this phenomenon: first, early aftershocks, even small ones, are directly affected by stress perturbations caused by the mainshock rupture; second, early in the sequence, there may be some degree of missed earthquakes.
Using the same approach, it was found in the analysis of Southern California seismicity that, in addition to isolated background earthquakes, the topology of cluster earthquakes can be divided into two types: linear structure—each event is a child of the previous one, with its largest event occurring in the middle of the sequence; spray-shaped topology—the main shock occurs first in the sequence and the aftershocks are all sub-events of the main shock. These two topologies correspond to the two types of cluster earthquakes: burst-like clustering and swarm-like clustering.
The topology of the entire sequence shows the unusually complex structure of the Yangbi 6.4 foreshock sequence. Cluster—1’s topology tree has a large degree of linear component, from 18:49 ML 3.8 on 18 May to 20:20 ML 3.4, 20:56 ML 3.6 to 21:39 MS 4.2, each being the parent of the latter event; Cluster—2’s topology is relatively simple, independently forming a small sequence of primary aftershocks; Cluster—3’s topology lies between the first two, with 20:55 ML 3.0 on 21 May being the parent event of the subsequent 20:56 M4.3, which, in turn, was the parent event of the subsequent 21:21 M5.6, both of which, in turn, triggered their own aftershocks.
Zaliapin and BenZion (2013) concluded that burst-like clusters may reflect brittle fracture, whereas swarm-like clusters may be associated with mixed brittle-ductile damage in areas of relatively high temperature and/or fluid content. Chen and Knopoff (1987) (b) concluded through theoretical simulations that the sequence type is related to the rupture strength at the fault site. Douglas et al. (1995) identified that foreshock sequences mainly occur at tectonic discontinuities, or weak sites, of faults, and that the foreshock sequences themselves may be a product of the seismic nucleation process. From the analysis of the distribution of the three sub-sequences (clusters) of the Yangbi MS 6.4 foreshock sequence and its topology, the fact that the nature of the activity of the three sub-sequences was so different seems to indicate the tectonic discontinuity of the seismic fault. The activity of Cluster—1 is concentrated in the upper and lower directions, with an extremely narrow lateral spatial distribution, much like a fluid intrusion rupture in a specific channel. Perhaps, we can speculate that the fluid action triggered the activity of Cluster—1, which, in turn, triggered the brittle rupture of the shallow Cluster—2 in the northwest direction of the fault, and the stress perturbation and adjustment caused by Cluster—2 lead to the rupture of the fluid intrusion pipeline to rapidly spread further outward (Cluster—3), which finally triggered the Yangbi MS 6.4 mainshock.
We analyzed the Yangbi MS 6.4 earthquake sequence based on the nearest-neighbor distance algorithm to identify aftershocks and their higher-order aftershocks. Combined with the sequence activity process, we can see that the MS 6.4 mainshock plays a dominant role in the aftershock activity of the sequence, and the majority of aftershocks are its direct aftershocks. Additionally, the triggered secondary aftershocks and their higher-order aftershocks gradually increase by the later stage of the sequence activity.
The foreshock sequence of the Yangbi MS 6.4 earthquake was investigated by combining the double-difference positioning results. The results showed that the b value of the foreshock sequence was clearly low and the nonlinear enhancement process was evident; however, it does not satisfy the characteristics of concentrated spatial distribution and small spreading range. According to the nearest-neighbor distance, with reference to the source distribution on the fault surface, the Yangbi MS 6.4 foreshock sequence can be divided into three sub-sequences (or small clusters): sub-sequence I had the smallest b value and a concentrated spatial distribution—consistent with the previous understanding of foreshocks—and is an F-value foreshock sequence. Sub-sequence II had a recovered b value and an overall shallow source depth, which was more like a burst-like aftershock and shows a standard main aftershock type. Sub-sequence III has a b value that again significantly decreases, with relatively scattered distribution on the fault plane, showing rapid rupture spread, and the sequence parameters are identified as a typical U-F-ρ foreshock sequence.
The parent–child relationship of each event was established based on the nearest-neighbor distance between all foreshock events, and the spatio-temporal development and evolution of the foreshock sequence was further analyzed. Tracing the parent event of the MS 6.4 mainshock revealed that the sequence began to be active for a total of eight generations to the mainshock, and these eight events belong more to the “foreshock” of the MS 6.4 mainshock in a statistical and physical sense. These 8 events are tightly connected; From fault dynamics point, its active mechanism may be have some relationship with the nucleation process of the Yangbi MS 6.4 mainshock.
Finally, using the nearest-neighbor distance, we plotted the topology tree of this Yangbi MS 6.4 earthquake sequence. The analysis of its topology revealed that the structure of sub-sequence I was more linear, similar to fluid intrusion rupture in a specific channel. Sub-sequence II might be the shallow brittle rupture triggered by it, which, in turn, made the fluid intrusion rupture spread faster and finally triggered the Yangbi MS 6.4 mainshock.
There is still much debate about foreshocks characteristics analysis and identification, and even about the definition of foreshocks. The analysis of the spatial and temporal characteristics of foreshock sequences needs to be based on the accurate delineation of foreshocks and aftershocks by Hui et al. (2020). We analyzed the 2021 Yangbi MS 6.4 foreshock sequence activity based on the nearest-neighbor distance algorithm, from which the main aftershocks were distinguished and clear generational relationships were provided. The analysis in this study was based mainly on the statistical analytical results of the basic physical properties of the event (Terry, 1994), without involving the source dynamics parameters and formation characteristics, which is expected to yield more in-depth understanding about foreshocks, if further combined with numerical seismology results in the future.
The datasets presented in this study can be found in online repositories. The names of the repository/repositories and accession number(s) can be found in the article/Supplementary Material.
JZ conceived the study; XL conducted data analyses, and prepared the manuscript and figures. HZ revised the paper. HC contributed to the calculation of the data. CL contributed to the collation of literature related to the research. All authors contributed to the article and approved the submitted version. All authors listed have made a substantial, direct, and intellectual contribution to the work and approved it for publication.
This work was jointly supported by the Collaboratory for the Study of Earthquake Predictability (CSEP) of the China Seismic Experimental Site (2018YFE0109700), the Earthquake Situation Tracking and Orientation Task of the China Earthquake Administration (2022010120), and the Science and Technology Innovation Team of the Shandong Earthquake Administration.
We thank the editor and reviewers for their careful and constructive reviews.
The authors declare that the research was conducted in the absence of any commercial or financial relationships that could be construed as a potential conflict of interest.
All claims expressed in this article are solely those of the authors and do not necessarily represent those of their affiliated organizations, or those of the publisher, the editors and the reviewers. Any product that may be evaluated in this article, or claim that may be made by its manufacturer, is not guaranteed or endorsed by the publisher.
The Supplementary Material for this article can be found online at: https://www.frontiersin.org/articles/10.3389/feart.2023.1168043/full#supplementary-material
Baiesi, M., and Paczuski, M. (2004). Scale-free networks of earthquakes and aftershocks. Phys. Rev. E 69 (62), 066106. doi:10.1103/PhysRevE.69.066106
Bi, J. M., and Jiang, C. S. (2022). Identification and statistical characteristics of foreshock sequences in the North–South seismic belt. J. Seismol. 26 (3), 499–512. doi:10.1007/s10950-021-10063-8
Cai, J., and Wang, X. (1994). Time-space-intensity characteristics and seismic wave characteristics of various foreshock sequences in Yunnan. Acta Seismol. Sin. 16, 39–46.
Chen, Y. T., and Knopoff, L. (1987). Simulation of earthquake sequences. Geophys. J. Int. 91 (3), 693–709. doi:10.1111/j.1365-246X.1987.tb01665.x
Christine, S., Jim, M., and Masumi, Y. (2011). Investigating the distributions of differences between mainshock and foreshock magnitudes. Bull. Seismol. Soc. Am. 101 (6), 2626–2633. doi:10.1785/0120110110
Cui, H., Zheng, J., Wan, Y., Cheng, Y., Fan, Y., Sun, Q., et al. (2022). The seismogenic structure of the 2021 Yunnan Yangbi M_S6.4 earthquake sequence and the difference between the Eryuan earthquake in 2013,Yangbi earthquake in 2017 and 2021. Chin. J. Geophys. 65 (02), 620–636. doi:10.6038/cjg2022P0425
Daniel, T. T., and Zachary, E. R. (2019). Pervasive foreshock activity across southern California. Geophys. Res. Lett. 46 (15), 8772–8781. doi:10.1029/2019GL083725
Department of Forecasting and Prediction China Earthquake Administration (2020). Seismic analysis and prediction technical methods workbook. China: Seismological Press.
Dou, X., Wang, E., Zhang, H., Zhang, B., and Zhang, L. (2020). Study on the prediction significance of the precursory earthquake swarms to mid-strong earthquakes in Gansu and its adjacent area. Prog. Geophys. 35 (05), 1651–1658. doi:10.6038/pg2020EE0241
Douglas, A. D., Gregory, C. B., and Ellsworth, L. E. (1995). Foreshock sequence of the 1992 Landers, California, earthquake and its implications for earthquake nucleation. J. Geophys. Res. Solid Earth 100 (B6), 9865–9880. doi:10.1029/95JB00871
Eugenio, L., Cataldo, G., and Lucilla, D. A. (2019). The relevance of foreshocks in earthquake triggering: A statistical study. Entropy 21 (2), 173. doi:10.3390/e21020173
Hui, H., Lingsen, M., Roland, B., RgmannWei, W., and Kang, W. (2020). Spatio-temporal foreshock evolution of the 2019 M 6.4 and M 7.1 Ridgecrest, California earthquakes. Earth Planet. Sci. Lett. 551, 116582. doi:10.1016/j.epsl.2020.116582
James, C. P., and Bergthora, S. T. (1990). Waveform analysis of two preshock-main shock-aftershock sequences in Utah. GeoScienceWorld 80, 3.
Jin, S., and Jiang, H. (2009). Research progress and application results of sequence attenuation and aftershock excitation. Seismol. EGOLOGY 31 (03), 559–571. doi:10.3969/j.issn.0253-4967.2009.03.017
Lei, X., Wang, Z., and Ma, S. (2021). A preliminary study on the characteristics and mechanism of the May 2021 MS6.4 Yangbi earthquake sequence, Yunnan, China. Acta Seismol. Sin. 43 (3), 261–286. doi:10.11939/jass.20210100
Li, X., and Zheng, J. (2021). Spatiotemporal clustering characteristics of the maduo M_S 7.4 earthquake in qinghai. Seismol. Geomagnetic Observation Res. 42 (1), 17–19. doi:10.3969/j.issn.1003-3246.2021.S1.006
Li, X., and Zheng, J. (2022). Study on the characteristics of small earthquake clustering in jiaodong peninsula area. J. Geodesy Geodyn. 42 (01), 77–81. doi:10.14075/j.jgg.2022.01.015
Lin, B., Li, D., Liu, J., and Wu, A. (1994). Study of foreshock and foreshock sequences. Acta Seismol. Sin. 16, 15.
Liu, Z., Qian, X., and Zhang, J. (1998). Relation between the characteristics of the foreshock sequence and the main shock of the M7.3 west menglian earthquake in 1995 in yunnan. South China J. Seismol. 4, 17–22.
Lucile, M. J. (1984). Foreshocks (1966-1980) in the san andreas system, California. GeoScienceWorld 74, 4. doi:10.1016/0040-1951(85)90292-6
Lucile, M. J., and Peter, M. (1979). Some characteristics of foreshocks and their possible relationship to earthquake prediction and premonitory slip on faults. J. Geophys. Res. Solid Earth 84 (B7), 3596–3608. doi:10.1029/JB084iB07p03596
Luo, Z., Wang, W., and Chen, L. (2000). The time-frame coefficient method to diagnose nonlinear characteristics of earthquake sequences in haicheng-xiuyan region, liaoning Province. Earthquake 1, 18–27. doi:10.3969/j.issn.1000-3274.2000.z1.006
Moutote, L., Marsan, D., Lengliné, O., and Duputel, Z. (2021). Rare occurrences of non-cascading foreshock activity in southern California. Geophys. Res. Lett. 48 (7), e2020GL091757. doi:10.1029/2020GL091757
Norihito, U., Tomomi, O., and Akira, H. (2002). Foreshock and aftershock sequence of the 1998 M 5.0 sendai, northeastern Japan, earthquake and its implications for earthquake nucleation. Bull. Seismol. Soc. Am. 92 (6), 2465–2477. doi:10.1785/0120010140
Paul, A. R. (1999). Foreshock occurrence before large earthquakes. J. Geophys. Res. Solid Earth 104 (3), 4755–4768. doi:10.1029/1998JB900089
Peng, H., and Mori, J. (2022). Characteristics of the foreshock occurrence for Mj3.0 to 7.2 shallow onshore earthquakes in Japan. Earth, Planets Space 74 (1), 40. doi:10.1186/s40623-021-01567-1
Rachel, E. A., and Jim, M. (1996). Occurrence patterns of foreshocks to large earthquakes in the Western United States. Nature 381, 303–307. doi:10.1038/381303a0
Reymond, D., Okal, E. A., Yagi, Y., and Ito, Y. (2003). The Miyagi-ken-hokubu, Japan, earthquake, 2003 July 26 and its the largest fore-shock and largest after-shock. Japan: AGU Fall Meeting Abstracts.
Rong, C. (1978). Consistency of focal mechanism as a new parameter in describing seismic activity. Chin. J. Geophys. 2, 142–159.
Sebastian, H., Gert, Z., and Jurgen, K. (1999). Similar power laws for foreshock and aftershock sequences in a spring-block model for earthquakes. J. Geophys. Res. Biogeosciences 104 (B4), 7243–7253. doi:10.1029/1998JB900122
Song, J., and Wang, W. (1998). Overview of earthquake swarm activities and earthquake prediction. RECENT Dev. WORLD Seismol. 1998 (9), 6–11.
Terry, H. W. (1994). Spatial clustering and stress drops of foreshocks of the February 1990 Tennyson and Weber, New Zealand, earthquakes. GeoScienceWorld 84, 6. doi:10.1785/BSSA0840061739
van den Ende, M., and Ampuero, J. P. (2020). On the statistical significance of foreshock sequences in southern California. Geophys. Res. Lett. 47 (3), 86224. doi:10.1029/2019GL086224
Wang, K., Jin, M., and Huang, Y. (2021). Temporal and spatial evolution of the 2021 Yangbi(Yunnan China) Ms6.4 earthquake sequence. Seismol. Geol. 43 (4), 1030–1039. doi:10.3969/j.issn.0253-4967.2021.04.019
Wang, P., Zheng, J., Li, X., and Xu, C. (2017). Study on the characteristics of earthquake clustering in North China based on the nearest-neighbor distance. J. Geodesy Geodyn. 37 (12), 1229–1233. doi:10.14075/j.jgg.2017.12.005
Xue, Y., Xie, M., Liu, J., and Zhuang, J. (2021). Study on foreshock sequences of the global great shallow-focus earthquakes with M_W≥8.0. Seismol. EGOLOGY 43 (05), 1233–1249. doi:10.3969/j.issn.0253-4967.2021.05.012
Yan, K., Wang, W., Peng, F., Wang, Q., Kou, H., and Yuan, A. (2022). The seismogenic structures and migration characteristics of the 2021 Yangbi M6.4 earthquake sequence in Yunnan, China. Sci. Earth Sci. 65 (8), 1522–1537. doi:10.1007/s11430-021-9933-1
Yan, X., Liu, J., Yu, H., and Liu, S. (2012). Characteristics of magnitude 9.0 seismic activity near the East Coast of Honshu, Japan in 2011. Chin. Sci. Bull. 57 (08), 634–640. doi:10.1007/s11783-011-0280-z
Yang, J., Wen, Y., and Xu, C. (2021). The 21 may 2021 MS6.4 yangbi(yunnan)earthquake: A shallow strike-slip event rupturing in a blind fault. Chin. J. Geophys. 64 (09), 3101–3110. doi:10.6038/cjg2021P0408
Zaliapin, I., and Ben-Zion, Y. (2016). A global classification and characterization of earthquake clusters. Geophys. J. Int. 207 (1), 608–634. doi:10.1093/gji/ggw300
Zaliapin, I., and BenZion, Y. (2013). Earthquake clusters in southern California I: Identification and stability. J. Geophys. Res. Solid Earth 118 (6), 2847–2864. doi:10.1002/jgrb.50179
Zaliapin, I., Gabrielov, A., Keilis-Borok, V., and Wong, H. (2008). Clustering analysis of seismicity and aftershock identification. Phys. Rev. Lett. 101 (1), 018501. doi:10.1103/PhysRevLett.101.018501
Zhang, K., Wang, X., Yang, H., Jende, J. M. E., Kauczor, H. U., Schlemmer, H. P., et al. (2023). Navigator-based slice tracking for kidney pCASL using spin-echo EPI acquisition. Seismol. Geol. 45 (01), 231–239. doi:10.1002/mrm.29621
Zhang, X., Yuan, Z., Yao, L., Tian, L., Yan, X., Wen, Y., et al. (2021). Summary of the Yangbi M_S6.4 earthquake in yunnan on may 21,2021. Seismol. Geomagnetic Observation Res. 42 (06), 165–180. doi:10.3969/j.issn.1003-3246.2021.06.023
Zhao, B., Gao, Y., and Ma, Y. (2022). Relocations, focal mechanisms and stress inversion of the May 21th 2021 Yangbi MS6.4 earthquake sequence in Yunnan, China. Chin. J. Geophys. 65 (03), 1006–1020. doi:10.6038/cjg2022P0497
Zhao, G. (1990). Comparison for the focal depth of foreshock and common swarm. Earthq. Res. China 4, 59–68.
Zheng, J., Li, D., Wang, P., Lv, Z., and Lin, M. (2014). Method and application of clustering seismicity identification based on nearest-neighbor distance. Earthquake 34 (04), 100–109. doi:10.3969/j.issn.1000-3274.2014.04.011
Keywords: b value, nearest-neighbor distance algorithm, topology structure, aftershock, earthquake sequence
Citation: Li X, Zheng J, Zhang H, Cui H and Li C (2023) Study on the sequence activities of the 2021 Yangbi MS 6.4 earthquake in Yunnan. Front. Earth Sci. 11:1168043. doi: 10.3389/feart.2023.1168043
Received: 17 February 2023; Accepted: 02 May 2023;
Published: 11 May 2023.
Edited by:
Huaizhong Yu, China Earthquake Networks Center, ChinaReviewed by:
Lingyuan Meng, China Earthquake Networks Center, ChinaCopyright © 2023 Li, Zheng, Zhang, Cui and Li. This is an open-access article distributed under the terms of the Creative Commons Attribution License (CC BY). The use, distribution or reproduction in other forums is permitted, provided the original author(s) and the copyright owner(s) are credited and that the original publication in this journal is cited, in accordance with accepted academic practice. No use, distribution or reproduction is permitted which does not comply with these terms.
*Correspondence: Jianchang Zheng, empjbWFpbEB5ZWFoLm5ldA==
Disclaimer: All claims expressed in this article are solely those of the authors and do not necessarily represent those of their affiliated organizations, or those of the publisher, the editors and the reviewers. Any product that may be evaluated in this article or claim that may be made by its manufacturer is not guaranteed or endorsed by the publisher.
Research integrity at Frontiers
Learn more about the work of our research integrity team to safeguard the quality of each article we publish.