 Costanza Bonadonna1*
 Marco Pistolesi2
 Lucia Dominguez1
 Valentin Freret-Lorgeril1,3
 Eduardo Rossi1
 Allan Fries1Sebastien Biass1Marija Voloschina2
 Jonathan Lemus1Jorge E. Romero4Vittorio Zanon5Camille Pastore1
 Maria-Paz Reyes Hardy1
 Luigia Sara Di Maio1
 Pietro Gabellini6Alba Martin-Lorenzo7,8Fatima Rodriguez7
 Nemesio M. Perez7,8
- 1Department of Earth Sciences, University of Geneva, Geneva, Switzerland
- 2Department of Earth Sciences, University of Pisa, Pisa, Italy
- 3Laboratoire Magmas et Volcans, CNRS, IRD, OPGC, Université Clermont Auvergne, Clermont-Ferrand, France
- 4Department of Earth and Environmental Sciences, University of Manchester, Manchester, United Kingdom
- 5Instituto de Investigação em Vulcanologia e Avaliação de Riscos, University of the Azores, Ponta Delgada, Portugal
- 6Department of Earth Sciences, University of Florence, Florence, Italy
- 7Instituto Volcanológico de Canarias (INVOLCAN), San Cristóbal de La Laguna, Tenerife, Canary Islands
- 8Instituto Tecnológico y de Energías Renovables (ITER), Granadilla de Abona, Tenerife, Canary Islands
Long-lasting eruptions are of complex characterization and are typically associated with challenging risk assessment and crisis management due to the usual occurrence of multiple interacting hazards evolving at different temporal and spatial scales (e.g., lava, tephra, and gas). The 2021 Tajogaite eruption of Cumbre Vieja (La Palma) demonstrated how even hybrid events that are mostly effusive can be associated with widespread and impacting tephra deposits as a result of a complex interplay among gas flux, conduit geometry, and magma feeding rate. In this novel study, direct observations, syn-eruptive and post-eruptive sampling, and statistical analysis of pulsatory activity have been combined to provide new insights into eruption dynamics. They show how rapid gas segregation and high magma ascent rate modulated the gas flux at multiple vents, resulting in short-time fluctuations among the different explosive styles (ash-poor gas puffing, Strombolian, violent Strombolian, and lava fountaining) and unsteady tephra ground accumulation. Various size-selective sedimentation processes were also observed, including particle aggregation and ash fingers, which have impacted the overall tephra dispersal. In fact, even though both local and total grainsize distributions of selected layers, units, and of the whole tephra blanket are unimodal with a low fine-ash content, grainsize analysis of 154 samples suggests no correlation of particles <63 μm with distance from vents. Our analyses demonstrate the need to include a detailed characterization of all products of hybrid eruptions for a comprehensive interpretation of eruptive dynamics and to use multiple classification strategies that can capture eruptive styles at different temporal scales.
1 Introduction
Tephra deposits result from the combination of various factors, including magma rheology, eruptive styles, plume dynamics, atmospheric conditions, and sedimentation processes. They are typically characterized based on the compilation of isopach or isomass maps that describe the distribution of thickness or mass per unit area around a volcano, and that can be used to determine the erupted volume and mass (Engwell et al., 2013; Klawonn et al., 2014). Nonetheless, the distribution of thickness and ground load can be impacted by size-selective sedimentation processes (e.g., particle aggregation and ash fingers) that favor the premature fallout of fine ash, potentially resulting in secondary maxima of accumulation (Brown et al., 2012; Manzella et al., 2015). Aiming at a better understanding of volcanic eruptions and their hazards, the distribution of tephra-deposit thickness is, therefore, best explored together with other key aspects that include particle grainsize and tephra sedimentation processes. In addition, risk modeling not only requires information on grainsize and accumulation rate for a better estimation of the future impact on exposed elements but also constraints on the timescales of sedimentation (Jenkins et al., 2015; Craig et al., 2016). In fact, tephra deposits can severely impact the built environment, ecosystem, and public health depending not only on the thickness and ground load but also on particle size and ground accumulation rate (Wilson et al., 2012; Jenkins et al., 2015; Blake et al., 2017). Information on the total grain size distribution (TGSD) of the erupted material is also necessary for long-term hazard assessment and real-time forecasting of ash dispersal, based on the application of dedicated analytical and numerical models (Scollo et al., 2007; Biass et al., 2014; Beckett et al., 2020). Finally, grainsize data provide information on magma rheology and fragmentation efficiency and are required to classify eruptive styles (Walker, 1973; Kaminski and Jaupart, 1998; Rust and Cashman, 2011).
Even though tephra deposits retain key features of volcanic eruptions (e.g., erupted volume, erupted mass, and TGSD), their interpretation can be rather challenging in case of complex eruptive dynamics, such as those associated with long-lasting and/or hybrid eruptions. In fact, long-lasting eruptions, which last for more than a few days, can be affected by variable eruptive and atmospheric conditions (e.g., 2010 eruption of Eyjafjallajökull, Iceland, Gudmundsson et al., 2012; 2001 eruption of Etna, Italy, Scollo et al., 2007), while hybrid eruptions are associated with both effusive (e.g., domes, lava flows) and explosive features (e.g., tephra plumes, pyroclastic density currents) that can vary in time and can be either simultaneous or sequential (e.g., 1944 eruption of Mt. Vesuvius, Italy, Cole and Scarpati, 2010; 1943–1952 eruption of Parícutin, Mexico, Pioli et al., 2008; 1995–1998 eruption of Montserrat, West Indies, Robertson et al., 2000; 2011 eruption of Cordón Caulle, Chile, Schipper et al., 2013; Elissondo et al., 2016). In addition, long-lasting and hybrid eruptions might be characterized by pulsatory activity associated with various eruptive styles (e.g., Strombolian, violent Strombolian, and Vulcanian explosions) from multiple vents, which further complicate the overall tephra sedimentation (Dominguez et al., 2016; Pioli et al., 2022). Eruption unsteadiness often results in the formation of multiple layers, with various thinning rates away from the vents that are complex to correlate. Tephra deposits of long-lasting and hybrid eruptions are, therefore, often characterized only based on tephra thickness, while grainsize data are only determined for specific locations of the cumulative tephra blanket for classification of the eruptive style (Pioli et al., 2008; Di Traglia et al., 2009; Rowland et al., 2009). Dedicated strategies are required to unravel tephra sedimentation associated with long-lasting or hybrid eruptions including direct observations of eruptive styles and consequent tephra fallout in order to best correlate stratigraphy with eruption chronology and dynamics (Bonadonna et al., 2002; 2015; 2022; Pistolesi et al., 2015).
Here, we present a detailed study of tephra sedimentation and grainsize associated with the complex tephra blanket of the 2021 long-lasting, hybrid eruption of Cumbre Vieja (La Palma, Canary Islands) named Tajogaite eruption (Carracedo et al., 2022; D’Auria et al., 2022; Pankhurst et al., 2022). This tephra blanket has already been described in combination with other eruptive products (tephra cone and lava flows) to characterize the associated eruptive styles and dynamics (Bonadonna et al., 2022; Romero et al., 2022). Hereafter, we use the term tephra blanket to differentiate it from the tephra cone that is also part of the tephra fallout deposit of the 2021 Tajogaite eruption (Bonadonna et al., 2022). Thanks to multiple syn-eruptive and post-eruptive field campaigns, the temporal and spatial fluctuations of grainsize features are here investigated together with other key aspects such as pulsatory explosive behavior (frequency and regularity of explosions), ground accumulation rate, and tephra sedimentation processes (e.g., lapilli waves, ash fingers, and particle aggregation). Frequency of pulsatory activity and grainsize data are also used for the determination of plume height and for eruption classification purposes. This allowed deposit characteristics to be correlated with eruptive dynamics and shed some light on the complex dynamics of long-lasting, hybrid, pulsatory eruptions.
2 Geological context, eruption chronology, and main eruption features
La Palma is the most active volcanic island of the Canary archipelago, with historical eruptions occurring in 1585, 1646, 1677–78, 1712, 1949, 1971, and 2021 (Carracedo et al., 1998; 2001; 2022; Klügel et al., 1999; Barker et al., 2015). Its formation began 3–4 Ma ago as a submarine basal complex of seamounts (Staudigel et al., 1986; Carracedo et al., 1999), followed by subaerial activity constructing the Garafía and Taburiente shield volcanoes and the Cumbre Nueva rift in the northern sector of the island (Carracedo et al., 1999; 2001; Barker et al., 2015). Following multiple, large lateral collapses, the Bejenado complex developed within the SW-directed collapse scar (0.56–0.49 Ma, Ancochea et al., 1994; Day et al., 1999; Carracedo et al., 1999; 2001) and volcanic activity shifted southward. The recent historical eruptive activity is observed within the Cumbre Vieja rift in the southern sector of the island, which formed 125 ka ago and comprises a 20-km-long, N–S-aligned volcanic ridge (Carracedo et al., 1999; 2001). Volcanic activity has been characterized by monogenetic fissure eruptions at closely spaced multiple vents, leading to the formation of cinder cones, erupting prevalently silica-undersaturated basanites to phonotephrites and alkali basalts (Klügel et al., 2000; Carracedo et al., 2001; Barker et al., 2015; Pankhurst et al., 2022).
Following a few years of low-magnitude seismic unrest at depths of 25–35 km and 7 days of intense seismic unrest associated with ground deformation, a new eruption started on 19 September 2021 in the Cabeza de Vaca area, on the western side of the Cumbre Vieja ridge, that lasted nearly 3 months (Torres-Gonzáles et al., 2020; Fernández et al., 2021; Longprè, 2021; Carracedo et al., 2022; De Luca et al., 2022; Martí et al., 2022; Dayton et al., 2023; Plank et al., 2023) (Figure 1). The eruption involved effusive and explosive activity from multiple vents distributed along a 500-m-long NE–SW fissure (Carracedo et al., 2022; Gonzáles, 2022; Pankhurst et al., 2022) and represents an example of a cone-forming, long-lasting, hybrid eruption associated with a decoupled magma–gas system (Bonadonna et al., 2022; Romero et al., 2022). SE (high-altitude) vents were associated with the generation of tephra plumes and lava fountains, while passive degassing and lava flows were observed at the NW (low-altitude) vents (Carracedo et al., 2022; Romero et al., 2022). The Tajogaite cone reached a final volume of 36.5 ± 0.3×10⁶ m3 and a height of 187 m above the previous ground level (Civico et al., 2022). The overall volume (tephra blanket, tephra cone, and subaerial lava flow) was estimated at 1–3 × 10⁸ m3, with the tephra blanket constituting <20% of the total erupted volume (∼2 × 10⁷ m3; Bonadonna et al., 2022). The low viscosity of this basanite–alkali basalt magma (<160 Pa s within eruption temperatures of ∼1075 to ∼1150°C) resulted in exceptionally fast and fluid lava flows erupted at high emission rates at the beginning of the eruption, which reached the ocean on 28 September 2021 and covered a surface of 12 km2 (Carracedo et al., 2022; Pankhurst et al., 2022). However, as demonstrated by rheological experiments (Castro and Feisel, 2022; Di Fiore et al., 2023), magma viscosity varied throughout the eruption in relation to petrographic and geochemical characteristics of the erupted magmas (Day et al., 2022).
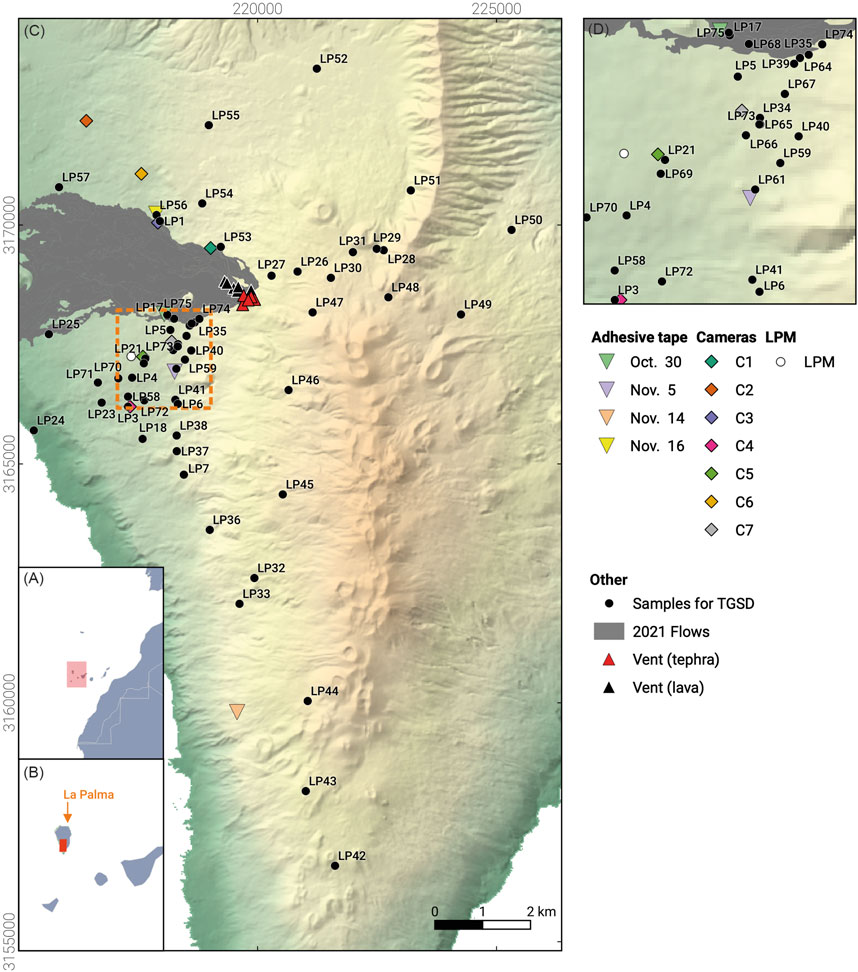
FIGURE 1. Map of sample locations studied in this paper for grainsize (black circles) and collection with adhesive tape (inverted triangles); locations of observations with cameras (diamonds) and Laser Precipitation Monitor (LPM; white circle) are also shown. Insets show the location of the Canary Islands and of La Palma; figure on the right zooms on the orange box in the main map.
The tephra sequence reflects the pulsatory behavior of the explosive activity and is crucial for unraveling the shifts in eruptive style and dynamics with the associated variability in eruption source parameters. Bonadonna et al. (2022) combined the tephra records with detailed observations on wind characteristics, seismic tremor data, tephra cone evolution, and lava emission rates to provide a comprehensive eruption chronology and stratigraphy. The tephra sequence is dominated by an alternation of multiple lapilli-bearing, tephra-fallout layers that are millimeter-to-centimeter thick and ash-dominated fallout layers at proximal distances (within about 3 km from vents). The cumulative tephra blanket is dispersed in the NE–SW direction due to a complex wind pattern characterized by strong trade winds blowing in the SW direction, weaker winds that could rotate by 360°, and land/sea breeze. The stratigraphic sequence can be grouped into three main units (lower unit, LU; middle unit, MU; upper unit, UU) that can be correlated down to the western coastline, up to about 5–6 km from the vents; in proximal areas, these three units can be further subdivided into 11 layers (LU1–3, MU1–6, and UU1–2) (Figure 2). Sedimentation timing of individual units and that of some layers could be inferred based on direct observations and analysis of tephra accumulation in the tray network installed and managed by the Instituto Volcanológico de Canarias, INVOLCAN, showing a good correlation with both lava emissions and tremor data (Figure 2; Bonadonna et al., 2022; Rodriguez et al. submitted). The LU (emplaced between 19 September and 10–12 October) is lapilli-dominated, interbedded with fine-to-coarse ash layers. This unit represents the coarsest and most voluminous unit of the eruption associated with the highest Mass Eruption Rate (MER; 4.3 ± 0.8 × 10³ kg s-1) and the highest average plume height (3.8 km above sea level, a.s.l., based on the daily morning observations reported by PEVOLCA; Plan de Emergencias Volcánicas de Canarias, https://www.gobiernodecanarias.org/infovolcanlapalma/pevolca/). In this paper, the MER refers to the eruption rate associated with the tephra blanket, while the rate associated with lava flow is referred as the lava emission rate; in addition, the cumulative MER refers to the overall mass eruption rate of the tephra blanket, cone, and lava. The transition from the LU to MU was associated with a marked decrease in grainsize to fine–coarse ash, concomitant with an increase in the volcanic tremor on 10–12 October, and a decrease in the lava emission rate. The MU explosive activity lasted until 25–27 November and was associated with a slightly lower MER (2.7 ± 0.6 × 10³ kg s-1), fairly constant lava emission rates (6.4 ± 3.2 × 10⁴ kg s−1), and an average plume height of 3.3 km a.s.l. (Bonadonna et al., 2022). Finally, the transition from the MU to UU was marked by a change in the seismic signature of the eruption (i.e., LP/VLP ratio) and a decrease in the lava emission rate (4.8 ± 2.4 × 10⁴ kg s−1; Bonadonna et al., 2022), with a simultaneous, final increase in grainsize of tephra layers and formation of a lava bomb field. The UU was associated with a MER of 3.7 ± 0.9 × 10³ kg s-1 and an average plume height of 2.2 km a.s.l. (this average does not include the highest plumes of 6 and 8.5 km a.s.l. that were observed in the afternoon of the last 2 days of the eruption; PEVOLCA reports; Bonadonna et al., 2022).
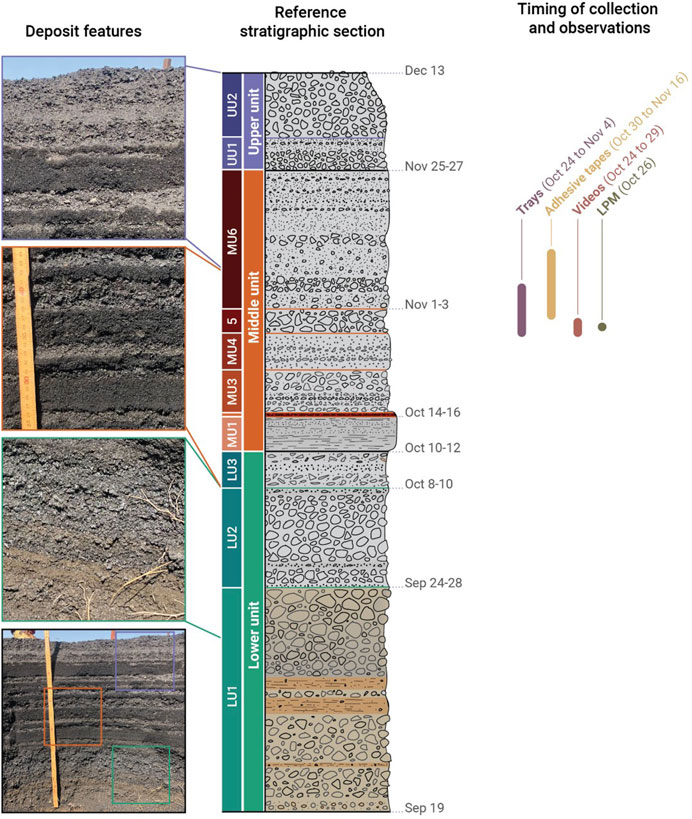
FIGURE 2. Reference stratigraphic section based on outcrops LP34 and LP35 between 1 and 2 km SW of vents (Figure 1). Timing of emplacement of the eruptive phases (layers and units; adjusted from Bonadonna et al., 2022) as well as timing of syn-eruptive in situ collections and observations are also shown. It should be noted that the exact correlation of syn-eruptive collections and observations with stratigraphy is not possible as the temporal transition from MU4 to MU5 is not constrained. On the left, the overall view (bottom picture) of the tephra sequence at LP34, with details of the main units shown in the colored boxes (green, Lower Unit; orange, Middle Unit; purple, Upper Unit).
3 Methods
Field work was carried out in October–November 2021 and February and May 2022. Syn-eruptive data acquisition during the first campaign included i) high-definition imaging of pulsatory activity and tephra sedimentation; ii) ash detection with an optical disdrometer; iii) collection of ash aggregates on dedicated carbon adhesive tapes; and iv) collection of tephra samples in dedicated trays for determination of the accumulation rate and grainsize analysis (Figure 2). During all campaigns, tephra samples were also collected from trenches dug for grainsize analysis. Moreover, during February and May 2022, selected sections analyzed during the first trip were revisited, and additional outcrops were characterized to complete sample collection for grainsize analysis (Figure 1). Detailed stratigraphic analysis of the tephra blanket based on excavated trenches is presented in Bonadonna et al. (2022).
3.1 Analysis of tephra sedimentation and pulsatory activity based on high-definition videos
High-definition videos of the eruption were acquired between 24 and 29 October 2021 using three cameras (Canon HF G40, Canon HF G50, and Sony HD-SR8e) with a resolution of 1920
3.2 Analysis of tephra sedimentation based on the Laser Precipitation Monitor
Local tephra sedimentation was recorded between 25 and 27 October 2021 using a Laser Precipitation Monitor (LPM) optical disdrometer. The instrument uses a laser sheet (785 nm wavelength) with a surface S of 46.5 cm2 to detect settling tephra particles. The crossing time of each detected particle is a function of its settling velocity v, while the induced extinction of the laser is used to retrieve its size Dp. Full details of the instrument are available in Angulo-Martinez et al. (2018) and Freret-Lorgeril et al. (2022b). The LPM was located at three different sampling sites concomitantly for determining tephra accumulation rates with trays and acquiring videos of the eruption (Figure 1). Thanks to the simultaneous measurements of Dp and v and their number n, LPM data can be converted into a sedimentation rate,
where ρ is the particle density, v(Dp) is the detected settling velocity (m s−1) of particles with diameter Dp (m), and Dp is the resolution of diameter classes set to 50 × 10−6 m. Given that 90% of the particles detected by the LPM have sizes between 0 and 2 ϕ (250–1000 μm), particle density here is considered between 1700 and 2700 kg m−3 based on laboratory analyses and in agreement with density measurements of tephra associated with the Etna eruptions (Freret-Lorgeril et al., 2022a). Finally, N(Dp) is the particle number density equal to n/(SΔtv(Dp)dDp), with Δt being the integrated time interval of the disdrometer records, which is equal to 60 s in this study. The accumulation rate computed from the mass of tephra accumulated in trays is also compared with the sedimentation rate calculated from the disdrometer records using Eq. 1. It should be noted that the LPM grainsize data were filtered following the procedure described in Freret-Lorgeril et al. (2022b) to eliminate particles falling at the edge of the laser beam (i.e., margin fallers).
3.3 Analysis of ash aggregation based on collection on carbon adhesive tapes
In order to investigate particle aggregation associated with different eruptive and meteorological conditions, carbon adhesive tapes were exposed, for intervals between 2 and 10 min at various locations, between 30 October and 16 November 2021, following the strategy of Bonadonna et al. (2015) (Figure 1; Table 1). Intervals between 2 and 10 min were necessary in order to collect multiple, but not overlapping, aggregates and particles for further analysis using scanning electron microscopy. Four tapes collected on four different days were analyzed with energy-dispersive spectroscopy of the scanning electron microscope (SEM-EDS) at the University of Geneva to characterize ash aggregates and determine the chemical composition of their constituents; a total of 52 aggregates were investigated (Table 1). The meteorological conditions at the collection sites were characterized by the presence of light rain on 5 and 16 November, while no rain was reported on 30 October and 14 November.
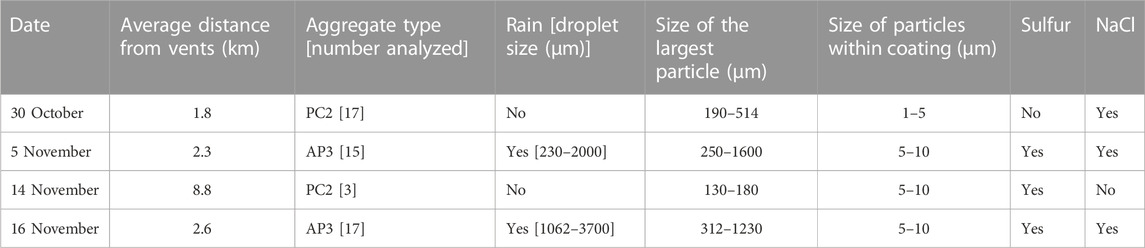
TABLE 1. Main features of ash aggregates collected in situ on carbon adhesive tapes and analyzed with SEM-EDS for both size and chemical composition (see Figure 1 for locations). The presence of crystals and precipitates of sulfur and sodium chloride is also indicated.
Table 1 displays the main features of ash aggregates collected in situ on carbon adhesive tapes and analyzed with SEM-EDS for both size and chemical composition (see Figure 1 for locations). The presence of crystals and precipitates of sulfur and sodium chloride is also indicated.
3.4 Analysis of the tephra accumulation rate and erupted mass based on tray collection
Tephra accumulation rates were estimated based on collection in dedicated rectangular plastic trays (32
3.5 Grainsize, plume height, and eruption classification
A total of 154 samples collected at selected outcrops to determine the grainsize and 28 samples collected in trays (Figure 1) were dried overnight at 80 °C and sieved to 500 μm, at half ϕ intervals. The fraction <500 μm was analyzed with the Bettersizer S3 Plus Laser Particle Size and Shape Analyzer at the University of Geneva (https://www.bettersizeinstruments.com/products/bettersizer-s3-plus/). Values of F1 (wt% of tephra <1 mm); F2 (wt% of tephra <63 μm); sorting (σϕ); and median (Mdϕ) were calculated (Inman, 1952). Maps of iso-Mdϕ were compiled and used to determine the mean plume height of selected layers, units, and total tephra blanket (Bonadonna and Costa, 2013; Freret-Lorgeril et al., 2022a). The TGSD of the selected layers, of the three units, and of the total tephra blanket was determined based on the Voronoi tessellation strategy (Bonadonna and Houghton, 2005; Biass and Bonadonna, 2014). Grainsize data were also combined with dispersal data (Bonadonna et al., 2022) to classify the explosive phase of the 2021 Tajogaite eruption based on the method of Walker (1973). In particular, the wt% of tephra particles with diameter smaller than 1 mm, measured along an axis of dispersal where the isopach is 10% of the maximum thickness (F), was combined with the area enclosed by the isopach contour representing 1% of the maximum thickness (D); while F is an indicator of fragmentation, D is an indicator of plume height (Walker, 1973).
4 Results
4.1 Eruption dynamics and tephra sedimentation during the deposition of the middle unit
Thanks to in situ observations and sampling between October and November 2021 (Figure 2), specific characteristics of eruption dynamics and tephra sedimentation during the deposition of the MU could be described in detail. These features include i) pulsatory activity (based on videos taken between 24 and 29 October 2021; Supplementary Tables S1, S2); ii) sedimentation rate (based on LPM detection on 26 October 2022); iii) accumulation rate and grainsize characteristics (based on sequential sampling in trays between 24 October and 4 November; Table 2 and Supplementary Table S3); iv) sedimentation features (based on videos taken between 24 and 29 October 2021; Supplementary Table S1); and v) particle aggregation (based on in situ sampling on dedicated carbon adhesive tapes between 30 October and 16 November; Table 1).
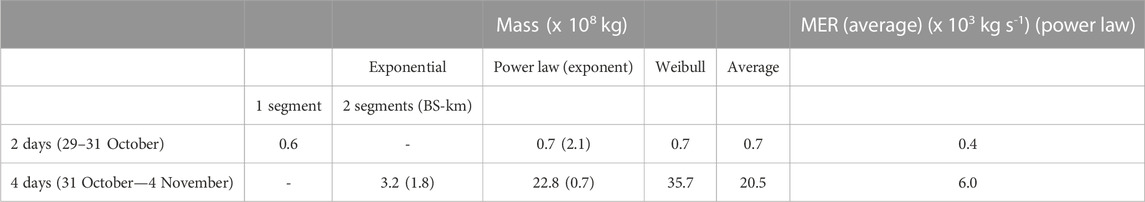
TABLE 2. Mass associated with activity normalized between 2 and 4 days as calculated from tephra accumulation in dedicated trays. Collection started between 11:40 and 16:00 on 29 October and ended between 12:27 and 14:38 on 31 October (for the 2-day calculation) and it started between 12:31 and 14:42 on 31 October and ended between 13:43 and 14:46 on 4 November (for the 4-day calculation) over the seven trays (Figures 5E, F). Values of break in slope (BS) for the 2-segment exponential integration of the power-law exponent are indicated in brackets. Mass for the power-law integration represents the average of two values determined considering two distal limits of integration selected for values of thickness of 0.1 cm and 0.01 cm which correspond to 10 and 30 km for 2-day accumulation and 50 and 100 km for 4-day accumulation, respectively. The MER was calculated from the ratio between the average value of mass and duration.
In order to best interpret our syn-eruptive observations and sampling, it is crucial to consider the fine-to-coarse ash-dominated nature of the MU intercalated with lapilli layers that were emplaced between 11 ± 1 October and 26 ± 1 November 2021 (Figure 2). Six layers could be identified within the MU based on grainsize variation (MU1 to MU6), with a transition between MU1 and MU2 occurring on 15 ± 1 October and between MU5 and MU6 on 2 ± 1 November; no time constraint could be identified for MU3 and MU4 (Figure 2) (Bonadonna et al., 2022; Rodriguez et al. submitted). The most distinctive layers are MU1 (massive, black ash-bearing layer); MU2 (∼millimeter-thick, red, oxidized fine-to-coarse ash-bearing layer); and MU5 (massive, poorly sorted, brown-to-black lapilli-bearing layer). While MU1 represents the finest layer, MU5 represents the coarsest layer of MU. MU2 was used as a marker layer to help correlate the deposits at different distances from the vent, given the distinctive abundance of red, oxidized dense lithics. MU6 is characterized by an alternation of massive, moderately to poorly sorted, gray-to-black ash sub-layers (MU6.1 to MU6.5) (Bonadonna et al., 2022).
4.1.1 Pulsatory activity
The explosive phases of the Tajogaite eruption were characterized by a remarkably complex pulsatory activity of various intensities and frequencies at multiple vents that were often simultaneously active. A variety of eruptive styles associated with three vent areas and imaged in six videos taken between 24 and 29 October (Figure 2) were classified based on the general observation that puffing activity is associated with frequent and irregular ash-poor gas puffs (passive degassing); Strombolian explosions are characterized by highly regular and frequent pulses associated with very proximal (<1 km from vents) and short-lived fallout; violent Strombolian explosions are characterized by less regular and less frequent pulses generating a continuous ash-rich plume; and lava fountaining represents more irregular and nearly continuous steady-state flow (Dominguez et al., 2016; Houghton et al., 2016; Spina et al., 2019) (Figures 3A–E and Supplementary Tables S1, S2).
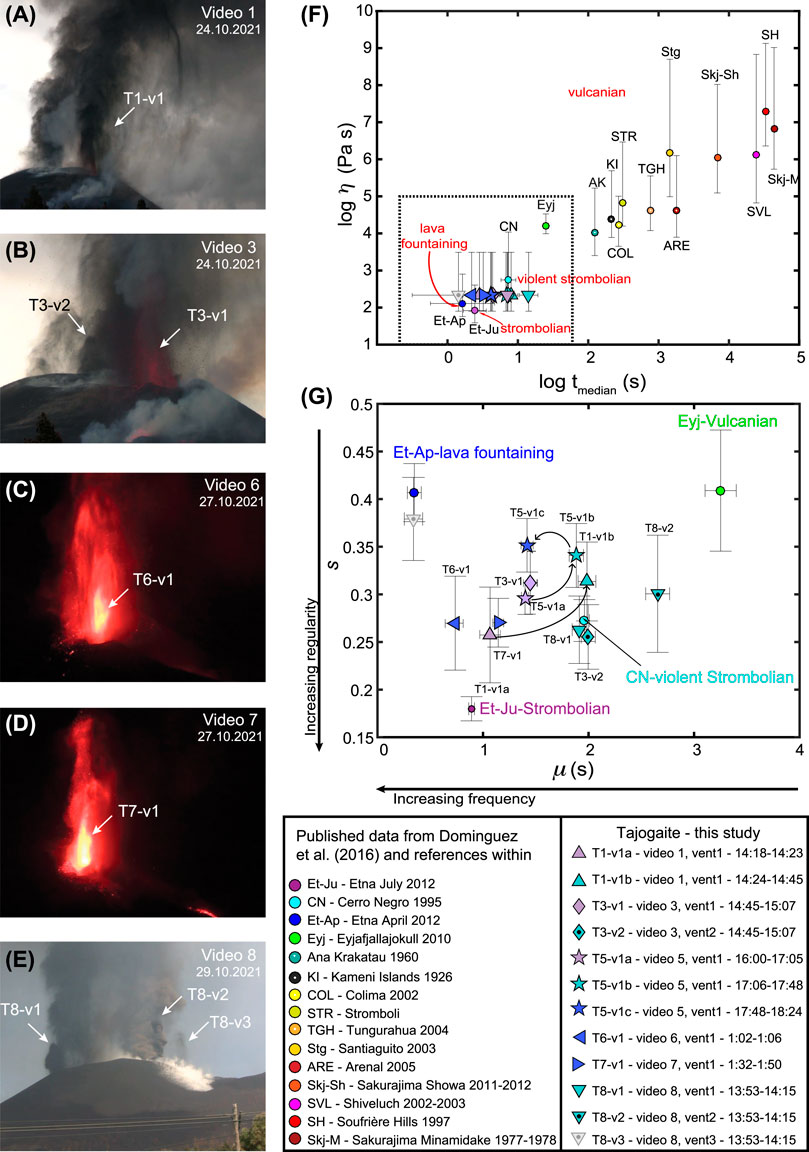
FIGURE 3. Analysis of pulsatory activity at multiple times and vents. (All videos can be found in supplementary material indicated as Supplementary Videos S1–S8) (A–E) Snapshots taken from five analyzed videos (see Figure 4 for Supplementary Video S5). (F) Correlation of the median repose interval (tmedian) as a function of magma viscosity and eruptive styles. Error bars correspond to the absolute error of the median repose interval (X-axis) and the range of viscosities estimated as minimum and maximum water content (Y-axis). The dashed area corresponds to the datasets analyzed in this study. (G) Variation of log-logistic parameters, μ and s, for eruptions in the dashed area of (F). Error bars correspond to the standard error of fitted parameters. Black arrows indicate a style change sequence at the same vent. Eruptive style observations are associated with Strombolian (light purple), violent Strombolian (dark cyan), and lava fountaining (dark blue). Black dot of T3-v2 and T8-v2 indicates the analysis of vent 2. Gray dot of T8-v3 indicates the vent 3. All other data are related to vent 1 (see Supplementary Tables S1, S2; Supplementary Figures S1, S2 for more details).
Since pulsatory analysis for specific eruptive styles requires periods of steady conditions, examples of three types of stationary eruptive dynamics were analyzed (Figure 3; Supplementary Tables S1, S2): i) variable eruptive dynamics over time at vent 1 (i.e., Supplementary Videos S1, S5; Figure 3); ii) simultaneous but different eruptive dynamics at vents 1, 2, and 3 (i.e., Supplementary Videos S3, S8; Figure 3); and iii) lava fountains at vent 1 (i.e., Supplementary Videos S6, S7; Figure 3). Repose time intervals range from 0.04 to 43.00 s for the whole Tajogaite dataset, with a median time interval (tmedian) of 2.16–14.08 s (Figure 3F and Supplementary Table S2). Log-logistic parameters, μ and s, range from 0.35 to 2.66 and 0.26 to 0.38, respectively (Figure 3G and Supplementary Table S2).
The first analysis focuses on variable eruptive styles at vent 1. Datasets T1 and T5 show an overall change in the eruptive behavior over time at vent 1, that shifts from frequent and regular Strombolian explosions (T1-v1a) associated with limited amount of ash to less frequent and irregular violent Strombolian explosions (T1-v1b) associated with a continuous ash-rich plume (Figure 3G, Supplementary Table S2). Vent 2 was also active at the same time, but analysis of the associated activity was not possible due to poor visibility. An interesting variation of pulsatory behavior for T5 was observed for 2 h and 24 min in Supplementary Video S5. Based on the statistical analysis of stationarity, three periods were identified, shifting from frequent and regular Strombolian explosions (T5-v1a) to less frequent and irregular violent Strombolian explosions (T5-v1b) to finally becoming an almost continuous flow (lava fountaining), although with fluctuations in the pulsatory activity (T5-v1c) (Figure 3G; Supplementary Table S2).
The second analysis concerns simultaneous and variable eruptive styles at vent 1, vent 2, and vent 3. The results show that, when active at the same time, vent 1 had a less intense activity in comparison with vent 2, with explosion frequency being higher at vent 1 than at vent 2 (T3-v1 to T3-v2 and T8-v1 to T8-v2). In particular, T8 shows a sustained and vigorous plume at vent 2 with long repose periods, displaying a behavior characteristic of Vulcanian activity (i.e., close to that of Eyjafjallajökull 2010 eruption; Dominguez et al., 2016). Although active at the same time, vent 3 was mostly associated with the emission of ash-poor gas puffs characterized by high frequency and low regularity (Figure 3G; Supplementary Table S2). Furthermore, an increasing degassing (white, ground-hugging cloud) on the SW slope was observed during the period of analysis (Figure 3E).
The third analysis concerns lava fountains at vent 1 during the night (datasets T6 and T7; Figures 3C, D). The results indicate very frequent and relatively regular explosions (T6-v1a; T7-v1a) (Figure 3G; Supplementary Table S2). The activity at the other vents could not be determined because of nighttime and the almost sustained flow at vent 1.
4.1.2 Tephra sedimentation rate (LPM) and accumulation rate (trays)
LPM measurements obtained for the afternoon of 26 October 2021 were correlated with both the analysis of pulsatory activity (Supplementary Video S5 in Supplementary Tables S1, S2) (Figure 4) and the analysis of tephra accumulation rate in trays (Figure 5A). Starting from 16:00 local time (LT), corresponding to the onset of the T5 dataset, the eruptive activity of Tajogaite progressively shifted from relatively regular Strombolian explosions to sustained lava fountaining activity at vents 1 and 2, with at least three periods of increasing intensity activity identified from the statistical analysis of the repose interval (Figure 3G, Figure 4A, B). For this period, the LPM captured both a size increase (i.e., Mdϕ values of 1.5 ± 0.1 between 16:00 and 17:00 LT down to 0.9 ± 0.1 between 18:00 and 18:20 LT) and a particle number increase (from 33 ± 23 to 492 ± 50 particles per min on average for the whole dataset; Figure 4C). At the same time, the sedimentation rate continuously increased from the base level of 4.0 ± 2.8 × 10⁻³ g m−2 s−1 (average between 16:00–16:10 LT) up to 1.2 ± 0.5 g m−2 s−1 (average between 18:00 and 18:20 LT) (Figure 4D). LPM-based sedimentation rates are slightly higher but consistent with the values of the accumulation rate obtained from tray samples of the same period (average ratio of 0.64 ± 0.9). These observations agree with a gradual change in the eruptive style and with the periods identified based on the pulsatory analysis (T5-v1a, T5-v1b, and T5-v1c; Figure 4B).
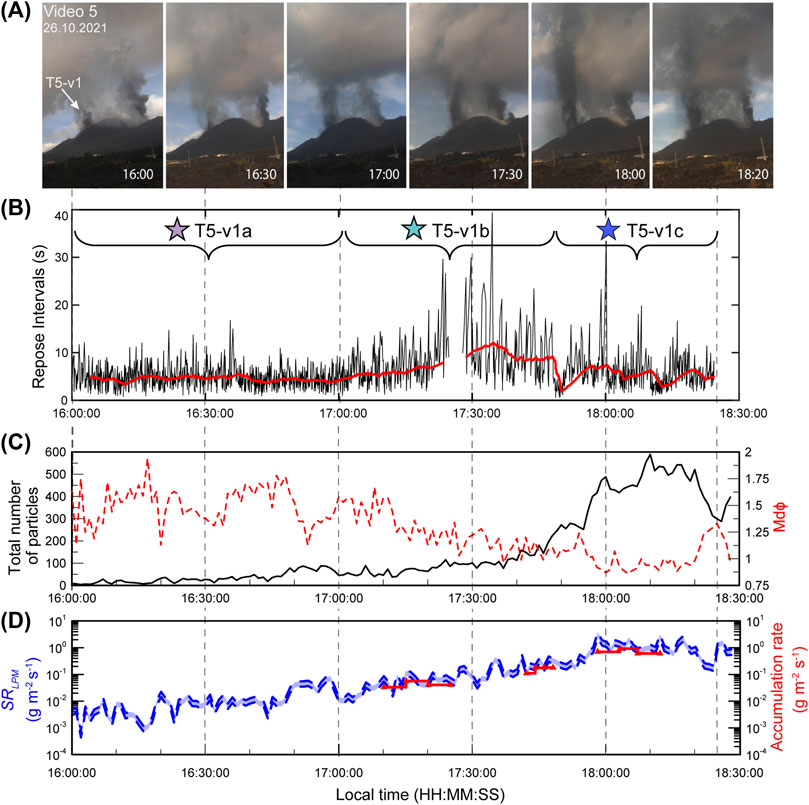
FIGURE 4. Comparison between repose interval analysis and Laser Precipitation Monitor records obtained on 26 October 2021. (A) Photographs of the active vents on 26 October 2021 between 16:00 and 18:20 LT taken at 30-min intervals. (B) Time series of the repose interval acquired from Supplementary Video S5 (details in Figure 3 and Supplementary Tables S1, S2); the stationarity test is indicated by the moving average (red line) from which three datasets have been selected (T5-v1a, T5-b1b, and T5-v1c pulsatory results in Figures 3F, G). (C) 1-min interval time series of the total number of particles (black line) and Mdϕ (dashed red line). (D) 1-min interval time series of the sedimentation rates SRLPM calculated considering a particle density between 1700 and 2700 kg m−3 (double blue dashed line); values of accumulation rate from trays located next to the disdrometer are also displayed with step lines and red triangles (see also Figure 5A).
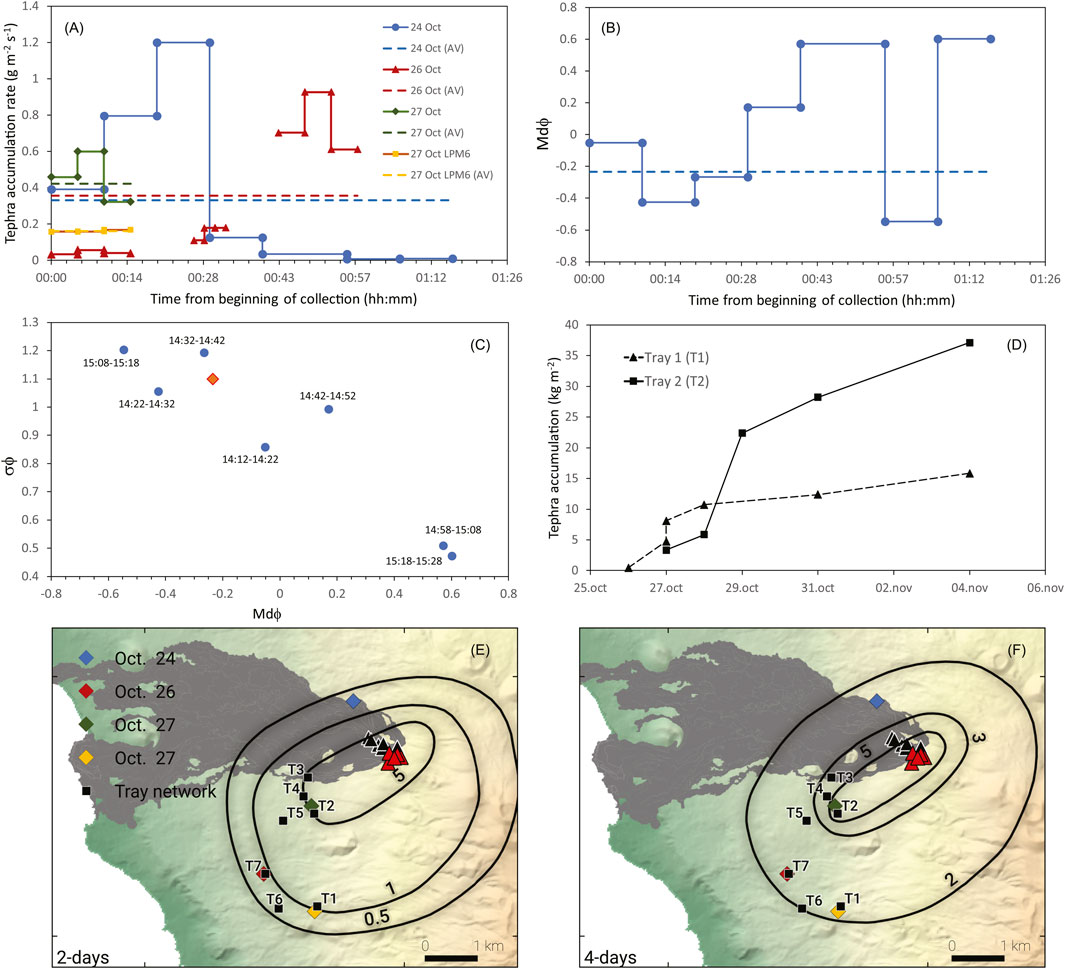
FIGURE 5. (A) Tephra accumulation rate at various locations (blue, red, green, and yellow diamonds in Figures 5E, F) and for different time intervals on 24 (14:12–15:28 LT, local time), 26 (17:10–18:12 LT), and 27 (11:14–11:29 and 14:34–14:49 LT) October 2021 (g m−2 s−1) (dashed lines indicate values of cumulative tray: AV, average accumulation rate). (B) Variation of Mdϕ in time and (C) σϕ versus Mdϕ for the tephra-fallout collection at Tacande on 24 October (blue line in Figure 5A and blue diamond in Figures 5E, F) (dashed line and orange square indicate values of the cumulative tray). (D) Ground accumulation in time (kg m−2) at two locations (T1 and T2 in Figures 5E, F). Isomass map (kg m−2) indicating tephra accumulation collected (E) between 44 and 51 h and normalized over 48 h (minimum collection time: 11:40 on 29 October; maximum collection time: 14:38 on 31 October) and (F) between 95 and 98 h and normalized over 96 h (minimum collection time: 12:31 on 31 October; maximum collection time: 14:46 on 4 November). See Table 2 for associated values of erupted mass and MER and Supplementary Table S3 for mass load values of Figures 5E, F.
Additional observations of the tephra accumulation rate and grainsize in trays were made between 24 October and 4 November 2021 for variable collection times. In particular, individual trays were used at specific locations to investigate variability over short time periods (between 2 and 10 min; Figures 5A–C), while a network of seven trays was used to investigate variability over 2–4 days (Figures 5D–F). On 24 October, a 78-minute-long fallout episode was sampled every 10 min with a single tray and showed a mean accumulation rate of 0.3 g m−2 s−1 and a peak accumulation rate of 1.2 g m−2 s−1 over 10 min that began 20 min after fallout onset (Figure 5A). During the same collection, values of Mdϕ varied between −0.6 and 0.6 ϕ, showing an inverse correlation with σϕ and no direct relation with sedimentation time (Figures 5B, C). Variation in accumulation rates has also been observed for shorter durations (e.g., 2–5 min on 26 and 27 October; Figure 5A).
Accumulation rates investigated using a network of seven trays between 29 and 31 October and between 31 October and 4 November correspond to the sedimentation of layers MU2 to MU5, which started on 15 ± 1 October and transitioned to MU6 on 2 ± 1 November (Figures 1, 2; Bonadonna et al., 2022). The large variation in accumulation rates due to pulsatory activity described previously is responsible for the breaks in tephra accumulation over medium durations (i.e., days), reaching maximum values of approximately 37 kg m−2 and 16 kg m−2 between 26 October and 4 November 2021, respectively, at two locations at distances between 1.9 km (tray T2) and 3.2 km (tray T1), SW of the vents (Figure 5D). Associated accumulation rates for the same period over 2 and 4 days are 0.02 and 0.06 g m−2s-1, respectively. Based on these accumulation rates, 0.7 × 10⁸ kg and 2.1 × 10⁹ kg were erupted between 29 and 31 October and between 31 October and 4 November, respectively (average calculation based on seven trays; Figures 5E, F; Table 2). The associated average MER of 0.4 × 10³ kg s−1 and 6.0 × 10³ kg s−1 (for 2 and 4 days, respectively) are on the same order of magnitude as the MER of the whole MU calculated from tephra blanket data (i.e., 2.7 × 10³ kg s−1; Bonadonna et al., 2022). The accumulation of 0.7 × 10⁸ kg between 29 and 31 October, which was converted into a volume of 4.9 × 10⁴ m3, corresponds to the final sedimentation period for the layers MU2 to MU5 (15 ± 1 October to 2 ± 1 November; Bonadonna et al., 2022). The accumulation of 2.1 × 10⁹ kg between 31 October and 4 November corresponds to a volume of 1.5 × 10⁶ m3 and includes the transition from MU5 to MU6. Interestingly, the volume of MU5 is 1.8 ± 0.4 × 10⁶ m3, while that of the whole MU, with a duration of 46 ± 2 days, is 7.8 ± 1.1 × 10⁶ m3 (Bonadonna et al., 2022). Even though the uncertainty on the erupted mass based only on seven trays located SW of the vents can be significant, these results suggest that the MER was not constant during the MU, with low values toward the end of MU2–MU5 and an increase with the transition from MU5 to MU6. In fact, the volume associated with the period between 29 and 31 October represents only 3% of the total volume erupted between 31 October and 4 November.
4.1.3 Particle sedimentation and aggregation
Various sedimentation features at the margins of plumes and at the base of the volcanic clouds were observed during the deposition of the MU (Figure 6). Close to the vents (at distances <1 km), coarse particles intermittently detached from the margin of the rising volcanic plume, forming discrete patches of sedimentation that took the form of distinct particle-rich descending columns (Figure 6A; Supplementary Videos S1, S4 in Supplementary Table S1). These proximal sedimentation features are here referred to as lapilli waves and are analogous to the clustering of particles described in the experiments of Penlou et al. (2023). Farther from the vents, ash fingers were observed (Figure 6B). Although similar to lapilli waves, ash fingers involve finer volcanic ash and are possibly formed by gravitational instabilities (Carazzo and Jellinek, 2012; 2013; Manzella et al., 2015; Fries et al., 2021). In addition, tephra sedimentation was affected by a combination of complex atmospheric, topographic, and thermal processes. As an example, Figure 6C shows how the volcanic plume on 24 October was elongated mainly toward the SW direction by strong trade winds; however, other directions of propagation were also observed as induced by land/sea breezes and orographic effects in combination with upward motions due to the thermic effects of lava flow, possibly impeding the sedimentation of the finest particles that were kept in suspension (Supplementary Video S2 in Supplementary Table S1).
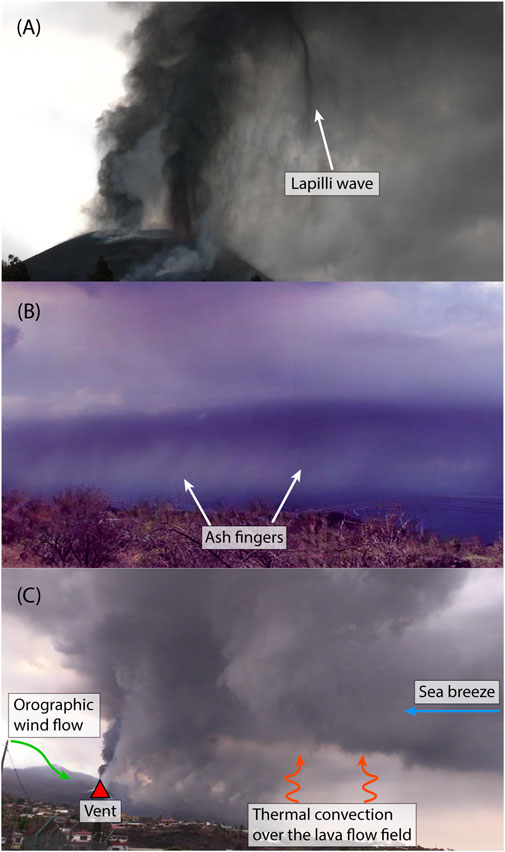
FIGURE 6. (A) Proximal lapilli wave descending close to the vent on 24 October 2021. (B) Distal ash fingers forming over the sea on 25 October 2021 (photograph taken from camera location C4; Figure 1). (C) Various atmospheric processes affecting the volcanic plume on 24 October 2021, including orographic wind flow, sea breeze, and thermal convection associated with the lava flow field (arrows indicate the direction of flows and do not point at specific elements in the picture). See also videos in Supplementary Material and Supplementary Table S1 for more details.
Atmospheric conditions also impacted particle–particle interactions and the formation of ash aggregates as shown by the in situ collection on adhesive tapes between 30 October and 16 November (Figure 7; Table 1). In case of dry conditions, tephra sedimentation was dominated by single, coarse-ash particles (between ∼100 and 500 μm; Table 1) with a light coating consisting of particles with sizes <10 μm (i.e., coated particles–particle clusters 2: PC2—according to the classification of Brown et al., 2012; Figures 7A, B). During rainy days, liquid pellets were also observed (i.e., accretionary pellets 3: AP3, according to the classification of Brown et al., 2012; Figure 7). The relative amount of the liquid fraction with respect to the solid phase in each aggregate depends on the cross-section of the droplet and the grainsize of solid particles scavenged during the fallout. Therefore, it is not surprising to observe a great variety of grainsizes and compositions even for AP3s collected at the same location and during the same eruptive event. Overall, 31% of observed AP3s were characterized by a few (<10) coarse-ash particles (e.g., 400–700 μm; Table 1) scavenged by droplets with a diameter >2000–2800 μm, containing a variable amount of fine ash (Figures 7C, D). In addition, 24% of observed AP3s consist of several (>10) coarse-ash particles (e.g., 467–1230 μm; Table 1) scavenged by smaller droplets (1000–2000 μm) (Figure 7E). The remaining 45% of observed AP3s show a large concentration of poorly sorted ash particles scavenged by relatively small droplets (i.e., <1000 μm) (Figure 7F). The size of the largest particles collected on the adhesive tape for locations at similar distances from the vents depends on various factors such as differences in the eruptive conditions, variability in the size of the rain droplet, or on the fact that ash scavenging from rain droplets can occur in different regions of the plume or volcanic cloud with respect to where the aggregates start to sediment (Table 1). Independent of the collection date and site, the smallest particles observed in the coating of PC2s and inside the AP3s were always <10 μm. Interestingly, some PC2s and AP3s revealed remarkable amounts of sulfur in the form of crystals and precipitates, and sodium chloride in the form of crystals, probably resulting from the mixing of the sea water evaporation with the volcanic plume or cloud (Figures 7G–L; Table 1). In our dataset, the presence of sulfur and sodium chloride is not correlated with the presence or absence of rain (Table 1).
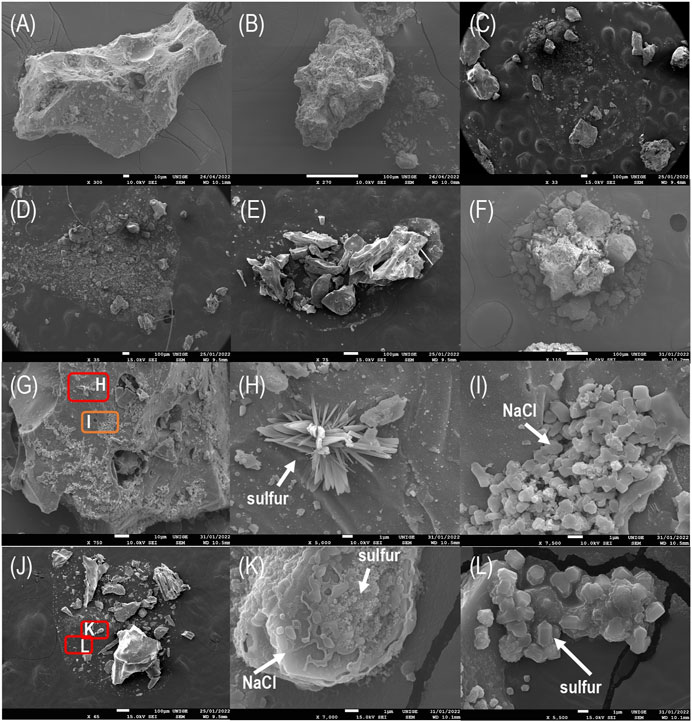
FIGURE 7. (A, B) PC2s collected on 30 October in the absence of rain; (C–E) AP3s collected on 16 November; (F) AP3 collected on 5 November; (G) AP3 collected on 5 November showing the presence of (H) sulfur (x10) and (I) sodium chloride (x10); (J) AP3 collected on 5 November showing the presence of (K) sulfur and sodium chloride (x100) and (L) sulfur (x100). See Figure 1 and Table 1 for more details.
4.2 Grainsize features of the Tajogaite whole tephra blanket
Grainsize distributions of selected layers (LU1, LU2, LU3, MU1, and MU5) of all units (LU, MU, and UU), and of the total tephra blanket are all unimodal (Figure 8), with Mdϕ values between −2.2 and 2.3 ϕ (4.6–0.2 mm) and sorting values (σϕ) between 0.4 and 1.6 (Figures 9A, B). While most layers (LU1, LU2, LU3, and MU5) show an increase in Mdϕ (i.e., decrease in grainsize) with distance from vents, the grainsize of MU1 does not vary significantly (Figure 8, Figure 9A, B). As an example, Mdϕ values of LU1 vary between −2.2 and 2.2 ϕ (4.6–0.2 mm) and between 0.7 and 5.3 km with distance from vents, while those of MU1 vary between 1.1 and 2.3 ϕ (0.5–0.2 mm) (Figures 9A, B and Supplementary Figure S4). There is a clear inverse relation between Mdϕ and σϕ of all units and the total tephra blanket, implying that Mdϕ values increase, while values of σϕ decrease with distance from vents (Figure 9B). This inverse relation was also observed in the case of sequential tray collection in time (Figure 5C), suggesting that fine-grained deposits are better sorted. As a general trend, the MU and LU are associated with the highest and the lowest Mdϕ values, respectively, at any given distance from vents, while both the UU and the total tephra blanket are associated with intermediate Mdϕ values (Figures 9A, B). In addition, the MU and LU are associated with the lowest and the highest σϕ values at any given distance from vents, while the UU and the total tephra blanket display intermediate σϕ values (Figures 9A, B). In fact, the LU is associated with the coarsest layers, while both MU and UU alternate between coarse and fine layers (Bonadonna et al., 2022). There is a clear increase in F1 values (wt% of particles <1 mm) with distance from vents, with values up to 100 wt% for MU1, while F2 values (wt% of particles <63 μm) are always below 6 wt% without a clear correlation with distance from vents (Figures 9C, D; Supplementary Figure S4). All results concerning grainsize are available in the Supplementary Data Sheet S1.
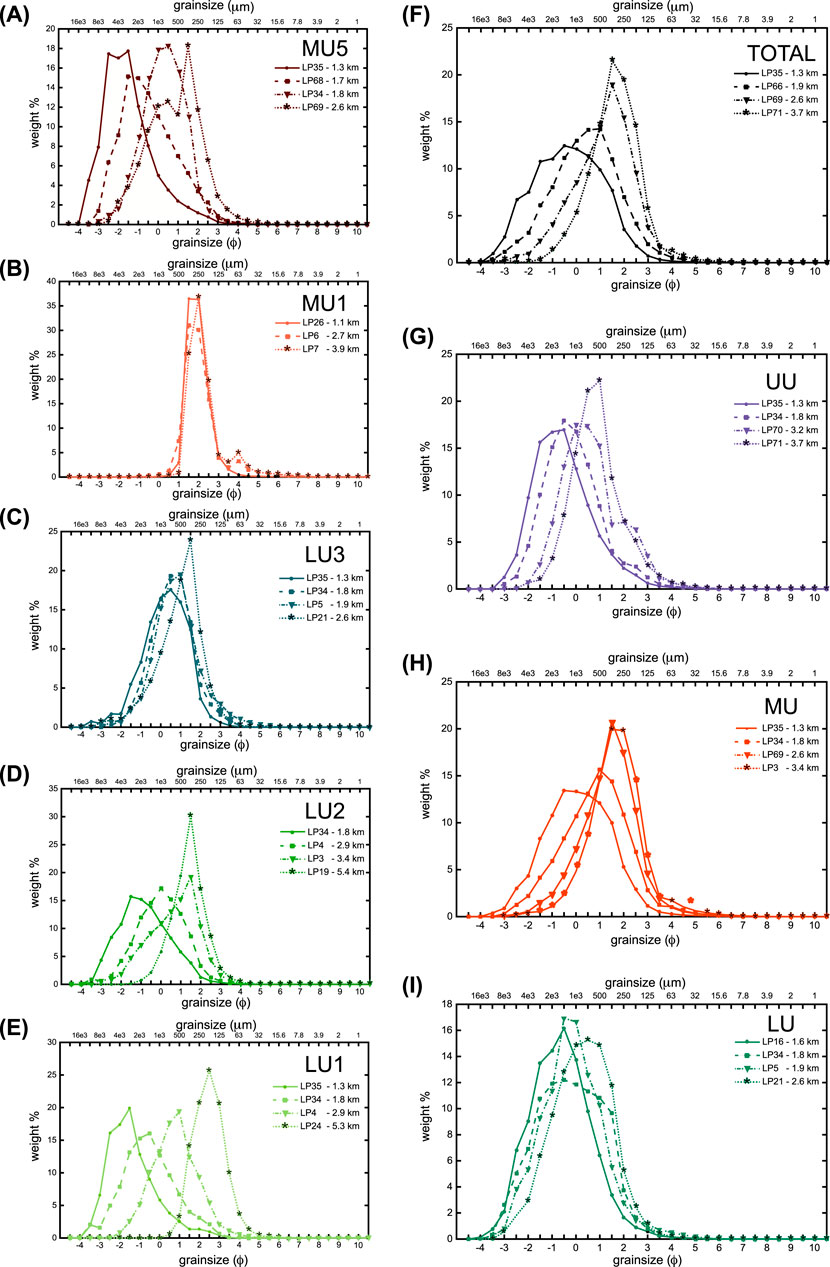
FIGURE 8. Grainsize distribution of selected individual layers (LU1, LU2, LU3, MU1, and MU5); all units (LU, MU, and UU); and the total tephra blanket for locations at increasing distance from vents on the SW dispersal axis (see Figure 1; Supplementary Figure S3 for locations).
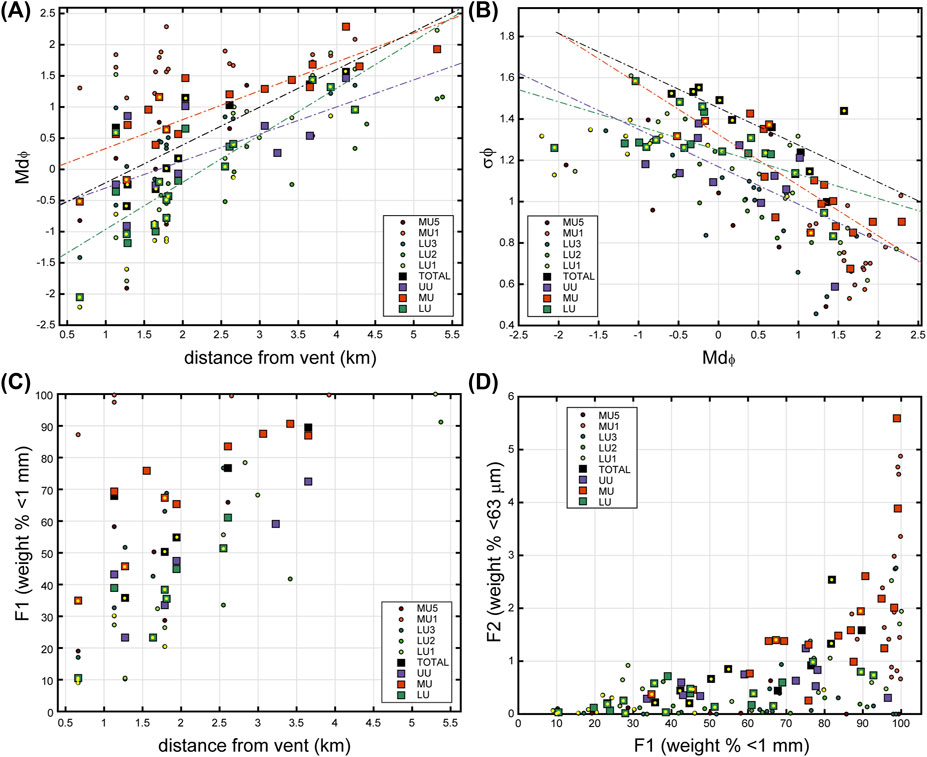
FIGURE 9. Plots of (A) Mdϕ versus distance from vents; (B) σϕ versus Mdϕ; (C) F1 (wt% <1 mm) versus distance from vents; and (D) F2 (wt% <63 μm) versus F1 of selected layers (colored circles: LU1, LU2, LU3, MU1, and MU5), all units (colored squares: LU, MU, and UU), and total deposit (black square). Symbols with a yellow dot indicate values of Mdϕ, σϕ, F1, and F2 that have been combined based on a weighted average of individual samples of sublayers, layers, and units. Plots of F2 and σϕ expressed as a function of the distance from vents are shown in Supplementary Figure S4.
Table 3 displays the grainsize features of TGSD for selected layers, all units, the total tephra blanket, and the tray network (Figures 5E, F). Mdϕ and σϕ indicate median and sorting values, respectively (Inmann, 1952). F1 and F2 indicate the weight fraction of particles with diameter < 1 mm and <63 μm, respectively. The number of samples used in the calculation of TGSD is also shown. See also Supplementary Tables S4, S5 and Supplementary Figures S5–S7 for TGSD and sensitivity analysis, respectively.
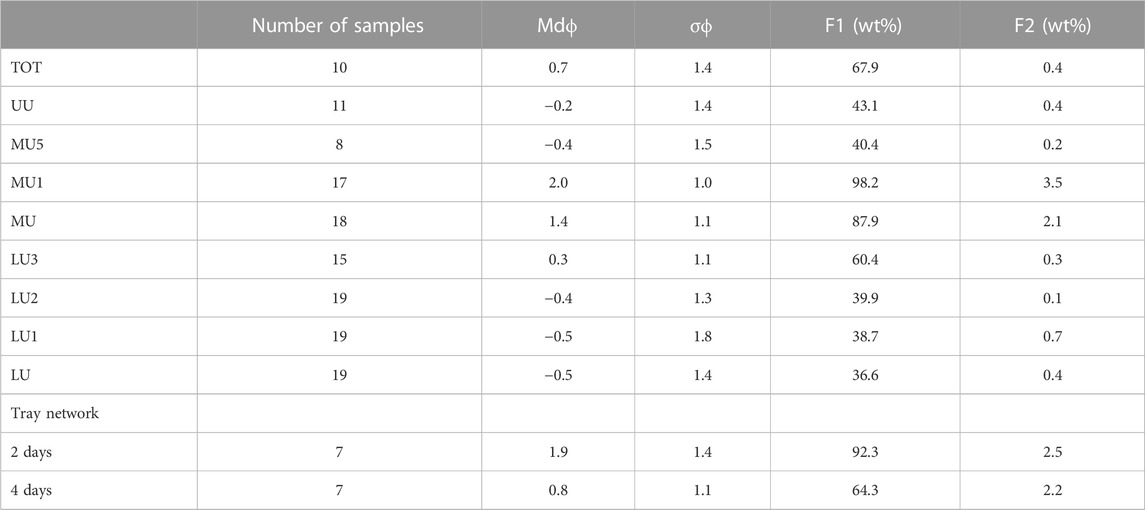
TABLE 3. Grainsize features of TGSD for selected layers, all units, the total tephra blanket, and the tray network (Figures 5E, F). Mdϕ and σϕ indicate median and sorting values, respectively (Inman, 1952). F1 and F2 indicate the weight fraction of particles with diameter < 1 mm and <63 μm, respectively. The number of samples used in the calculation of TGSD is also shown. See also Supplementary Tables S4, S5 and Supplementary Figures S5–S7 for TGSD and sensitivity analysis.
The TGSDs of all selected layers, units, and total tephra blanket are unimodal, with Mdϕ values between −0.5 ϕ and 2.0 ϕ (700–200 μm), for LU–LU1 and MU1, respectively, and σϕ values between 1.0 and 1.8, for MU1 and LU1, respectively (Figure 10; Table 3). It is interesting to note that the TGSD of the tephra accumulated in trays between 29 and 31 October (2 days in Table 3) and 31 October and 4 November (4 days in Table 3) is finer than that of MU5, which was deposited at the end of the period 14 October–3 November (0.8–1.9 ϕ versus −1.4 ϕ; Table 3). This can be explained by the differences in distances from vents for the tray network and the outcrops used to determine the TGSD of MU5, that were 1.7–3.7 km and 0.7–2.7 km, respectively (Figure 1, Figure 3).
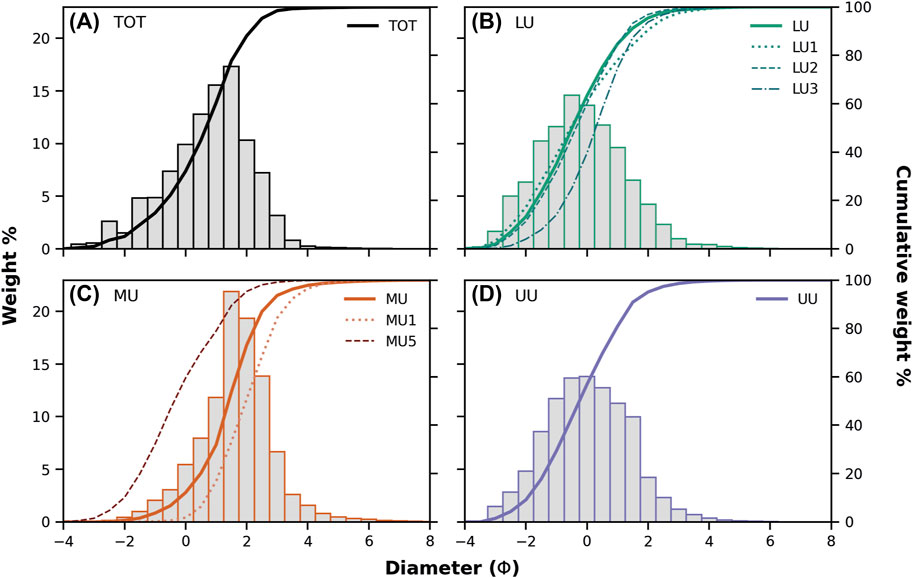
FIGURE 10. Total grainsize distribution for (A) total deposit, (B) Lower Unit, (C) Middle Unit, and (D) Upper Unit. The primary y-axis shows the weight percent contained within each gray bin for each unit. The secondary y-axis shows the TGSD in a cumulative form for all curves including selected layers for the LU and MU (LU1, LU2, LU3, MU1, and MU5). See Supplementary Tables S4, S5 for sensitivity analysis and wt% values, respectively.
The F1 values of the TGSD of the LU, UU, and selected layers (LU1, LU2, and MU5) are below 50 wt%, while the F1 values of LU3, MU, and MU1 are between 60 and 98 wt% (Table 3). The F2 values of the TGSD of most layers and units are <1 wt%, except for the MU and MU1 (Table 3). The F1 and F2 values of the cumulative Tajogaite tephra blanket are 67.9 wt% and 0.4 wt%, respectively (Table 3), confirming the very low amount of fine ash in the deposit. In agreement with the distribution of deposit thickness (Bonadonna et al., 2022), contours of Mdϕ maps of the total tephra blanket, units, and selected layers are symmetrical around the vents, with shapes varying from sub-circular to elongated in the NE–SW direction, except for MU1 (Figure 11).
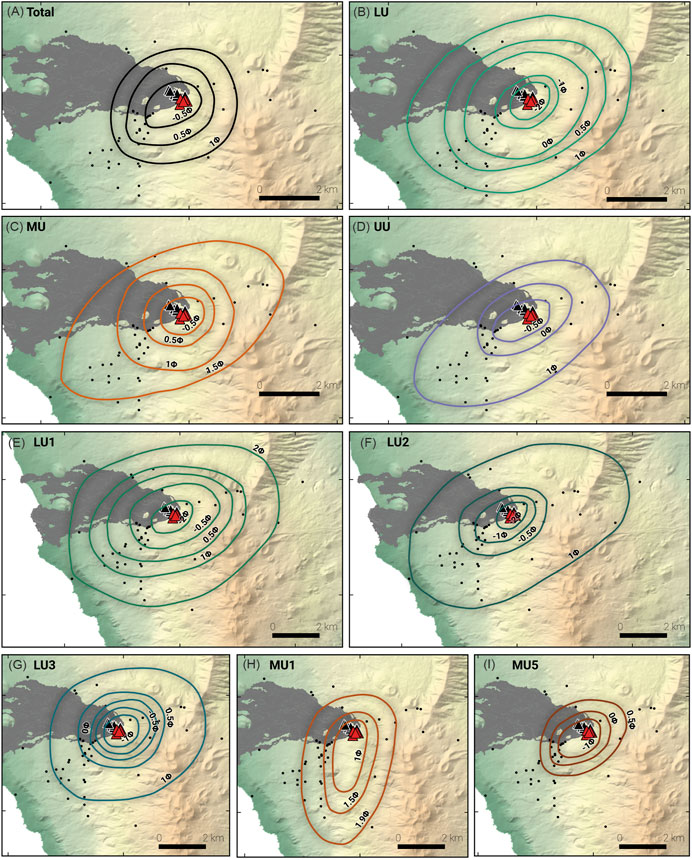
FIGURE 11. Mdϕ maps for (A) total tephra blanket, (B) Lower Unit, (C) Middle Unit, and (D) Upper Unit and layers (E) LU1, (F) LU2, (G) LU3, (H) MU1, and (I) MU5. See Figure 1 and Supplementary Data Sheet S1 for values of Mdϕ.
4.3 Plume height and eruption classification
Plume heights were determined based on the iso-Mdϕ maps shown in Figure 11 (Bonadonna and Costa, 2013; Freret-Lorgeril et al., 2022a). While Bonadonna and Costa (2013) identified a power-law equation to fit the λ values of the Weibull fit of Mdϕ versus distance from vent (λΜdϕ) and plume height of Plinian eruptions, Freret-Lorgeril et al. (2022a) found that a logarithmic trend better describes selected paroxysms at Etna (Figure 12A). The values of λΜdϕ of selected layers, all units, and the whole tephra blanket of the Tajogaite eruption are all <8 km, which is lower than the values of Plinian eruptions and of Etna paroxysms, that are all >9 km (see also Supplementary Figure S8 for Mdϕ trends with distance from vents from which λΜdϕ values were derived). Based on a new power-law fit that includes the Plinian eruptions mentioned in Bonadonna and Costa (2013) and the Etna paroxysms mentioned in Freret-Lorgeril et al. (2022a) (red trend line in Figure 12A), the associated plume heights of the Tajogaite eruption vary between 2 and 5 km above the vent level (a.v.l.). These values agree with the mean and maximum values of plume height, as reported by PEVOLCA (2.2 and 7.5 km a.v.l., respectively; dashed horizontal lines in Figure 12A). In particular, the Mdϕ-based plume height of the whole tephra blanket, which represents the time-averaged plume height of the overall Tajogaite eruption, is 2.9 km a.v.l., slightly higher than the mean value of the daily morning observations reported by PEVOLCA (2.2 km a.v.l.). The Mdϕ-based plume height of the LU, MU, and UU is also slightly higher than the mean value indicated in the PEVOLCA reports (4.2, 3.0, and 3.5 km a.v.l. versus 2.9, 2.3, and 1.2 km a.v.l., respectively). In order to compare Mdϕ-based plume heights and plume heights indicated in the PEVOLCA reports, the Tajogaite explosive vents with a height of ∼1000 m above the sea level are considered (Civico et al., 2022). Given that plume heights reported by PEVOLCA are only related to one observation in the morning of each day, some discrepancies with the Mdϕ-based plume heights, which represent the average over the whole period considered, are expected. It is also interesting to note how only the Mdϕ-based plume height of MU1 is below the mean plume height as derived from the PEVOLCA reports (Figure 12A). Overall, higher plumes were obtained for the LU than for the MU and UU, in agreement with observations (mean values of 2.9, 2.3, and 1.2 km a.v.l.; PEVOLCA reports), even though the highest observed plume (7.5 km a.v.l.) occurred within the UU, which marked the end of the eruption (Bonadonna et al., 2022).
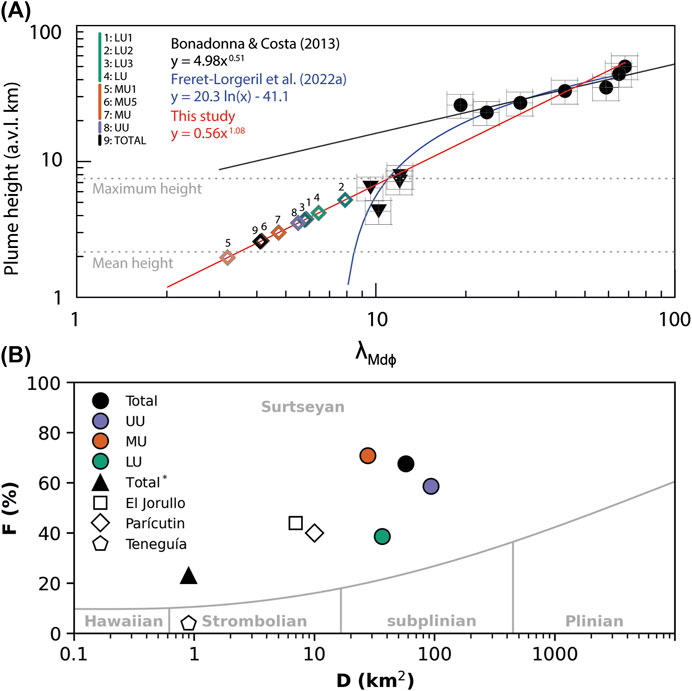
FIGURE 12. (A) Plot of plume height above vent (km) versus λMdϕ (km) for various Plinian eruptions (circles; Bonadonna and Costa, 2013) and Etna paroxysms (inverted triangles; Freret-Lorgeril et al., 2022a); three best-fit trends are shown to fit values of λMdϕ for the Tajogaite layers, units, and total tephra blanket (colored diamonds) (power-law: Bonadonna and Costa, 2013; logarithmic; Freret-Lorgeril et al., 2022a; power-law: this study). The power-law trend of this study (red line) is based on the Plinian eruptions and the Etna paroxysms. Horizontal dashed lines indicate the mean and maximum observed plume height of the Tajogaite eruption as indicated in the PEVOLCA reports (considering a vent height of 1000 m a.s.l; Civico et al., 2022) (see Supplementary Figure S8 for Mdϕ trends). (B) Classification plot of Walker (1973) for all units (LU, MU, and UU) and total deposit (colored circles) (adapted from Rowland et al., 2009). D and F represent the average of different values associated with different assumptions (i.e., choice of maximum thickness depending on the use of two or three segments on semi-log plots of deposit thickness versus the square root of the isopach area and different dispersal axis; Supplementary Table S6). D and F values of Paricutín 1943–1952, El Jorullo 1759–1774 (Mexico), and Teneguía 1971 (La Palma) are also shown for comparison (white symbols; data from Rowland et al. (2009); Walker (1973)). For a better comparison with the values of El Jorullo, the black triangle (Total*) represents the values of D and F for the Tajogaite eruption considering the maximum thickness of the cone (187 m; Civico et al., 2002) instead of the maximum thickness of the tephra blanket (derived from plots of deposit thickness versus the square root of the isopach area) (see text for more details).
Grainsize (F) and dispersal (D) features have been used for eruption classification of the LU, MU, and UU and the total Tajogaite tephra blanket (Walker, 1973) (Figure 12B). Given that different values of maximum thickness are obtained depending on the number of segments identified in a semi-log plot of thickness versus the square root of the isopach area, and that two dispersal axes are identified in the isopach maps (Bonadonna et al., 2022), multiple values of F and D could be identified (Supplementary Table S6). Nonetheless, F values associated with locations NE and SW of the vent converge for the total tephra blanket and most units. Values of F and D have been averaged to identify the eruptive style in the classification plot of Walker (1973). Violent Strombolian eruptions such as Parícutin 1943–1952 and El Jorullo 1759–1774 in Mexico, typically plot between Surtseyan and Strombolian eruptions because they have similar dispersal (similar D) but higher ash content (higher F) (Walker, 1973; Rowland et al., 2009). Interestingly, the LU, MU, and UU and the whole tephra blanket plot on the right of the eruption of Parícutin and El Jorullo, above the field of subPlinian eruptions, having D between 10 and 100 km2, but F between 30 and 80 wt%. In particular, the total tephra blanket has values of D and F of ∼60 km2 and ∼70 wt%, respectively. It is important to note that F and D in the case of El Jorullo were determined based on the height of the cone and not on the maximum thickness of the tephra blanket as derived from semi-log plots of thickness versus the square root of the isopach area (Rowland et al., 2009). In case the height of the Tajogaite cone is considered (187 m; Civico et al., 2022), the whole eruption plots just above the Strombolian field (black triangle in Figure 12B). As a term of comparison, the 1971 Teneguía eruption of Cumbre Vieja (La Palma) is also shown plotting in the Strombolian field based on a maximum thickness as calculated from a semi-log plot of thickness versus distance from the vent (Walker, 1973).
5 Discussion
5.1 Tephra sedimentation and grainsize features of the Tajogaite eruption
The tephra blanket associated with the Tajogaite eruption is mostly symmetrical with respect to the eruptive fissure, with a prevailing elongation in the NE–SW direction due to the interplay between strong trade winds, that blow to the SW; weaker winds, that can also blow in other directions; and the land/sea breezes that act daily on tephra dispersal (Bonadonna et al., 2022). The deposit thickness distribution agrees with the deposit grainsize distribution represented by the values of Mdϕ (Figure 11). Similarly, all values of the fragmentation index (F) are primarily consistent SW and NE from the vents for a given value of dispersal index (D) (Supplementary Table S6). Only the F values of the UU are slightly different SW and NE from the vents since the associated blanket is more elongated toward SW with respect to all other units (Bonadonna et al., 2002).
The pulsatory explosive activity of the Tajogaite eruption, combined with variable eruptive styles in time and from simultaneous vents, resulted in variable sedimentation and ground accumulation rates and grainsize features at the timescale of minutes to hours (Figure 4, Figure 5). Overall, lack of fine ash (F2<6 wt% for all layers and units at all outcrops; Figure 9, Supplementary Figure S4 and Supplementary Data Sheet S1) resulted in limited particle aggregation and gravitational instabilities. Therefore, grainsize distributions of individual outcrops are unimodal for individual layers, for individual units, and for the total tephra blanket (Figure 8). TGSD is also unimodal for all selected individual layers, for all units, and for the total tephra blanket (Figure 10). The lack of correlation of F2 with distance from vents is mostly due to the overall small amount of fine ash that is, nevertheless, associated with a wide dispersal thanks to particle aggregation and ash fingers (Supplementary Figure S4). It is important to consider here that, given the small fraction of fine ash observed, we expect the TGSD to be very similar to the grainsize of the whole material erupted, even though its estimation is only based on field observations and does not include satellite retrievals (Freret-Lorgeril et al., 2022a). However, given the small size of the island, it is not excluded that a significant fraction of fine ash has been sedimented in the ocean and, therefore, it is not included in the TGSD presented here.
Even though tephra dispersal did not vary significantly over time, tephra during the first 3 weeks (LU) and during the last 2 weeks (UU) of the Tajogaite eruption was coarser than during the intermediate phase (MU) (Table 3), suggesting fluctuations in eruption intensity. In fact, in the proximal area, while lapilli-rich layers characterize the LU and UU, the MU is associated with the emplacement of ash-rich layers (e.g., MU1) intercalated with sporadic lapilli-rich layers (e.g., MU5). This is reflected in the Mdϕ values of the LU, MU, and UU (−0.5, 1.4, and −0.2 ϕ, respectively) associated with average D values of 36, 28, and 93 km2, respectively (Supplementary Table S6). It is important to consider that the D value of the UU is larger because it is associated with the final climactic phase of the eruption. The two highest plumes (one up to 5.0 km and the other up to 7.5 km a.v.l.) occurred in the last 2 days, also favored by weak winds, even though they are not included in the morning observations reported by PEVOLCA. This is also evidenced by values of plume heights derived from the Mdϕ trend of the UU with distance from vents, which vary between 3 and 4 km a.v.l. (Figure 12A).
Regardless of the more mafic composition (basanite–alkali basalt), the Tajogaite grainsize features are similar to those of the 1943–1952 Parícutin eruption (basaltic andesite to andesite) and of the 1759–1774 El Jorullo eruption (basaltic to basaltic andesite), both classified as violent Strombolian (Pioli et al., 2008; Rowland et al., 2009). The proximal deposit of the Parícutin eruption (1–3 km from the vent) was characterized by coarse-ash to lapilli layers with Mdϕ of 0–1 ϕ, intercalated by ash-rich layers with Mdϕ of 1-2 ϕ (Pioli et al., 2008). The proximal deposit (0.5–4 km from the vent) of the El Jorullo eruption was characterized by Mdϕ of 0.8–3.5 ϕ (Rowland et al., 2009). Within a similar distance range (0.7–5.3 km), the ash-rich layer MU1 is associated with Mdϕ between 1.1 and 2.3 ϕ, while the lapilli to coarse-ash layers (e.g., LU1 and MU5) have Mdϕ between −2.2 and 2.2 ϕ and −1.9 to 1.4 ϕ, respectively (Figure 9 and Supplementary Data Sheet S1). Nonetheless, two main differences with respect to Parícutin and El Jorullo eruptions can be observed. First, the Tajogaite eruption is associated with a broader range of grainsize and with the presence of coarser layers. Second, regardless of similar values of F1 (10–100 wt%), the fine-ash content (F2) of the Tajogaite eruption is significantly lower than that of Parícutin and El Jorullo eruptions. In fact, while F2 values for the Tajogaite eruption are always below 6 wt%, F2 values of Parícutin and El Jorullo are up to 40 wt% and 60 wt%, respectively (Pioli et al., 2008; Rowland et al., 2009). Finally, Mdϕ values of the TGSD of Tajogaite layers, units, and total tephra blanket range between −0.5 and 2.0 ϕ (Table 3), in agreement with the typical range associated with violent Strombolian to subPlinian basaltic eruptions (e.g., −3.6 to 2.2 ϕ; Rust and Cashman, 2011; Pioli et al., 2019). In contrast, the median diameter of Strombolian eruptions is typically coarser, such as that of Stromboli 2012 (−7.0 ϕ) and Kīlauea Iki 1959 (−8.8 ϕ), which, however, also include blocks and bombs that are not included in the TGSD of Tajogaite as determined in this paper (Parfitt, 1998; Pioli and Harris, 2019).
5.2 Hybrid eruptive style and eruption classification
The hybrid style that includes the simultaneous emission of lava and tephra is characteristic of low-viscosity (mafic) magmas associated with specific geometry and dynamics, i.e., conduit bifurcation and gas segregation during magma ascent. In particular, gas segregation at a moderate cumulative MER (103–105 kg s-1) results in the flow of degassed magma through lateral dikes and the fragmentation of gas-rich magma in vertical conduits typical of violent Strombolian eruptions. Higher cumulative MER may result in subPlinian eruptions, while lower cumulative MER is associated with Strombolian, Hawaiian, or purely effusive eruptions (Pioli et al., 2008; 2009). Simultaneous emission of lava flows and generation of tephra resulting from conduit bifurcation has also been observed during Strombolian eruptions with the cumulative MER <103 kg/s, but without the development of an extensive tephra blanket (Pioli et al., 2022). As mentioned previously, the cumulative MER is the MER associated with all products (i.e., tephra blanket, tephra cone, and lava flows when present). Even though these observations have been derived for volatile-rich magma (e.g., 1.3–4.2 wt% of H2O for Paricutín eruption) emitted from a single cone (Pioli et al., 2008; 2009), they also well-explain the dynamics of the Tajogaite fissural eruption characterized by values of the cumulative MER between ∼5-8 × 10⁴ kg s-1 and water contents between 1.3 and 2.2 wt% (based on melt inclusions hosted in olivine crystals; Burton et al., 2022; Burton et al. submitted).
While complex eruptive styles at newly formed basaltic cones, including hybrid activity or rapidly changing eruptive dynamics, have most frequently been associated with increased fragmentation efficiency due to gas segregation, high magma viscosity, syn-eruptive crystallization, and initial high-water content (Pioli et al., 2008; 2009), ash generation in cone-forming eruptions has sometimes been associated with phreatomagmatic activity (e.g., cones in Mexico and Libya; Martin and Nemeth, 2006). Indeed, rapid changes in eruptive styles (i.e., from Hawaiian to Strombolian to violent Strombolian phases) at monogenetic cones have also been attributed to relatively high magma flux and fragmentation efficiency modulated by magma contact with external aquifers (Di Traglia et al., 2009). The low lithic content, lack of evidence of magma–water interaction on ash particles, and the absence of accretionary lapilli and pyroclastic density currents suggest, however, that the production of ash during the Tajogaite eruption was likely related to rapid gas segregation combined with rapid magma ascent (D’Auria et al., 2022), that resulted in relatively efficient magma fragmentation. This is also supported by the observation that a high magma ascent rate has the potential to modulate the explosivity of basaltic magmas more than volatile content (Parfitt and Wilson, 1995; Mangan and Cashman, 1996).
During the Tajogaite eruption, most of the NW lateral (low-altitude) vents were associated with lava emission, while most of the SE (topographically higher) vents produced various, often simultaneous, explosive pulsatory styles, including lava fountains, Strombolian and violent Strombolian explosions, and puffing activity (passive degassing) indicating variable gas fluxes (Bonadonna et al., 2022; Carracedo et al., 2022; Romero et al., 2022). This eruptive unsteadiness, associated with simultaneous emission of lava flows and ash-rich plumes >2 km, is characteristic of violent Strombolian activity (Pioli et al., 2008). In fact, an increase in gas flux could cause the transition from frequent and irregular puffing activity (bubbly regime), to frequent and regular rise of large gas bubbles passing through slower-rising magma (slug flow) associated with Strombolian explosions, to less frequent and unstable (irregular) churn flows associated with violent Strombolian eruptions, to nearly continuous annular flow associated with lava fountains (Pioli et al., 2008; Rowland et al., 2009; Spina et al., 2019). Sporadically, pulsating lava fountains can also be driven by the irregular rise of single slugs, while steady lava fountains reflect a transition to annular flow where the gas occupies most of the conduit (Seyfried and Freundt, 2000).
The higher content of fine ash in the MU could be related either to an increase in gas flux, that enhanced the fragmentation efficiency, or to lower intensity plumes. The lower explosive phase MER of the MU (2.9 × 10³ kg s-1) with respect to the LU (4.2 × 10³ kg s-1) and UU (3.5 × 10³ kg s-1) suggests a decrease in gas flux and/or volatile budget (Bonadonna et al., 2022). The coarser character of the LU, in contrast to the MU and UU (Table 3), might also suggest that the gas segregation became more efficient after the first 3 weeks of the eruption when the Tajogaite cone had mostly formed, possibly reaching an optimal length of the vertical conduit for magma fragmentation (Pioli et al., 2008). It is important to note that the cone had reached 60% of the final height at the end of the first week, i.e., end of LU1 (height of 110 m above the pre-eruptive surface versus 187 m at the end of the eruption; Civico et al., 2022). LU1 and MU2 to MU5 are also associated with relatively high seismic tremor and low lava emission rates, while LU2 is associated with low seismic rates and high lava emission rates (Bonadonna et al., 2022). The fragmentation efficiency of the Tajogaite eruption seems, therefore, to have been modulated by the evolution in time and complex interplay among gas flux, volatile content, conduit geometry, and magma feeding rate. Further compositional, textural, and componentry analyses are required to better interpret how magma properties modulated eruptive dynamics over time.
Viscosity variation might also play a significant role in the diversification of eruptive styles, being a key parameter of magma rheology and degassing processes. Long-lasting hybrid eruptions are likely associated with significant viscosity variations as a result of different rates of disequilibrium crystallization and cooling (Castro and Feisel, 2022; Di Fiore et al., 2023). For the pulsatory activity analysis of the eruptive period between 24 and 29 October (Figure 3), magma viscosity between 70 and 2788 Pa s was estimated with fixed values of temperature, groundmass composition, crystallinity, and minimum and maximum water content of tephra collected in October. Figure 3F shows that in the absence of a constraint on viscosity for each eruptive style, all analyzed events plot within a narrow range of tmedian values, between the observations of Strombolian and lava fountaining activity at Etna volcano and violent Strombolian activity at Cerro Negro (Dominguez et al., 2016). In particular, our analysis highlights the temporal evolution of eruptive style that can rapidly shift at a single vent from Strombolian to violent Strombolian to lava fountain activity, transitioning, therefore, from slug to churn to annular flow within 2 h (black arrows in dataset T5; Figure 3G). These changes in the conduit dynamics can also be explained by the modifications in the internal structure of the conduit and vents during the eruption (Muñoz et al., 2022). Variable eruptive styles have also been observed at the same time at different vents, indicating variable gas segregation and resulting fluxes in different vertical conduits (e.g., Strombolian and violent Strombolian explosions, violent Strombolian explosions and ash-poor gas puffing; e.g., datasets T3 and T8 for vent areas 1, 2, and 3; Figure 3G). It is also interesting to note how ash-poor gas puffing can be as irregular and sustained as lava fountains (short repose times), plotting together with a lava fountain at Etna volcano (T8-v3 in Figure 3G).
The classification of the explosive phase at a short temporal scale (<3 h; Figure 3) highlights rapid shifts in eruptive style at single vents and co-existing different eruptive styles at multiple vents, which cannot be captured by the analysis of the associated tephra blanket. In fact, the overall wide dispersal of the tephra blankets and the overall high content in volcanic ash, represented by relatively high values of F and D in the classification plot of Walker (1973), suggest the dominating violent Strombolian style (Figure 12B). This eruptive style is associated with both F and D values as derived from the maximum thickness of the tephra blanket and F and D values as derived from the maximum height of the cone following the approach of Rowland et al. (2009). We consider the maximum thickness as derived from the tephra blanket to be most appropriate for the classification according to Walker (1973), even though the Tajogaite data plots above the subPlinian eruptions instead of plotting above the Strombolian eruptions. In fact, the tephra blanket and the cone are associated with different sedimentation dynamics, and, therefore, in agreement with Walker (1973), we consider the values of maximum thickness derived from the thickness versus distance plots of the tephra blanket as being more representative of tephra dispersal than the overall thickness of the cone.
Regardless of the rapid gas segregation that resulted in the simultaneous emission of fluid lava and ash-rich plumes, the Tajogaite eruption was associated with an efficient, decoupled magma–gas system, with the explosive phase MER consistently lower than the lava emission rate and an overall lava volume >70% of the total erupted material (lava + cone + tephra blanket; Bonadonna et al., 2022; Plank et al., 2023). The higher fraction of lava than that of tephra is also likely related to the lava emission through a fissure as opposed to a central cone (Pioli et al., 2008; 2009). These observations confirm the need to not only include the characterization of all products of hybrid eruptions for interpretation of eruption dynamics (Bonadonna et al., 2016) but also to use different classification strategies that can capture eruptive styles at different temporal scales. In fact, while the overall explosive activity can be described as violent Strombolian with rapid shifts and co-existence of multiple eruptive styles, the Tajogaite eruption was fundamentally effusive (Bonadonna et al., 2022). These complex eruptive dynamics have significant implications for the management of volcanic risk and volcanic crisis.
5.3 Implications for risk and crisis management
The Tajogaite eruption has demonstrated how the pre-eruptive period can be shorter than expected, with the effusive and explosive phases starting almost simultaneously when the alert level was still yellow (D’Auria et al., 2022). Decision makers and risk managers should, therefore, be prepared for sudden and unexpected changes in the magmatic system that can lead to an eruption sooner than constant trends would predict. In addition, eruption classification can generate false perceptions of risk associated with volcanoes that mainly produce lava flows and that are not considered dangerous for the surrounding communities. Indeed, the previous eruption of Cumbre Vieja ridge (the 1971 Teneguía eruption) had a Strombolian style with limited overall impact on the island, also due to the vent location, far from inhabited centers and infrastructure (Walker, 1973; Barker et al., 2015). However, the Tajogaite event demonstrated the potential of hybrid eruptions to be associated with hazardous explosive activity in case of efficient gas segregation and rapid magma ascent, with generation of ash-rich plumes up to 7.5 km a.v.l. and widespread deposition of tephra. This explosive potential, in combination with rapid and fluid lava flows, typical of alkaline mafic magmas, makes these hybrid eruptions especially challenging in terms of crisis management and risk reduction when close to inhabited areas, such as the case of La Palma (Martí et al., 2022). On one side, fast and fluid lava flows can rapidly inundate populated areas, destroying critical infrastructure and residential buildings as well as endangering human lives and requiring an immediate response (Carracedo et al., 2001). On the other side, prolonged tephra accumulation requires systematic clean-up operations to avoid the collapse of buildings and disruption of critical infrastructure. Volcanic earthquakes occurring before and during eruptions could also cause damage to buildings and infrastructure, trigger landslides, and even cause loss of life, especially in the case of monogenetic volcanism when the magma needs to create a new conduit system (Pomonis et al., 1999; D’Auria et al., 2022). In addition, the unsteadiness and variety of the explosive activity associated with variable gas fluxes complicate the real-time ash dispersal forecasting at a local scale, which is designed for the ash dispersal of sustained explosive eruptions in the far field (Bonadonna et al., 2002). Finally, the co-existence of effusive and explosive activity requires the assessment and management of compound hazards (e.g., earthquakes, lava flows, tephra ground accumulation, atmospheric tephra dispersal, and gas dispersal) and cascading impacts well beyond the area affected by the direct damage (e.g., loss of electricity, disruption to transportation, repercussion on tourism and other economic sectors, and interruption of critical services such as schools).
Depending on deposit grainsize, soil, and climatic conditions, widespread tephra blankets can also be associated with long-lasting secondary hazards such as remobilization by wind (e.g., ash storms; Wilson et al., 2011; Dominguez et al., 2020) and water (e.g., lahars; Zuccaro and De Gregorio, 2013; Thouret et al., 2020). Syn-eruptive ash remobilization by wind was observed and contributed to repeated confinements of communities (Carracedo et al., 2022), which, however, given the small fine-ash component, is not expected to persist over the years. Violent Strombolian eruptions have also already been shown to deposit enough pyroclastic material to trigger deadly and impactful lahars (e.g., Arrighi et al., 2001; Favalli et al., 2006). Nonetheless, it is interesting to note that lapilli and coarse-ash-rich pyroclastic deposits, such as those of the Tajogaite eruption, are more likely to be remobilized by water only many years after the eruption (White et al., 1997; Di Traglia, 2020).
Additional complexities associated with monogenetic, hybrid eruptions include the temporal component, with eruption durations ranging from a few weeks to several years (Luhr and Simkin, 1993; Carracedo et al., 2001; Rowland et al., 2009; Martí et al., 2022), and the forecasting of the opening of the next vent or vent fissure, which controls the associated impacted area (Lindsay et al., 2010; Tomsen et al., 2014; Marrero et al., 2019; Martí et al., 2022; Nieto Torres et al., 2022). A variety of response strategies are, therefore, necessary to mitigate the potential impact of both effusive and explosive processes affecting different areas at different times depending on topographic features (for flow inundation); plumbing system (for gas source); and wind patterns (for both tephra and gas dispersal). Dedicated approaches are also needed to address the combination of effusive and explosive products that can be associated with complex damage patterns at different scales (e.g., impact of lava inundation combined with tephra load on roofs and impact of tephra load on structures already affected by gas corrosion). Both long-term risk assessment and crisis management of hybrid eruptions require, therefore, the development of ad hoc strategies that could not just be the combination of strategies developed for purely effusive and purely explosive eruptions, but also address the complex combination of multiple products at different temporal and spatial scales.
6 Conclusion
Some of the complexities of monogenetic cone-forming eruptions could be unveiled thanks to the combination of syn-eruptive and post-eruptive multi-disciplinary observations and sampling of the 2021 Tajogaite event (La Palma). Additionally, the detailed analysis of individual layers and units provides an exceptional dataset of grainsize parameters of long-lasting hybrid eruptions. In particular,
1) The pulsatory activity analyzed between 24 and 29 October (during the sedimentation of the MU) shows short-time scale variations of eruptive style (<few hours) including ash-poor gas puffing, Strombolian, violent Strombolian, and lava fountaining at individual vents, and the simultaneous occurrence of different styles at multiple vents. This analysis shows how the rapid variation of gas flux modulates the transition from bubbly (puffing activity) to slug (Strombolian) to churn (violent Strombolian) to annular (lava fountains) flows. Similar activity is expected to have also occurred during the LU and UU that are associated with similar plume height and MER values.
2) Regardless of the short-time variations in eruptive style (at individual vents) and space (at multiple simultaneously active vents), the overall dominating eruptive style recorded by the tephra blanket is violent Strombolian for the three units and the whole Tajogaite eruption as shown by the classification plot of Walker (1973).
3) The pulsatory activity combined with variable eruptive styles in time at individual vents and at simultaneous multiple vents results in short-time significant variations of tephra sedimentation rates, ground accumulation, and grainsize, as demonstrated by the combined use of high-definition videos, LPM data, and tephra collection in trays.
4) Ground accumulation is affected by different sedimentation features at different distances from vents (e.g., lapilli waves in the very proximal area and ash fingers in medial and distal areas) and particle aggregation, especially under rainy conditions (mostly coated particles and liquid pellets). As a result, the overall small fraction of fine ash (F2) does not correlate with the distance from vents, while the fraction of particles <1 mm (F1) increases with the distance from vents for all selected layers and units. Aggregation of the Tajogaite tephra is affected both by atmospheric conditions (rain), precipitation of volatiles (mostly sulfur), and precipitation of salt (sodium chloride). Finally, tephra sedimentation is also affected by the thermal convection of the lava flow, orographic wind flow, and the daily variation of sea/land breeze.
5) Regardless of the complex sedimentation patterns, Mdϕ maps of selected layers, units, and the total tephra blanket show the same NE–SW dispersal of associated isopach maps and are mostly symmetrical NE and SW from vents.
6) Grainsize distributions of 154 samples collected at outcrops between 0.7 and 5.3 km from vents are unimodal, with Mdϕ increasing between −2.2 and 2.3 ϕ (4.6–0.2 mm) and sorting decreasing between 1.6 and 0.4; values of Mdϕ and sorting are inversely correlated, suggesting that the finer the samples, the better the sorting.
7) The LU represents the coarsest tephra blanket, followed by the UU and the MU with values of Mdϕ of the associated TGSD of −0.5, −0.2, and 1.1 ϕ, respectively; the Mdϕ value of the TGSD of the whole Tajogaite eruption is 0.7 ϕ.
8) Mdϕ-based plume heights of lower, middle, and upper units are 4.2, 3.0, and 3.5 km a.v.l., respectively, which are slightly higher than the mean values derived from the morning observations reported by PEVOLCA (2.9, 2.3, and 1.2 km a.v.l., respectively).
9) Regardless of the main effusive characteristics, the 2021 Tajogaite event has demonstrated the potential of hybrid eruptions to generate widespread tephra blankets and volcanic plumes up to 7.5 km a.v.l. The combined emission of effusive (lava) and explosive (tephra) products can broadly impact the surrounding inhabited areas at different spatial and temporal scales and hence require the development of ad hoc strategies for both long-term risk assessment and crisis management of long-lasting hybrid eruptions.
Data availability statement
The original contributions presented in the study are included in the article/Supplementary Material; further inquiries can be directed to the corresponding author.
Author contributions
CB and MP have organized the field campaigns, acquired the funding, and planned the work. CB, MP, LD, VF-L, ER, AF, SB, MV, JL, CP, MPR-H, LSDM, PG, AM-L, and JER have participated in the field work and contributed to data collection. CB, LD, VF-L, ER, AF, SB, MV, JL, VZ, CP, and MPR-H have contributed to data processing. CB, MP, LD, VF-L, ER, AF, SB, and MV have produced the original draft of the paper and designed the tables and figures. All authors have participated in overall discussions and editing of the manuscript.
Funding
Research activities were supported by the Swiss National Science Foundation (Grant #200020_188757) and by the projects (i) VOLRISKMAC (MAC/3.5b/124) and (ii) VOLRISKMAC II (MAC2/3.5b/328), financed by the Program INTERREG VA Spain-Portugal MAC 2014–2020 of the European Commission; (iii) Cumbre Vieja Emergencia, financed by the Science and Innovation Ministry, Spanish Government; and (iv) Tfassistance, financed by the Cabildo Insular de Tenerife. JER was partially financed through NSFGEONERC-DisEqm (NERC Reference: NE/N018575/1), V-PLUS projects, while VZ was financed by MAGAT project (Ref. CIRCNA/OCT/2016/2019), funded by the Fundação para a Ciência e Tecnologia (FCT).
Acknowledgments
The authors are grateful to the Instituto Volcanológico de Canarias (INVOLCAN) for the logistic support that was key to the development of this work with a special thanks to Matt Pankhurst. M-NG and FDT are acknowledged for insightful comments and Carmen Solana and Valerio Acocella are thanked for efficient editorial work.
Conflict of interest
The authors declare that the research was conducted in the absence of any commercial or financial relationships that could be construed as a potential conflict of interest.
Publisher’s note
All claims expressed in this article are solely those of the authors and do not necessarily represent those of their affiliated organizations, or those of the publisher, the editors, and the reviewers. Any product that may be evaluated in this article, or claim that may be made by its manufacturer, is not guaranteed or endorsed by the publisher.
Supplementary material
The Supplementary Material for this article can be found online at: https://www.frontiersin.org/articles/10.3389/feart.2023.1166073/full#supplementary-material
References
Ancochea, E., Hernán, F., Cendrero, A., Cantagrel, J. M., Fúster, J., Ibarrola, E., et al. (1994). Constructive and destructive episodes in the building of a young oceanic island, La Palma, Canary Islands, and Genesis of the Caldera de Taburiente. J. Volcanol. Geotherm. Res. 60 (3–4), 243–262. doi:10.1016/0377-0273(94)90054-x
Andronico, D., Del Bello, E., D’Oriano, C., Landi, P., Pardini, F., Scarlato, P., et al. (2021). Uncovering the eruptive patterns of the 2019 double paroxysm eruption crisis of Stromboli volcano. Nat. Commun. 12, 4213. doi:10.1038/s41467-021-24420-1
Angulo-Martínez, M., Baguería, S., Latorre, B., and Fernández-Raga, M. (2018). Comparison of precipitation measurements by OTT Parsivel2 and Thies LPM optical disdrometers. Hydrol. Earth Syst. Sci. 22, 2811–2837. doi:10.5194/hess-22-2811-2018
Arrighi, S., Principe, C., and Rosi, M. (2001). Violent strombolian and subplinian eruptions at Vesuvius during post-1631 activity. Bull. Volcanol. 63, 126–150. doi:10.1007/s004450100130
Barker, A. K., Troll, V. R., Carracedo, J. C., and Nicholls, P. A. (2015). The magma plumbing system for the 1971 Teneguía eruption on La Palma, Canary Islands. Contrib. Mineral. Petrol. 170 (5–6), 54–21. doi:10.1007/s00410-015-1207-7
Beckett, F. M., Witham, C. S., Leadbetter, S. J., Crocker, R., Webster, H. N., Hort, M. C., et al. (2020). Atmospheric dispersion modelling at the london vaac: A review of developments since the 2010 Eyjafjallajökull volcano ash cloud. Atmos 11, 352. doi:10.3390/atmos11040352
Biass, S., Bonadonna, C., and Houghton, B. F. (2019). A step-by-step evaluation of empirical methods to quantify eruption source parameters from tephra-fall deposits. J. Appl. Volcanol. 8, 1. doi:10.1186/s13617-018-0081-1
Biass, S., and Bonadonna, C. (2014). Totgs: Total grainsize distribution of tephra fallout. https://vhub.org/resources/3297.
Biass, S., Scaini, C., Bonadonna, C., Folch, A., Smith, K., and Höskuldsson, A. (2014). A multi-scale risk assessment for tephra fallout and airborne concentration from multiple Icelandic volcanoes – Part 1: Hazard assessment. Nat. Hazard. Earth Sys. Sci. 14 (8), 2265–2287. doi:10.5194/nhess-14-2265-2014
Blake, D. M., Deligne, N. I., Wilson, T. M., and Wilson, G. (2017). Improving volcanic ash fragility functions through laboratory studies: Example of surface transportation networks. J. Appl. Volcanol. 6, 16. doi:10.1186/s13617-017-0066-5
Bonadonna, C., Cioni, R., Costa, A., Druitt, T., Phillips, J., Pioli, L., et al. (2016). MeMoVolc report on classification and dynamics of volcanic explosive eruptions. Bull. Volcanol. 78, 84. doi:10.1007/s00445-016-1071-y
Bonadonna, C., Cioni, R., Pistolesi, M., Elissondo, M., and Baumann, V. (2015). Sedimentation of long-lasting wind-affected volcanic plumes: The example of the 2011 rhyolitic Cordón Caulle eruption, Chile. Bull. Volcanol. 77 (13), 13–19. doi:10.1007/s00445-015-0900-8
Bonadonna, C., and Costa, A. (2013). Plume height, volume, and classification of explosive volcanic eruptions based on the Weibull function. Bull. Volcanol. 75 (8), 742. doi:10.1007/s00445-013-0742-1
Bonadonna, C., and Houghton, B. F. (2005). Total grainsize distribution and volume of tephra-fall deposits. Bull. Volcanol. 67, 441–456. doi:10.1007/s00445-004-0386-2
Bonadonna, C., Mayberry, G. C., Calder, E. S., Sparks, R. S. J., Choux, C., Jackson, P., et al. (2002). “Tephra fallout in the eruption of soufrière hills volcano, Montserrat,”. The eruption of soufrière hills volcano, Montserrat, from 1995 to 1999. Editor T. H. B. P. DruittKokelaar (London, Memoir: Geological Society), 21, 483–516. doi:10.1144/GSL.MEM.2002.021.01.22
Bonadonna, C., Pistolesi, M., Biass, S., Voloschina, M., Romero, J., Coppola, D., et al. (2022). Physical characterization of long-lasting hybrid eruptions: The 2021 tajogaite eruption of cumbre vieja (La Palma, canary islands). J. Geophys. Res. Solid Earth 127 (11). doi:10.1029/2022JB025302
Brown, R. J., Bonadonna, C., and Durant, A. J. (2012). A review of volcanic ash aggregation. Phys. Chem. Earth, Parts A/B/C 45-46, 65–78. doi:10.1016/j.pce.2011.11.001
Burton, M., Aiuppa, A., Allard, P., Asensio-Ramos, M., Pardo-Cofrades, A., La Spina, A., et al. (2022). Exceptional CO2 emissions from alkaline mafic magma in the Canary volcanic archipelago. Nat. Geosci. (submitted).
Burton, M., Aiuppa, A., Asensio-Ramos, M., La Spina, A., Allard, P., Liu, E., et al. (2022). CO2-rich emissions from alkalic magmatism in the Canary Islands, Spain. Vienna, Austria: EGU General Assembly 2022, 23–27. doi:10.5194/egusphere-egu22-5629
Carazzo, G., and Jellinek, A. M. (2012). A new view of the dynamics, stability and longevity of volcanic clouds. Earth Planet. Sci. Lett. 325-326, 39–51. doi:10.1016/j.epsl.2012.01.025
Carazzo, G., and Jellinek, A. M. (2013). Particle sedimentation and diffusive convection in volcanic ash clouds. J. Geophys. Res. Solid Earth 118, 1420–1437. doi:10.1002/jgrb.50155
Carracedo, J. C., Badiola, E. R., Guillou, H., de La Nuez, J., and Pérez Torrado, F. J. (2001). Geology and volcanology of La Palma and El hierro, western canaries. Estud. Geol. 57, 175–273.
Carracedo, J. C., Day, S., Guillou, H., Rodríguez Badiola, E., Canas, J. A., and Pérez Torrado, F. J. (1998). Hotspot volcanism close to a passive continental margin: The Canary Islands. Geol. Mag. 135 (5), 591–604. doi:10.1017/S0016756898001447
Carracedo, J. C., Day, S. J., Guillou, H., and Gravestock, P. (1999). Later stages of volcanic evolution of La Palma, Canary Islands: Rift evolution, giant landslides, and the Genesis of the Caldera de Taburiente. GSA Bull. 111 (5), 755–768. doi:10.1130/0016-7606(1999)111<0755:LSOVEO>2.3.CO;2
Carracedo, J. C., Troll, V. R., Day, J. M. D., Geiger, H., Aulinas, M., Soler, V., et al. (2022). The 2021 eruption of the cumbre vieja volcanic ridge on La Palma, canary islands. Geol. Today 38 (3), 94–107. doi:10.1111/gto.12388
Castro, J. M., and Feisel, Y. (2022). Eruption of ultralow-viscosity basanite magma at cumbre vieja, La Palma, canary islands. Nat. Commun. 13, 3174. doi:10.1038/s41467-022-30905-4
Civico, R., Ricci, T., Scarlato, P., Taddeucci, J., Andronico, D., del Bello, E., et al. (2022). High-resolution digital surface model of the 2021 eruption deposit of cumbre vieja volcano, La Palma, Spain. Sci. Data 9 (1), 435. doi:10.1038/s41597-022-01551-8
Cole, P. D., and Scarpati, C. (2010). The 1944 eruption of Vesuvius, Italy: Combining contemporary accounts and field studies for a new volcanological reconstruction. Geol. Mag. 147 (3), 391–415. doi:10.1017/s0016756809990495
Costa, A., Caricchi, L., and Bagdassarov, N. (2009). A model of the rheology of particle-bearing suspensions and partially molten rocks. Geochem. Geophys. Geosyst. 10, Q03010.
Craig, H., Wilson, T., Stewart, C., Villarosa, G., Outes, V., Cronin, S., et al. (2016). Agricultural impact assessment and management after three widespread tephra falls in Patagonia, South America. Nat. Hazard. 82 (2), 1167–1229. doi:10.1007/s11069-016-2240-1
D’Auria, L., Koulakov, I., Prudencio, J., Cabrera-Pérez, I., Ibáñez, J. M., Barrancos, J., et al. (2022). Rapid magma ascent beneath La Palma revealed by seismic tomography. Sci. Rep. 12, 17654. doi:10.1038/s41598-022-21818-9
Day, J. M., Troll, V. R., Aulinas, M., Deegan, F. M., Geiger, H., Carracedo, J. C., et al. (2022). Mantle source characteristics and magmatic processes during the 2021 La Palma eruption. EPSL 597, 117793. doi:10.1016/j.epsl.2022.117793
Day, S. J., Carracedo, J. C., Guillou, H., and Gravestock, P. (1999). Recent structural evolution of the Cumbre Vieja volcano, La Palma, Canary Islands: Volcanic rift zone reconfiguration as a precursor to volcano flank instability? J. Volcanol. Geotherm. Res. 94 (1–4), 135–167. doi:10.1016/S0377-0273(99)00101-8
Dayton, K., Gazel, G., Wieser, P., Troll, V. R., Carracedo, J. C., La Madrid, H., et al. (2023). Deep magma storage during the 2021 La Palma eruption. Sci. Adv. 9, eade7641. doi:10.1126/sciadv.ade7641
De Luca, C., Valerio, E., Giudicepietro, F., Macedonio, G., Casu, F., and Lanari, R. (2022). Pre-and Co-eruptive analysis of the september 2021 eruption at cumbre vieja volcano (La Palma, canary islands) through DInSAR measurements and analytical modeling. Geophys. Res. Lett. 49 (7). doi:10.1029/2021GL097293
Di Fiore, F., Vona, A., Scarani, A., Giordano, G., Romano, C., Giordano, D., et al. (2023). Experimental constraints on the rheology of lavas from 2021 Cumbre Vieja eruption (La Palma, Spain). Geophys. Res. Lett. 50 (4). doi:10.1029/2022GL100970
Di Traglia, F., Cimarelli, C., de Rita, D., and Gimeno Torrente, D. (2009). Changing eruptive styles in basaltic explosive volcanism: Examples from croscat complex scoria cone, garrotxa volcanic field (NE iberian peninsula). J. Volcanol. Geotherm. Res. 180 (2-4), 89–109. doi:10.1016/j.jvolgeores.2008.10.020
Di Traglia, F. (2020). Hydrogeomorphic and sedimentary response to the late pleistocene violent strombolian eruption of the croscat volcano (garrotxa volcanic field, Spain). Med. Geosc. Rev. 2, 217–231. doi:10.1007/s42990-020-00032-7
Dominguez, L., Bonadonna, C., Forte, P., Jarvis, P. A., Cioni, R., Mingari, L., et al. (2020). Aeolian remobilisation of the 2011-cordón Caulle tephra-fallout deposit: Example of an important process in the life cycle of volcanic ash. Front. Earth Sci. 7, 343. doi:10.3389/feart.2019.00343
Dominguez, L., Pioli, L., Bonadonna, C., Connor, C. B., Andronico, D., Harris, A. J. L., et al. (2016). Quantifying unsteadiness and dynamics of pulsatory volcanic activity. Earth Planet. Sci. Lett. 444, 160–168. doi:10.1016/j.epsl.2016.03.048
Elissondo, M., Baumann, V., Bonadonna, C., Pistolesi, M., Cioni, R., Bertagnini, A., et al. (2016). Chronology and impact of the 2011 Cordón Caulle eruption, Chile. Nat. Hazard. Earth Syst. Sci. 16, 675–704. doi:10.5194/nhess-16-675-2016
Engwell, S. L., Sparks, R. S. J., and Aspinall, W. P. (2013). Quantifying uncertainties in the measurement of tephra fall thickness. J. Appl. Volcanol. 2 (5), 5. doi:10.1186/2191-5040-2-5
Favalli, M., Pareschi, M. T., and Zanchetta, G. (2006). Simulation of syn-eruptive floods in the circumvesuvian plain (southern Italy). Bull. Volcanol. 68, 349–362. doi:10.1007/s00445-005-0011-z
Fernández, J., Escayo, J., Hu, Z., Camacho, A. G., Samsonov, S. v., Prieto, J. F., et al. (2021). Detection of volcanic unrest onset in La Palma, Canary Islands, evolution and implications. Sci. Rep. 11 (1), 2540. doi:10.1038/s41598-021-82292-3
Freret-Lorgeril, V., Bonadonna, C., Corradini, S., Guerrieri, L., Lemus, J., Donnadieu, F., et al. (2022a). Tephra characterization and multi-disciplinary determination of eruptive source parameters of a weak paroxysm at mount Etna (Italy). J. Volcanol. Geotherm. Res. 421, 107431. doi:10.1016/j.jvolgeores.2021.107431
Freret-Lorgeril, V., Bonadonna, C., Rossi, E., Poulidis, A., and Iguchi, M. (2022b). New insights into real-time detection of tephra grainsize, settling velocity and sedimentation rate. Sci. Rep. 12, 4650. doi:10.1038/s41598-022-08711-1
Fries, A., Lemus, J., Jarvis, P. A., Clarke, A. B., Phillips, J. C., Manzella, I., et al. (2021). The influence of particle concentration on the formation of settling-driven gravitational instabilities at the base of volcanic clouds. Front. Earth Sci. 9. doi:10.3389/feart.2021.640090
Giordano, D., Russell, J. K., and Dingwell, D. B. (2008). Viscosity of magmatic liquids: A model. Earth Planet. Sci. Lett. 271 (1–4), 123–134. doi:10.1016/j.epsl.2008.03.038
Giordano, G., and De Astis, G. (2021). The summer 2019 basaltic Vulcanian eruptions (paroxysms) of Stromboli. Bull. Volcanol. 83, 1. doi:10.1007/s00445-020-01423-2
González, P. J. (2022). Volcano-tectonic control of cumbre vieja. Sci 375 (6587), 1348–1349. doi:10.1126/science.abn5148
Gudmundsson, M., Thordarson, T., Höskuldsson, Á., Larsen, G., Björnsson, H., Prata, F. J., et al. (2012). Ash generation and distribution from the April-May 2010 eruption of Eyjafjallajökull, Iceland. Sci. Rep. 2, 572. doi:10.1038/srep00572
Houghton, B. F., Taddeucci, J., Andronico, D., Gonnermann, H. M., Pistolesi, M., Patrick, M. R., et al. (2016). Stronger or longer: Discriminating between Hawaiian and strombolian eruption styles. Geology 44, 163–166. doi:10.1130/G37423.1
Inman, D. (1952). Measures for describing the size distribution of sediments. J. Sedim. Petrol. 22 (3), 125–145. doi:10.1306/D42694DB-2B26-11D7-8648000102C1865D
Jenkins, S. F., Wilson, T., Magill, C., Miller, V., Stewart, C., Marzocchi, W., et al. (2015). “Volcanic ash fall hazard and risk,” in Global volcanic hazard and risk. Editors S. C. Loughlin, S. Sparks, S. K. Brown, S. F. Jenkins, and C. Vye-Brown (Cambridge University Press). 978-1-107-11175-2.
Kaminski, E., and Jaupart, C. (1998). The size distribution of pyroclasts and the frag-mentation sequence in explosive volcanic eruptions. J. Geophys. Res. 103, 29759–29779. doi:10.1029/98jb02795
Klawonn, M., Houghton, B. F., Swanson, D. A., Fagents, S. A., Wessel, P., and Wolfe, C. J. (2014). From field data to volumes: Constraining uncertainties in pyroclastic eruption parameters. Bull. Volcanol. 76 (7), 839. doi:10.1007/s00445-014-0839-1
Klügel, A., Hoernle, K. A., Schmincke, H. U., and White, J. D. L. (2000). The chemically zoned 1949 eruption on La Palma (Canary Islands): Petrologic evolution and magma supply dynamics of a rift zone eruption. J. Geophys. Res. Solid Earth 105 (B3), 5997–6016. doi:10.1029/1999jb900334
Klügel, A., Schmincke, H. U., White, J. D. L., and Hoernle, K. A. (1999). Chronology and volcanology of the 1949 multi-vent rift-zone eruption on La Palma (Canary Islands). J. Volcanol. Geotherm. Res. 94 (1–4), 267–282. doi:10.1016/S0377-0273(99)00107-9
Lindsay, J., Marzocchi, W., Jolly, G., Constantinescu, R., Selva, J., and Sandri, L. (2010). Towards real-time eruption forecasting in the auckland volcanic field: Application of BET_EF during the New Zealand national disaster exercise ‘ruaumoko. Bull. Volcanol. 72, 185–204. doi:10.1007/s00445-009-0311-9
Longpré, M. A. (2021). Reactivation of cumbre vieja volcano. Sci 374 (6572), 1197–1198. doi:10.1126/science.abm9423
Luhr, J. F., and Simkin, T. (1993). Parícutin: The volcano born in a Mexican cornfield. Phoenix, Arizona: Geoscience Press, Inc., 427.
Mangan, M. T., and Cashman, K. V. (1996). The structure of basaltic scoria and reticulite and inferences for vesiculation, foam formation, and fragmentation in lava fountains. J. Volcanol. Geotherm. Res. 73, 1–18. doi:10.1016/0377-0273(96)00018-2
Manzella, I., Bonadonna, C., Phillips, J. C., and Monnard, H. (2015). The role of gravitational instabilities in deposition of volcanic ash. Geology 43, 211–214. doi:10.1130/G36252.1
Marrero, J. M., García, A., Berrocoso, M., Llinares, Á., Rodríguez-Losada, A., and Ortiz, R. (2019). Strategies for the development of volcanic hazard maps in monogenetic volcanic fields: The example of La Palma (canary islands). J. Appl. Volcanol. 8, 6. doi:10.1186/s13617-019-0085-5
Martí, J., Becerril, L., and Rodríguez, A. (2022). How long-term hazard assessment may help to anticipate volcanic eruptions: The case of La Palma eruption 2021 (Canary Islands). J. Volcanol. Geotherm. Res. 431, 107669. doi:10.1016/j.jvolgeores.2022.107669
Martin, U., and Nemeth, K. (2006). How strombolian is a “strombolian” scoria cone? Some irregularities in scoria cone architecture from the transmexican volcanic belt, near volcan ceboruco, (Mexico) and Al haruj (Libya). J. Volcanol. Geotherm. Res. 155, 104–118. doi:10.1016/j.jvolgeores.2006.02.012
Muñoz, V., Walter, T. R., Zorn, E. U., Shevchenko, A. V., González, P. J., Reale, D., et al. (2022). Satellite radar and camera time series reveal transition from aligned to distributed crater arrangement during the 2021 eruption of cumbre vieja, La Palma (Spain). Remote Sens. 14 (23), 6168. doi:10.3390/rs14236168
Nieto Torres, A., Martin Del Pozzo, A. L., Groppelli, G., and del Carmen Jaimes Viera, M. (2022). Risk scenarios for a future eruption in the Chichinautzin monogenetic volcanic field, South México City. J. Volcanol. Geotherm. Res. 433, 107733. doi:10.1016/j.jvolgeores.2022.107733
Pankhurst, M. J., Scarrow, J. H., Barbee, O. A., Hickey, J., Coldwell, B. C., Rollinson, G. K., et al. (2022). Rapid response petrology for the opening eruptive phase of the 2021 Cumbre Vieja eruption, La Palma, Canary Islands. Volcanica 5 (1), 1–10. doi:10.30909/vol.05.01.0110
Parfitt, E. A. (1998). A study of clast size distribution, ash deposition and fragmentation in a Hawaiian-style volcanic eruption. J. Volcanol. Geoth. Res. 84 (197–208), 197–208. doi:10.1016/S0377-0273(98)00042-0
Parfitt, E. A., and Wilson, L. (1995). Explosive volcanic eruptions—IX. The transition between Hawaiian-style lava fountaining and strombolian explosive activity. Geophys. J. Int. 121 (1), 226–232. doi:10.1111/j.1365-246X.1995.tb03523.x
Penlou, B., Roche, O., Manga, M., and van den Wildenberg, S. (2023). Experimental measurement of enhanced and hindered particle settling in turbulent gas-particle suspensions, and geophysical implications. J. Geophys. Res. Solid Earth 128, e2022JB025809. doi:10.1029/2022JB025809
Pioli, L., Azzopardi, B. J., and Cashman, K. V. (2009). Controls on the explosivity of scoria cone eruptions: Magma segregation at conduit junctions. J. Volcanol. Geotherm. Res. 186 (3–4), 407–415. doi:10.1016/j.jvolgeores.2009.07.014
Pioli, L., Bonadonna, C., and Pistolesi, M. (2019). Reliability of total grain-size distribution of tephra deposits. Sci. Rep. 9, 10006. doi:10.1038/s41598-019-46125-8
Pioli, L., Erlund, E., Jonhson, E., Cashman, K., Wallace, P., Rosi, M., et al. (2008). Explosive dynamics of violent strombolian eruptions: The eruption of Parícutin volcano 1943–1952 (Mexico). Earth Planet. Sci. Lett. 271, 359–368. doi:10.1016/j.epsl.2008.04.026
Pioli, L., and Harris, A. J. L. (2019). Real-time geophysical monitoring of particle size distribution during volcanic explosions at Stromboli volcano (Italy). Front. Earth Sci. 7, 52. doi:10.3389/feart.2019.00052
Pioli, L., Palmas, M., Behncke, B., De Beni, E., Cantarero, M., and Scollo, S. (2022). Quantifying strombolian activity at Etna volcano. Geosci 12, 163. doi:10.3390/geosciences12040163
Pistolesi, M., Cioni, R., Bonadonna, C., Elissondo, M., Baumann, V., Bertagnini, A., et al. (2015). Complex dynamics of small-moderate volcanic events: The example of the 2011 rhyolitic Cordón Caulle eruption, Chile. Bull. Volcanol. 77 (3), 3–24. doi:10.1007/s00445-014-0898-3
Pistolesi, M., Delle Donne, D., Pioli, L., Rosi, M., and Ripepe, M. (2011). The 15 march 2007 explosive crisis at Stromboli volcano, Italy: Assessing physical parameters through a multidisciplinary approach. J. Geophys. Res. Solid Earth 116 (B12), B12206. doi:10.1029/2011JB008527
Plank, S., Shevchenko, A. V., d'Angelo, P., Gstaiger, V., González, P. J., Cesca, S., et al. (2023). Combining thermal, tri-stereo optical and bi-static InSAR satellite imagery for lava volume estimates: The 2021 cumbre vieja eruption, La Palma. Sci. Rep. 13 (1), 2057. doi:10.1038/s41598-023-29061-6
Pomonis, A., Spence, R., and Baxter, P. (1999). Risk assessment of residential buildings for an eruption of furnas volcano, são miguel, the azores. J. Volcanol. Geotherm. Res. 92 (1-2), 107–131. doi:10.1016/s0377-0273(99)00071-2
Pyle, D. M. (1989). The thickness, volume and grainsize of tephra fall deposits. Bull. Volcanol. 51 (1), 1–15. doi:10.1007/bf01086757
Robertson, R. E. A., Aspinall, W. P., Herd, R. A., Norton, G. E., Sparks, R. S. J., and Young, S. R. (2000). The 1995–1998 eruption of the Soufriére Hills volcano, Montserrat, WI. Phil. Trans. R. Soc. A 358, 3581619–3581637. doi:10.1098/rsta.2000.0607
Rodríguez, F., Martín-Lorenzo, A., Coldwell, B., Andronico, D., Bonadonna, C., Del Bello, E., et al. (Submitted to Volcanica) Tephra stratigraphy of the 2021 Tajogaite eruption of Cumbre Vieja, La Palma, Canary Islands.
Romero, J. E., Burton, M., Cáceres, F., Civico, R., Ricci, T., Pankhurst, M. J., et al. (2022). The initial phase of the 2021 Cumbre Vieja ridge eruption (Canary Islands): Products and dynamics controlling edifice growth and collapse. J. Volcanol. Geotherm. Res. 431, 107642. doi:10.1016/j.jvolgeores.2022.107642
Rosi, M., Bertagnini, A., Harris, A. J. L., Pioli, L., Pistolesi, M., and Ripepe, M. (2006). A case history of paroxysmal explosion at Stromboli: Timing and dynamics of the April 5, 2003 event. Earth Planet. Sci. Lett. 243 (3–4), 594–606. doi:10.1016/j.epsl.2006.01.035
Rowland, S. K., Jurado-Chichay, Z. J., Ernst, G., and Walker, G. P. L. (2009). Pyroclastic deposits and lava flows from the 1759–1774 eruption of El Jorullo, méxico: Aspects of ‘violent strombolian’ activity and comparison with Parícutin,” in Studies in Volcanology: The Legacy of George Walker. Editors T. Thordarson, S. Self, G. Larsen, S. K. Rowland, and A. Hoskuldsson (London: Special Publications of IAVCEI, Geological Society) 2, 105–128.
Rust, A. C., and Cashman, K. V. (2011). Permeability controls on expansion and size distributions of pyroclasts. J. Geophys. Res. 116, B11202. doi:10.1029/2011JB008494
Schipper, C. I., Castro, J. M., Tuffen, H., James, M. R., and How, P. (2013). Shallow vent architecture during hybrid explosive–effusive activity at Cordón Caulle (Chile, 2011–12): Evidence from direct observations and pyroclast textures. J. Volcanol. Geotherm. Res. 262, 25–37. doi:10.1016/j.jvolgeores.2013.06.005
Schmincke, H.-U. (1982). “Volcanic and chemical evolution of the canary islands,” in Geology of the northwest african continental margin (Springer), 273–306.
Scollo, S., Del Carlo, P., and Coltelli, M. (2007). Tephra fallout of 2001 Etna flank eruption: Analysis of the deposit and plume dispersion. J. Volcanol. Geotherm. Res. 160, 147–164. doi:10.1016/j.jvolgeores.2006.09.007
Seyfried, R., and Freundt, A. (2000). Experiments on conduit flow and eruption behavior of basaltic volcanic eruptions. J. Geophys. Res. 105 (B10), 23727–23740. doi:10.1029/2000jb900096
Spina, L., Cannata, A., Morgavi, D., and Perugini, D. (2019). Degassing behaviour at basaltic volcanoes: New insights from experimental investigations of different conduit geometry and magma viscosity. Earth-Science Rev. 192, 317–336. doi:10.1016/j.earscirev.2019.03.010
Staudigel, H., Feraud, G., and Giannerini, G. (1986). The history of intrusive activity on the island of La Palma (Canary Islands). J. Volcanol. Geotherm. Res. 27 (3–4), 299–322. doi:10.1016/0377-0273(86)90018-1
Thouret, J. C., Antoine, S., Magill, C., and Ollier, C. (2020). Lahars and debris flows: Characteristics and impacts. Earth Sci. Rev. 201, 103003. doi:10.1016/j.earscirev.2019.103003
Tomsen, E., Lindsay, J., Gahegan, M., Wilson, T. M., and Blake, D. M. (2014). Evacuation planning in the auckland volcanic field, New Zealand: A spatio-temporal approach for emergency management and transportation network decisions. J. Appl. Volcanol. 3, 6.
Torres-González, P. A., Luengo-Oroz, N., Lamolda, H., D’Alessandro, W., Albert, H., Iribarren, I., et al. (2020). Unrest signals after 46 years of quiescence at cumbre vieja, La Palma, canary islands. J. Volcanol. Geotherm. Res. 392, 106757. doi:10.1016/j.jvolgeores.2019.106757
Walker, G. P. L. (1973). Explosive volcanic eruptions — A new classification scheme. Geol. Rundsch. 62, 431–446. doi:10.1007/bf01840108
White, J. D. L., Houghton, B. F., Hodgson, K. A., and Wilson, C. J. N. (1997). Delayed sedimentary response to the AD 1886 eruption of Tarawera, New Zealand. Geology 25 (5), 459–462. doi:10.1130/0091-7613(1997)025<0459:dsrtta>2.3.co;2
Wilson, T. M., Cole, J. W., Stewart, C., Cronin, S. J., and Johnston, D. M. (2011). Ash storms: Impacts of wind-remobilised volcanic ash on rural communities and agriculture following the 1991 hudson eruption, southern patagonia, Chile. Bull. Volcanol. 73, 223–239. doi:10.1007/s00445-010-0396-1
Wilson, T. M., Stewart, C., Sword-Daniels, V., Leonard, G. S., Johnston, D. M., Cole, J. W., et al. (2012). Volcanic ash impacts on critical infrastructure. Phys. Chem. Earth 45-46, 5–23. doi:10.1016/j.pce.2011.06.006
Zawacki, E. E., Clarke, A. B., Arrowsmith, J. R., Bonadonna, C., and Lynch, D. J. (2019). Tecolote volcano, pinacate volcanic field (sonora, Mexico): A case of highly explosive basaltic volcanism and shifting eruptive styles. J. Volcanol. Geotherm. Res. 379, 23–44. doi:10.1016/j.jvolgeores.2019.04.011
Keywords: hybrid eruptions, cone-forming eruptions, monogenetic volcanism, grainsize distribution, long-lasting eruptions, eruption classification, violent Strombolian eruptions, ash aggregation
Citation: Bonadonna C, Pistolesi M, Dominguez L, Freret-Lorgeril V, Rossi E, Fries A, Biass S, Voloschina M, Lemus J, Romero JE, Zanon V, Pastore C, Reyes Hardy M-P, Di Maio LS, Gabellini P, Martin-Lorenzo A, Rodriguez F and Perez NM (2023) Tephra sedimentation and grainsize associated with pulsatory activity: the 2021 Tajogaite eruption of Cumbre Vieja (La Palma, Canary Islands, Spain). Front. Earth Sci. 11:1166073. doi: 10.3389/feart.2023.1166073
Received: 14 February 2023; Accepted: 20 April 2023;
Published: 11 May 2023.
Edited by:
Carmen Solana, University of Portsmouth, United KingdomReviewed by:
Marie-Noelle Guilbaud, National Autonomous University of Mexico, MexicoFederico Di Traglia, National Institute of Geophysics and Volcanology (INGV), Italy
Copyright © 2023 Bonadonna, Pistolesi, Dominguez, Freret-Lorgeril, Rossi, Fries, Biass, Voloschina, Lemus, Romero, Zanon, Pastore, Reyes Hardy, Di Maio, Gabellini, Martin-Lorenzo, Rodriguez and Perez. This is an open-access article distributed under the terms of the Creative Commons Attribution License (CC BY). The use, distribution or reproduction in other forums is permitted, provided the original author(s) and the copyright owner(s) are credited and that the original publication in this journal is cited, in accordance with accepted academic practice. No use, distribution or reproduction is permitted which does not comply with these terms.
*Correspondence: Costanza Bonadonna, Y29zdGFuemEuYm9uYWRvbm5hQHVuaWdlLmNo