 Paola Montone
 Maria Teresa Mariucci
- Istituto Nazionale di Geofisica e Vulcanologia, Rome, Italy
Following the Mw 5.5 earthquake of 9 November 2022 that occurred along the Adriatic coast of Italy and the related seismic sequence, we analysed new data from deep wells drilled in recent years by ENI S.p.A. Specifically, we calculated the horizontal stress orientations from breakouts recognized in three wellbores, determined the P-wave velocities for the first 5 km of crust from 12 well sonic records, and then calculated the vertical stress values in the area. Our results, indicating orientations of the present-day stress field of ∼N130 and ∼N040 for minimum and maximum horizontal stress, respectively, are consistent with the seismic sequence focal solutions. Thrust faulting focal solutions occurring at a hypocentral depth between 5 and 10 km, show minimum horizontal stress oriented at ∼N140, which is also in agreement with the compressive tectonics of the area and the known seismogenic sources. The crustal P-wave velocities vary as a function of both the lithology crossed and the geological-structural location of the wells, suggesting several velocity patterns in a confined area. The average vertical stress for the investigated area, inferred from the velocity-derived density, shows values of ∼100 MPa at a depth of 4.5 km, with a gradient varying from 21 to 23 MPa/km. The obtained in situ stress measurements indicate that no stress regime changes or temporal rotations have been observed in the past 50 years throughout the entire area. The new stress indicators fill a geographical gap between the northern and southernmost existing data coherently with a compressive stress regime.
Introduction
At 06:07:25 UTC on 9 November 2022, a Mw 5.5 (ML 5.7) earthquake occurred in the Adriatic Sea (ISIDe working group, 2007, http://terremoti.ingv.it/). The earthquake was followed by a seismic sequence located in a limited area approximately 20–30 km wide, where no earthquakes of similar magnitudes had previously been documented (Figure 1). This sequence is still ongoing at the time of submission (February 2023).
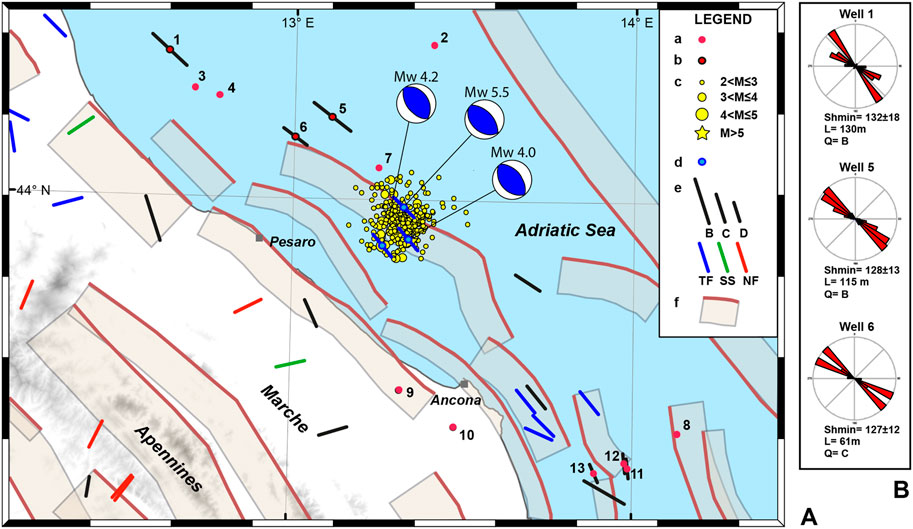
FIGURE 1. (A) Study area and results of contemporary stress analysis. Legend: a) Borehole data analysed in this study (number 1–13). b) Shmin orientations obtained in this work from the analysis of borehole breakouts (number 1, 5 and 6). c) Earthquakes with M>2 of the 2022-2023 Adriatic seismic sequence only from 9th to 23rd November (ISIDe working group, 2007; http://terremoti.ingv.it/). d) Shmin orientations obtained in this work from focal mechanism data of M>4 earthquakes (available on 10 February 2023). e) Shmin orientations scaled by quality (B, C, D, from the best to the worst) from the database of the Italian Present-day Stress Indicators, IPSI 1.5 (Mariucci and Montone, 2022): black bars are relative to borehole breakout data (undefined tectonic regime); colour bars are relative to focal mechanism data and indicate the tectonic regime (TF, thrust faulting; SS, strike-slip faulting; NF, normal faulting). f) Composite seismogenic sources from the Database of Individual Seismogenic Sources (DISS Working Group, 2021). (B) Rose diagrams of borehole breakout orientations recognized in each well: mean Shmin orientation weighted by length and related standard deviation, L is the total length of breakout zones, and Q is the assigned quality.
Few data relating to the current stress field exist in this area; those that do are mostly on land or a little further south of the location of the seismic sequence (Figure 1). The few data are reported in the Italian Present-day Stress Indicators (IPSI) database (https://ipsi.rm.ingv.it/) as well as in the World Stress Map Project (https://www.world-stress-map.org/) indicate orientations of the minimum horizontal stress (Shmin) that are approximately NW-SE, and are well constrained by both borehole breakout measurements from deep wells and focal mechanisms due to a thrust faulting regime, that is, still active in the area.
The main tectonic structures along this part of the offshore Adriatic consist of very mild anticlines oriented approximately NW-SE/NNW-SSE, delimited on the eastern flank by a system of reverse faults (Casero and Bigi, 2013; Maesano et al., 2013; de Nardis et al., 2022). These reverse faults are NE-ENE-verging: being part of the Adriatic-Alpine-Dinaric orogenic system, some have opposite vergence toward the Apennines (Figure 1). For the first 5 km, the stratigraphic succession is characterized by Plio–Plestocene clayey and sandy deposits followed by a Cretaceous to Late Miocene sedimentary basin succession (Figure 2A). The seismicity and tectonics of this area are controlled by the subduction of the Adria plate lithosphere below the Apennine belt (Anderson, 1987; Anderson and Jackson, 1987; Doglioni, 1991; Faccenna et al., 2003; Jolivet et al., 1998; Malinverno and Ryan, 1986; Patacca et al., 1990; Battaglia et al., 2004; Carminati and Doglioni, 2012; Pace et al., 2022). The interaction between different plates results in a complex tectonic framework characterized by present-day extension along the axis of the Apennine fold-and-thrust belt, oriented approximately NE-SW (Figure 1). Moving northeast to the foredeep and Adriatic foreland, the stress field changes into a compression, that is, also NE-oriented, from Late Miocene to Recent (Mariucci et al., 1999; Montone and Mariucci, 2016).
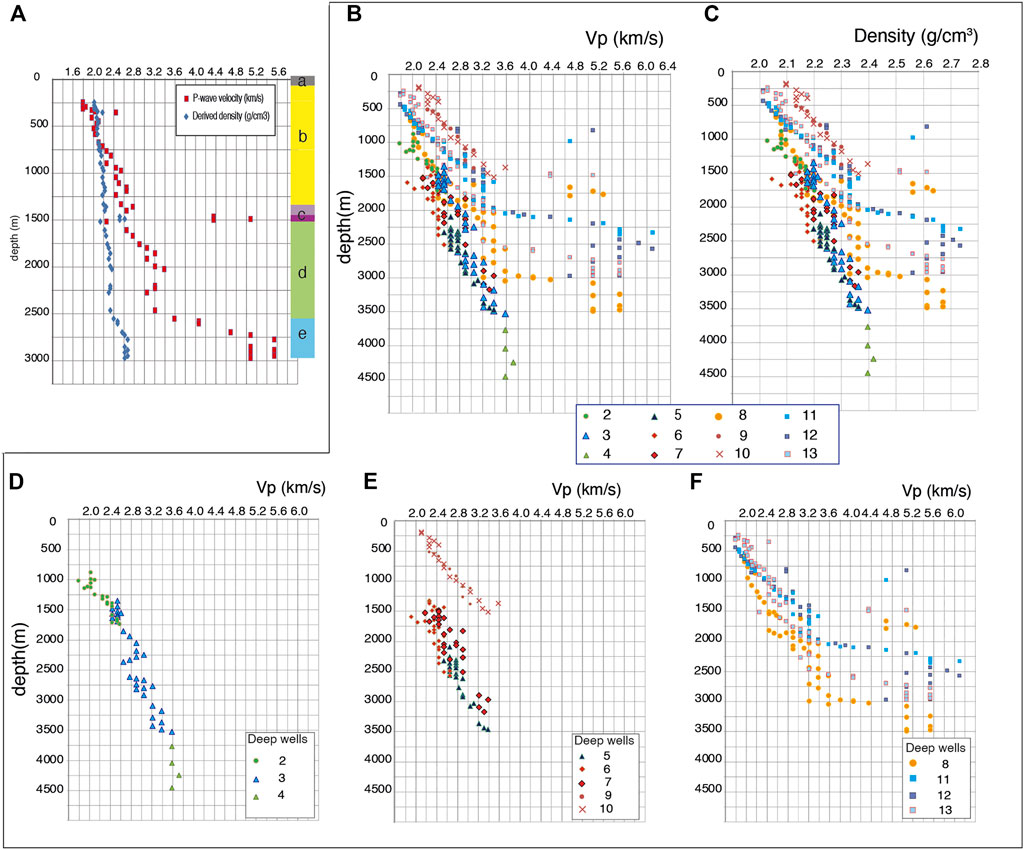
FIGURE 2. (A) Lithostratigraphic column for the deep well n. 13, P-wave velocity and derived density respect to: a) non-defined interval; b) Plio-Pleistocene deposits, mainly marine clays and sands in different combinations, including a Conglomerate level (between 243 and 446 m); c) Messinian group, sand, clay, and sandstone with gypsum (dark purple represents the Gessoso-Solfifera Formation); d) Eo-Miocene units, marly—calcareous-siliceous succession; e) Cretaceous-Eocene, mainly calcareous sequence (Scaglia Formation). (B) P-wave velocity and (C) density vs. depth of 12 analyzed wells. (D) Northern area wells. (E) Wells closest to the seismic sequence and on land wells. (F) Southern area wells. Each data point is relative to a different rock thickness and plotted at the bottom depth of the interval. Depth refers to sea level.
The Mw 5.5 earthquake occurred at a hypocentral depth of 5 km along the compressive offshore belt of the northern Apennines, approximately 30–40 km from the Pesaro-Ancona coast (Figure 1). The compressive focal mechanism from Time Domain Moment Tensor Catalogue (Scognamiglio et al., 2006; http://terremoti.ingv.it/en/tdmt) shows nodal planes parallel to the coast that are NW-SE oriented and the most probable rupture plane is the one dipping to the SW. Present seismicity is consistent with the local tectonics and the other stress indicators that define a compressive present-day stress field characterized by maximum horizontal stress (Shmax) and minimum horizontal stress (Shmin) NE- and NW-oriented, respectively. The seismic sequence that followed the main event was characterized by a ML 5.2 event 1 minute afterwards (at 06:08:28 UTC) and by 3 M ≥ 4 earthquakes amongst a total of more than 800 seismic events to date (02/06/2023). The hypocentral depths are confined between 5 and 10 km (ISIDe working group, 2007; http://terremoti.ingv.it/). The Mw 5.5 earthquake was widely felt in central-northern Italy with a maximum intensity of I = 5.5, but was also felt as far away as in regions of southern Italy (Tosi et al., 2007).
Several seismogenic structures in the area were previously identified in the Database of Individual Seismogenic Sources (DISS Working Group, 2021). As reported by the Authors “the composite seismogenic source, is a simplified and three-dimensional representation of a crustal fault containing an unspecified number of seismogenic sources that cannot be singled out”. In particular, a seismogenic source within the NE-verging composite seismogenic source named “ITCS106, Pesaro mare-Cornelia” (the closest to the earthquakes), or similar oriented structures, could be responsible for the recent seismic sequence (Figure 1). Specifically, for a Mw 5.5 event, typical empirical scaling laws (Wells and Coppersmith, 1994; Leonard, 2010) result in a rupture length of approximately 10 km.
In this context, the aim of the present study is to 1) verify throughout the analysis of new data from deep wells the regime and orientation of present-day stress field around the seismic sequence and at different depth, 2) compare the results from breakout analysis with those obtained by other Authors from the analysis of focal mechanisms and 3) define some physical characteristics of the shallow crust in an area with limited knowledge from a tectonic point of view. These results together and separately can be used to improve the construction of geological-structural models, as well as for the interpretation of seismic profiles and as input values for geomechanical models.
Methods
Borehole breakouts are stress-induced “enlargements” of a wellbore cross-section that occur discontinuously on the opposite side of the borehole wall when a well is drilled in rocks with an anisotropic stress field (Bell and Gough, 1979; Plumb and Hickman, 1985; Zoback et al., 1985; Heidbach et al., 2016). The borehole breakout direction corresponds to the orientation of Shmin. The World Stress Map project quality ranking system (Heidbach et al., 2016) classifies the mean breakout orientation of each well from A (the best) to E (the worst) on the basis of the number of breakout zones, the total length of the breakouts, and the standard deviation of the breakout orientation. In this paper, we analyzed breakouts from the four-arm caliper logs of 3 boreholes, according to the detection criteria outlined in the WSM Project (Heidbach et al., 2016).
We analyzed the sonic log record along the deep wells in detail to obtain the P-velocity values (Figure 2). The analysis was conducted by reading the measurement in depth intervals that exhibited uniform sonic log properties, with homogeneous values. The different lithologies crossed, the presence of fracturing areas or the possible presence of hydrocarbons were also considered. Their comparison with the stratigraphy allowed us to identify and characterize some specific lithological intervals and define their respective velocities. For example, the values corresponding to the Gessoso-Solfifera Formation (a mainly gypsum interval) or the levels of Conglomerates within the Pleistocene sequence have been identified (Figure 2A).
To calculate the density of sedimentary rocks (Figure 2C), we used the empirical relationship between sonic velocity and density proposed by Gardner et al. (1974):
where d represents density measured in g/cm3 and V is the sonic velocity in ft/s.
Gardner’s equation provides a reasonably accurate estimation for shales, sandstones, and carbonates. However, according to Brocher (2005), Gardner’s equation produces density values that are generally 0.1 g/cm3 or less higher than the Nafe-Drake curve (Ludwig et al., 1970). It is worth noting that density estimations may not behave as expected for evaporites.
Density values were used to obtain vertical stress magnitude data at depth in each well and to assess the trend of the lithostatic gradient within the study area (Figure 3). Typically, the vertical stress (Sv) is estimated from the lithostatic pressure (Cornet and Röckel, 2012). In Figure 3, we present the calculated magnitude of Sv at different depths in the 12 wells we selected, based on the cumulated weight of the overburden. It is important to note that our analysis did not consider the impact of pore pressure, although in some wells pore pressure may be significantly higher than hydrostatic.
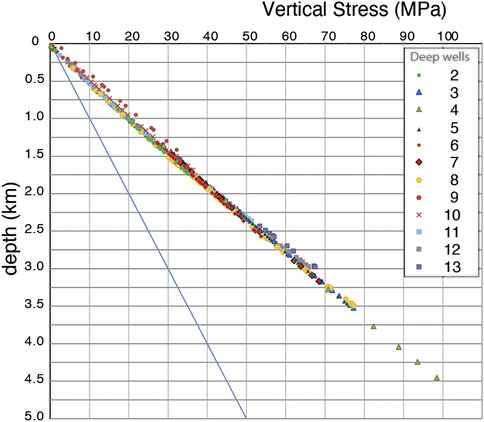
FIGURE 3. Vertical stress magnitude vs. depth estimated from the lithostatic load in 12 wells. The lithostatic gradient ranges from 21 to 23 MPa/km. The blue line is hydrostatic pressure. Depth refers to ground level for on-land wells and sea level for offshore wells.
We took into account the available Time Domain Moment Tensor (TDMT) focal mechanisms (http://terremoti.ingv.it/en/tdmt) of events with M≥4 and depth less than 40 km, whose solutions are obtained through an algorithm that inverts local to regional three-component broadband velocity waveforms to estimate a point-source solution (Scognamiglio et al., 2006). Following the standard procedure of the World Stress Map project (Heidbach et al., 2016), we used the plunge of the P, T and B axes to identify the Shmin azimuth and the tectonic regime by applying the criteria of Zoback. 1992 which were modified for Shmin (Montone et al., 1999).
Results
Borehole breakout data
We performed borehole breakout analysis on data from three deep wells located in the northern Adriatic Sea offshore the Marche region near the 2022 Mw 5.5 earthquake (wells 1, 5, and 6 in Figure 1). We analyzed approximately 5,000 m of log data and identified breakout zones for a total length of 306 m. The mean breakout orientations, weighted by length, provided consistent results and low standard deviations. In particular, Shmin is N132° ± 18° with a total breakout length of 130 m (well 1), N128° ± 13° with 115 m (well 5) and N127° ± 12° with 61 m (well 6). Following standard rules (Heidbach et al., 2016), borehole breakout orientations were assigned good qualities: wells 1 and 5 received a B quality, and well 6 a C quality (Figure 1). The Shmin orientations obtained partially fill a gap in the Italian Present-day Stress Indicators (IPSI) database (Figure 1).
Sonic log data
In addition we selected 12 deep wells with sonic records to improve our dataset in terms of P-wave velocity, all of which located close to the seismic sequence (Figure 1). The sonic logs allowed us to define the P-wave velocities along the wells down to 4,500 m (Figure 2B). The velocity distribution along the wells varies rapidly from approximately 1.8–6.2 km/s. “Fast” intervals attributed to the gypsum formation (i.e., Figure 2A) and to the beginning of the upper carbonate interval are noteworthy. In particular, the beginning of the carbonates (Scaglia Formation) is clearly visible at different depths depending on the geographical position of the wells. This trend is observed, for example, at a depth of approximately 2,000 m in wells 11 and 12, at approximately 2,500 m in well 13 and at approximately 3,000 m for well 8 (Figure 2B). The same observations can be made from the density data, with values ranging from 2 to 2.7 g/cm3, the latter attributable to carbonate rocks (Figure 2C).
From our data as reported below it is difficult to define a simple layered velocity model at least for the first 5 km beneath the surface for the whole study area. For this reason, we separated the data into three smaller areas, one comprising the northernmost sector, another the wells located in the central part, and another area further south (Figure 2D–F). The velocity trends with depth in these three areas are different. In the northern sector, the values in the wells show a fairly constant trend of P-wave velocity gradually increasing with depth, albeit with minor discontinuous jumps. The central sector includes two wells located on land (wells 9 and 10) and three in the sea, which are those closest to the 2022-2023 seismic sequence (Figure 1). The trend is again constant in this sector, although for wells 9 and 10 at least a stronger increase in velocity with depth is observed. Furthermore, between the two central sector datasets (on land and in the sea), the P-wave velocities differ by approximately 1 km/s at 1,500 m depth (Figure 2E). Finally, data from the third sector exhibit sudden increases in velocity where the more competent rocks, mainly carbonates, are crossed (Figure 2F).
Then, we calculated the lithostatic load from the velocity-derived density data of the area showing values between 21 and 23 MPa/km (Figure 3). Although variability within the entire dataset is rather small, the highest values are observed in onshore wells. In particular, the lithostatic gradient obtained from the three wells closest to the seismic sequence (wells 5, 6, and 7) ranges from 20.7 to 21.6 MPa/km. The differences observed in the lithostatic gradient values between these offshore wells and the highest values determined in onshore wells (wells 9 and 10) are due to the presence of older stratigraphic units characterized by more competent lithologies.
Focal mechanism data
The seismic sequence comprises five seismic events with M≥4, but only three TDMT focal mechanisms were available (http://terremoti.ingv.it/en/tdmt; Scognamiglio et al., 2006) from which we were able to infer the Shmin orientations. Since the mechanisms are pure thrust faults, Shmin corresponds to the B-axis. The minimum horizontal stress provides results that are consistent with one other, with orientations of N133 for the Mw=5.5 event, N139 for the Mw=4 event, and N142 for the Mw=4.2 at depths of 5, 6, and 10 km respectively (Figure 1).
Discussion
We analysed available borehole breakout data and/or sonic logs from 13 deep wells, to constrain the present-day stress and the P-wave velocity of the shallow crust in the area of the 2022-2023 Adriatic seismic sequence (Figure 1). The new deep well analyses of breakout data show coherent Shmin orientations of N127, 128, and 132 with small standard deviations (maximum 18°) that allow them to be classified as good quality (2 wells with quality B and 1 with quality C). These results, measured from the surface down to approximately 4,000 m, cover a depth range that was previously completely lacking information; in fact, the entire seismic sequence is located at a depth of between 5 and 10 km. The new Shmin data follow the axis of northern Apennines, confirming the trend evaluated from the limited existing datasets from the inland and in the southern sectors of the area (Figure 1).
The P-wave maximum velocity was found to occur at 2.5 km depth, in the carbonate rocks (Scaglia formation), which corresponds to a density of slightly higher than 2.7 g/cm3. Specific velocity values were associated with the gypsum formation (Gessoso-Solfifera), with values up to 5.2 km/s at approximately 2,000 m depth. This formation, although of limited thickness (approximately 100 m), abruptly interrupts the fairly constant velocity trend with a high velocity peak.
In the area of the seismic sequence, the wells indicate a lower lithostatic gradient ranging between 20.7 and 21.6 MPa/km respect to the whole study area, that shows a regional lithostatic gradient varying between 21 and 23 MPa/km. Similar values of the lithostatic load have been found approximately 100 km further north (Montone and Mariucci, 2015), with values from 105 to 130 MPa at a depth of 5 km, moving from the Adriatic coast to the Apennine belt, and the lithostatic gradient changes from 21 to 26 MPa/km respectively. In central Italy, to the south of the study area, the overburden stress magnitude at a depth of 5 km varies from 130 to 114 MPa from the Apennine belt to the Adriatic foredeep, and the lithostatic gradient gradually changes from ∼26 MPa/km close to Amatrice to less than 23 MPa/km along the foredeep (Montone and Mariucci, 2020).
Owing to the small number of direct datasets available, future velocity models used for depth conversion of seismic reflection profiles and improvements in event location should account for the three different velocity trends highlighted by our sonic log analysis. In particular, the northernmost dataset shows low velocity down to 4,500 m with 3.6 km/s, while in the southernmost sector, at lower depth, the velocity is approximately 5.5 km/s. The central dataset shows an almost constant linear trend of velocity with depth, at least up to 3,500 m, although the velocity trends in the onshore and offshore wells can be clearly differentiated (Figure 2D–F). Moreover, the third data set (Figure 2F) shows a sudden increase in velocity when it encounters the most competent carbonate sedimentary succession, at different depths according to the geographical position.
The analyzed data clearly indicate an Shmin orientation between N130 and N140, which corresponds to a compression NE-SW oriented. These new data fit coherently within the IPSI (https://ipsi.rm.ingv.it/) and World Stress Map (https://www.world-stress-map.org/) database, filling a geographical gap between existing northern and southernmost measurements. From the temporal analysis of the dates of drillings and seismic events in the area, it can be deduced that over a period of time ranging from 1969 (the oldest well available to us) to present day, the stress field has remained constant throughout the entire compression domain, which leads us to suppose that no stress regime changes or temporal rotations are observed in the past 50 years. The Shmin orientations from breakout measurements agree with stress data from focal mechanisms that are associated with a thrust faulting regime. This compressive regime is maintained quite clearly from the Adriatic area up to the inner part (westwards) to the foothills, and then becomes an extensional stress field, that is, orthogonal to the Apennine belt (Figure 1). Towards the south (see IPSI, https://ipsi.rm.ingv.it/), moving along the coast for a few tens of kilometres, the identified compression regime seems to be interrupted, marking the end of the zone of active compression.
Data availability statement
The raw data supporting the conclusion of this article which is not subject to proprietary permissions will be made available by the authors, without undue reservation. Some data is subject to permission from ENI S.p.A.
Author contributions
PM and MTM planned the research, analysed data and prepared figures; PM: writing—original draft, review and editing; MTM: writing—review and editing.
Acknowledgments
We thank Edanz (https://www.edanz.com/) for editing a draft of this manuscript. We are grateful to ENI S.p.A. for providing well data used for breakout analysis and part of sonic log data underlying this article. The three Reviewers and the Editor are acknowledged for the helpful suggestions that improved the manuscript.
Conflict of interest
The authors declare that the research was conducted in the absence of any commercial or financial relationships that could be construed as a potential conflict of interest.
Publisher’s note
All claims expressed in this article are solely those of the authors and do not necessarily represent those of their affiliated organizations, or those of the publisher, the editors and the reviewers. Any product that may be evaluated in this article, or claim that may be made by its manufacturer, is not guaranteed or endorsed by the publisher.
References
Anderson, H. (1987). Is the adriatic an african promontory? Geology 15 (3), 212–215. doi:10.1130/0091-7613(1987)15<212:ITAAAP>2.0
Anderson, H., and Jackson, J. (1987). Active tectonics of the adriatic region. Geophys. J. Int. 91 (3), 937–983. doi:10.1111/j.1365-246X.1987.tb01675.x
Battaglia, M., Murray, M. H., Serpelloni, E., and Bürgmann, R. (2004). The Adriatic region: An independent microplate within the Africa-Eurasia collision zone. Geophys. Res. Lett. 31 (9), L09605. doi:10.1029/2004GL019723
Bell, J. S., and Gough, D. I. (1979). Northeast-southwest compressive stress in Alberta: Evidence from oil wells. Earth planet. Sci. Lett. 45, 475–482. doi:10.1016/0012-821x(79)90146-8
Brocher, T. M. (2005). Empirical relations between elastic wave speeds and density in the Earth’s crust. B. Seismol. Soc. Am. 95 (6), 2081–2092. doi:10.1785/0120050077
Carminati, E., and Doglioni, C. (2012). Alps vs. Apennines: The paradigm of a tectonically asymmetric Earth. Earth-Science Rev. 112 (1–2), 67–96. doi:10.1016/j.earscirev.2012.02.004
Casero, P., and Bigi, S. (2013). Structural setting of the Adriatic basin and the main related petroleum exploration plays. Mar. Petroleum Geol. 42, 135–147. doi:10.1016/j.marpetgeo.2012.07.006
Cornet, F. H., and Röckel, T. (2012). Vertical stress profiles and the significance of “stress decoupling”. Tectonophysics 581, 193–205. doi:10.1016/j.tecto.2012.01.020
de Nardis, R., Pandolfi, C., Cattaneo, M., Monachesi, G., Cirillo, D., Ferrarini, F., et al. (2022). Lithospheric double shear zone unveiled by microseismicity in a region of slow deformation. Sci. Rep. 12, 21066. doi:10.1038/s41598-022-24903-1
DISS Working Group (2021). Database of individual seismogenic sources (DISS), version 3.3.0: A compilation of potential sources for earthquakes larger than M 5.5 in Italy and surrounding areas. Rome, Italy: Istituto Nazionale di Geofisica e Vulcanologia. doi:10.13127/diss3.3.0
Doglioni, C. (1991). A proposal of kinematic modelling for W-dipping subductions—possible applications to the Tyrrhenian-Apennines system. TerraNova 3 (4), 423-434.
Faccenna, C., Mattei, M., Funiciello, R., and Jolivet, L. (2003). Styles of back-arc extension in the Central Mediterranean. TerraNova 9 (3), 126–130.
Gardner, G. H. F., Gardner, L. W., and Gregory, A. R. (1974). Formation velocity and density—The diagnostic basics for stratigraphic traps. Geophysics 39, 770–780. doi:10.1190/1.1440465
Heidbach, O., Barth, A., Müller, B., Reinecker, J., Stephansson, O., Tingay, M., et al. (2016). World Stress Map Technical Report 16-01. Potsdam, Germany: GFZ German Research Centre for Geosciences. doi:10.2312/wsm.2016.001WSM quality ranking scheme, database description and analysis guidelines for stress indicator
ISIDe Working Group (2007). Italian seismological instrumental and parametric database (ISIDe). Rome, Italy: Istituto Nazionale di Geofisica e Vulcanologia. doi:10.13127/ISIDE
Jolivet, L., Faccenna, C., Goffé, B., Mattei, M., Rossetti, F., Brunet, C., et al. (1998). Midcrustal shear zones in postorogenic extension: Example from the northern Tyrrhenian Sea. Journal of Geophysical Research 103 (B6), 12123–12160. doi:10.1029/97JB03616
Leonard, M. (2010). Earthquake Fault scaling: Self-consistent relating of rupture length, width, average displacement, and moment release. Bull. Seismol. Soc. Am. 102 (6), 2797. doi:10.1785/0120120249
Ludwig, W. J., Nafe, J. E., and Drake, C. L. (1970). Editor A. E. Maxwell (Hoboken, NJ, USA: Wiley-Interscience), 4, 53–84.Seismic refraction in the sea
Maesano, F. E., Toscani, G., Burrato, P., Mirabella, F., D'Ambrogi, C., and Basili, R. (2013). Deriving thrust fault slip rates from geological modeling: Examples from the Marche coastal and offshore contraction belt, Northern Apennines, Italy. Mar. Petrol. Geol. 42, 122–134. doi:10.1016/j.marpetgeo.2012.10.008
Malinverno, A., and Ryan, W. B. F. (1986). Extension in the Tyrrhenian Sea and shortening in the Apennines as result of arc migration driven by sinking of the lithosphere. Tectonics 5, 227–245.
Mariucci, M. T., Amato, A., and Montone, P. (1999). Recent tectonic evolution and present stress in the Northern Apennines (Italy). Tectonics 18, 108–118. doi:10.1029/1998tc900019
Mariucci, M. T., and Montone, P. (2022). IPSI 1.5, database of Italian present-day stress indicators. Rome, Italy: Istituto Nazionale di Geofisica e Vulcanologia. doi:10.13127/IPSI.1.5
Montone, P., Amato, A., and Pondrelli, S. (1999). Active stress map of Italy. J. Geophys. Res. 104 (11), 25595–25610. doi:10.1029/1999jb900181
Montone, P., and Mariucci, M. T. (2020). Constraints on the structure of the shallow crust in central Italy from geophysical log data. Sci. Rep. 10, 3834. doi:10.1038/s41598-020-60855-0
Montone, P., and Mariucci, M. T. (2015). P-Wave velocity, density, and vertical stress magnitude along the crustal Po plain (northern Italy) from sonic log drilling data. Pure Appl. Geophys. 172, 1547–1561. doi:10.1007/s00024-014-1022-5
Montone, P., and Mariucci, M. T. (2016). The new release of the Italian contemporary stress map. Geophys. J. Int. 205, 1525–1531. doi:10.1093/gji/ggw100
Pace, P., Calamita, F., and Boccaletti, M. (2022). Plio-quaternary interaction between Adria and surrounding orogens: A central-northern Apennines perspective. Lithosphere 34 (1), 291–308. doi:10.1080/27669645.2022.2139893
Patacca, E., Sartori, R., and Scandone, P. (1990). Tyrrhenian basin and Apenninic arcs: Kinematic relations since late Tortonian times. Mem. Soc. Geol. Ital. 45 (1), 425–451.
Plumb, R. A., and Hickman, S. H. (1985). Stress-induced borehole elongation: A comparison between the four-arm dipmeter and the borehole televiewer in the auburn geothermal well. J. Geophys. Res. 90 (7), 5513–5521. doi:10.1029/jb090ib07p05513
Scognamiglio, L., Tinti, E., and Quintiliani, M. (2006). Time domain moment tensor (TDMT). Rome, Italy: Istituto Nazionale di Geofisica e Vulcanologia. doi:10.13127/TDMT
Tosi, P., De Rubeis, V., Sbarra, P., and Sorrentino, D. (2007). Hai sentito il terremoto (HSIT). Rome, Italy: Istituto Nazionale di Geofisica e Vulcanologia. doi:10.13127/HSIT
Wells, D. L., and Coppersmith, K. J. (1994). New empirical relationships among magnitude, rupture length, rupture width, rupture area, and surface displacement. Bull. Seismol. Soc. Am. 84 (4), 974–1002.
Zoback, M. D., Moos, D., Mastin, L., and Anderson, R. N. (1985). Well bore breakouts and in situ stress. J. Geophys. Res. 90 (7), 5523–5530. doi:10.1029/jb090ib07p05523
Keywords: in situ stress, geophysical logs, breakout, P-velocity, downhole methods, seismicity and tectonics, crustal structure, Italy
Citation: Montone P and Mariucci MT (2023) Deep well new data in the area of the 2022 Mw 5.5 earthquake, Adriatic Sea, Italy: In situ stress state and P-velocities. Front. Earth Sci. 11:1164929. doi: 10.3389/feart.2023.1164929
Received: 13 February 2023; Accepted: 03 April 2023;
Published: 17 April 2023.
Edited by:
Giovanni Martinelli, National Institute of Geophysics and Volcanology, ItalyReviewed by:
Fuqiong Huang, China Earthquake Networks Center, ChinaAyumu Miyakawa, National Institute of Advanced Industrial Science and Technology (AIST), Japan
Elena Konstantinovskaya, University of Alberta, Canada
Copyright © 2023 Montone and Mariucci. This is an open-access article distributed under the terms of the Creative Commons Attribution License (CC BY). The use, distribution or reproduction in other forums is permitted, provided the original author(s) and the copyright owner(s) are credited and that the original publication in this journal is cited, in accordance with accepted academic practice. No use, distribution or reproduction is permitted which does not comply with these terms.
*Correspondence: Paola Montone, paola.montone@ingv.it