 Zhen Liu
 Junhua Zhang1*
 Youzhuang Sun
95% of researchers rate our articles as excellent or good
Learn more about the work of our research integrity team to safeguard the quality of each article we publish.
Find out more
ORIGINAL RESEARCH article
Front. Earth Sci. , 14 June 2023
Sec. Solid Earth Geophysics
Volume 11 - 2023 | https://doi.org/10.3389/feart.2023.1163938
This article is part of the Research Topic Advanced Methods for Interpreting Geological and Geophysical Data View all 36 articles
This paper presents a novel Bayesian-based method for predicting brittleness. The method involves synthesizing petrophysical data from multiple well cores to establish a joint Gaussian distribution function for shale facies and non-shale facies. Furthermore, Bayesian facies classification is applied to seismic data. The proposed method combines non-shale facies data with Rickman brittleness data to obtain a new brittleness index. The joint Gaussian distribution function and Bayesian classification are utilized to enhance the differentiation of brittleness among different geological bodies. Practical data analysis demonstrates that the new brittleness index effectively increases the contrast in brittleness values between various geological bodies, highlighting target areas of interest. The presented method offers a promising approach for brittleness prediction, leveraging the integration of petrophysical and seismic data through Bayesian techniques. The results suggest its potential applicability in enhancing the characterization and understanding of geological formations.
Rock brittleness is a crucial factor in unconventional oil and gas exploration. Elasticity parameters, such as elastic modulus and Poisson’s ratio, are commonly used to characterize rock brittleness. Highly brittle rocks exhibit complex mesh fractures, while low brittleness formations tend to have simple fractures. Several factors influence rock brittleness, including rock components, pore fluids and pressures, surrounding pressures, temperatures, and force evolution processes (QIN et al., 2016; MAKOWITZ and MILLIKEN, 2003; RICKMAN et al., 2008; ZHANG et al., 2017; CAO et al., 2021).
Seismic data inversion is the primary method used to guide practical production. It can be subdivided into three approaches: pre-stack inversion for wave velocity and density, direct inversion of brittleness-related elastic impedance, and inversion of elastic parameters using an anisotropic rock physics equivalent medium theory model. The normalized modulus of elasticity and Poisson’s ratio are widely used to calculate the brittleness index.
However, the definition and measurement of rock brittleness still require further research and new proposals. The lithology and mineral composition of rocks significantly influence brittleness, with minerals like dolomite, quartz, and feldspar exhibiting brittleness, while clays, rock fragments, and organic matter exhibit plasticity. The relationship between brittle mineral content and rock brittleness in different rocks remains an open question.
Although various methods exist to study brittleness, seismic data inversion is the primary method for practical applications. It can be performed through pre-stack inversion, which simultaneously obtains wave velocities, densities, and other parameters. The Aki–Richards approximation and the BI-Zoeppritz equation have been developed to extract the brittleness index directly from seismic data. Empirical formulas based on Young’s modulus and Poisson’s ratio, such as Eqs 1, 2, are commonly used for brittleness calculations, but they have limitations (Luan et al., 2014; LIU and SUN, 2015).
Researchers have proposed alternative approaches integrating the mineralogy-based brittleness index (BIM) and elastic parameters (BIE) to interpret rock facies from elastic parameters in seismic inversion. Statistical petrophysical techniques and spatial constraints, such as Markov random fields and Markov chains, have been employed to enhance the accuracy and continuity of interpretation results.
In conclusion, rock brittleness plays a vital role in unconventional oil and gas exploration. It is necessary to develop more accurate methods to evaluate rock brittleness and better understand underground reservoir information. Seismic data inversion and the integration of different parameters show promise in improving the characterization of rock brittleness and facilitating practical applications (Mukerji et al., 2001; Avseth et al., 2005; Wang et al., 2019).
The southeastern part of the Junggar Basin (Zhundong area) is located east of Urumqi, west of Mulei, south of Jimsar and Qitai, and north of Irinhebirgen Mountain. It is about 200 km long from east to west and 30 km–50 km wide from north to south (Sun, 2015). The research area is separated into two major blocks by the Bogda Mountains, located at the West Bogda perimeter and north of the East Bogda Mountains. The research area of Zhundong includes three seismic working areas: Qian 1 area, Mucan area and Qi 1 area.
The seismic data used in this thesis are from the Qian1 workings (Figure 1). It is located in the eastern part of the Shiqiantan Depression, with an area of 190 km2, and is a newly developed area with only one drilled well.
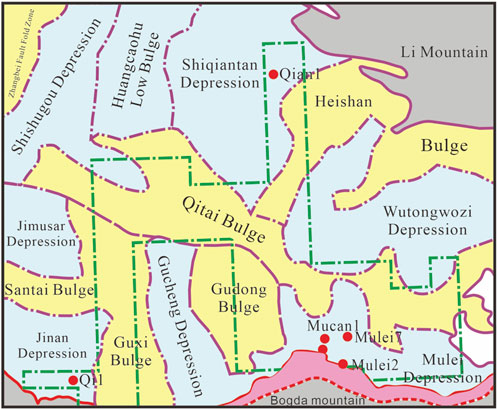
FIGURE 1. The distribution range of the Zhundong area.
There are 200–300 m high-quality hydrocarbon source rocks interspersed with dolomitic siltstone and siltstone in the middle and lower part of the Upper Permian Pingdiquan Formation in the northern part of the Zhundong area. The lithology is dense, with an average porosity of 5%–6% and permeability lower than 0.01 mD, and has long been regarded as a low-efficiency formation for exploration. In recent years, the industrial oil flow has been obtained in Huobei 2 well, Huobei 021 well, Huodong 1 well, and Shishu 1 well, which reveals the rich tight oil resources in the area with broad exploration prospects. The rock physical characteristics of Permian in the Zhundong area need to be clarified. The traditional brittleness prediction methods are weak, so new brittleness methods need to be developed by applying pre-stack information (Xiao, 2015).
Both the mean and covariance values were derived from petrophysical experimental data. Additionally, the samples obtained from these experiments were manually classified into two categories: shale and non-shale (Figure 2). To calculate the probability of shale and non-shale, we assign a brittleness value of 0 to shale and 1 to non-shale. The probability equations for non-shale and shale are as follows:
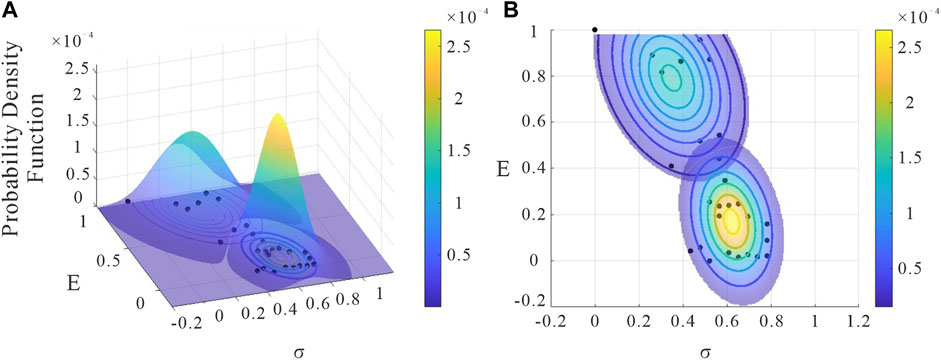
FIGURE 2. Gaussian joint distribution of Young’s modulus and Poisson’s ratio for cores from the Zhundong area (A) and their marginal distribution (non-shale facies samples in the upper left; shale facies samples in the lower right) (B).
Here, the mean for the non-shale facies is
In the Zhundong area, there are 29 petrophysical samples, with 21 classified as shale facies. Therefore,
Brittleness is calculated using the equation proposed by Rickman et al. (2008).
In Eq. 4, BI represents the brittleness index,
We propose a new brittleness equation:
where
While seismic data-based assessments of Young’s modulus and Poisson’s ratio may lack accuracy, the petrophysical data obtained from laboratory cores is highly precise. However, as the Qian1 survey encompasses a new exploration area with only one well and six sampled cores, the obtained petrophysical parameters may not be comprehensive. To address this, we can consider using exploratory cores from other surveys in the same Zhundong area, such as the Mucan survey and the Qi1 survey, as reference. Integrating and cross-correcting petrophysical and seismic data through the Bayesian method enhances credibility and accuracy.
The integrated analysis of the data revealed that the main reservoir in the study area exhibits a distinctive “Double sweet spots” characteristic. This characteristic indicates the presence of two distinct zones within the reservoir that offer favorable conditions for hydrocarbon accumulation. The identification of these double sweet spots has significant implications for reservoir evaluation, production optimization, and resource management in the study area.
Figure 3 presents the application of a new brittleness value that exhibits the characteristics of a double sweet spots in the Qian1 survey, in contrast to the conventional Rickman brittleness measure. This new brittleness value offers improved insights into the rock formation under investigation. By comparing the slices depicted in Figure 4, the enhanced brittleness measure highlights a significant increase in differentiation between highly brittle rocks and less brittle rocks within the target horizon, surpassing the capabilities of the Rickman brittleness measure. Consequently, the new brittleness measure enables a more pronounced visualization of the target geology and provides a means to discern finer details within the horizon.
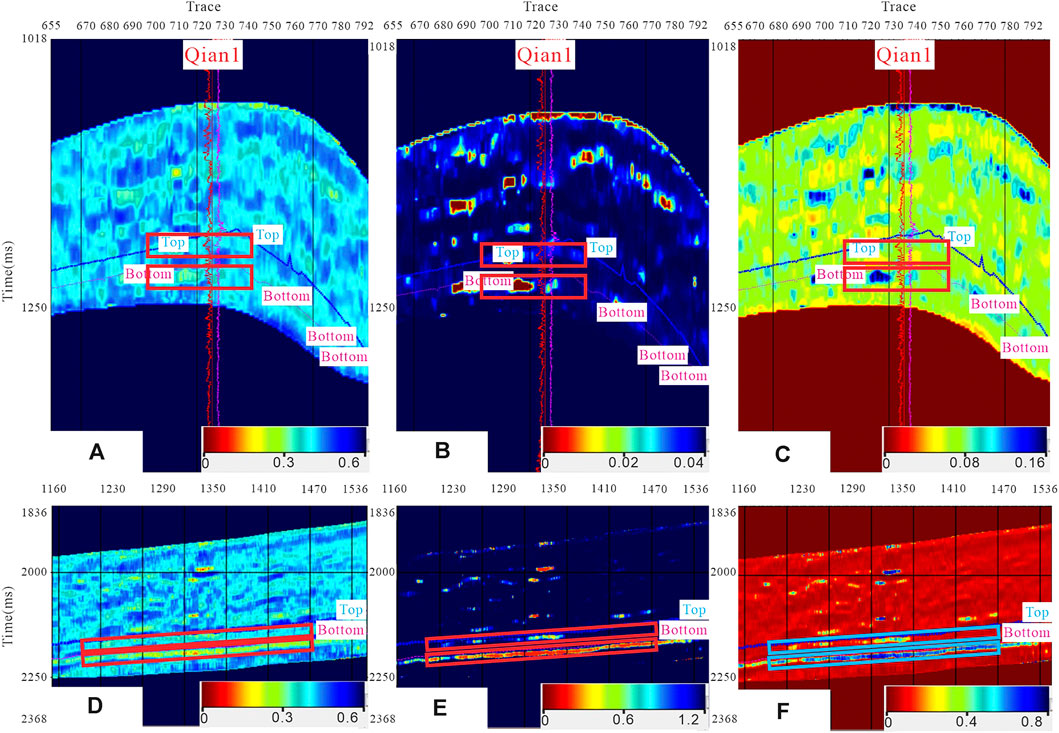
FIGURE 3. Comparison of conventional brittleness and new brittleness sections. (A) Qian1 well Rickman formula brittleness values at Inline1210. (B) Qian1 well non-shale facies values at Inline1210. (C) New brittleness values at Inline1210 Qian1 well. (D) Inline1210 Rickman formula brittleness value. (E) Inline1210 non-shale values. (F) Inline1210 new brittleness value.
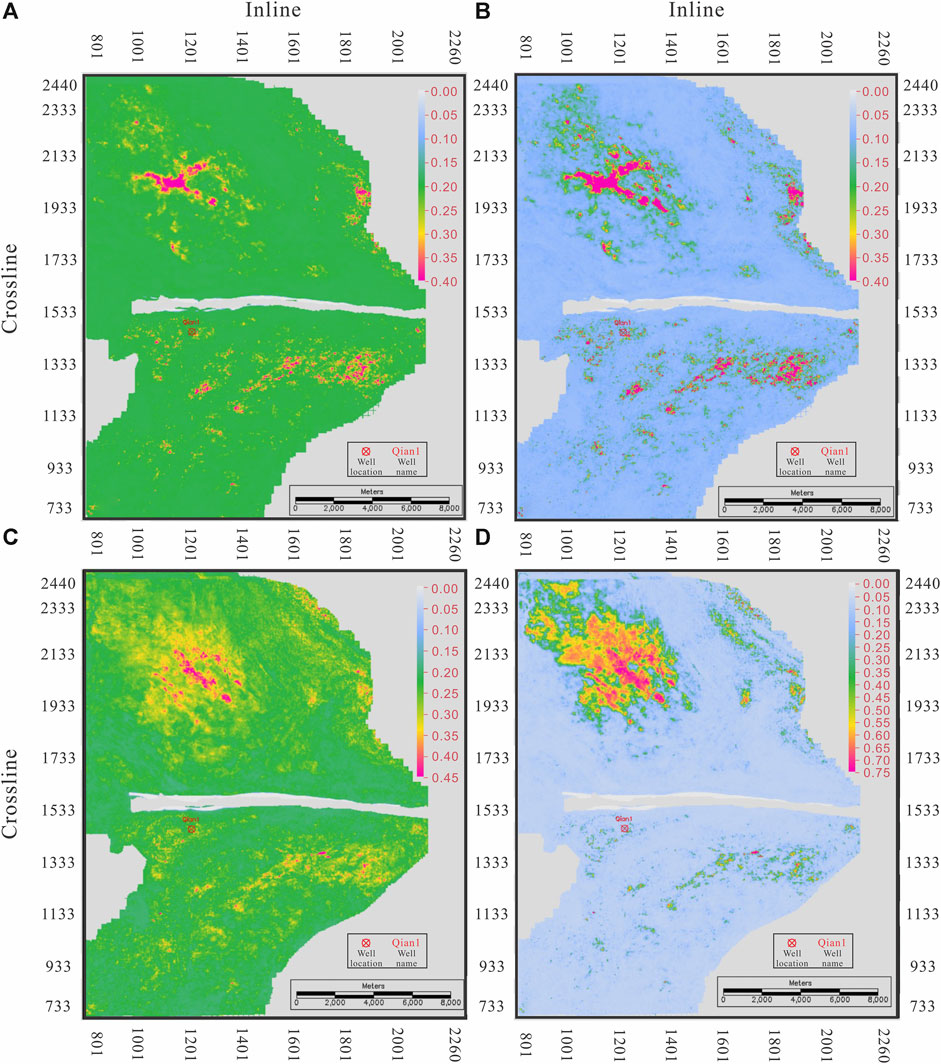
FIGURE 4. Comparison of conventional brittleness and new brittleness slices. (A) Upper sweet spot Rickman brittleness maximum amplitude slice; (B) upper sweet spot new brittleness maximum amplitude slice; (C) lower sweet spot Rickman brittleness maximum amplitude slice; (D) lower sweet spot new brittleness maximum amplitude slice.
The utilization of the new brittleness value in the Qian1 survey is noteworthy due to its ability to identify a double sweet spots. A double sweet spots refers to a geological phenomenon where two distinct regions within a formation exhibit an increased likelihood of hydraulic fracturing success. By incorporating this feature into the brittleness value, the new measure assists in identifying and characterizing these favorable zones more effectively. This enhanced understanding of the formation’s double sweet spots distribution can be crucial in optimizing hydraulic fracturing operations and maximizing production.
The comparison of slices in Figure 4 further illustrates the advantages of the new brittleness measure over the conventional Rickman approach. The enhanced differentiation between highly brittle rocks and less brittle rocks within the target horizon allows for better identification and delineation of rock layers with varying degrees of brittleness. As a result, the new measure facilitates a more accurate representation of the target geology and enables geoscientists and engineers to make more informed decisions regarding well placement, fracture design, and overall reservoir management.
The improved visualization of details within the horizon provided by the new brittleness measure can have significant implications for reservoir characterization and production optimization. It allows for a more precise understanding of the geological heterogeneity within the formation, aiding in the identification of potential flow barriers, fracture network connectivity, and overall reservoir quality assessment. Furthermore, the increased resolution offered by the new measure aids in the interpretation of the depositional environment, lithology changes, and structural features, enabling a more comprehensive evaluation of the subsurface reservoir.
In summary, the introduction of the new brittleness value in the Qian1 survey demonstrates its ability to capture the characteristics of a double sweet spots, effectively highlighting favorable zones for hydraulic fracturing. Additionally, the enhanced differentiation between highly brittle and less brittle rocks within the target horizon, compared to the Rickman brittleness measure, enables a more prominent representation of the target geology and enhances the visualization of details within the formation. The improved understanding of the reservoir’s geological heterogeneity and enhanced characterization of the subsurface can significantly impact decision-making processes related to well placement, fracture design, and reservoir management strategies.
In this study, we have proposed a novel brittleness calculation formula by combining the Rickman brittleness formula with seismic data. This approach addresses the limitations of the Rickman formula, which solely relies on Young’s modulus and Poisson’s ratio. The research survey focused on a new zone with limited data, including only one exploratory well and scarce core data. To overcome this data scarcity, we leveraged existing well data from other surveys located in the southeast of Junggar Basin to determine the distribution patterns of shale and non-shale facies.
By utilizing a Gaussian joint distribution function, we successfully classified the seismic facies based on the determined patterns of shale and non-shale facies. The integration of facies classification with the Rickman brittleness results allowed us to obtain the new brittleness value, which provides a more comprehensive assessment of the target reservoir’s brittleness characteristics.
Importantly, we enhanced the reliability of the data by incorporating the core data from several wells located in the southeast of Junggar Basin. By processing the inverse performance of Young’s modulus and Poisson’s ratio using this extended dataset, we ensured the accuracy and reliability of the new brittleness formula.
The processing of actual seismic data demonstrated the superior performance of the new brittleness equation compared to the Rickman brittleness formula. The new approach effectively highlighted the target reservoir, enabling a more precise characterization and visualization of the brittleness distribution.
Overall, our findings emphasize the significance of integrating seismic data, facies classification, and reliable core data to improve brittleness analysis in exploration and production activities. The proposed method offers a valuable contribution to the field of reservoir characterization and decision-making processes. Its application has the potential to enhance hydraulic fracturing operations, optimize well placement, and maximize hydrocarbon production in similar geological contexts.
The original contributions presented in the study are included in the article/Supplementary Materials; further inquiries can be directed to the corresponding author.
ZL, JZ, YS, ZY, and RR contributed to the conception and design of the study. ZL processed the data, analyzed the results, and wrote the article. JZ statistically analyzed the data and wrote the paper. YS interpreted the seismic data and proofread the article. ZY and RR collected and processed seismic data. All authors contributed to the article and approved the submitted version.
This research is supported by the National Natural Science Foundation of China (NSFC) under the project “The Development Characteristics of the Low-order Fault System and its Genetic Relationship with the High-order Faults in Petroliferous basin—A case study of Jiyang Depression in Bohai Bay basin” (42072169).
Authors ZY, and RR were employed by Sinopec.
The remaining authors declare that the research was conducted in the absence of any commercial or financial relationships that could be construed as a potential conflict of interest.
The authors declare that this study received funding from the Sinopec project “Study on the prediction technique of Permian unconventional sweet spots in east junggar basin area” (P21007). The funder had the following involvement in the study: Data collection and processing.
All claims expressed in this article are solely those of the authors and do not necessarily represent those of their affiliated organizations, or those of the publisher, the editors, and the reviewers. Any product that may be evaluated in this article, or claim that may be made by its manufacturer, is not guaranteed or endorsed by the publisher.
Avseth, P., Mukerji, T., and Mavko, G. (2005). Quantitative seismic interpre-tation. Cambridge University Press.
Cao, D., Zeng, L., Lyu, W., Xiang, X., and Tian, H. (2021). Progress in brittleness evaluation and prediction methods in un-conventional reservoirs. Petroleum Sci. Bull. 01, 31–45.
Dai, R., Zhang, F., and Liu, H. (2016). Seismic inversion based on proximal objective function optimization algorithm. Geophysics 81 (5), R237–R246. doi:10.1190/geo2014-0590.1
Liu, Z. S., and Sun, Z. D. (2015). New brittleness indexes and their application in shale/clay gas reservoir prediction[J]. Petroleum Explor. Dev. 42 (1), 117–124.
Luan, X., Di, B., Wei, J., Li, X., Qian, K., Xie, J., et al. (2014). Laboratory measurements of brittleness anisotropy in synthetic shale with different cementation[C] in Proceeding of the 2014 SEG Annual Meeting (Denver: Society of Exploration Geophysicists), 3005–3009.
Makowitz, A., and Milliken, K. L. (2003). Quantification of brittle deformation in burial compaction, frio and mount simon formation sandstones. J. Sediment. Res. 73 (6), 1007–1021. doi:10.1306/051003731007
Mukerji, T., Avseth, P., Mavko, G., Takahashi, I., and González, E. F. (2001). Statistical rock physics: Combining rock physics, information theory, andgeostatistics to reduce uncertainty in seismic reservoir characterization. Lead. Edge 20, 313–319. doi:10.1190/1.1438938
Qin, X. Y., Wang, Z. L., and Yu, H. Y. (2016). A new shale brittleness evaluation method based on rock physics and mineral compositions[J]. Nat. Gas. Geosci., 27(10): 1924–1932.
Rickman, R., Mullen, M. J., and Petre, J. E. (2008). “A practical use of shale petrophysics for stimulation design optimization: All shale plays are not clones of the Barnett Shale[C],” in Proceeding of the SPE Technical Conference and Exhibition (Denver: Society of Petroleum Engineers).
Sun, Z. (2015). Structural features and Petroleum exploration prospective in dalongkou area of the northern Bogda mountain, xinjiang[J]. Geoscience (01), 45–53.
Wang, L., Zhang, F., Li, X-Y., Bang-Rang, D., and Zeng, L-B. (2019). Quantitative seismic interpretation of rock brittleness based on statistical rock physics. GEOPHYSICS 84, IM63–IM75. doi:10.1190/geo2018-0094.1
Xiao, H. (2015). Study on High-resolution Sequence Stratigraphy of the Permian in the South and East Margin of the Junggar Basin[D]. Beijing: China University of Geosciences.
Yin, X., and Zhang, S. (2014). Bayesian inversion for effective pore-fluid bulk modulus based on fluid-matrix decoupled amplitude variation with offset approximation. Geophysics 79 (5), R221–R232. –R232. doi:10.1190/geo2013-0372.1
Zhang, F. Q., Jin, Z. J., and Sheng, X. J. (2017). A direct inversion for brittleness index based on GLI with basic-pursuit decomposition. Chin. J. Geophys. 60 (10), 3954–3968.
The basic Bayesian formula is
where m is the model parameter. d is the actual seismic data.
The Gaussian distribution equation is given by:
Assume that Young’s modulus E and Poisson’s ratio σ obey a joint Gaussian distribution, i.e.,
where
Keywords: brittleness, Bayesian analysis, seismic inversion, seismic facies, rock physics
Citation: Liu Z, Zhang J, Sun Y, Yu Z and Ren R (2023) A new Bayesian-based brittleness prediction method for the Pingdiquan formation in the Eastern Shiqiantan depression of the East Junggar Basin. Front. Earth Sci. 11:1163938. doi: 10.3389/feart.2023.1163938
Received: 11 February 2023; Accepted: 30 May 2023;
Published: 14 June 2023.
Edited by:
Yunhui Zhang, Southwest Jiaotong University, ChinaReviewed by:
Gulan Zhang, Southwest Petroleum University, ChinaCopyright © 2023 Liu, Zhang, Sun, Yu and Ren. This is an open-access article distributed under the terms of the Creative Commons Attribution License (CC BY). The use, distribution or reproduction in other forums is permitted, provided the original author(s) and the copyright owner(s) are credited and that the original publication in this journal is cited, in accordance with accepted academic practice. No use, distribution or reproduction is permitted which does not comply with these terms.
*Correspondence: Junhua Zhang, empoX3VwY0AxNjMuY29t
Disclaimer: All claims expressed in this article are solely those of the authors and do not necessarily represent those of their affiliated organizations, or those of the publisher, the editors and the reviewers. Any product that may be evaluated in this article or claim that may be made by its manufacturer is not guaranteed or endorsed by the publisher.
Research integrity at Frontiers
Learn more about the work of our research integrity team to safeguard the quality of each article we publish.