
94% of researchers rate our articles as excellent or good
Learn more about the work of our research integrity team to safeguard the quality of each article we publish.
Find out more
METHODS article
Front. Earth Sci., 23 March 2023
Sec. Environmental Informatics and Remote Sensing
Volume 11 - 2023 | https://doi.org/10.3389/feart.2023.1163187
This article is part of the Research TopicMechanisms and Early Warning Strategies of Geotechnical DisastersView all 13 articles
 Ying-hao Lou1,2
 Ke-gang Li2,3*
Rockburst disasters always have a great influence on engineering practice. In order to accurately predict the occurrence of rockburst hazards, this paper proposes a rockburst rating evaluation method based on principal component analysis (PCA) and the catastrophe progression method, taking into account several influencing factors. In this paper, 15 indicators, such as strength brittleness factor (R), stress factor (P), and rock quality index (RQD) (reflecting the strength and fragmentation degree of rock mass), were selected from seven samples and were analyzed and downscaled by principal component analysis. Combined with the catastrophe progression method, each layer index was dimensionless and normalized to determine the mutation level value of each layer. Based on the principle of complementarity or non-complementarity, to determine the total mutation level value, the layer index was used to divide the rockblast-level interval and predict the rockblast level. The results show that the method proposed in this paper can be used to not only distinguish the importance of each of the same level of indicators but also avoid the impact of superimposed factor correlations between the same level of indicators, making the results more objective. This paper presents accurate rock explosion assessment results and an actual engineering situation. The number of factors affecting the assessment of the rock explosion level provides new insights.
Many engineering geological disasters have been encountered in modern engineering, such as tailings dam break (Wang et al., 2022a; Wang et al., 2022b; Wang et al., 2019; Lin et al., 2022) and rockburst. A rockburst is a complex rock destabilization phenomenon affected by a variety of factors. A rockburst occurs with a strong destructive force, and rockburst hazards occur with sudden changes. During underground excavation, in a high-stress environment, the sudden unloading of energy from hard rocks can lead to the ejection of peripheral rocks, causing serious damage to equipment and engineers (Rehman et al., 2021). The severity of damage caused by rockbursts can be affected by factors such as excavation depth and stress levels (Naji et al., 2019), and the prediction of rockburst hazards becomes particularly important.
Rockburst hazard predictions can be broadly divided into two types—single-indicator and multiple-indicator—while the prediction of indicators of multiple factors can determine various factors of rockburst occurrence, making the discrimination more comprehensive. Using the maximum shear stress in the surrounding rock, uniaxial compressive strength and six other indicators were combined with the principles of the principal component analysis and probabilistic neural network analysis of multiple rockburst cases to predict the level of rock bursts (WU et al., 2018). Considering the fuzzy nature of rockburst grading predictions, combined with an SOFM (self-organizing feature mapping) neural network, a rockburst prediction model was established (YANG et al., 2021). CNNs (convolutional neural networks) were combined with LSTM (long short-term memory) to first predict the future state of the rockburst indicator eigenvolume, and this was then combined with the particle swarm algorithm to optimize the generalized neural network to predict the future state of the rockburst level (LIU et al., 2021a). Principal component analysis and the fuzzy integrated evaluation method were used for rockburst prediction (PU et al., 2018). These methods are multi-indicator rockburst comprehensive evaluation methods that take into account uncertainties in rockburst predictions, and they include the interval fuzzy comprehensive evaluation method (WANG et al., 2019), fuzzy object element model (WANG et al., 2015), and attribute recognition model (He et al., 2020). There are also some better but not used methods for rockburst prediction such as real-time prediction using GA-BP neural networks (Wu et al., 2022).
In summary, numerous researchers have refined the theory of rockburst predictions from different perspectives. However, most of the existing literature on rockburst predictions only takes into account a few factors affecting the occurrence of rockbursts or only takes into account the random nature of the occurrence of rockbursts and does not combine this irregularity and the occurrence of a variety of factors affecting rockburst hazards, so rockburst predictions are limited. As the occurrence of rockbursts is usually irregular and uncertain, and there is a certain degree of ambiguity and randomness in the process of taking and evaluating rockburst indicators (LIANG and Guoyan, 2021), rockburst predictions should be combined with the conditions of rockburst occurrences and the problem of non-linearity of data between samples and indicators. The catastrophe progression method cited in this paper does not need to assign weights to the indicators, which greatly reduces the subjectivity of the judging system and makes the results more scientific; but the catastrophe progression method does need to differentiate the importance of indicators at the same level, so this paper uses principal component analysis to assist in the evaluation. The catastrophe progression method mostly uses a low-dimensional data model, and under the influence of multiple indicators, the dimensionality of indicators is reduced by principal component analysis, and the dimensionality is reduced to several composite variables to replace the original multiple variables, so as to meet the needs of the catastrophe progression method model, ensuring more objective results.
The occurrence of rock blasts is subject to a variety of factors acting together. As a result, the impact of rock blast occurrences is far-reaching. In order to eliminate the impact of superimposed factors between the same level of indicators, so that they are independent of each other while reflecting the information contained in the original data, the number of variables is reduced, but the main information is also highlighted, simplifying the relationship between indicators. Principal component analysis is widely used to reduce the dimensionality of data, mainly using linear algebra methods and theories to discover the most important parts of the data, and is used to replace the original data, so that the original data are moved into a new independent comprehensive dataset (LIU et al., 2021b). That is, a small number of uncorrelated quantities relative to the original data sample carry enough information to reflect the information about the process operating conditions contained in a large number of process variables (LIANG et al., 2016). That is, the potential data aggregation of the predictors can be analyzed by principal component analysis (Wang et al., 2023), as in the following equation:
The basic steps of principal component analysis are as follows:
(1) For the matrix X:
Normalization of the input sample data:
where
(2) Calculation of the symmetric matrix of correlation coefficients after normalization:
Calculation of correlation coefficients between variables
(3) Finding the eigenvalues and eigenvectors of R:
(4) Calculation of the main element:
(5) Calculation of the contribution rate and cumulative contribution rate of each principal component:
The catastrophe progression method is a comprehensive evaluation method developed on the basis of mutation theory. Mutation types exist in theory in many ways, but for reasons such as normalization, the values are too small to be ignored when the number of control variables exceeds five (CUI and Shasha, 2022). The catastrophe progression method is based on the potential function, and the evaluation indexes are dimensionless. Each index is then integrated from a low level to a high level, and for the same index, the principle of integrated evaluation is adopted to find out the value of each level affiliation function separately. The total affiliation value is calculated using a normalization formula.
(1) Determination of the mutation model:
The selected target is analyzed to determine the desired mutation model. There are five main models of mutation that are commonly used (Zhang et al., 2018a; Zhang et al., 2018b; LUO et al., 2018), which are shown in Table 1.
(2) Dimensionless processing of parameter indicators:
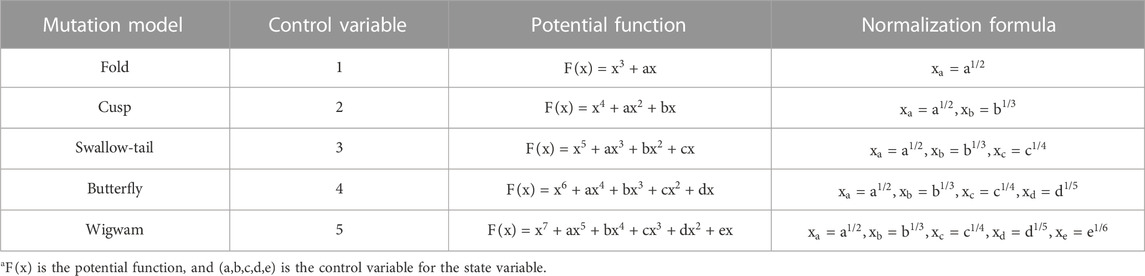
TABLE 1. Common mutation models.
The comprehensive evaluation indicators can be divided into two types: positive indicators and negative indicators. With positive indicators, the larger the data, the better the predictions will be; with negative indicators, the smaller the data, the better the predictions will be. Positive and negative indicators are calculated as shown in Eqs 11, 12, respectively:
Here,
(3) Calculation of mutation-level values.
The values obtained using the normalization formula for different indicators of the same control variable can take three principles: the principle of complementarity, the principle of non-complementarity, and the principle of complementarity after over-queuing. The first two principles are used in this paper, and the formulas for the principle of complementarity and the principle of non-complementarity are as follows:
Here, X is the state variable and (
In this paper, 15 variable indicators and seven sets of data are selected from three aspects of lithology conditions, stress conditions, and surrounding rock conditions to construct an evaluation model (LIANG, 2004; JIANG et al., 2010; Qi-tao et al., 2014; Yu, 2016; LI et al., 2020), as shown in Figure 1.
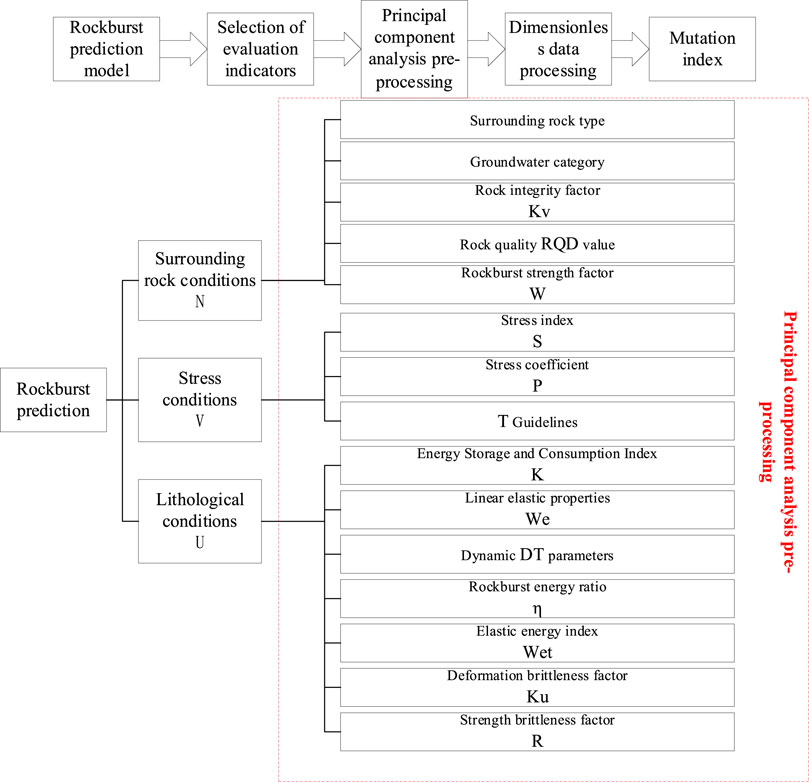
FIGURE 1. Overall evaluation system.
The main steps of the rockburst evaluation are as follows:
(1) Principal component analysis is used at the same level to reduce the dimensionality of the impact factor indicators while dividing several principal components.
(2) Dimensionless processing of the data is performed, and the desired mutation model is selected according to the number of indicators.
(3) The reduced-dimensional indicators are ranked according to the absolute value of the coefficients of the principal component score matrix and then brought into the mutation model for calculation.
(4) Mutation-level values for each level are calculated to determine the total mutation-level values according to the principles of complementarity and non-complementarity.
(5) The resulting value of the total mutation level is used to divide the rockburst grade interval and compare it with the actual project.
Lithological conditions mainly include strength brittleness factor R, deformation brittleness factor Ku, elastic energy index Wet, rockburst energy ratio η, dynamic DT parameters, linear elastic properties We, and energy storage and consumption index K. Stress conditions mainly include T guidelines, stress coefficient P, and stress index S. Surrounding rock conditions mainly include rockburst strength factor W, rock quality RQD value, rock integrity factor Kv, groundwater category, and surrounding rock type (where the types of surrounding rock were I, II, III, IV, and V, and the groundwater categories were gushing water, line flow, dripping water, and no groundwater).
To validate the model, the data of selected indicators are shown in Table 2.
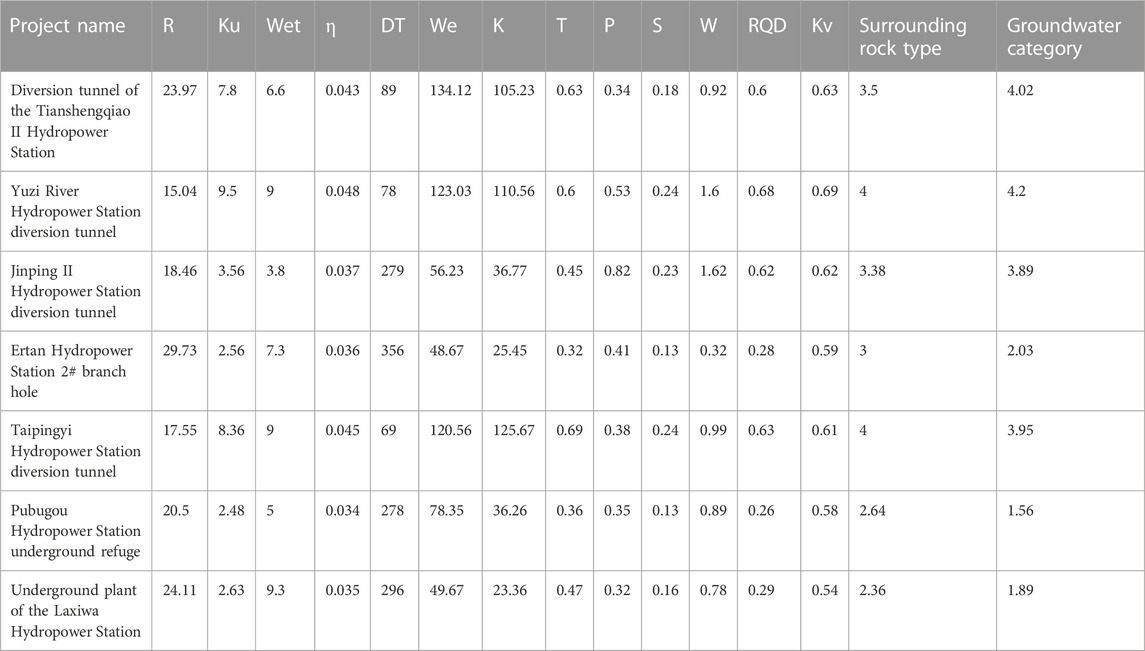
TABLE 2. Rockburst evaluation indexes of each project.
Taking the stress condition as an example for principal component analysis, the original data were standardized before conducting the principal component analysis. The results are shown in Table 3.

TABLE 3. Total variance interpretation.
Two principal components, F2 and F3, were extracted, generally taking indicators with loadings greater than 0.7, from which it can be concluded that the extracted principal component F2 includes T guidelines and stress index S. Principal component F3 includes stress coefficient P. The ranking of the indicators under the principal components by the magnitude of the absolute value of the coefficients of the principal component score matrix is derived from the principal component F1: T guidelines > stress index S. The numerical results are shown in Tables 4, 5.
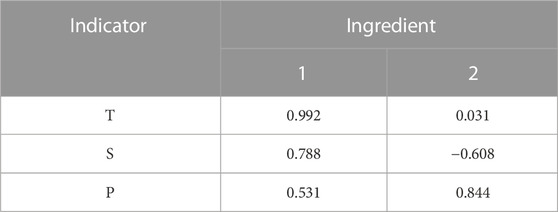
TABLE 4. Component matrix.
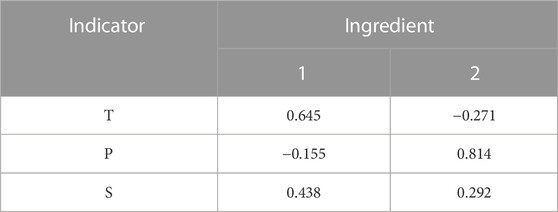
TABLE 5. Component score coefficient matrix.
Principal component F3 has only one indicator, so sorting is not necessary. The rockburst evaluation system is shown in Figure 2.
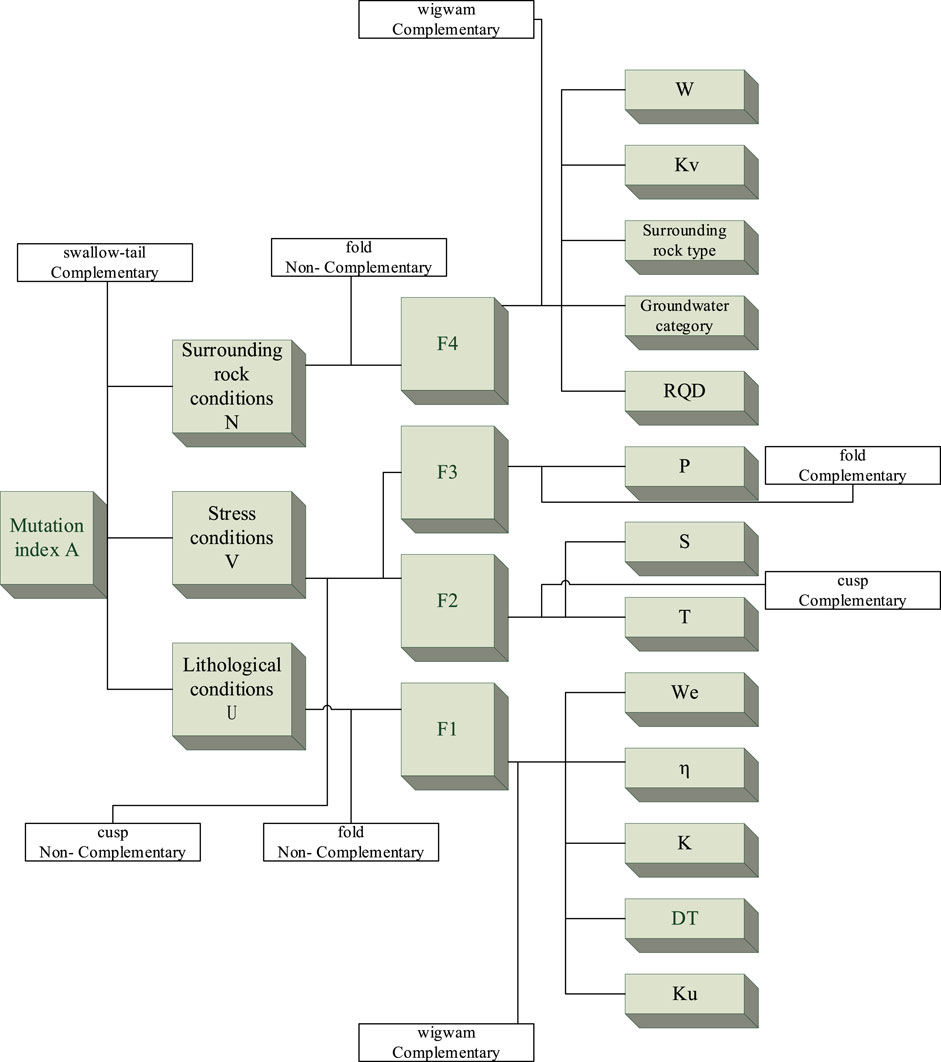
FIGURE 2. Rockburst evaluation system of the principal component analysis–catastrophe progression method.
(1) Determination of third-level catastrophe-level values
The determination of the catastrophe-level values first requires dimensionless processing of the raw data. The original data is dimensionless and processed according to Eqs 11, 12. Due to the limited space of the article, this paper selects the indicators of the Tianshengqiao II Hydropower Station Diversion Tunnel to specify the catastrophe-level value method. The processed data are shown in Table 6.
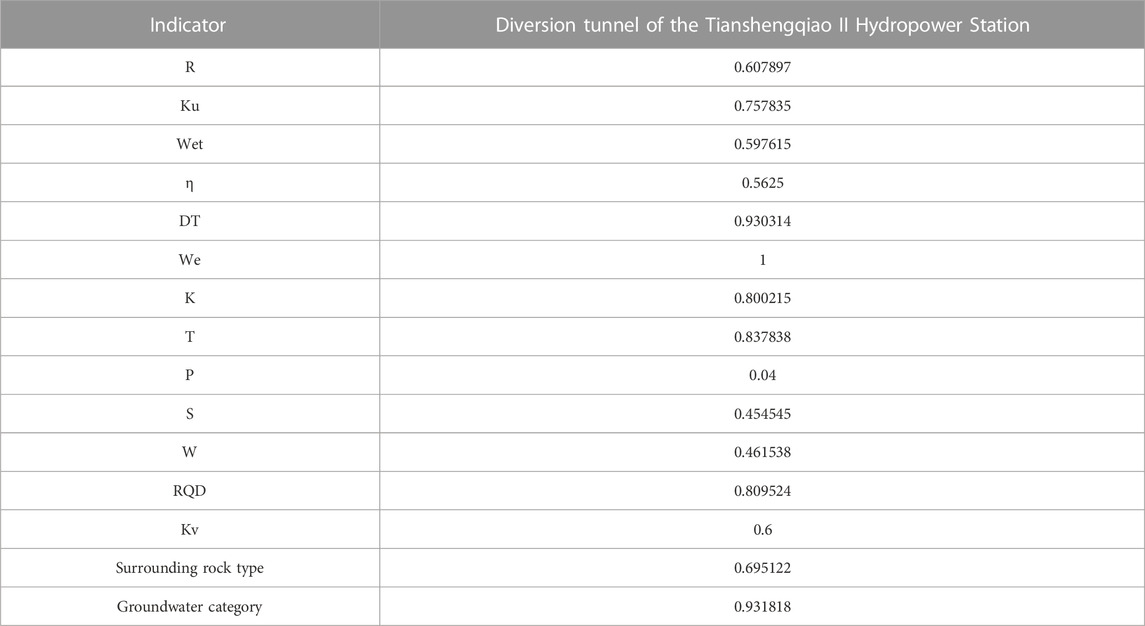
TABLE 6. Data after dimensionless processing.
Normalization of dimensionless processed data: Taking the stress condition as an example, two indicators, T and S, under F2 are used to select the normalized formula for the cusp, and one variable, P, under F3 is used to select the fold:
The complementarity principle is satisfied under the F2 condition, and catastrophe-level values of F2 are calculated according to Eq. 13:
Only one indicator exists under the F3 condition, from which the mutation level can be derived:
Similarly, calculated under the lithology condition, five indicators exist under the F1 condition, and the normalized formula for the Wigwam is calculated in turn as follows:
The F1 condition satisfies the principle of complementarity, and the catastrophe-level values in F1 are calculated:
Calculated under the surrounding rock conditions and under the same lithological conditions, there are five indicators, according to the complementary principle, used to calculate the mutation level of F4:
The calculated data for all the indicators of the seven projects are shown in Table 7.
(2) Determination of the second-level catastrophe-level values and first-level catastrophe-level values.
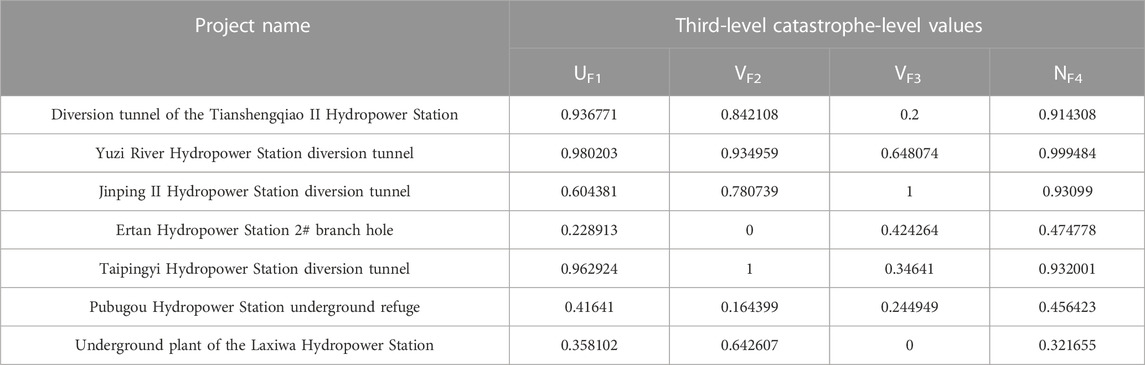
TABLE 7. Third-level catastrophe-level values of each project.
According to the aforementioned calculation process, the second-level catastrophe-level values can be calculated, and the specific data are shown in Table 8.
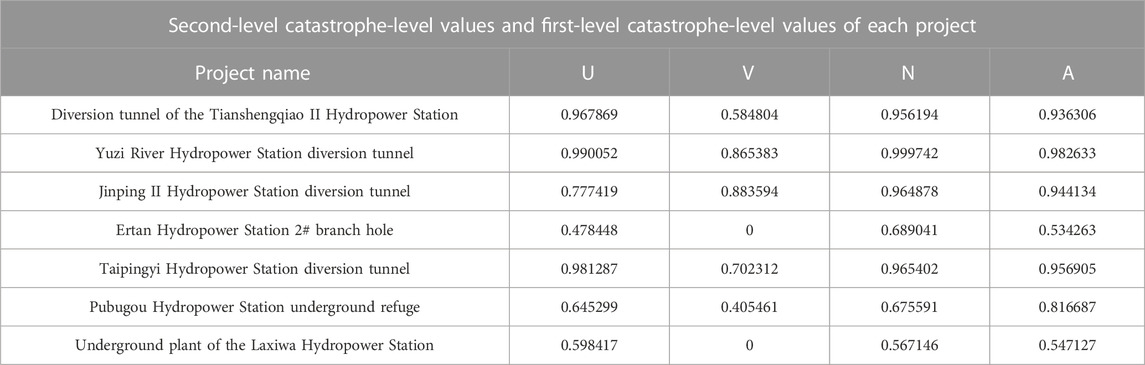
TABLE 8. Second-level catastrophe-level values and first-level catastrophe-level values of each project.
Under the stress condition, there are two variables, F2 and F3, that need to be accounted for, according to the principle of non-complementarity. The second-level catastrophe-level values are derived according to Eq. 14:
The second-level catastrophe-level values are calculated in the same way for the surrounding rock conditions and lithology conditions. The first-level catastrophe-level values are calculated by applying swallow-tail to lithological conditions, stress conditions, and envelope conditions and can be calculated according to the principle of complementarity:
The first-level catastrophe-level values are calculated by satisfying the complementarity principle:
Table 9 shows the actual grade of the project rock explosion. According to Tables 8, 9, the sample rockburst total mutation-level value (A) is the horizontal coordinate and the actual occurrence level of rockburst is the vertical coordinate. The scatter plot is shown in Figure 3.
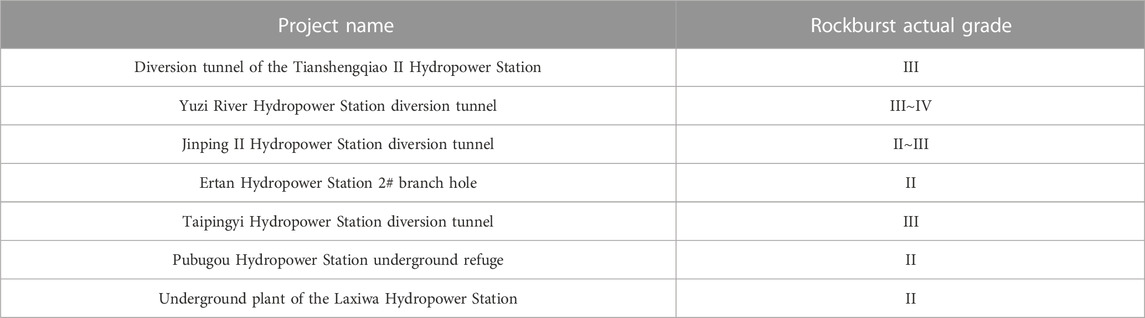
TABLE 9. Sample rockburst actual grade.
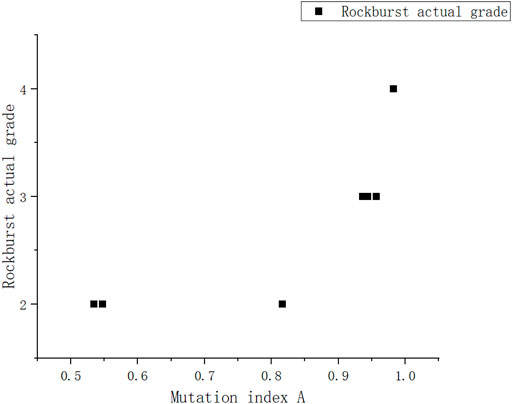
FIGURE 3. Mutation value and rockburst level relationship.
As shown in Figure 3, rockbursts are divided into four intervals: level I [0, 0.5], level II [0.5, 0.82], level III [0.82, 0.96], and level IV [0.96, 1.00].
In order to verify the accuracy of the model, the actual rockblast data on the Baihetan Hydropower Station from the literature (Dong et al., 2018) were brought into the model for verification, and the results are shown in Table 10. It can be seen that the actual rockblast level compared with the sample is consistent.
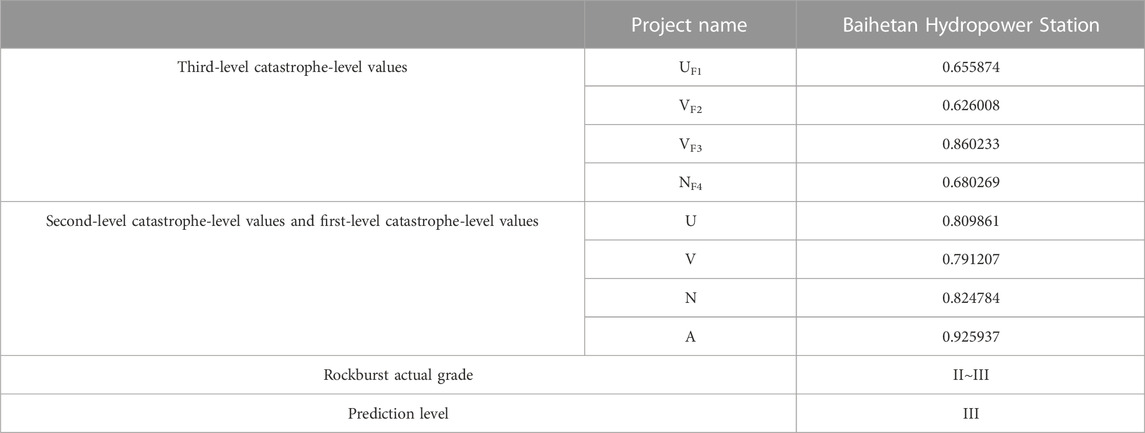
TABLE 10. Rockburst level prediction.
1 According to the literature (LI et al., 2022), compared to the matter–element extension model rockburst prediction method, although the results of the actual rockburst level of the Baihetan Hydropower Station were validated to be consistent, the method proposed in this paper based on principal component analysis does not use subjective assignment to give the appropriate weight to the influencing factors, but rather a number of variables to reduce the dimensionality of the variables in line with the basic model of the catastrophe progression method. It overcomes subjective thinking and is more convincing.
2 To a certain extent, the method proposed in this paper requires more accurate engineering practice data and data on various factors affecting rock bursts in actual engineering. If the data are incomplete, variations in results arise, so this method has some limitations. In addition to relying on accurate data, it is also necessary to process a large number of data, which will also affect the accuracy of the results in engineering practice.
1 In this paper, considering various factors affecting rockbursts, the variable dimension reduction based on the principal component analysis method meets the basic model requirements of the catastrophe progression method, and through the combination of the two methods, the defects of general fuzzy algorithm are reduced, the accuracy of calculation results is satisfied objectively, and the subjectivity in data processing is overcome.
2 The seven typical rockburst engineering examples based on this analysis and a comprehensive dataset of rockburst engineering examples to test the feasibility of the improved sudden change level method model for rockburst predictions show that it can be used for rockburst ratings. Finally, the accuracy of the model can be illustrated by establishing four rockburst grade intervals (level I [0, 0.5], level II [0.5, 0.82], level III [0.82, 0.96], and level IV [0.96, 1.00]) based on total mutation grade A.
The original contributions presented in the study are included in the article/Supplementary Material; further inquiries can be directed to the corresponding author.
Y-hL: writing—original draft, data curation, and methodology. K-gL: writing—review and editing.
The authors declare that the research was conducted in the absence of any commercial or financial relationships that could be construed as a potential conflict of interest.
The handling editor GW declared a shared affiliation with the authors YL and KL.
All claims expressed in this article are solely those of the authors and do not necessarily represent those of their affiliated organizations, or those of the publisher, the editors, and the reviewers. Any product that may be evaluated in this article, or claim that may be made by its manufacturer, is not guaranteed or endorsed by the publisher.
Cui, Tiejun, and Shasha, L. I. (2022). Method of determining system fault state level based on catastrophe progression and im-proved ahp. Saf. Environ. Eng. 03, 23–28. doi:10.1016/S1674-5264(09)60080-6
Dong, Y., Pei, X., Zhang, Y., Liang, Y., and Xi, Z. (2018). Prediction of rock burst-based on combination weighting and cloud model theory. Chin. J. Undergr. Space Eng. 14 (S1), 409–415. doi:10.1016/S1003-6326(16)64313-3
He, Y. F., Li, T. B., and Cao, H. Y. (2020). Attribute recognition model of fatalness assessment of rockburst in tunnel construction and its application. Hydrogeology Eng. Geol. 47 (2), 102–111. doi:10.16030/j.cnki.issn.1000-3665.201908002
Jiang, Q., Feng, X., Su, G., and Chen, G. (2010). Stability analysis of large underground caverns in Laxiwa hydropower plant under high crustal stress. J. Hydroelectr. Eng. 29 (5), 132–140.
Li, J., Zhou, Z. H., and Ding, W. J. (2022). Prediction of rock burst proneness based on principal component matter-element extension model. Industrial Minerals Process. 51 (5), 7–12. doi:10.1016/j.ijrmms.2015.02.004
Li, M., Li, K., Qin, Q., Wang, T., Zhang, X., and Liu, Y. (2020). Judgment model of rock burst tendency based on improved combination weighting-TOPSIS method. J. Saf. Sci. Technology 16 (03), 74–80. doi:10.11779/CJGE201806013
Liang, Q., Han, H., Cui, X., and Gu, B. (2016). Fault diagnosis for refrigeration system based on PCA-PNN. CIESC J. 67 (03), 1022–1031. doi:10.11949/j.issn.0438-1157.20151301
Liang, W., and Guoyan, Z. H. A. O. (2021). A review of research on long-term and short-term rockburst risk evaluation in deep hard rock. Chin. J. Rock Mech. Eng. 29, 1–21. doi:10.1007/s11053-020-09664-w
Liang, Zhiyong (2004). Study on the prediction and prevention of rockburst in the diversion tunnel of JinPing 1 hydropower. Chengdu, China: Chengdu University of Technology.
Lin, S., Wang, G., Liu, W., Zhao, B., Shen, Y., Wang, M., et al. (2022). Regional distribution and causes of global mine tailings dam failures. Metals 12 (6), 905. doi:10.3390/met12060905
Liu, H., Xu, F., and Liu, B. (2021). Time-series prediction method for risk level of rockburst disaster based on CNN-LSTM. J. Central South Univ. Technol. 52 (3), 659–670. doi:10.1155/2019/7343784
Liu, X., Zhang, X., and Yang, W. (2021). Rockburst prediction based on pca-svm. China Min. Mag. 2021 (07), 176–180. doi:10.1155/2021/7968730
Luo, Z., Kui, L. I., An, Y., Li, H., and Fu, W. (2018). Risk assessment of gas explosion based on improved catastrophe progression method. Saf. Coal Mines 49 (06), 246–250. doi:10.3390/pr11020554
Naji, A. M., Rehman, H., Emad, M. Z., Ahmad, S., Kim, J., and Yoo, H. (2019). Static and dynamic influence of the shear zone on rockburst occurrence in the headrace tunnel of the neelum jhelum hydropower project, Pakistan. Energies 12, 2124. doi:10.3390/en12112124
Pu, Y., Apel, D., and Xu, H. (2018). A principal component analysis/fuzzy comprehensive evaluation for rockburst potential in kimberlite. Pure Appl. Geophys. 175 (6), 2 141–142 151. doi:10.1007/s00024-018-1790-4
Qi-tao, P. E. I., Hai-bo, L. I., Liu, Y. Q., and Guo-kai1, Z. H. A. N. G. (2014). A grey evaluation model for predicting rockburst proneness based on combination weight and its application. Rock Soil Mech. 35 (S1), 49–56. doi:10.1155/2019/3453614
Rehman, H., Naji, A. M., Nam, K., Ahmad, S., Muhammad, K., and Yoo, H. K. (2021). Impact of construction method and ground composition on headrace tunnel stability in the neelum–jhelum hydroelectric project: A case study review from Pakistan. Appl. Sci. 11, 1655. doi:10.3390/app11041655
Wang, C. L., Wu, A., Xiaohui, L., Lu, H., and Liu, X. (2015). Predicting rockburst tendency based on fuzzy matter-element model. Int. J. Rock Mech. Min. Sci. 75, 224–232. doi:10.1016/j.ijrmms.2015.02.004
Wang, G., Tian, S., Hu, B., Xu, Z., Chen, J., and Kong, X. (2019a). Evolution pattern of tailings flow from dam failure and the buffering effect of debris blocking dams. Water, 11, (11), 2388–2401. doi:10.3390/w11112388
Wang, G., Zhao, B., Lan, R., Liu, D., Wu, B., Li, Y., et al. (2022). Experimental study on failure model of tailing dam overtopping under heavy rainfall. Lithosphere, 2022, 5922501. doi:10.2113/2022/5922501
Wang, G., Zhao, B., Wu, B., Wang, M., Liu, W., Zhou, H., et al. (2022). Research on the macro-mesoscopic response mechanism of multisphere approximated heteromorphic tailing particles. Lithosphere 2022 (10), 1977890. doi:10.2113/2022/1977890
Wang, G., Zhao, B., Wu, B., Zhang, C., and Liu, W. (2023). Intelligent prediction of slope stability based on visual exploratory data analysis of 77 in situ cases. Int. J. Min. Sci. Technol. 33 (1), 47–59. doi:10.1016/j.ijmst.2022.07.002
Wang, X., Li, S., Xu, Z., Hu, J., Li, Z., and Zhang, B. (2019b). An interval fuzzy comprehensive assessment method for rock burst in underground caverns and its engineering application. Bull. Eng. Geol. Environ., 78(7):5161–5176. doi:10.1007/s10064-018-01453-3
Wu, S., Zhao, G., and Wu, B. (2022). Real-time prediction of the mechanical behavior of suction caisson during installation process using GA-BP neural network. Eng. Appl. Artif. Intell. 116, 105475. doi:10.1016/j.engappai.2022.105475
Wu, S., Zhang, C., and Chengzi, Q. (2018). Prediction of intensity classification of rockburst based on PCA-PNN principle. J. China Coal Soc. 44 (09), 2767–2776. doi:10.13225/j.cnki.jccs.2018.1519
Yang, Xiaobin, Pei, Yanyu, Cheng, Hongming, Hou, Xin, and Lv, Jiaqi (2021). Prediction method of rockburst intensity grade based on SOFM neural network model. Chin. J. Rock Mech. Eng. 40 (S1), 2708–2715.
Yu, Qun (2016). Study on rockburst Nucleation process and Early Warning method of Deep-buried Tunnels. Dalian, China: Dalian University of Technology.
Zhang, H., Qiu, B., Tang, M., and He, M. (2018). Risk assessment model of agricultural products cold chain logistics based on the improved catastrophe progression method. J. Syst. Eng. 33 (03), 412–421. doi:10.1108/imds-03-2016-0098
Keywords: principal component analysis, catastrophe progression method, rockburst classification, prediction, multi-factor, predictive models
Citation: Lou Y-h and Li K-g (2023) A rockburst grade evaluation method based on principal component analysis and the catastrophe progression method. Front. Earth Sci. 11:1163187. doi: 10.3389/feart.2023.1163187
Received: 10 February 2023; Accepted: 03 March 2023;
Published: 23 March 2023.
Edited by:
Guangjin Wang, Kunming University of Science and Technology, ChinaReviewed by:
Peng Shoujian, Chongqing University, ChinaCopyright © 2023 Lou and Li. This is an open-access article distributed under the terms of the Creative Commons Attribution License (CC BY). The use, distribution or reproduction in other forums is permitted, provided the original author(s) and the copyright owner(s) are credited and that the original publication in this journal is cited, in accordance with accepted academic practice. No use, distribution or reproduction is permitted which does not comply with these terms.
*Correspondence: Ke-gang Li, MTA2MTQ2MTM1QHFxLmNvbQ==
Disclaimer: All claims expressed in this article are solely those of the authors and do not necessarily represent those of their affiliated organizations, or those of the publisher, the editors and the reviewers. Any product that may be evaluated in this article or claim that may be made by its manufacturer is not guaranteed or endorsed by the publisher.
Research integrity at Frontiers
Learn more about the work of our research integrity team to safeguard the quality of each article we publish.