- 1College of Civil Engineering and Architecture, Xinjiang University, Urumqi, China
- 2Turpan Nenghui New Energy Company, Turpan, China
This paper takes a groundwater source heat pump in the region as the research object and based on field research, experimental tests combined with comparative analysis, the data on its operation is monitored and analyzed in terms of operation, energy saving, and environment. The results show that the cooling temperatures of the test rooms were all below 26°C, the average coefficient of performance of the units was 4.61–4.93 and the average coefficient of performance of the system was 3.08–3.27. In addition, compared to conventional water-cooled chillers, 466 tons of standard coal could be saved in one cooling season, resulting in a reduction of 1,150.8 tons of carbon dioxide emissions, 9.3 tons of sulfur dioxide emissions and 4.7 tons of dust emissions The savings in operating costs are 793,000 RMB. This shows that the groundwater source heat pump has good energy efficiency and economy. The research results obtained in this paper provide a reference for improving energy efficiency and optimizing the operation of the groundwater source heat pump system. It is of great significance to the application of groundwater source heat pump systems in areas with complex geological environments.
1 Introduction
The richer the water content of the site in the complex geological distribution area, the better the water conductivity, the greater the thermal conductivity of the rock mass, and the more conducive to improving the heat transfer effect (Liu et al., 2020a). But at the same time, there are more factors that affect development. According to DZ/T 225-2009 Code for Exploration and Evaluation of Shallow Geothermal Energy, the suitability zoning of shallow geothermal energy water source heat pump mainly considers the lithology, distribution, burial depth, thickness, water abundance, permeability, water temperature, water quality, water level dynamic changes, water source protection, and geological disasters of the aquifer (Zhou et al., 2022c).
The groundwater source heat pump system is a heat pump technology that uses groundwater as a low-level heat source or sinks to heat and cool buildings in winter and summer respectively (Ma et al., 2010). As a branch of ground source heat pumps, it is known as a 21st-century technology characterized by energy saving and environmental protection, and it plays an indispensable role in achieving China’s “double carbon” target, reducing energy consumption, and protecting the ecological environment.
As early as the 1940s, the application of the groundwater source heat pump system in public buildings in the United States, whereas the development in China occurred somewhat later. The associated technologies of groundwater source heat pumps were not developed and deployed in China until the 1950s, and in the 1980s, groundwater source heat pump technology research progressed gradually (Peng, 2013). Up till now, the ground source heat pump technology has been quite developed, with a great number of engineering projects domestically and internationally, the technology has been widely adopted and promoted (Sanner et al., 2003; Liu et al., 2020b; Li et al., 2021a; Biglia et al., 2021; Gao et al., 2021; Sang et al., 2022). The impacts of various parameters on the performance of the groundwater source heat pump system were investigated in Kim and Nam, (2016). The results show that the groundwater level and temperature have the greatest impact on the performance of the groundwater source heat pump system, followed by submersible pumps and heat exchangers (Kim and Nam, 2016). Moreover, factors such as water flow rate (Zhou et al., 2022a), performance parameters (Sang et al., 2022), porous medium (Na and Xia, 2021), layout of pumping and recharge wells (Wen et al., 2022; Yan et al., 2023) and pipe corrosion (Luo et al., 2022) play significant role. Obviously, a great number of researchers also offer optimization strategies for groundwater source heat pump systems (Nam and Ooka, 2010; Lu et al., 2015; Zhu et al., 2015; Zhen et al., 2017; Liu et al., 2019; Li et al., 2021b; Zhang et al., 2022). Park et al. (2020) developed an optimization model of groundwater source heat pump, which can calculate the optimal pumping and irrigation speed of groundwater source heat pump system, maximize system efficiency, and have excellent economic and environmental benefits. Zhou et al. (2022b) proposed recycling groundwater, and the results shown that the performance of groundwater source heat pump systems could be greatly enhanced and water wasted minimized. Park et al. (2021) proposed a simulation optimization approach, a model that can determine the optimal well location and pump/injection rate to find the best installation and operation strategy for the system. Halilovic et al. (2022) proposed a strategy for optimizing the hair of the well layout of groundwater source heat pump systems to maximize the utilization of thermal potential of groundwater. Zhou et al. (2022a) investigated the economics of ground source heat pump systems with various flow control methods and highlighted the significance of variable flow regulation methods for enhancing thermal and economic performance. Luo and Ma, (2022) proposed an integrated management strategy for system operation that significantly improved thermal efficiency and coefficient of performance in comparison to the conventional model. Granryd, (2010) derived a relational equation for the optimal flow rate, on the basis of which the evaporator and condenser flow rates were optimized to maximize the COP of the system. Zhao et al. (2003) established an optimization mathematical model with economic cost as the objective function, according to which the optimal matching is obtained between each component of the system, resulting in a significant improvement in heat pump performance. Kang et al. (2017) investigated a new groundwater source heat pump system optimization method to make the system more energy efficient and demonstrated that the compressor power was reduced, the system’s energy efficiency was enhanced, and the total annual cost was reduced compared to the conventional groundwater source heat pump system. Wang et al. (2019) suggested a new groundwater source heat pump with pre-conditioner, and the study proved that the new groundwater source heat pump has excellent energy saving performance. Ma and Xia, (2017) proposed an optimization technique in which the optimization variable is the heat exchanger discharge temperature and the overall goal of the optimization is to minimize the system power consumption while meeting the required heating and cooling demands of the building. The results demonstrate that the optimization strategy is effective in reducing energy consumption.
These articles combine theory with practice, analyze the performance of the GWHP system, expound the influencing factors of system performance, and put forward the optimization model. However, there is a lack of research on the benefits of the corresponding groundwater source heat pump system. In this paper, the operation of the groundwater source heat pump system in four residential community was monitored over a 3-day period during the cooling season and the data tested to show that these systems met the design requirements. The data is also analyzed to calculate the performance coefficients of the heat pump system, to classify it according to national codes, and to provide a brief analysis of the reasons for the decline in system and unit performance. The energy-saving, environmental and economic benefits of these systems are also analyzed based on the data, revealing the energy-saving and environmental friendliness of the groundwater source heat and heat pump system. It provides a reference for improving energy efficiency and optimizing the operation of the groundwater source heat pump system. It is of great significance to the application of groundwater source heat pump systems in complex geological environment areas.
2 Project overview and testing scheme
2.1 Project overview
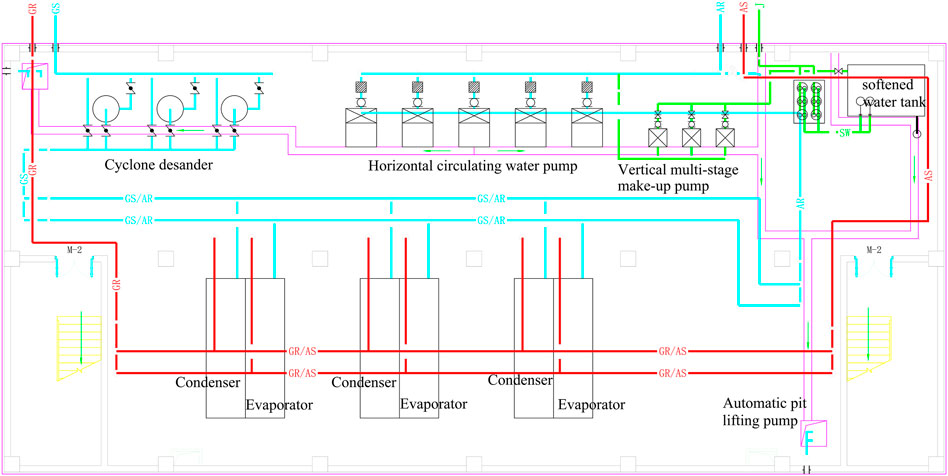
In this study, the GWHP system is located in the karst area of south China. According to the literature content (Wang et al., 2011), in the project area, the aquifer permeability coefficient is 10.42–18.17 m/d, the unit water inflow of a single well is 5.59–10.20 L/sm, the maximum recharge volume of a single well is 70 m³/h, and the groundwater recharge volume is 12,539,500 m³/a. The underground water is buried 60–115 m deep, and the temperature of the underground water is maintained at about 18°C and is not affected by the outside air temperature. The heat pump systems in the four residential communities were put into use in 2012 with an air conditioning area of approximately 116,500 m2, 135,600 m2, 187,500 m2, and 111,300 m2 respectively. The building floors in the community are five floors, with a height of 3 m and a utility room on the top floor. The owner determines the form of the building’s final heating, which is typically fan coils or radiant floor systems. The groundwater level is around −100m, and the groundwater is extracted from the ground by pumping wells, passing through a cyclone desander for preliminary water treatment, and then entering the heat pump unit for heat exchange before being returned to the ground via a recharge well (Wang et al., 2011; Hou et al., 2017; Liu et al., 2022). Figure 1 depicts the equipment room’s system flow diagram. Table 1 displays the equipment configuration and main equipment parameters.
2.2 Testing scheme
According to the requirements of the GB/T 50,801-2013 Evaluation Standards for Renewable Energy Building Application Projects (Ministry of Housing and Urban-Rural Development of the People’s Republic of China, 2013) and the Guidelines for the Measurement and Evaluation of Renewable Energy Building Application Demonstration Projects (Ministry of Housing and Urban-Rural Development of the People’s Republic of China, 2008) (hereinafter referred to as the Evaluation Standards and Guidelines) regarding the test contents of the heat pump system, the operation of the groundwater source heat pump system in these residential area was evaluated during the cooling season. The test contents mainly include inlet and outlet water temperature and water flow on the ground-source-side and the user-side, the input power of the system and water pumps, and the air temperature inside and outside of the test room. The main test instruments are shown in Table 2.
The test methods are mainly for the instrument to automatically record data and manually read real-time operational parameters at regular intervals. Use the ultrasonic flowmeter to measure the inlet and outlet flow of the ground source side and the inlet and outlet flow of the user side, and the temperature measurement system to measure the inlet and outlet water temperature of the ground source side and the inlet and outlet water temperature of the user side. The analyzer measures the power consumption of the heat pump unit and the water pump. The indoor and outdoor air temperatures were measured by a thermometer. When measuring the outdoor temperature, hang the autograph away from the building to avoid the influence of heat dissipation of the building, and avoid direct solar radiation, which will affect the accuracy of the measurement. The indoor temperature test is carried out after the heat pump system continues to operate normally, and the temperature test points are positioned 1.5 m above the ground and far away from the influence of the indoor heat source.
3 Analysis of test results
3.1 Temperature
The heat pump system provides cooling to four communities, and 10 rooms in each community were sampled for temperature and humidity testing. The sampling results show that the indoor temperature and humidity test values in each room meet the design requirements, and the cooling guarantee rate is 100%. The specific test results are shown in Figure 2.
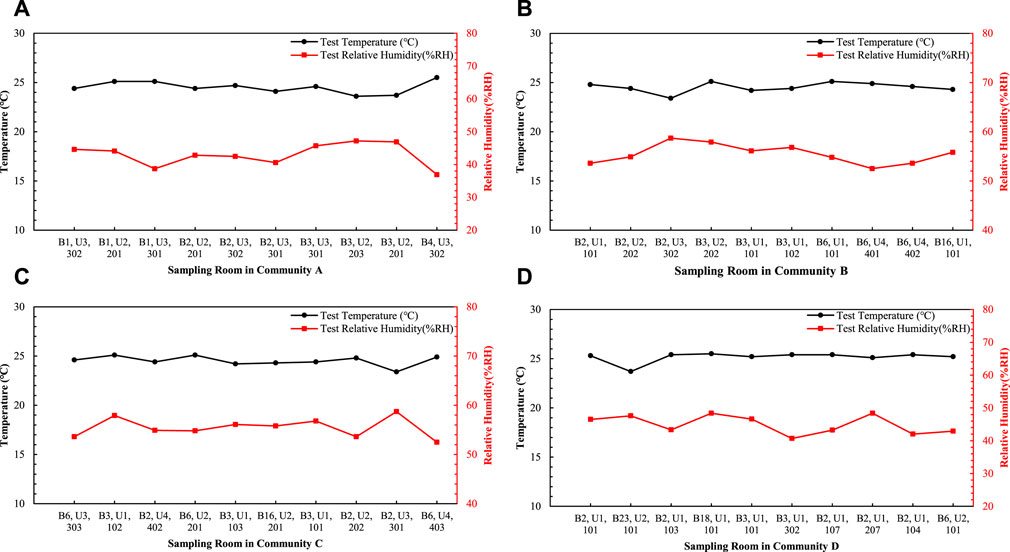
FIGURE 2. Test results for room temperature and relative humidity. (A) The temperature and humidity of the sampling room in Community A; (B) The temperature and humidity of the sampling room in Community B; (C) The temperature and humidity of the sampling room in Community C; (D) The temperature and humidity of the sampling room in Community D.
The temperature outside of the test rooms can reach a maximum of 34.5°C, and the average temperature was 25.4°C during testing. From Figure 2 it can be concluded that the average maximum indoor temperature of the test rooms is 25.5°C, which is below the design cooling requirement limit. Meanwhile, the average temperature inside of the test rooms is 24.5°C, which has a good cooling effect.
3.2 Cooling capacity and coefficient of performance
3.2.1 Heat pump unit performance test results
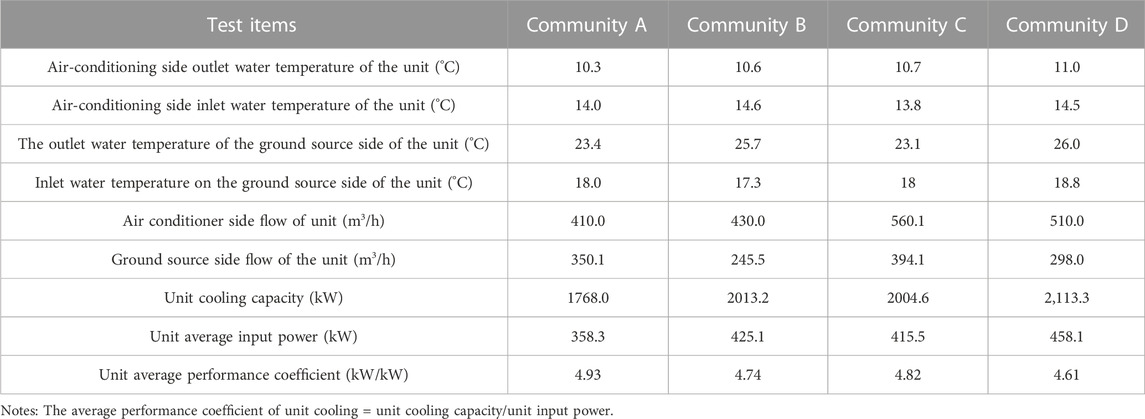
Test the water temperature and water flow of the supply and return on the ground-source-side and air-conditioning-side of the heat pump, as well as the electricity consumed by the heat pump unit during testing. And then, the average cooling capacity of the heat pump unit and the cooling performance coefficient of the heat pump unit can be calculated according to the following formula.
The average cooling capacity of the groundwater source heat pump unit during the test period is calculated as follows:
where Q is average heating (cooling) capacity of the unit during the test, V is the average flow rate of air conditioning side of heat pump unit, ρ is the average density of water, ϲ is the average constant pressure specific heat of water, Δtw is the temperature difference between the inlet and outlet water on the air-conditioning-side.
During the test period, the heating/cooling performance coefficient of the heat pump unit can be calculated according to the test results as follows:
where COP is the heating (cooling) performance coefficient of the heat pump unit, Q is average heating (cooling) capacity of the unit during the test, Ni is average input power of the unit during the test.
After measurement, the temperature changes of supply and return water on the ground-source-side and the user-side of the heat pump unit with time are derived. The specific results are shown in Figure 3. As can be seen in Figure 3, the water supply and return temperatures on the ground source and user sides of the four communities remained constant during the test. The supply and return water temperatures on the ground source side of the four communities were stable and unchanged, thus the ground source heat exchange effect was stable. The system uses a constant frequency circulation pump and the water flow rate on the user side is constant. While the temperature difference between the supply and return water on the user side of the system is constant, according to eq. 1, the cooling capacity of the unit under test is constant during the test period and the unit operates stably. In addition, the maximum temperature difference between the supply and return water on the customer side of the four systems is only 4°C, and the average temperature difference between the supply and return water is 3.7°C. It can be seen that the system adopts the “large flow rate and small temperature difference” operation mode. The corresponding “large temperature difference and small flow rate” operation mode is more conducive to reducing the system transmission and distribution energy consumption as well as improving the system energy efficiency ratio.
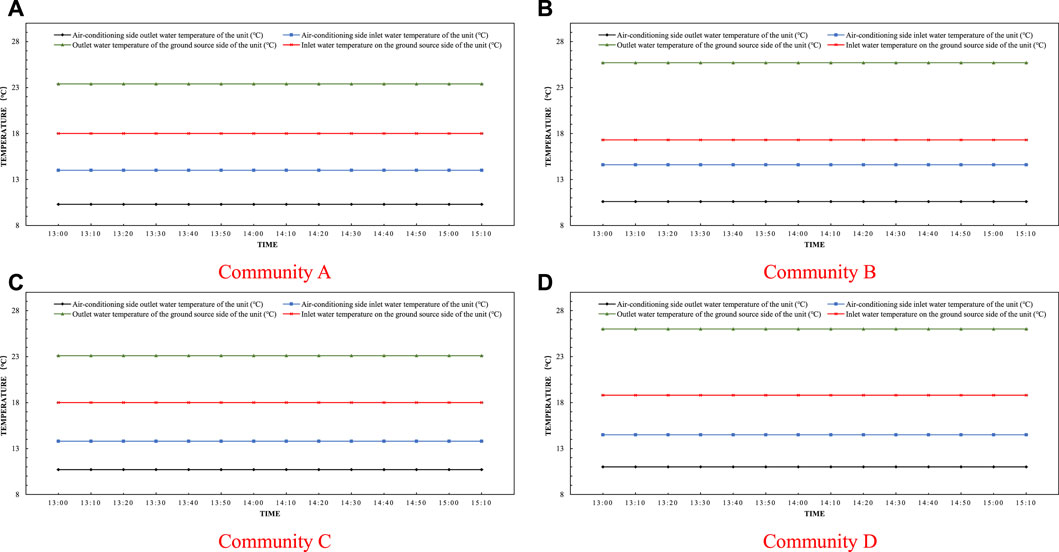
FIGURE 3. Temperature variation curves of circulating medium at ground-source-side and air-conditioning-side of heat pump unit. (A) Temperature variation curve for Community A; (B) Temperature variation curve for Community B; (C) Temperature variation curve for Community C; (D) Temperature variation curve for Community D.
According to the measured data combined with the calculation formula, the average cooling performance coefficients of the four units during the test period were 4.93, 4.74, 4.82, and 4.61 respectively, and the specific test results are shown in Table 3. Based on the information of the equipment parameters of the heat pump units in Table 1, it can be calculated that the rated cooling performance coefficient of the heat pump units can reach more than 6, while the actual operating effect is only 70%–80% of the design working condition. This may be due to the long-term operation of the equipment, the heat exchange equipment and pipes of the heat pump unit have problems such as corrosion, oxidation and scaling, resulting in the heat exchange efficiency of the heat pump unit being reduced, thus making the cooling performance coefficient of the unit not high.
3.2.2 Heat pump system performance test results
On the basis of the test results, the typical seasonal system performance coefficient of the system is calculated by the following formula:
where QS is the total heating (cooling) capacity of the system during the test, ΣNi is the total electricity consumed by the heat pump unit during the system test, ΣNj is the total power consumed by the pump during system test.
The total heating (cooling) capacity of the system during the test is calculated according to the following formula:
where qi is the cooling capacity of the heat pump system in a certain period of time, ΔTi is the duration of a period of time, Vi is the average water flow on the air-conditioning-side of the system in a certain period of time, Δti is the temperature difference between the inlet and outlet water on the air-conditioning-side in a certain period of time.
Test the water temperature, flow rate, and power consumption of the system on the air-conditioning-side of the system. From the test data, the performance coefficient of the groundwater source heat pump system is calculated. The average coefficient of performance for each system during testing was 3.08, 3.20, 3.27, and 3.08. The specific test results are presented in Table 4, and the proportion of power consumption of the system is depicted in Figure 4.
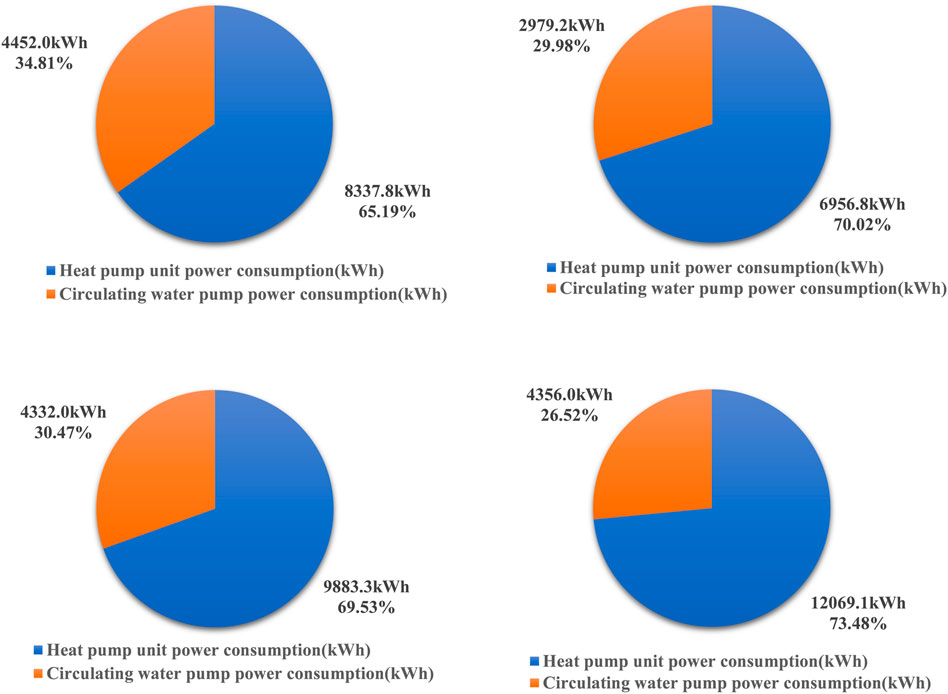
FIGURE 4. Power consumption composition proportion of heat pump system. (A) The proportion of power consumed by the heat pump system in Community A; (B) The proportion of power consumed by the heat pump system in Community B; (C) The proportion of power consumed by the heat pump system in Community C; (D) The proportion of power consumed by the heat pump system in Community D.
The calculation concludes that the average coefficient of performance of the GWHP system was 3.08, 3.20, 3.27 and 3.08 respectively, which meets the requirements of the limit value in the “Evaluation Standard” (Table 5). Furthermore, given that the “Evaluation Standard” divides the performance of the GWHP system into 3 grades (Table 6), with level 1 being the highest, the performance coefficients of the GWHP systems in the test communities all belong to Level 3. However, comparing Tables 5, 6, the performance of this groundwater source heat pump system just meets the limit value requirements and is among the lowest levels in the classification of the code. Analysis of the reasons, the system after a long time of operation, heat exchanger performance decline, compressor performance deterioration, pipeline scaling or corrosion, and other reasons, leading to the energy efficiency of the system isn’t very ideal. Nevertheless, the specific reasons for the degradation of system performance still need to be corroborated by subsequent studies.
Tested and calculated, the test of the underground water source heat pump units revealed an average performance coefficient of 4.61–4.93, the performance coefficient of 3.08–3.27 for the heat pump systems, and a system average that is 32%–38% lower than the average crew. What effect is formed by Figure 4 heat pump power consumption ratio is: the power consumption of the water pump is relatively large, accounting for about 27%–35% of the total power consumption, which leads to the reduction of the system performance coefficient.
4 Benefit analysis
4.1 Energy saving benefit analysis
Calculate the coal saving of the GWHP system in comparison to the conventional water-cooled chiller, and analyze the energy saving benefit of the GWHP system. The energy consumption of the system only includes the power consumption. The actual power consumption can be measured by a clamp-type electric power meter and a three-phase power analyzer. The conversion rate of electric energy and primary energy is taken as 0.404 (Li et al., 2023).
According to the Guidelines, the temperature-frequency method is used to calculate the cumulative annual loads of a building, based on the measured cooling loads of the system and actual meteorological parameters during testing. The so-called temperature-frequency method assumes a linear relationship between the envelope load (including solar and differential temperature loads) and the outdoor temperature, calculates the load at various temperatures based on this linear relationship, and multiplies it by the number of hours at that temperature to determine the cooling and heating loads at that temperature (Long, 1992).
The BIN weather parameter is utilized for load calculation by temperature and frequency method. The meteorological parameters are sorted out according to hourly values given by the annual outdoor dry bulb temperature or random weather model of a certain place. Taking 2°C as a temperature interval, the number of hours occurring in each temperature interval is calculated, namely, the time and frequency table of temperature (Song and Wang, 2015).
The summer building cooling load is calculated as follows:
where QOUT is building cooling load at outdoor temperature tOUT, QEJ is building cooling load at outdoor temperature tEJ, tN is building summer interior design temperature, tEJ is building summer design outdoor temperature.
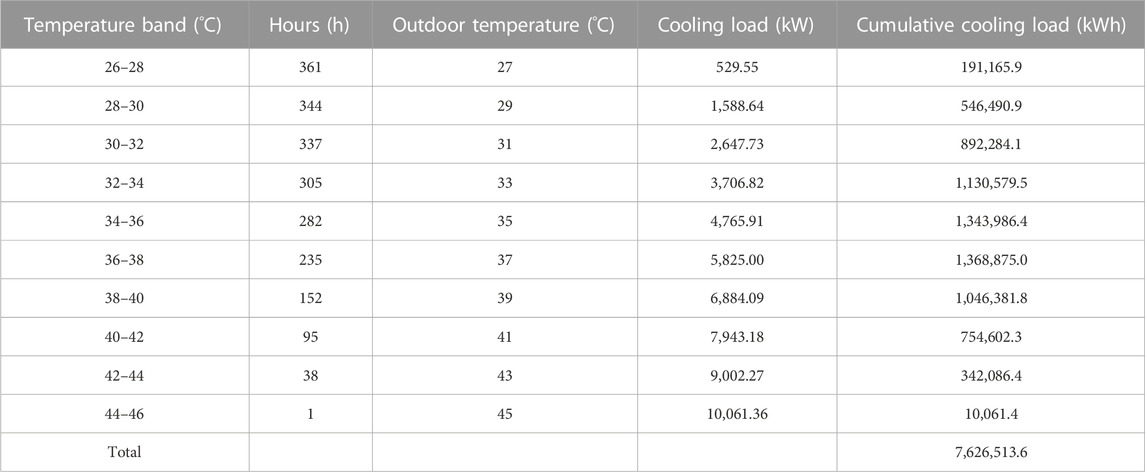
The procedure for calculating the cooling load of the research area is outlined below. The detailed calculation process is described using Community A as an example. The meteorological parameters of the typical meteorological year in the test area are selected as the BIN meteorological parameters. The outdoor design temperature is 40.3°C, the design cooling load is 7,572.5 kW, the outdoor temperature is selected according to the typical annual data, and the design temperature inside of the buildings is 26°C. Calculated according to the above formula, the cumulative cooling load of the building in the cooling season is 7,626,513.6 kWh. The specific summer cumulative air-conditioning cooling load calculation table is shown in Table 7 and the cumulative summer air conditioning cooling loads for each community are shown in Table 8. The formula for calculating the electricity consumption of the GWHP, system in the whole cooling season is as follows:
where EH is electricity consumption of heat pump system in cooling season, ΣQH is the cumulative cooling load of the building throughout the year.
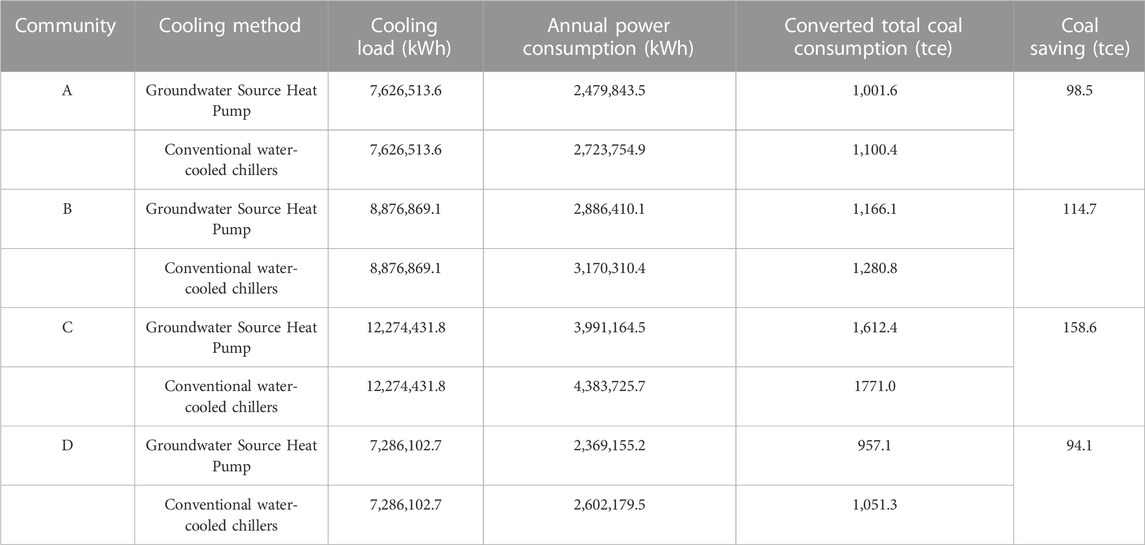
Comparing the GWHP system with a conventional water-cooled chiller. The performance coefficient of the conventional chilled water-cooled unit is 2.8. The comparison outcomes are presented in Table 9.
From this calculation, it is concluded that the groundwater source heat pump system saves 0.85 kgce/m2 in summer compared with the conventional water-cooled chiller system, and the energy saving effect is remarkable.
4.2 Environmental benefit analysis
Based on the results of the annual conventional energy substitution amount for the project, the annual conventional energy substitution amount for each system is 98.5 tons, 114.7 tons, 158.6 tons and 94.1 tons. According to the “Guidelines” and “Evaluation Standards” on environmental benefits, the emission reductions of carbon dioxide, sulfur dioxide, and dust are calculated respectively. The calculation methods are as follows:
Carbon dioxide emission reduction is calculated according to the following formula:
where QCO2 is Carbon dioxide emission reduction, Qbm is standard coal saving, 2.47 is Carbon dioxide emission factor.
Sulfur dioxide emissions are calculated according to the following formula:
where QSO2 is Sulfur dioxide emission reduction, Qbm is standard coal saving, 0.02 is SO2 emission factor for standard coal.
Dust emission reduction is calculated according to the following formula:
where QFC is dust emission reduction, Qbm is standard coal saving, 0.01 is dust emission factor.
From the calculations in Table 10, it can be concluded that the CO2 reduction, SO2 reduction, and dust reduction in a cooling season in this test area are 2.09 kg/m2,002 kg/m2 and 0.0.1 kg/m2 respectively. The implementation of the GWHP system has clear implications for air pollution control and environmental conservation.
4.3 Economic benefit analysis
In light of the energy consumption analysis results, the power consumption of the heat pump system in the cooling season is 21.29 kWh/m2, and the power consumption of the traditional chilled water system is 23.38 kWh/m2, representing a savings of 2.1 kWh/m2. Combined with the paid electricity price standard of the project (0.567 yuan/kWh for this project), the cost of utilizing the GWHP system for cooling in the summer of the four communities is at least 793,000 yuan cheaper than that of using the traditional cold-water system.
5 Conclusion
This paper tests the GWHP system in residential quarters and analyzes the performance, energy saving, environmental protection and economic benefits of the system. The result of the study are as follows.
(1) On the basis of the test and evaluation of the groundwater source heat pump heating and cooling project in the residential communities, the groundwater source heat pump technology is effectively applied, and the indoor effect of cooling meets the design and specification requirements, and the heat pump unit and system operate stably.
(2) The average cooling performance factor of the four heat pump units is 4.61–4.93, while the average cooling performance factor of the heat pump systems is 3.08–3.27. The average energy efficiency ratio of the heat pump systems is 32%–38% lower than that of the units. The main reason is that the electricity consumption of the water pump accounts for a large proportion, which leads to the reduction of the performance coefficient of the system. Frequency conversion measures should be taken for the circulating water pump to reduce the power consumption of the water pump and improve the coefficient of performance of the system.
(3) Compared with traditional water-cooled chillers, the four GWHP systems tested can save a total of 466 tons of standard coal, reduce 1,150.8 tons of carbon dioxide emissions, 9.3 tons of sulfur dioxide emissions and 4.7 tons of dust emissions in one cooling season, showing obvious energy and environmental benefits, while reducing operating costs by RMB 793,000, which has certain economic benefits.
Through the analysis, it can be seen that the groundwater source heat pump system offers significant energy-saving benefits, environmental benefits, and economic benefits. Within the current worldwide situation, the promotion of this technology is of crucial practical importance. Moreover, without improving its control strategy, this work conducts simply a performance test and benefit analysis of a GWHP system in a residential area, this part of the content needs to be expanded and enhanced.
Data availability statement
The original contributions presented in the study are included in the article/supplementary material, further inquiries can be directed to the corresponding author.
Author contributions
Conceptualization, KW and WW; data curation, KW; formal analysis, KW and WW; funding acquisition, WW; investigation, KW; methodology, KW, WW, and LH; project administration, LH; resources, KW, WW, and LH; software, KW; supervision, WW; validation, KW, WW, and LH; visualization, KW; writing—original draft, KW and WW; writing—review and editing, KW and WW.
Acknowledgments
The author would like to thank Turpan Nenghui New Energy Co., Ltd. for providing relevant data on the groundwater source heat pump system.
Conflict of interest
LH was employed by Turpan Nenghui New Energy Company.
The remaining authors declare that the research was conducted in the absence of any commercial or financial relationships that could be construed as a potential conflict of interest.
Publisher’s note
All claims expressed in this article are solely those of the authors and do not necessarily represent those of their affiliated organizations, or those of the publisher, the editors and the reviewers. Any product that may be evaluated in this article, or claim that may be made by its manufacturer, is not guaranteed or endorsed by the publisher.
References
Biglia, A., Ferrara, M., and Fabrizio, E. (2021). On the real performance of groundwater heat pumps: Experimental evidence from a residential district. Appl. Therm. Eng. 192, 116887. doi:10.1016/j.applthermaleng.2021.116887
Gao, B., Zhu, X. Y., Yang, X. J., Yuan, Y. P., Yu, N. Y., and Ni, J. (2021). Operation performance test and energy efficiency analysis of ground-source heat pump systems. J. Build. Eng. 41, 102446. doi:10.1016/j.jobe.2021.102446
Granryd, E. (2010). Analytical expressions for optimum flow rates in evaporators and condensers of heat pumping systems. Int. J. Refrigeration-Revue Int. Du Froid 33 (7), 1211–1220. doi:10.1016/j.ijrefrig.2010.05.009
Halilovic, S., Bottcher, F., Kramer, S. C., Piggott, M. D., Zosseder, K., and Hamacher, T. (2022). Well layout optimization for groundwater heat pump systems using the adjoint approach. Energy Convers. Manag. 268, 116033. doi:10.1016/j.enconman.2022.116033
Hou, X. Y., Chen, S. J., and Tang, W. l. (2017). “Research on green building eco-city in turpan new energy demonstration zone,” in Construction science and technology, 42–44. doi:10.16116/j.cnki.jskj.2017.17.008
Kang, Z., Zhou, X., Zhao, Y., Wang, R., and Wang, X. (2017). Study on optimization of underground water source heat pump. Procedia Eng. 205, 1691–1697. doi:10.1016/j.proeng.2017.10.353
Kim, J., and Nam, Y. (2016). A numerical study on system performance of groundwater heat pumps. Energies 9 (1), 4. doi:10.3390/en9010004
Li, X. L., Chen, S. J., Liu, S. M., and Li, Z. H. (2021a). AE waveform characteristics of rock mass under uniaxial loading based on Hilbert-Huang transform. J. Central South Univ. 28 (6), 1843–1856. doi:10.1007/s11771-021-4734-6
Li, X. L., Chen, S. J., Wang, S., Zhao, M., and Liu, H. (2021b). Study on in situ stress distribution law of the deep mine: Taking linyi mining area as an example. Adv. Mater. Sci. Eng. 2021, 5594181–5594211. doi:10.1155/2021/5594181
Li, X. L., Zhang, X. Y., Shen, W. L., Zeng, Q. D., Chen, P., Qin, Q. Z., et al. (2023). Research on the mechanism and control technology of coal wall sloughing in the ultra-large mining height working face. Int. J. Environ. Res. Public Health 20 (1), 868. doi:10.3390/ijerph20010868
Liu, H. Y., Zhang, B. Y., Li, X. L., Liu, C. W., Wang, C., Wang, F., et al. (2022). Research on roof damage mechanism and control technology of gob-side entry retaining under close distance gob. Eng. Fail. Anal. 138, 106331. doi:10.1016/j.engfailanal.2022.106331
Liu, S. M., Li, X. L., Wang, D. K., and Zhang, D. M. (2020a). “Investigations on the mechanism of the microstructural evolution of different coal ranks under liquid nitrogen cold soaking,” in Energy sources part a-recovery utilization and environmental effects, 1–17. doi:10.1080/15567036.2020.1841856
Liu, Z. J., Li, Y. W., Xu, W., Yin, H., Gao, J., Jin, G. Y., et al. (2019). Performance and feasibility study of hybrid ground source heat pump system assisted with cooling tower for one office building based on one Shanghai case. Energy 173, 28–37. doi:10.1016/j.energy.2019.02.061
Liu, Z. J., Zhang, Y. L., Xu, W., Yang, X. Y., Liu, Y. W., and Jin, G. Y. (2020b). Suitability and feasibility study on the application of groundwater source heat pump (GWSHP) system in residential buildings for different climate zones in China. Energy Rep. 6, 2587–2603. doi:10.1016/j.egyr.2020.09.015
Long, W. D. (1992). “Using BIN parameters for building energy consumption analysis,” in Heating ventilating and air conditioning, 6–11.02
Lu, S. L., Qi, Y. F., Cai, Z., and Li, Y. R. (2015). Optimization model analysis of centralized groundwater source heat pump system in heating season. Front. Energy 9 (3), 343–361. doi:10.1007/s11708-015-0372-8
Luo, J., and Ma, X. N. (2022). An integrated strategy for the improvement of thermo-economic performance of a GWHP system. Appl. Therm. Eng. 213, 118777. doi:10.1016/j.applthermaleng.2022.118777
Luo, J., Pei, K. H., and Li, P. J. (2022). Analysis of the thermal performance reduction of a groundwater source heat pump (GWHP) system. Eng. Fail. Anal. 132, 105922. doi:10.1016/j.engfailanal.2021.105922
Ma, Z. L., Yao, Y., Jiang, Y. Q., and Ni, L. (2010). Theoretical basis and practice of heat pump technology application. Beijing: China Construction Industry Press.
Ma, Z., and Xia, L. (2017). Model-based optimization of ground source heat pump systems. Energy Procedia 111, 12–20. doi:10.1016/j.egypro.2017.03.003
Ministry of Housing and Urban-Rural Development of the People’s Republic of China (2013). Evaluation standard for application of renewable energy in building: GB/T 50801-2013. Beijing: China Architecture and Building Press.
Ministry of Housing and Urban-Rural Development of the People’s Republic of China (2008). Guidelines for evaluation of renewable energy building Application Demonstration projects. Beijing: China Architecture and Building Press.
Na, W., and Xia, Q. Y. (2021). Influence of different porous media and groundwater-source heat pump operation modes on thermal breakthrough in energy extraction area. Heat. Vent. Air Cond. 51 (07), 104–110.
Nam, Y., and Ooka, R. (2010). Numerical simulation of ground heat and water transfer for groundwater heat pump system based on real-scale experiment. Energy Build. 42 (1), 69–75. doi:10.1016/j.enbuild.2009.07.012
Park, D. K., Kaown, D., and Lee, K. K. (2020). Development of a simulation-optimization model for sustainable operation of groundwater heat pump system. Renew. Energy 145, 585–595. doi:10.1016/j.renene.2019.06.039
Park, D., Lee, E., Kaown, D., Lee, S. S., and Lee, K. K. (2021). Determination of optimal well locations and pumping/injection rates for groundwater heat pump system. Geothermics 92, 102050. doi:10.1016/j.geothermics.2021.102050
Peng, Y. M. (2013). Simulation analysis of ground water heat pumps system and operation optimization research. Master's Thesis (Hefei University of Technology).
Sang, J. M., Liu, X., Liang, C. Z., Feng, G. H., Li, Z. H., Wu, X. H., et al. (2022). Differences between design expectations and actual operation of ground source heat pumps for green buildings in the cold region of northern China. Energy 252, 124077. doi:10.1016/j.energy.2022.124077
Sanner, B., Karytsas, C., Mendrinos, D., and Rybach, L. (2003). Current status of ground source heat pumps and underground thermal energy storage in Europe. Geothermics 32 (4-6), 579–588. doi:10.1016/S0375-6505(03)00060-9
Song, T., and Wang, W. J. (2015). Application and analysis of BIN method in Urumqi region. Heat. Vent. Air Cond. 45 (05), 39–43.
Wang, Z. H., Xiang, X. Y., and Pan, Y. L. (2011). Hydrogeological report of groundwater and surface water ground source heat pump project in Xincheng District, Turpan City, Xinjiang. Urumqi: Water Conservancy and Hydropower Survey and Design Institute Geological Survey Research Institute.
Wang, Z. W., Wang, L., Ma, A. H., Liang, K. F., Song, Z., and Feng, L. W. (2019). Performance evaluation of ground water-source heat pump system with a fresh air pre-conditioner using ground water. Energy Convers. Manag. 188, 250–261. doi:10.1016/j.enconman.2019.03.061
Wen, T., Cui, X. Z., and Fan, Y. (2022). Optimal layout of pumping and recharging wells for ground-source heat pump. J. Yangtze River Sci. Res. Inst. 39 (01), 23–31+38.
Yan, B. Z., Xu, W. J., Li, Y. H., Sun, J., Bi, P., Li, Y., et al. (2023). Optimal layout of pumping and recharging wells for groundwater source heat pump and parameter sensitivity. J. Jilin Univ. (Earth Sci. Ed. 53 (01), 218–229. doi:10.13278/j.cnki.jjuese.20210222
Zhang, Z. L., Zhang, H. J., Xie, B., and Zhang, X. T. (2022). Energy scheduling optimization of the integrated energy system with ground source heat pumps. J. Clean. Prod. 365, 132758. doi:10.1016/j.jclepro.2022.132758
Zhao, Y., Zhang, S. G., and Xun, L. (2003). Cost-effective optimal design of groundwater source heat pumps. Appl. Therm. Eng. 23 (13), 1595–1603. doi:10.1016/S1359-4311(03)00110-8
Zhen, J. L., Lu, J., Huang, G. Q., and Zhang, H. Y. (2017). Groundwater source heat pump application in the heating system of Tibet Plateau airport. Energy Build. 136, 33–42. doi:10.1016/j.enbuild.2016.12.008
Zhou, K., Mao, J. F., Li, Y., Zhang, H., Chen, S. Y., and Chen, F. (2022a). Thermal and economic performance of horizontal ground source heat pump systems with different flowrate control methods. J. Build. Eng. 53, 104554. doi:10.1016/j.jobe.2022.104554
Zhou, M. L., Cai, F., and Arai, K. (2022b). Cyclic use of groundwater: An innovative way to improve performance of a groundwater source heat pump system during a cooling period. J. Build. Eng. 51, 104325. doi:10.1016/j.jobe.2022.104325
Zhou, X. M., Wang, S., Li, X. L., Meng, J. J., Li, Z., Zhang, L. H., et al. (2022c). Research on theory and technology of floor heave control in semicoal rock roadway: Taking longhu coal mine in qitaihe mining area as an example. Lithosphere 2022, 3810988. doi:10.2113/2022/3810988
Keywords: karst area, complex geological conditions, utilization of groundwater resources, heat exchange, energy consumption analysis
Citation: Wang K, Wang W and Huang L (2023) Study on heat exchange of groundwater under complex geological conditions in karst area of south China. Front. Earth Sci. 11:1162303. doi: 10.3389/feart.2023.1162303
Received: 09 February 2023; Accepted: 10 March 2023;
Published: 21 March 2023.
Edited by:
Xuelong Li, Shandong University of Science and Technology, ChinaReviewed by:
Yu Xuguang, Tangshan Vocational and Technical College, ChinaRulong Bn, Guilin University of Technology, China
Copyright © 2023 Wang, Wang and Huang. This is an open-access article distributed under the terms of the Creative Commons Attribution License (CC BY). The use, distribution or reproduction in other forums is permitted, provided the original author(s) and the copyright owner(s) are credited and that the original publication in this journal is cited, in accordance with accepted academic practice. No use, distribution or reproduction is permitted which does not comply with these terms.
*Correspondence: Wanjiang Wang, d2FuZ3dhbmppYW5nQHhqdS5lZHUuY24=
 Kun Wang
 Wanjiang Wang1*