 Jin Li
 Yuan Gao4
94% of researchers rate our articles as excellent or good
Learn more about the work of our research integrity team to safeguard the quality of each article we publish.
Find out more
ORIGINAL RESEARCH article
Front. Earth Sci. , 26 May 2023
Sec. Solid Earth Geophysics
Volume 11 - 2023 | https://doi.org/10.3389/feart.2023.1160676
This article is part of the Research Topic Pre-, Co-, and Post-Seismic Processes of Recent Earthquakes in Mainland China View all 9 articles
The 2020 Jiashi MS 6.4 earthquake occurred north of the 1997–1998 Jiashi earthquake swarm. Because of its complex tectonic environment and frequent strong earthquake occurrence, scholars have paid extensive attention to this area. To study the upper crustal anisotropy in the source area, we applied microseismic event detection and shear-wave splitting techniques to the seismic data recorded by five stations around the epicenter. First, the earthquake catalog of the Jiashi MS 6.4 earthquake sequence was rebuilt using the “Match & Locate” method. A total of 9,695 earthquake events were obtained, and the number of newly detected earthquakes was approximately 7.3 times the number in the officially released catalog. The newly identified microseismic data greatly increased the number of effective records and improved the reliability of the results. We analyzed shear-wave splitting according to the updated catalog. The results showed that the dominant polarizations of the fast shear waves were in NW or NNW at the stations BPM, XKR, L6505, and L6513, consistent with the stress near the source area. There are also blind faults with an NNW direction in the strike distributing en echelon and parallel to the main stress direction in the Jiashi seismic area. Thus, the fast shear-wave polarization of the four stations may also reflect the strike of multiple buried NNW faults in the study area. The fast shear-wave polarization of station HLJ, located at the Halajun Basin, was E–W, with the overall trend of the Kalpin thrust nappe structure. However, this station didn’t show the same NW or NNW fast-wave direction as the four stations previously mentioned. This finding may indicate that the NW-trending buried faults in the Jiashi seismic area have a limited size in both the length and the depth, only reaching northward near the second row of the Kapingtag nappe structure. The temporal trend of the delay time at station HLJ showed that a stress-release process occurred before the MS 6.4 earthquake and that stress-release occurred again after the mainshock. At station XKR, the delay time rapidly increased and then fell in the early period after the MS 6.4 earthquake, indicating that stress accumulated rapidly after the main earthquake but was released during the aftershock sequence. This study provides novel insights into the complex structural characteristics and seismogenic environment in the Jiashi area.
On Jan 19, 2020, an MS 6.4 earthquake occurred in Jiashi County, Kashgar, Xinjiang, China. Forty-5 hours prior to this event, an MS 5.4 earthquake occurred not far away, representing the foreshock. The Jiashi MS 6.4 earthquake occurred in the northern margin of the Tarim Basin on the NE side of the Pamir Plateau, near the front fault (Keping fault) of the Kepingtag fold-reverse fault zone, which was not far from the Jiashi earthquake swarm that occurred from 1997 to 2003 (Liu et al., 2000; Yang et al., 2006). The foreshock sequence of the MS 6.4 earthquake differed from previous foreshock sequences; for example, the p-value of the MS 5.4 foreshock sequence was low, and the foreshock sequence activity of the earthquake migrated and shrank toward the mainshock location (Deng and Jiang, 2022). The most prominent feature was the difference in rupture properties between the foreshock and the mainshock, where the focal mechanism of the MS 5.4 foreshock was a strike-slip fault, but that of the MS 6.4 main shock was a thrust fault (Cui et al., 2021; Guo et al., 2021; Li et al., 2021; Zhang et al., 2021). Strong earthquakes with significant foreshocks have occurred in recent years, such as the MS 7.3 earthquake in Yutian, Xinjiang, in 2014 (Li and Wang, 2015), the MS 6.1 earthquake in Yingjiang, Yunnan, in 2014 (Zhao et al., 2014), the MS 5.9 earthquake in Shangri-La, in 2013 (Luo et al., 2015), and the MS 7.1 earthquake in Yushu, Qinghai, in 2011 (Lv et al., 2011), where the rupture types of the foreshock and mainshock were similar. The difference between the focal mechanism of the Jiashi MS 5.4 foreshock and the MS 6.4 mainshock reflects the complexity of its seismogenic structure. The distribution of aftershocks of the Jiashi MS 6.4 earthquake had two dominant directions, with most aftershocks distributed in the E–W direction and a small number of earthquakes distributed in the N–S direction (Li et al., 2021). The phenomena have some similarities with the 2014 Ludian MS 6.5 earthquake in Yunnan (Zhang et al., 2014; Zhang et al., 2015). It is generally believed that the conjugate distribution sequence may have been controlled by multiple faults (Guo et al., 2021), especially those concealed near the epicenter that differs in nature and strike with the main faults. Therefore, it is important to investigate the relationship between active faults near the Jiashi MS 6.4 earthquake and the stress environment near the source area.
When a shear wave propagates along an anisotropic medium, it splits into components with different polarization directions and velocities. This phenomenon is called shear-wave splitting (Crampin, 1978; Crampin, 1984). The polarization of the fast shear wave (hereafter referred to as “fast waves”) is usually parallel to the in-situ horizontal principal stress azimuth or the structural fracture trend nearby, while the delay time of the slow shear wave (hereafter referred to as “slow waves”) is slow relative to fast shear waves (referred to as “the delay time”). The delay time reflects the anisotropic degree of the regional medium and stress field changes. It is affected by the stress field and micro-crack geometry. Therefore, shear-wave splitting parameters are important in studying fault structure, medium deformation, regional stress, and their variation characteristics (Zheng et al., 2008; Zhang et al., 2009; Gao et al., 2010; Wu et al., 2022). Previous studies have also shown that the shear-wave splitting parameters of foreshock and aftershock sequences often exhibit certain differences. For example, the polarization of the aftershock sequence of the MS 6.1 earthquake in Yingjiang, Yunnan was deflected when compared with that of the foreshock sequence, and the delay time of the aftershock sequence was higher than that of the foreshock sequence (Li et al., 2015). The delay time of the slow wave at the SAU station showed a decline before the MS 6.6 earthquake in Iceland on Jun. 17, 2000 (Voliti and Crampin, 2003), and a similar decline occurred before the MS 5.3 aftershock in Shidian, Yunnan, in 2001 (Gao, Liang, et al., 2004). In addition, relevant research results on strong earthquakes such as the 2008 Wenchuan earthquake, the 1999 Taiwan Jiji earthquake, and the 2021 Qinghai Maduo earthquake also showed significant spatiotemporal differences in shear-wave splitting parameters before and after strong earthquakes (Zheng et al., 2008; Gao et al., 2018; Cao et al., 2022). Changes in shear-wave splitting parameters before and after strong earthquakes are considered to reflect stress changes in the source area, which is of great value in revealing the anisotropic characteristics of a medium in a seismogenic area and changes in the stress state.
This study used the waveform data of the Jiashi MS 6.4 earthquake sequence recorded by three fixed stations and two temporary stations erected after the earthquake in the source area. First, the template matching method (Match & Locate, M&L; Zhang and Wen, 2015; Zhang, 2015) was used to reconstruct the catalog of the source area to expand the effective data in the shear-wave window. Then, the shear-wave splitting parameters of each station were calculated. Next, the anisotropic characteristics of the crustal medium near the Kalpingtag nappe before and after the Jiashi MS 6.4 earthquake were discussed, the azimuth distribution of the principal stress was inferred, and the relationship between the polarization of the fast wave below the station and the fracture was studied.
From 1997 to 1998, nine consecutive MS≥6.0 earthquakes occurred in the Jiashi area within a short period, while concentrated strong earthquake activities were rare globally. Subsequently, in 2003, an MS 6.8 earthquake occurred, and the strong earthquake activity in this area ended. All MS≥6.0 earthquakes occurred in the foreland basin of the South Tianshan thrust-nappe structural system (Figure 1). Studies have confirmed a series of blind faults under the thousands of meters thick sedimentary layers in the area, which can breed moderate and strong earthquakes (Xu et al., 2006; Xu et al., 2006; Xu Ran, et al., 2006; Yang et al., 2006; Zhang et al., 2008). However, no obvious surface rupture was observed after these MS≥6.0 earthquakes, and the seismogenic environment and structure are still relatively vague. The 2020 Jiashi MS 6.4 earthquake was located on the N side of the Jiashi strong earthquake swarm, close to the Kalpingtag nappe structure. The Kalpingtag nappe structure is composed of multiple rows of monocline or anticline mountain systems (nappes) that are almost E–W-trending and distributed in parallel, with thrusting and napping from N to S and divided into two parts by the Puchang fault, E and W (Qu et al., 2003). The 2020 Jiashi MS 6.4 earthquake was located on the W side of the Puchang fault, near the front fault (Kaling fault) of the Kalpingtag nappe structure. The N–S-trending crustal shortening rate of the Kalpingtag nappe on the E and W sides of the Puchang fault differ, with 2.5–2.7 mm/a on the W side and 0.3 mm/a on the E side (Li et al., 2020). The Puchang fault is also considered a “transform-like fault,” which represents the boundary of unequal crustal shortening on the E and W sides of the fault. It divides and adjusts the transition of the crustal shortening boundary between the large shortening in the W and the small shortening in the E (Xu et al., 2006).
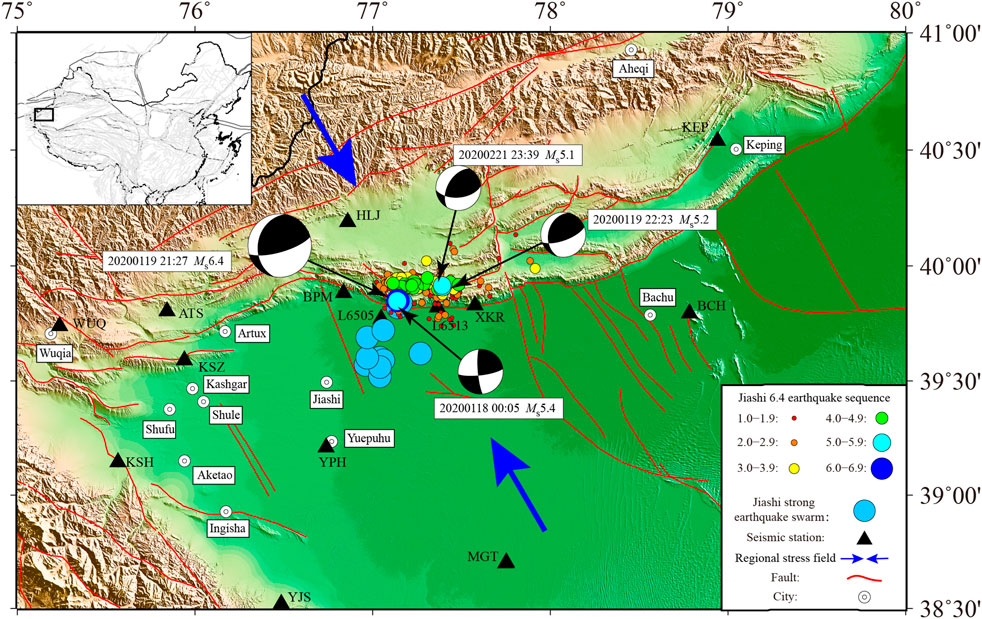
FIGURE 1. Tectonics, stations, and earthquakes in the 2020 Jiashi MS 6.4 focal area. The light blue circle represents the 1997–2003 Jiashi earthquake swarms, while the dark blue circle represents the Jiashi MS 6.4 earthquake in 2020.
After relocating the Jiashi strong earthquake swarm, it was determined that these earthquakes occurred on at least two NNW-trending parallel rupture zones in an en-echelon dextral strike-slip arrangement (Zhou et al., 1999, 2006). Moreover, the normal fault activity in the Jiashi area promoted cyclic triggering of earthquakes between the en-echelon strike-slip faults (Zhou et al., 2006; Zhang et al., 2008). Li, Jiang, et al. (2021) reported a high-dip strike-slip fault in the Jiashi MS 6.4 source area, which was essentially parallel to the seismogenic structure of the Jiashi earthquake swarm trending toward NNW. Furthermore, Cui et al. (2021) reported that the Jiashi MS 6.4 mainshock comprised two sub-events with strike-slip and thrust characteristics. They speculated that the MS 6.4 event occurred in the middle and lower crust, below the detachment surface of the Keping structural belt. The mainshock comprised an NNW-trending W-dipping high-angle blind fault and the successive breaking of an almost E–W-trending S-dipping structure.
Regarding the stress field characteristics in the Jiashi area, early research results suggested that the background tectonic stress is mainly in the NNW direction (Xu et al., 1989; Ding and Lu, 1991). Recently, based on the focal mechanism of MS≥3.5 earthquakes in the Tianshan seismic belt, the maximum principal stress direction in the Jiashi area is NW (Li et al., 2015). However, different results have been reported regarding the stress field during 1997–2003. Gao et al. (2004) reported that after discounting the strong earthquake swarm, the direction of the P-axis in the Jiashi vicinity is dominated by NW. Conversely, based on the moment tensor solution of moderate earthquakes from 1997 to 2004, Zhao et al. (2008) reported that the direction of the local stress field in the Jiashi area is spatially inhomogeneous. That is, the stress field in the western part is relatively stable, with the direction of 12°. In contrast, the principal compressive stress axis in the eastern area was 321°. Cui (2006), through the inversion of earthquakes in different groups, considered that the modern tectonic stress field in the area is NNW–SSE direction with an azimuth angle of 162°. Before the Jiashi strong earthquake swarm, the direction of the maximum principal stress in the Jiashi source area was deflected and became NNE–SSW, with an azimuth angle of 25° lasted for a while, and then changed to the NNW again.
Before studying the anisotropy of the crustal medium, it is necessary to select small earthquake data to ensure that the incident angle of the recorded shear wave is less than the critical angle. Seismic events within the shear-wave window are then selected for analysis. According to Snell’s law, the critical angle is approximately 35°. Due to the influence of low-velocity sediment layers on the surface and other factors, the shear-wave window can generally be widened to 45°–50° (Gao et al., 1998). The sedimentary layer near the Jiashi area is relatively thick, up to 8–9 km (Xu et al., 2006). There is generally no accepted regional velocity model, so we regarded the crustal structure as a single-layer medium when calculating the incident angle. Therefore, we set the shear-wave window to 45° (Crampin and Peacock, 2005).
Due to the strict data screening conditions of the shear-wave window, the data availability in this study was limited, and the adequate number of small earthquakes around the station became a key factor influencing the validity of the results (Bao and Gao, 2017). Restricted by human factors, there are a large number of omissions in the officially released catalog, especially for the small earthquakes recorded by only a single station. To increase the effective data in the shear-wave window, in recent years numerous studies have greatly expanded the catalog based on microseismic detection technologies. Using a template matching method, Ross et al. (2019) identified nearly ten times more events than those in the Southern California Seismic Network (SCSN) catalog. M&L not only derives small events but also provides relatively high-precision spatial location information, facilitating the subsequent crustal shear-wave splitting step. Gao et al. (2019) and Chen (2018) used linear temporary seismic array data to study crustal shear-wave splitting. The microseismic events identified by the M&L method were several times that of the seismic network catalog. Furthermore, studying the anisotropy of the Qinghai-Tibet Plateau, Guo and Gao (2020) obtained an approximately five times higher number of new events using the M&L method as compared to that in the original catalog, which greatly increased the effective data.
After the Jiashi MS 6.4 earthquake in 2020, the Xinjiang Seismological Bureau quickly travelled to the source area to set up two temporary stations, L6505 and L6513 (Figure 1), which provided valuable near-field data for subsequent studies on shear-wave splitting. The parameters of seismometers at various stations are listed in Table 1. According to the earthquake catalog provided by the Xinjiang Regional Seismic Network, as of Dec 31, 2020, 1,864 earthquakes with MS ≥ 1.0 have been recorded in the sequence. We used 791 repositioning earthquakes of ML ≥ 1.5 from Jan. 18 to Aug 10, 2020 (Li et al., 2021) and 640 ML ≥ 1.5 earthquakes in the 20-km range of five stations in the study area from Jan 1, 2017 to Dec 31, 2020. After removing duplicate data, a total of 1,431 seismic events were used as templates, and the M&L method was used (Zhang, 2015; Zhang and Wen, 2015) to scan continuous waveforms from Jan 1, 2020 to Sept 18, 2020 (L6505 and L6513 ceased observation on Sept 18, 2020). The specific steps were as follows:
(1) We removed the mean and trend of continuous waveform data during the above research period. A 2–12-Hz four-stage dual-channel Butterworth bandpass filter was used for filter processing to improve the signal-to-noise ratio of the waveform.
(2) We calculated the theoretical arrival time of S and P waves using the Taup software (Crotwell et al., 1999) and manually corrected the arrival time. Then, using the template time window from 1 s before the arrival of the S wave to 5 s after its arrival and the noise time window from 3 s before the arrival of the P-wave to 1 s before its arrival, the weight coefficients of each component at each station were calculated using the comprehensive weighting method proposed by Liu et al. (2000):
where
Here,
(3) With the location of the template event as the center, we set a search grid, calculated the arrival time difference between the grid point and the template event to each station, subtracted the S-wave travel time corresponding to its template from the time corresponding to the sliding cross-correlation sequence of each component at each station, and then subtracted the arrival time difference between the grid point position and the template position to each station, and completed the position correction. Finally, based on the weighting coefficients calculated in the previous step, by weighting and stacking the sliding cross-correlation coefficients of all station components, the superimposed sliding cross-correlation coefficients of the grid point position were obtained as follows:
T and C represent template and continuous waveform data, and N represents the number of sampling points within the template time window. n, s, and c represent the number of sampling points, stations, and components, respectively.
(4) We then took the location of the template event as the center, the range of 0.015° × 0.015° in the horizontal latitude and longitude directions was searched at an interval of 0.003°, and the search range in the vertical direction was set to 5 km, with a search interval of 1 km. A background correlation coefficient of 0.0253 was used (Zhang, 2015), while the detection threshold used (0.3) was 12 times the background correlation coefficient (Deng and Jiang, 2022). A seismic event was detected when the calculated cross-correlation coefficient was greater than 0.3.
(5) We calculated the ratio of the maximum amplitude of the S-wave on the horizontal component of the detected event and its corresponding template event within 2 s before and 2 s after it arrived at each station. Then we calculated the average amplitude ratio to obtain the magnitude of the detected event.
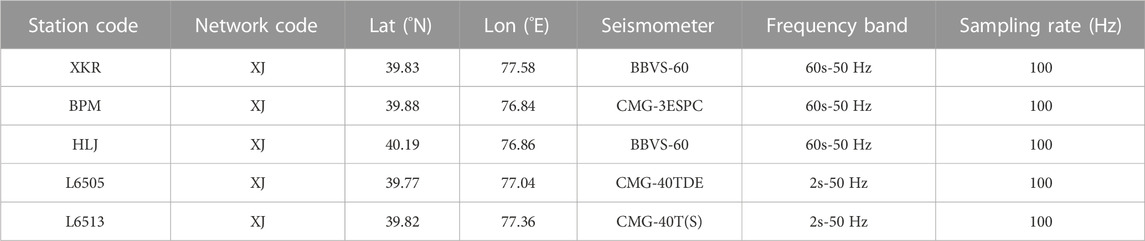
TABLE 1. Station parameters in the 2020 Jiashi MS 6.4 earthquake.
Using the M&L method based on GPU acceleration (Deng and Jiang, 2022), 9,695 seismic events were detected and successfully located from Jan 1, 2020 to Sept 18, 2020. A total of 1,165 earthquake events were self-tested template events, whereas 8,530 earthquake events were newly detected, which was about 7.3 times the number in the earthquake catalog. In addition, 302 foreshocks were detected, whereas the officially released catalog only contained 68 foreshocks, and most of these events were during the Jiashi MS 5.4 and MS 6.4 earthquakes. Figure 2 shows the waveform and superimposed cross-correlation function of an ML 1.59 seismic event detected by the M&L method at 7:41:9.179 on Jan 8, 2020.
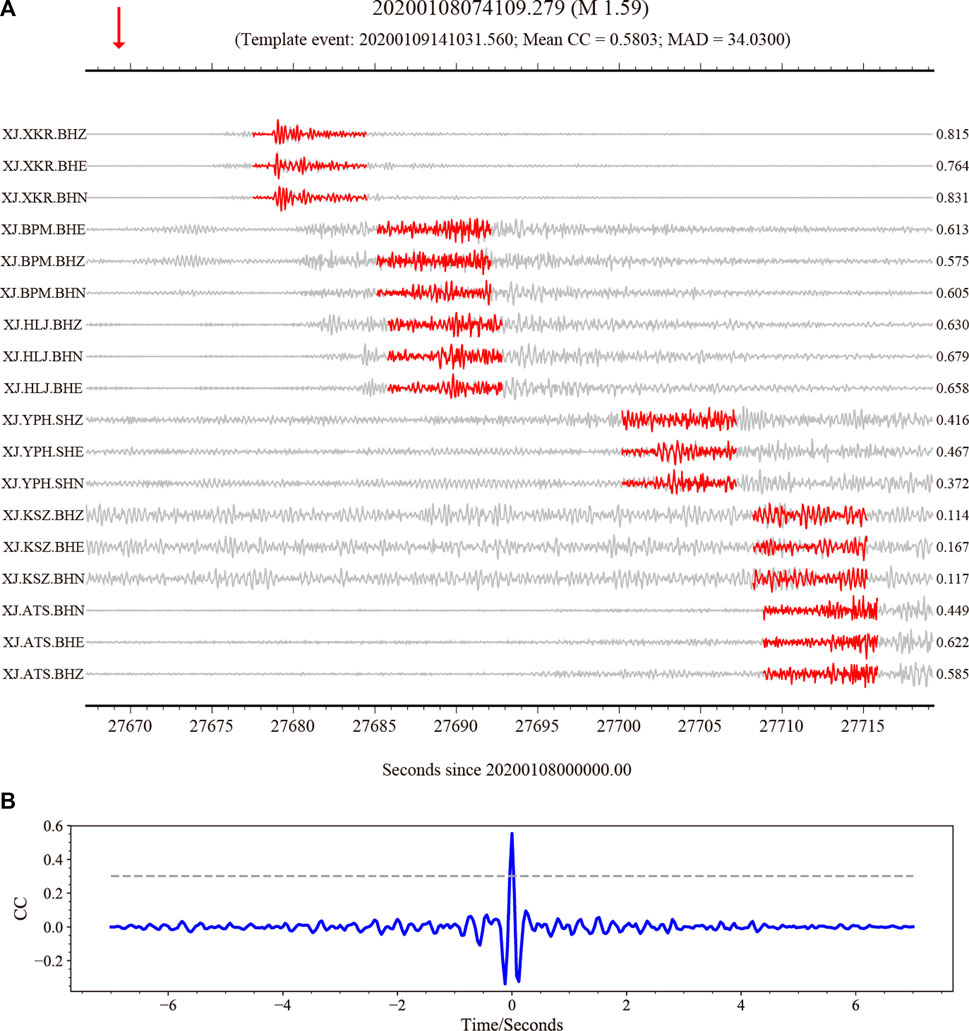
FIGURE 2. A positive detection with ML1.62, occurring on Jan 8, 2020, using the M&L method. (A) Comparison of the template earthquake waveform (red) and detected earthquake waveform (gray). (B) Stacked cross-correlation function (blue) of the template and detected earthquakes; the maximum value is 0.5803, which exceeded the detection threshold of 0.3 (gray dashed line).
The method of detecting known events was used to verify the reliability of the M&L positioning method. The known-event locations were taken as the reference location and compared with the detection and positioning results. First, we selected an ML 2.5 earthquake to be detected (Table 2) on Apr 13, 2020. We then used other template events with the above earthquake removed to detect and locate the earthquake. The results showed that the M&L method effectively identified this earthquake. The template event that detected this event was an ML 2.3 earthquake on Apr 29, 2020 (Table 2). The stacking correlation coefficient was approximately 0.72. The distance between the detection results and the reference location was approximately 150.67 m (Figure 3). The location of the earthquake (39.961° N, 77.191° E) recorded in the network catalog was approximately 2,608 m from the reference location, indicating that the M&L method had a good constraint on the location of the detected earthquake. Excluding waveforms with low signal-to-noise ratios and earthquakes that could not be identified by their S-wave phases, the five stations in the source area obtained 384 events (Table 3) that could be used for shear-wave splitting, most of which were data obtained from microseismic detection.
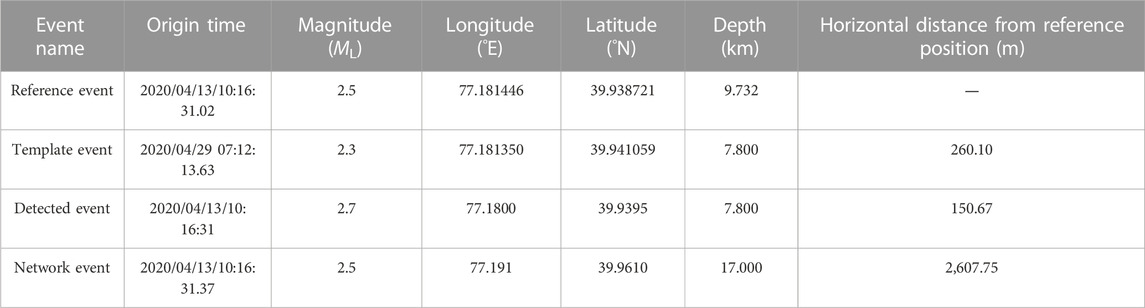
TABLE 2. Location error comparisons.
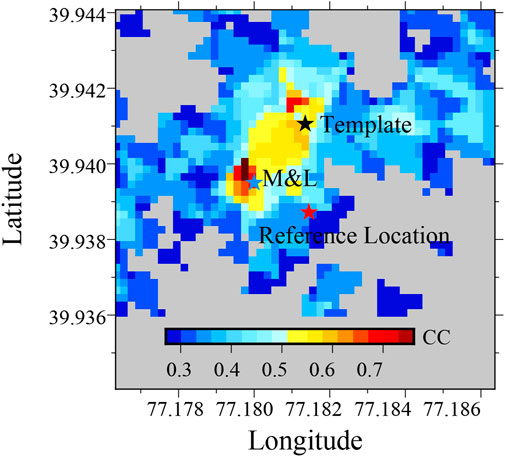
FIGURE 3. Spatial distribution of correlation coefficients during M&L detection. The black star denotes the template earthquake, the red star denotes the reference earthquake, and the blue star denotes the detected earthquake (with the maximal CC value).
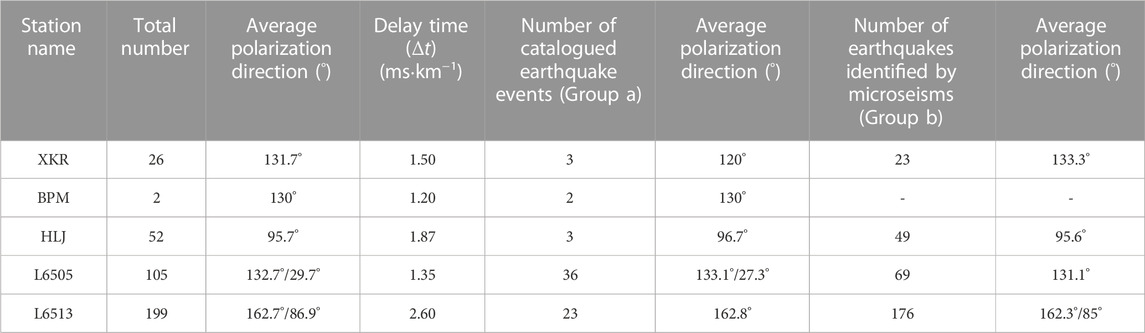
TABLE 3. Number of effective recording events and the average fast shear-wave polarization.
Shear-wave splitting and a system analysis method (SAM) were used to study the anisotropy of the crustal medium near the Jiashi MS 6.4 earthquake. SAM is an analytical method based on the correlation function, including the calculation of the correlation function, correction of delay time, and inspection of polarization analysis. The method can be self-checked so that the calculated results have high reliability (Gao et al., 2004; Shi et al., 2012). Figure 4A shows an ML 1.6 earthquake from the seismic network catalog recorded by the L6505 station. Its epicentral distance was 9.91 km, its focal depth was 10.50 km, its incident angle was 43.50°, and its azimuth angle was 57.02°. Figure 4B shows an ML 0.7 earthquake recorded by the L6513 station identified using the M&L method. Its epicentral distance was 8.79 km, its focal depth was 10 km, its incident angle was 41.50°, and its azimuth angle was 10.90°.
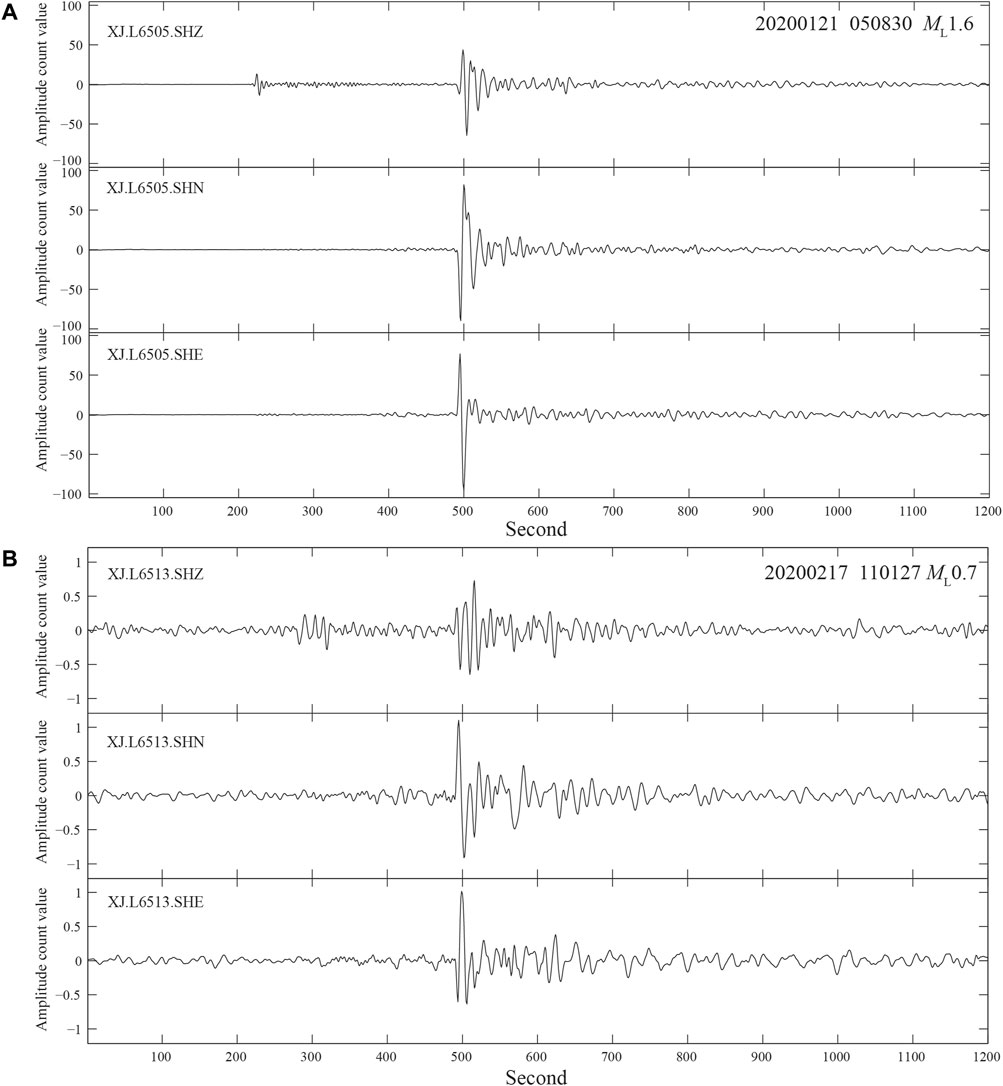
FIGURE 4. (A) Waveform data recorded by station L6505 (Event Number: 20200121050830); (B) waveform data recorded by station L6513 (20200217110127). Earthquake information: (A) A ML 1.6 earthquake occurred at 5:08:30 on Jan 21, 2020, with an epicentral distance of 9.91 km, a focal depth of 10.5 km, an incident angle of 43.5°, and an azimuth angle of 57.02°; (B) A ML 0.7 earthquake occurred at 11:1:27 on Feb 17, 2020. The epicentral distance was 8.79 km, the focal depth was 10 km, the incident angle was 41.5°, and the azimuth angle was 10.9°.
Figures 5A1–A6, B1–B6 shows examples of the shear-wave parameter analysis of the two earthquakes mentioned above using the SAM method. A fourth-order Butterworth filter was used to filter waveforms, with a filtering range of 1–20 Hz. The N–S component (Figures 5A1, B1) and the E–W component (Figures 5A2, B2) containing the complete series of S-waves were selected to generate the trajectory of the shear-wave particles. From the diagrams of the polarization analysis (Figures 5A5, B5), when the slow shear wave had not arrived, but the fast shear wave had already arrived, the angle β between true N and the trajectory of the S-wave particle motion was the polarization of the fast shear wave. After the slow shear wave had arrived, the fast and slow shear waves were superimposed, thereby changing the trajectory of the particles. Fast (Figures 5A3, B3) and slow (Figures 5A4, B4) shear waves could be separated by simultaneously rotating the shear waves of the N–S and E–W components by an angle of β. After eliminating the delay time, whether the S-wave particle motion conformed to a linear trajectory was observed—the higher the linearity, the more reliable the analysis results (Figures 5A6, B6; Gao et al., 1998; Wang et al., 2022). The sampling rate of seismometers used by the five stations in the source area was 100 Hz, with each sampling point being 0.01 s. The β angle between the particle motion trajectory of the event (20200121050830) and the true N direction was 140°, and the delay time was 0.04 s. After eliminating the delay time, the particle motion of the fast and slow waves reflected a good linear relationship (Figure 5A6). Similarly, the β angle of the seismic event (20200217110127) was 330°, and the delay time was 0.04 s.
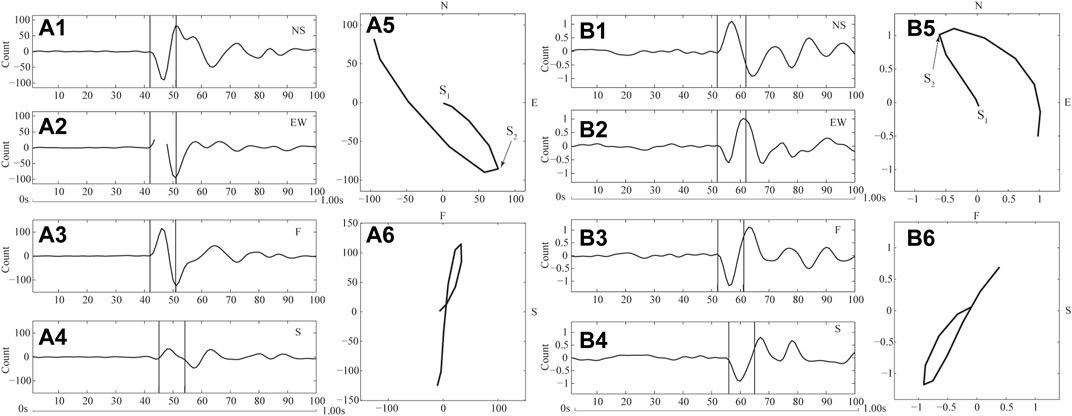
FIGURE 5. Shear wave splitting analysis of the seismic wave (20200121050830, 20200217110127) recorded by station L6505 (earthquake cataloged by the network) and station L6513 (earthquake identified by microseisms). (A1, A2) indicate the shear wave waveforms of L6505; (A3, A4) indicate the waveforms of fast and slow shear waves, where the abscissa represents the number of sampling points, and the ordinate represents the value of amplitude count. The waveform between the vertical lines is used as the particle trajectory; (A5) represents the diagram of the trajectory of shear wave particles in the NS and EW directions, while the splitting of S1 and S2 in (A5) indicates the arrival time of the fast and slow waves; (A6) shows the particle trajectories of fast (F) and slow (S) shear waves after eliminating the delay time. The data processing process of station L6513 on the right is the same as that of station L6505 and the detailed is shown in B1 to B6.
The L6505 station was selected to compare the shear-wave splitting parameters of cataloged (Group a) and microseismic detected earthquake events (Group b). There were 105 valid data (seismic events) in the shear-wave window of the L6505 station, including 36 seismic events in Group a and 69 microseismic events in Group b. The average polarization of the fast shear wave of both sets of data was in the NW direction—the average polarization in Group a was 133.1° and 27.3°, with 133.1° being the main one, while that of Group b was 131.1°. Furthermore, the equal-area projection rose diagrams of the polarization in Groups a and b were also widely consistent (Figure 6). This verified that using the microseismic detection method could effectively supplement near-field shear-wave splitting data, and sufficient data available within the window ensure the reliability of results.
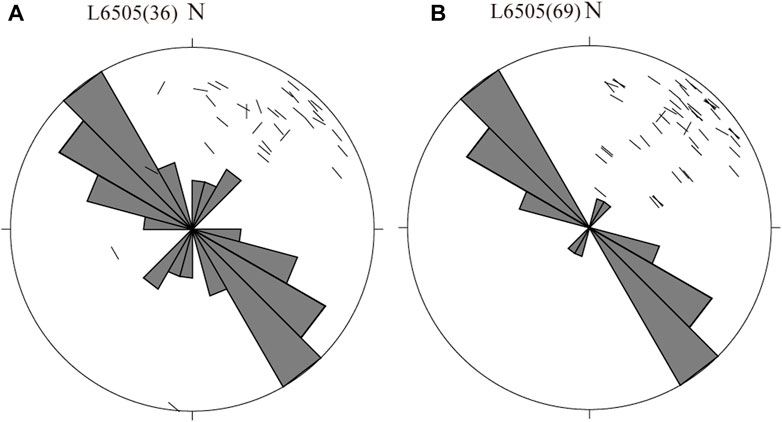
FIGURE 6. The polarization of the fast shear wave of cataloged (A) and microseismic detected earthquake events (B) at station L6505.
From the total valid data of each station in Table 3, earthquakes identified from microseisms (Group b) accounted for the majority (except for the BPM station), especially for stations XKR, HLJ, and L6513. The number of data in Group b was several times that of Group a. If only data in Group a were used for analysis, the reliability of shear-wave splitting parameters would be reduced considerably due to the small sample size in the window. The microseismic events detected by the M&L method provided sufficient samples for the complete and accurate identification of the shear-wave splitting parameters. According to the average polarization of the stations in Groups a and b (Table 3), there was little difference between the two groups at each station (except for the station BPM, which had only two valid data). Although the individual stations had two dominant polarization directions, none of their secondary polarization directions were prominent.
According to Li et al. (2021), who adopted the CAP method to calculate the focal mechanism solution of the Jiashi MS 6.4 earthquake sequence, the P-axis azimuth was mainly in the NW direction, while the P-axis azimuth of a small number of earthquakes was in the NNE direction (Figure 7). The NW direction was essentially consistent with the azimuth of the maximum principal stress in the Jiashi area (Li et al., 2015). The four stations (BPM, XKR, L6505, and L6513) were all located near the E–W-trending Kalpingtag fault (Figure 7). Furthermore, the dominant polarization of the fast shear wave at the four stations was generally NW or NNW, which was essentially consistent with the orientation of the maximum principal stress in the area. In addition, Li et al. (2021) obtained the shear-wave splitting parameters of 33 stations in the Tianshan seismic belt, and the dominant polarization of five stations in the IV2 area (NW corner of the Tarim Basin) was in the NW direction. Lai et al. (2002) obtained the polarization of fast shear waves at stations near the Jiashi area and found that they were mainly in the NW or NNW direction. The results above showed that the dominant polarization of fast shear wave at stations BPM, XKR, L6505, and L6513 could essentially reflect the stress field near the source area.
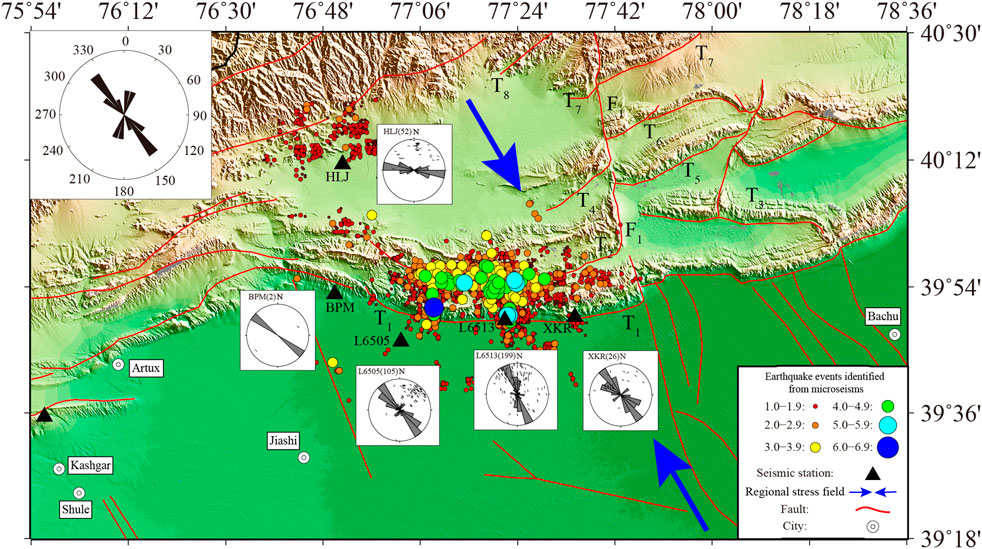
FIGURE 7. Fast shear-wave polarization of each station in the Jiashi MS 6.4 earthquake area. The inset shows the P-axis azimuth distribution of its earthquake sequence. F1, Piqiang fault; T1, Kalpingtag reverse fold belt; T2, Ozgertau fold belt; T3, Tata Ertag fold belt; T4, Tuokesan Ata Nengbaile fold belt; T5, Yimu Ganta Wu fold belt; T6, Piqiang Mountain bold belt; T7, Kekebukesan Mountain fold belt; T8, Oybrak fold belt.
Numerous studies have reported several NNW-trending blind faults in the Jiashi area (Zhou et al., 2001, 2006; Lai et al., 2003; Xu, Zhang, Ran, et al., 2006; Cui et al., 2021). Combining the focal mechanism of the Jiashi MS 5.4 foreshock and the spatial distribution of its sequence also confirms there is an NNW-trending fault that perpendicularly intersects with the Keping fault T1 (Li et al., 2021). The Piqiang fault (F1) runs essentially parallel to the NNW-trending fault, cutting the Keping thrust-nappe structure into two parts, E and W, and is similar to a transform fault (Xu et al., 2006). Its function is to regulate the large difference in deformation rates of the Keping thrust nappe structure from W to E (Ran et al., 2006; Yang et al., 2006; Li, 2013; Li et al., 2016; Li et al., 2020). The four stations BPM, XKR, L6505, and L6513 are located near the E–W-trending Kalping fault and the dominant polarization of their fast shear wave were all NW or NNW, which may reflect the strike of multiple rows of NNW-trending blind faults in the area. The polarization of the fast shear wave of some earthquakes at station L6513 was nearly E–W, essentially consistent with the strike of the nearby Keping fault, exhibiting a strong correlation with the fault. In addition, the polarization of a small number of earthquakes at the stations L6505 and XKR was NE, which is different from the strike of the Keping fault (F1) and the direction of the stress field; this may be a local tectonic effect resulting from a combination of stress and fracture (Shi et al., 2020).
Station HLJ is located in the HLJ Basin, near the Kekebukesan and Oybrak nappe on the W side of the Piqiang fault. The Kekebukesan Mountains (T7) and the Oybrak fold belt (T8) are distributed in the NEE direction, concealed within the Halajun Basin (Qu et al., 2003). The dominant polarization of the fast shear wave at station HLJ was nearly E–W, with an average polarization direction of 95.8°, which was basically consistent with the direction of the Kekebukesan Mountains (T7) and the Oybrak fold belt (T8), and this may reflect the strike of blind faults behind the Kalpingtag nappe structure. Before the Jiashi MS 5.4 foreshock, 23 data met the requirements of the shear-wave splitting window, with an average polarization direction of 100.9°. After the Jiashi MS 5.4 foreshock, there were 24 valid data, with an average polarization direction of 91.6°. The polarization of the fast shear wave at station HLJ showed little change before and after the mainshock, indicating that the Jiashi MS 6.4 earthquake did not affect the polarization of the fast shear wave at station HLJ.
The delay time of the slow shear wave can reflect the degree of anisotropy in the crustal medium, which is affected by the physical properties of the fractures and fluids, and is extremely sensitive to changes in crustal fissures caused by small changes in the crustal stress field (Crampin and Zatsepin, 1997; Gao and Crampin, 2004). To uniformly measure the degree of anisotropy at different stations, the delay time (Δt) is usually normalized (Gao et al., 1998; Shi et al., 2009). In other words, to calculate Δt on the unit ray length (in ms·km−1), the variation in Δt at five stations was studied. The Δt of the four stations XKR, BPM, HLJ, and L6505 was relatively low, ranging from 1.2 to 1.87 ms·km−1, while that of station L6513 was relatively high, at 2.60 ms·km−1.
Before the Jiashi MS 6.4 earthquake, the source area experienced weak seismic activity, and of the three regionally fixed stations, only station HLJ recorded valid data. In addition, station XKR recorded more detailed information on the shear wave splitting parameters after the Jiashi MS 6.4 mainshock. Therefore, the two stations were used to study the change in Δt of the Jiashi MS 6.4 earthquake sequence. The seismic events in the shear-wave window could be divided into two groups according to the intersection angle α between the ray direction and the fracture surface, where α angles between 15° and 45° were referred to as the 1-corner area while α angles less than 15° were referred to as the 2-corner area. Δt in the 1-corner area is sensitive to the aspect ratio of the fracture (Gao et al., 1998; Gao et al., 2004; Wu et al., 2006), which can be used to monitor changes in micro-stress.
The seismic events in the shear-wave window of station HLJ were grouped according to the above criteria, and 49 events in the 1-corner area were obtained, including 24 events before the Jiashi MS 6.4 earthquake and 25 events after the earthquake. According to the change in Δt over time at station HLJ (Figure 8A), the value of Δt in the early stages after the mainshock was still low. Therefore, the change in Δt over time was divided into three stages for research purposes—before the mainshock (period I, 2020.1.1–1.19), early after the mainshock (period II, 2020.1.19–2.16), and the sequence decay stage (period III, after 2020.2.16). The Δt in periods I and II was relatively concentrated and distributed between 0.6 and 2.32 ms·km−1, with average values of 1.62 and 1.17 ms·km−1, respectively. Conversely, the Δt in period III was relatively scattered, ranging from 0.69 to 5.45 ms·km−1, with an average value of 2.14. Multiple seismic events Δt value in this period was higher than 3.0 ms·km−1. Before (period I) and after (period II) the MS 6.4 mainshock, Δt exhibited low values, while the average value before the earthquake was higher than that after the earthquake. The two periods with low Δt values above correspond to the stress release stage. Studies have shown that stress release begins tens of minutes to several months before the earthquake, and the process corresponds to a decrease in Δt (Gao and Crampin, 2004). In period III, as the sequence develops, the delay time exhibits a fluctuating process from its early high-value state, reflecting the characteristics of stress release. Moreover, relatively high Δt values appeared correspondingly during some periods of strong aftershocks (Figures 8A, C).
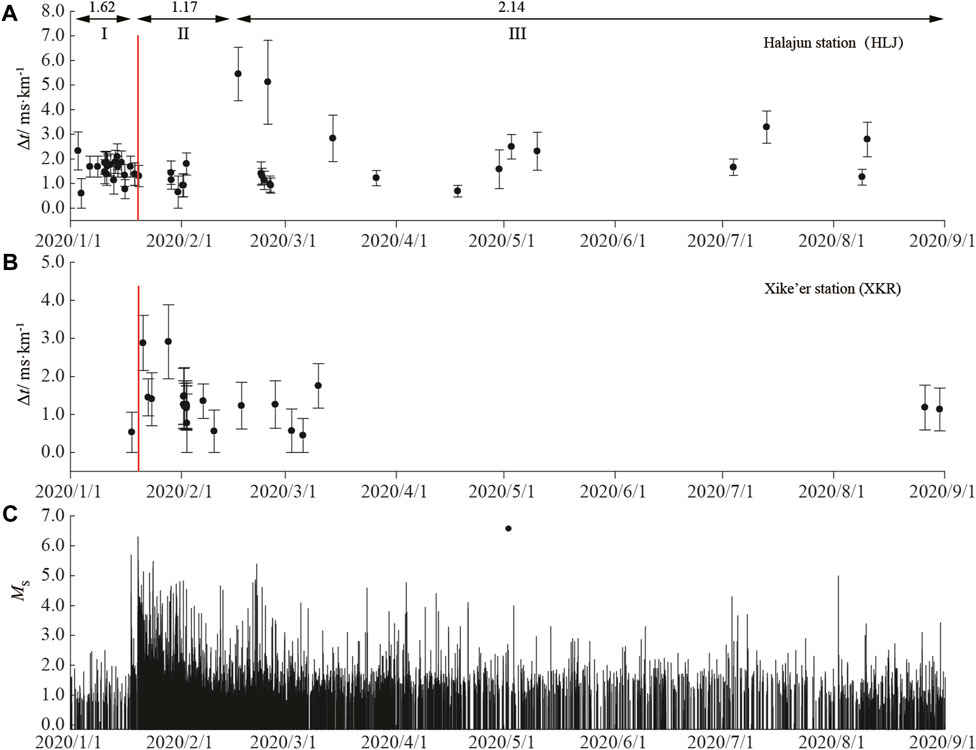
FIGURE 8. Station HLJ (A) and Station XKR (B) variation in the slow wave delay time with time and M-t diagram of the Jiashi MS 6.4 earthquake sequence (C). The red vertical line indicates the Jiashi MS 6.4 earthquake on Jan 19, 2020.
From the Δt results of station XKR (Figure 8B), in the early stage of the MS 6.4 earthquake sequence (roughly corresponding to period II in Figure 8A), the delay time underwent a rapid phase of increase and a subsequent phase of decrease; this shows that within a short period after the MS 6.4 earthquake, the vicinity of station XKR exhibited stress accumulation characteristics. Following the occurrence of aftershocks, it began to exhibit stress-release characteristics.
The Δt of stations HLJ and XKR exhibited different characteristics in the early stage after the MS 6.4 earthquake. In other words, the increase in Δt within a short period was not observed at station HLJ after the mainshock. In addition, the starting times of the decline in Δt at both stations were sequential. On the one hand, these results can attribute to the small amount of valid data at station HLJ. During the early post-earthquake period, the temporal distribution of data from station HLJ was relatively concentrated over a short time; therefore, the data lacked sufficient time resolution to resolve the stress accumulation process during the short period following the earthquake. On the other hand, these results may be attributed to the location difference between the two stations. Station HLJ was far from the mainshock and located behind the Keping nappe structure. In contrast, station XKR was located near the front fault of the Keping nappe structure, and therefore, was closer to the mainshock. The difference in the spatial positions of the two stations may have led to some differences in local stress accumulation and release after the mainshock.
In this study, we used the waveform data recorded by five stations (three regional fixed stations and two temporary stations erected after the earthquake) around the Jiashi MS 6.4 earthquake and studied the anisotropic characteristics of the earthquake sequence.
(1) Near-field shear-wave splitting data were limited by the shear-wave window. Some stations didn’t record sufficient data and, thus, could not fully or accurately reflect anisotropy characteristics. Researchers have attempted different methods to expand valid data. For example, data without depth in the catalog were selected for research by combining them with the dominant depth of earthquakes in the study area (Shi et al., 2009). Guo and Gao (2020) used the single station positioning method to locate seismic events without a given depth and confirmed that the obtained data could be used for shear-wave splitting research. In the present study, M&L was used for microseismic detection to rebuild the earthquake catalog of the Jiashi MS 6.4 earthquake sequence, which expanded the data volume 7.3-fold compared with the original catalog. Through microseismic detection, 302 foreshocks were detected, while the regional seismic network only contained 68 events; this provides valuable data for studying the anisotropy of crustal media before and after strong earthquakes.After comparison, we found that the shear-wave splitting parameters obtained by the earthquake catalog (Group a) and the events identified from microseisms (Group b) were well-aligned; this verified the feasibility of supplementing data through microseismic detection and subsequently extracting anisotropy parameters below stations. In some areas with few or weak earthquakes, valid data obtained by the microseismic detection method are particularly valuable. This method serves as an effective strategy to increase data availability and promote the study of shear-wave splitting.
(2) According to the results of the present study, the dominant polarization of fast shear wave at stations BPM, XKR, L6505, and L6513 exhibited NW or NNW directions, which were aligned with the direction of the stress field near the source area. These directions were also essentially the same as the polarization of the five stations in the NW corner of the Tarim Basin obtained by Li et al. (2021). This finding is also fundamentally consistent with related prior knowledge that regional principal compressive stress often induces an arrangement of fractures in the same direction, thereby affecting the polarization of the fast shear wave parallel to the stress field (Crampin, 1978; Crampin, 1984; Gao et al., 2018, 2020). Therefore, the polarization of the fast shear wave at station HLJ may reflect the strike of E–W-trending blind faults in the back of the Kalpingtag nappe structure.
(3) The tectonic environment of the Jiashi area was relatively complex. Numerous studies have shown that there are many blind faults with NNW strike-slip properties in the area (Cui et al., 2021; Li et al., 2021), which have an en-echelon distribution (Zhou et al., 2001), are parallel to the principal stress direction, and share properties with transform faults (Xu, Zhang, Ran, et al., 2006). Their significance lies in the division and regulation of the crustal shortening boundary transition between the E and W (Ran et al., 2006; Yang et al., 2006; Li et al., 2016; Cui et al., 2021). The NNW- or NW-trending polarization of the fast shear wave at stations BPM, XKR, L6505, and L6513 may also reflect the strike of multiple rows of NNW-trending blind faults in the area. At the same time, studies have shown that for stations near strike-slip faults, the dominant polarization of the fast shear wave is easily affected by the strike of the fault. As the station moves away from the fault, the influence of the polarization may differ (Cochran et al., 2006; Gao et al., 2011). For thrust faults, the principal compressive stress direction is roughly perpendicular to the fault strike, and the polarization of the fast shear wave is less affected by the fault strike (Shi et al., 2009); this can also reasonably explain that, although stations BPM, XKR, L6505, and L6513 were located near the E–W-trending Kalpingtag fold belt, their polarization of the fast shear wave was less affected by the fault. The polarization of station HLJ was basically consistent with the strike of the Keping thrust-nappe structure before and after the Jiashi MS 6.4 mainshock. The polarization did not change, exhibiting completely different directions from the other four stations; this may indicate that the NNW-trending blind fault in the Jiashi area was small in scale and did not extend northward to the back of the Kalpingtag nappe. Research on the deep structure of this area also found that NW-trending blind faults were relatively small. For example, the depth of the XiaSuhong-Magaiti fault zone was reported to be 4–8 km, and no features showed the fault passing through the basement or extending to the surface (Xu et al., 2006; Yang et al., 2006; Xu et al., 2007). Furthermore, the spatial distribution of the Jiashi MS 6.4 earthquake sequence in the NNW direction was relatively limited, at approximately 20 km, and the aftershock activity was essentially limited between the first and second rows of the Keping nappe (Li et al., 2021). Therefore, we infer there might have been numerous NNW- or NW-trending blind faults in the Jiashi area that were not large in scale. Towards the N, they only extended to the vicinity of the second row of the Kalpingtag nappe structure. Towards the S, they were also distributed near the Jiashi strong earthquake swarm.
(4) Δt reflects the overall effect of the propagation path from the source to a station and can indicate the anisotropic degree of the sub-surface medium (Gao and Crampin, 2004, 2006). Using the valid data recorded by stations HLJ and XKR, the Δt before and after the Jiashi MS 6.4 earthquake were studied. The Δt at station HLJ showed that the stress release process might have begun before the mainshock, and as the sequence developed (period III Figure 6A), the state of stress release reappeared again after the mainshock. In addition, a few events with higher Δt values occurred only in some periods of strong aftershocks. However, the Δt of station XKR (Figure 6B) experienced a rapid phase of increase in the early stage of the MS 6.4 earthquake sequence and then declined again; this indicated that stress accumulation occurred rapidly after the mainshock and following the occurrence of aftershocks, it began to exhibit stress release characteristics. Relevant studies have confirmed the phenomenon in which the value of Δt increased after strong earthquakes. For example, the Δt of the foreshock sequence of the MS 6.1 Yingjiang earthquake in 2014 was generally low, while that of the aftershock sequence was relatively high (Li et al., 2015). Chang et al. (2014) showed that Δt increased rapidly after the Lushan MS 7.0 earthquake in 2013 and then decreased. In addition, an increase in Δt was observed approximately 2 months before the Etna volcano eruption in Iceland in 2001. In contrast, the delay time began reflecting a decrease only a few days before the eruption (Bianco et al., 2006).
(5) Due to the complex structural environment in the Jiashi area, in addition to the known Keping thrust-nappe structural system, there are also NNW-trending blind faults. In such areas, the polarization of the fast shear wave is often the result of the joint action of stress and local structures (Gao et al., 2018). Since only station HLJ obtained valid data before the Jiashi MS 6.4 earthquake, the Δt calculated by the two fixed stations was relatively limited, and the resolution of research on changes in stress before and after the Jiashi MS 6.4 earthquake was evidently insufficient. Furthermore, due to the limited number of stations in the source area, the study of the crustal structure and anisotropic characteristics requires more observational data.
The original contributions presented in the study are included in the article/supplementary material, further inquiries can be directed to the corresponding author.
JL processed the data and wrote the manuscript. YG developed the idea for the manuscript and supported the completion of the manuscript. SZ helped modify the retouching of the images and text. All authors contributed to the article and approved the submitted version.
This article was co-funded by the Key Research and Development Program of the Xinjiang Uygur Autonomous Region (Grant Nos. 2022B03001-1), the Earthquake Science and Technology Spark Program of the China Earthquake Administration (XH22025D, XH21042), the Natural Science Foundation of Xinjiang Uygur Autonomous Region (2020D01A83), and the Science and Technological Innovation Team Program of the Xinjiang Earthquake Administration (XJDZCXTD2020-3).
During the research, we received help from Bao Ziwen, an engineer from the Anhui Seismological Bureau; Liu Geng, an engineer from the Second Monitoring and Application Center of the China Earthquake Administration; Su Jinbo, an engineer from the Urumqi Earthquake Institute of Central Asia; and Zhang Hui, a senior engineer from the Seismological Bureau of the Inner Mongolia Autonomous Region. On the matching and locating method, we had a helpful exchange with Deng Shiguang, an engineer from the China Earthquake Networks Center and Wang Xiaoli, an engineer from the Anhui Seismological Bureau. We also sincerely thank researcher Jiang Haikun for his years of guidance. The research was assisted by the research team of earthquake sequence tracing and post-earthquake trend, China Earthquake Administration. Some maps used in this article were drawn using GMT.
The authors declare that the research was conducted in the absence of any commercial or financial relationships that could be construed as a potential conflict of interest.
The reviewer LC declared a shared affiliation with the author YG to the handling editor at the time of review.
All claims expressed in this article are solely those of the authors and do not necessarily represent those of their affiliated organizations, or those of the publisher, the editors and the reviewers. Any product that may be evaluated in this article, or claim that may be made by its manufacturer, is not guaranteed or endorsed by the publisher.
Bao, Z. W., and Gao, Y. (2017). Crustal seismic anisotropy in the Tien Shan and adjacent areas. Chin. J. Geophys. 60, 1359–1375. doi:10.6038/cjg20170411
Bianco, F., Scarfi, L., Del Pezzo, E., and Patanè, D. (2006). Shear wave splitting changes associated with the 2001 volcanic eruption on Mt Etna. Geophys. J. Int. 167, 959–967. doi:10.1111/j.1365-246x.2006.03152.x
Cao, X. L., Chang, L. J., Lu, L. Y., Wu, P. P., Guo, H. L., Lu, M. M., et al. (2022). Variations of shear wave splitting in the source region of the Madoi MS 7.4 earthquake, Qinghai. Chin. J. Geophys. 65, 1644–1659. doi:10.6038/cjg.2022P0944
Chang, L. J., Ding, Z. F., and Wang, C. Y. (2014). Variations of shear wave splitting in the 2013 Lushan MS 7.0 earthquake region. Sci. China Earth Sci. 57, 2045–2052. doi:10.1007/s11430-014-4866-8
Chen, A. G. (2018). “Seismic anisotropy and microseismic analysis of the upper crust in the key structural areas of the South-North seismic zone,” ([Beijing (China)]: Institute of Earthquake Forecasting, China Earthquake Administration). M. D. thesis.
Cochran, E. S., Li, Y. G., and Vidale, J. E. (2006). Anisotropy in the shallow crust observed around the San Andreas Fault before and after the 2004 M 6.0 Parkfield earthquakes. Bull. Seismol. Soc. Am. 96, S364–S375. doi:10.1785/0120050804
Crampin, S. (1984). Effective anisotropic elastic constants for wave propagation through cracked solids. Geophys. J. R. Astr. Soc. 76, 135–145. doi:10.1111/j.1365-246x.1984.tb05029.x
Crampin, S., and Peacock, S. (2005). A review of shear-wave splitting in the compliant crack-critical anisotropic Earth. Wave Motion 41, 59–77. doi:10.1016/j.wavemoti.2004.05.006
Crampin, S. (1978). Seismic-wave propagation through a cracked solid: Polarization as a possible dilatancy diagnostic. Geophys. J. R. Astr. Soc. 53, 467–496. doi:10.1111/j.1365-246x.1978.tb03754.x
Crampin, S., and Zatsepin, S. V. (1997). Modelling the compliance of crustal rock—II. Response to temporal changes before earthquakes. Geophys. J. Int. 129, 495–506. doi:10.1111/j.1365-246x.1997.tb04489.x
Crotwell, H. P., Owens, T. J., and Ritsema, J. (1999). The tauP toolkit: flexible seismic travel-time and ray-path utilities. Seismol. Res. Lett. 70 (2), 154–160. doi:10.1785/gssrl.70.2.154
Cui, R. S., Zhao, C. P., and Zhou, L. Q. (2021). Seismicity feature and seismogenic fault of the MS 6.4 earthquake sequence on Jan 19, 2020 in Jiashi Xinjiang. Seismol. Geol. 43, 329–344. doi:10.3969/j.issn.0253-4967.2021.02.005
Cui, X. F. (2006). Characteristics of recent tectonic stress field in Jiashi Xinjiang and adjacent regions. Acta Seismol. Sin. 28, 370–379. doi:10.1007/s11589-004-0370-3
Deng, S. G., and Jiang, H. K. (2022). Investigation of the foreshock activity of the 2020 MS 6.4 Jiashi earthquake. Chin. J. Geophys. 65, 3322–3334. doi:10.6038/cjg2022P0488
Ding, G. Y., and Lu, Y. C. (1991). The introduction of lithospheric dynamics in China. Beijing: Seismological Press.
Gao, G. Y., Nie, X. H., and Xia, A. G. (2004). Preliminary Study on Characteristics of the Jiashi earthquake sequence with M 6.8 and its focal mechanism solation in 2003. Earthq. Res. China 20, 179–186.
Gao, Y., Chen, A., Shi, Y., Zhang, Z., and Liu, L. (2019). Preliminary analysis of crustal shear-wave splitting in the Sanjiang lateral collision zone of the southeast margin of the Tibetan Plateau and its tectonic implications. Geophys. Prospect. 67, 2432–2449. doi:10.1111/1365-2478.12870
Gao, Y., and Crampin, S. (2006). A stress-forecast earthquake (with hindsight), where migration of source earthquakes causes anomalies in shear-wave polarisations. Tectonopyhsics 426, 253–262. doi:10.1016/j.tecto.2006.07.013
Gao, Y., and Crampin, S. (2004). Observations of stress relaxation before earthquakes. Geophys. J. Int. 157, 578–582. doi:10.1111/j.1365-246x.2004.02207.x
Gao, Y., Liang, W., Ding, X., Xue, Y., Cai, M. J., Liu, X. Q., et al. (2004). Variational characteristics of shear-wave splitting on the 2001 Shidian earthquakes in Yunnan, China. Acta Seismol. Sin. 17, 635–641. doi:10.1007/s11589-004-0002-8
Gao, Y., Liu, X. Q., Liang, W., Kobayashi, H., and Ganss, B. (2004). Systematic analysis method of shear-wave splitting: SAM software system. Earthq. Res. China 20, 101–110. doi:10.1016/j.gene.2004.05.026
Gao, Y., Shi, Y. T., and Chen, A. G. (2018). Crustal seismic anisotropy and compressive stress in the eastern margin of the Tibetan Plateau and the influence of the MS 8.0 Wenchuan earthquake. Chin. Sci. Bull. 63, 1934–1948. doi:10.1360/N972018-00317
Gao, Y., Shi, Y. T., and Wang, Q. (2020). Seismic anisotropy in the southeastern margin of the Tibetan Plateau and its deep tectonic significances. Chin. J. Geophys. 63, 802–816. doi:10.6038/cjg202000033
Gao, Y., Wang, P. D., Zheng, S. H., Wang, M., Chen, Y., and Zhou, H. (1998). Temporal changes in shear-wave splitting at an isolated swarm of small earthquakes in 1992 near Dongfang, Hainan Island, Southern China. Geophys. J. Int. 135, 102–112. doi:10.1046/j.1365-246x.1998.00606.x
Gao, Y., Wu, J., Fukao, Y., Shi, Y., and Zhu, A. (2011). Shear wave splitting in the crust in north China: Stress, faults and tectonic implications. Geophys. J. Int. 187, 642–654. doi:10.1111/j.1365-246x.2011.05200.x
Gao, Y., Wu, J., Yi, G. X., and Shi, Y. T. (2010). Crust-mantle coupling in north China: Preliminary analysis from seismic anisotropy. Chin. Sci. Bull. 55, 3599–3605. doi:10.1007/s11434-010-4135-y
Guo, T. L., and Gao, Y. (2020). Seismic anisotropy in the upper crust within Tibetan Plateau revealed by shear-wave splitting. Chin. J. Geophys. 63, 1085–1103. doi:10.6038/cjg2020N0156
Guo, Z., Gao, X., and Lu, Z. (2021). Relocation and focal mechanism for the Xinjiang Jiashi earthquake on jan 19, 2020. Seismol. Geol. 43, 345–356. doi:10.3969/j.issn.0253-4967.2021.02.006
Lai, X. L., Zhang, X. K., and Li, S. L. (2003). Data processing of near-field earthquake records in Jiashi earthquake region–3-D velocity tomograthy. J. Grad. Sch. Chin. Acad. Sci. 20, 50–55. doi:10.7523/j.issn.2095-6134.2003.1.008
Lai, Y. G., Liu, Q. Y., Chen, J. H., Guo, B., and Li, S. C. (2002). Features of the S-wave splitting and stress field in the Xinjiang Jiashi strong earthquake region. Chin. J. Geophys. 45, 83–92.
Li, A. (2013). “Paleoearthquakes and their geomorphic response of segments of the Kalpin thrust system in the southwestern tianshan since the late pleistocene,” ([Beijing (China)]: Institute of Geology, China Earthquake Administration). Ph. D. thesis.
Li, A., Ran, Y. K., Gomez, F., Thompson Jobe, J. A., Liu, H., and Xu, L. (2020). Segmentation of the Kepingtage thrust fault based on paleo earthquake ruptures, southwestern Tianshan, China. Nat. Hazards 103, 1385–1406. doi:10.1007/s11069-020-04040-6
Li, A., Ran, Y. K., Liu, H. G., and Xu, L. X. (2016). Active characteristics and paleo earthquakes in the west Kalpin nappe since the Holocene, SW Tianshan Mountain. Adv. Earth Sci. 31, 377–390. doi:10.11867/j.issn.1001-8166.2016.04.0377
Li, J., Gao, Y., and Wang, Q. (2021). Anisotropic zoning in the upper crust of the tianshan tectonic belt. Sci. China Earth Sci. 64, 651–666. doi:10.1007/s11430-020-9709-0
Li, J., Gao, Y., Xu, F. K., Xiang, Y., Xiang, Y., and Liu, G. (2015). The shear-wave splitting study on the Yingjiang M 6.1 earthquake sequence on May 30. Earthq. Res. China 31, 245–252.
Li, J., Jiang, H. K., Wei, Y. Y., and Sun, Z. J. (2021). Preliminary study for seismogenic structure of the MS 6.4 Jiashi earthquake on Jan 19, 2020. Seismol. Geol. 43, 357–376. doi:10.3969/j.issn.0253-4967.2021.02.007
Li, J., and Wang, Q. (2015). The analysis on the characteristics of the focal mechanisms for the MS 7.3 earthquake sequence on Feb 12, 2014 in Yutian. Earthq. Res. China 31, 110–120.
Li, J., Zhou, L. Q., Long, H. Y., Nie, X. H., and Guo, Y. (2015). Spatial-temporal characteristics of the focal mechanism consistency parameter in Tianshan (within Chinese territory) seismic zone. Seismol. Geol. 37, 792–803. doi:10.3969/j.issn.0253-4967.2015.03.010
Liu, Q. Y., Chen, J. H., Li, S. C., and Guo, F. (2000). Passive seismic experiment in Xinjiang Jiashi strong earthquake region and discussion on its seismic Genesis. Chin. J. Geophys. 43, 356–365.
Luo, J., Zhao, C. P., and Zhou, L. Q. (2015). Focal mechanisms and stress field of the shangrita deqgen, yumnan province–derong, sichuan province M5.9 earthquake sequence in august, 2013. Chin. J. Geophys 58, 424. doi:10.6038/cig20150207
Lv, J., Zheng, Y., Ma, Y. H., Wang, X. S., Shang, R. B., Su, J. R., et al. (2011). Focal mechanisms and seismogenic structures of the M 4.7, M 7.1 and M 6.3 Yushu earthquakes of April 14, 2010. Prog. Geophys. 26, 1600–1606. doi:10.3969/j.issn.1004-2903.2011.05.012
Qu, G. S., Li, Y. G., and Chen, J. (2003). Geometry, kinematics and tectonic evolution of Kepingtage thrust system. Earth Sci. Front. 10, 142–152.
Ran, Y. K., Yang, X. P., Xu, X. W., Cheng, J., and Chen, L. (2006). Deformation pattern and shortening rates in the east part of Kalpin thrust system in southwest Tianshan during late Quaternary. Seismol. Geol. 28, 179–193. doi:10.3969/j.issn.0253-4967.2006.02.002
Ross, Z. E., Trugman, D. T., Hauksson, E., and Shearer, P. M. (2019). Searching for hidden earthquakes in Southern California. Science 364, 767–771. doi:10.1126/science.aaw6888
Shi, Y., Gao, Y., Shen, X., and Liu, H. (2020). Multiscale spatial distribution of crustal seismic anisotropy beneath the northeastern margin of the Tibetan plateau and tectonic implications of the Haiyuan fault. Tectonophys. doi 774, 228274. doi:10.1016/j.tecto.2019.228274
Shi, Y. T., Gao, Y., Su, Y. J., and Wang, Q. (2012). Shear-wave splitting beneath yunnan area of southwest China. Earthq. Sci. 25, 25–34. doi:10.1007/s11589-012-0828-4
Shi, Y. T., Gao, Y., Wu, J., and Su, Y. J. (2009). Crustal seismic anisotropy in yunnan, southwestern China. J. Seismol. 13, 287–299. doi:10.1007/s10950-008-9128-9
Shi, Y. T., Gao, Y., Zhao, C. P., Yao, Z. X., and Tai, L. X. (2009). A study of seismic anisotropy of Wenchuan earthquake sequence. Chin. J. Geophys. 52, 138–147. doi:10.1002/cjg2.1335
Voliti, T., and Crampin, S. (2003). “A four-year study of shear-wave splitting in Iceland: 1. Background and preliminary analysis,” in New insights into structural interpretation and modelling. Editor D. A. Nieuwland (United Kingdom: Geol. Soc. Lond. Spec. Publ., 117–133.
Wang, X., Gao, Y., Wu, P., Zhou, Y., and Wang, S. (2022). Upper crust seismic anisotropy in the central orogenic belt of North China Craton orogenic belt of North China Craton revealed by shear-wave splitting. Chin. J. Geophys. 65, 2503–2517. doi:10.6038/cjg2022P0889
Wu, J., Crampin, S., Gao, Y., Hao, P., Volti, T., and Chen, Y. T. (2006). Smaller source earthquakes and improved measuring techniques allow the largest earthquakes in Iceland to be stress-forecast (with hindsight). Geophys. J. Int. 166, 1293–1298. doi:10.1111/j.1365-246x.2006.03054.x
Wu, P., Gao, Y., and Xu, L. S. (2022). Seismic anisotropy in the upper crust around the north segment of Xiaojiang faults in the SE margin of Tibetan Plateau. Ann. Geophys. in press.
Xu, X. W., Zhang, X. K., Ran, Y. K., Cui, X., Ma, W., Shen, J., et al. (2006). The preliminary study on seismotectonics of the 2003 ad Bachu-Jiashi earthquake (MS 6.8), Southern Tian Shan. Seismol. Geol. 28, 161–178.
Xu, Z. F., Duan, Y. H., Tian, X. F., Pan, J. S., Zhang, J. S., and Hu, X. Q. (2007). Basement interface structural characteristics beneath Jiashi strong earthquake swarm area in Xinjiang, China. Acta Seismol. Sin. 29, 507–512. doi:10.1007/s11589-007-0507-z
Xu, Z. F., Zhang, X. K., Duan, Y. H., Yang, Z. X., Feng, S. Y., and Hu, X. Q. (2006). Fine upper crustal structure of Jiashi strong earthquake swarm region in Xinjiang inferred from high resolution seismic refraction profile data. Acta Seismol. Sin. 28, 62–71. doi:10.1007/s11589-001-0062-y
Xu, Z. H., Wang, S. Y., Huang, Y. R., and Gao, A. J. (1989). The tectonic stress field of Chinese continent deduced from a great number of earthquakes. Chin. J. Geophys. 32, 636–647.
Yang, X. P., Ran, Y. K., Song, F. M., Xu, X. W., Cheng, J. W., Min, W., et al. (2006). The analysis for crust shortening of Kalpin thrust tectonic zone, south-Western Tianshan, Xinjiang, China. Seismol. Geol. 28, 194–204. doi:10.3969/j.issn.0253-4967.2006.02.003
Yang, Z. X., Zhang, X. K., Jia, S. X., Liu, B. J., Feng, S. Y., Zhao, C. B., et al. (2006). Fine crustal structure in the Jiashi earthquake swarm region revealed by deep seismic reflection profiling. Chin. J. Geophys. 49, 1701–1708.
Zhang, G. W., Lei, J. S., Liang, S. S., and Sun, C. Q. (2014). Relocations and focal mechanism solutions of the Aug. 3 2014 Ludian, Yunnan MS 6.5 earthquake sequence. Chin. J. Geophys. 57, 3018–3027. doi:10.6038/cig20140926
Zhang, M. (2015). “Earthquake location and detection,” ([Hefei (China)]: University of Science and Technology of China). Ph. D. thesis.
Zhang, M., and Wen, L. (2015). An effective method for small event detection: Match and locate (M&L). Geophys. J. Int. 200, 1523–1537. doi:10.1093/gji/ggu466
Zhang, W. T., Ji, L. Y., Zhu, L. Y., Jiang, F. Y., and Xu, X. X. (2021). A typical thrust rupture event occurring in the foreland basin of the southern tianshan: The 2020 Xinjiang Jiashi MS 6.4 earthquake. Seismol. Geol. 43, 394–409. doi:10.3969/j.issn.0253-4967.2021.02.009
Zhang, Y., Chen, Y. T., Xu, L. S., Wei, X., Jin, M. P., and Zhang, S. (2015). The 2014 MW 6.1 ludian, yunnan, earthquake: A complex conjugated ruptured earthquake. Chin. J. Geophys. 58, 153–162. doi:10.6038/cjg20150113
Zhang, Z. J., Teng, J. W., Badal, J., and Liu, E. (2009). Construction of regional and local seismic anisotropic structures from wide-angle seismic data: Crustal deformation in the southeast of China. J. Seismol. 13, 241–252. doi:10.1007/s10950-008-9124-0
Zhang, Z. Q., Chen, Y. S., and Lin, J. (2008). Stress interactions between normal faults and adjacent strike-slip faults of 1997 Jiashi earthquake swarm. Sci. China Earth Sci. 51, 431–440. doi:10.1007/s11430-008-0023-6
Zhao, C. P., Chen, Z. L., Zheng, S. H., and Zhang, Z. Q. (2008). Moment inversion of moderate earthquakes and the locally perturbed stress field in the Jiashi source region. Chin. J. Geophys. 51, 782–792.
Zhao, X., Huang, Z. B., and Fang, L. H. (2014). The study on focal mechanism of the MS6.1 Yingjiang, Yunnan earthquake. Earthq. Res. China 30, 462–473.
Zheng, X. F., Chen, C. H., and Zhang, C. H. (2008). Study on temporal variations of shear wave splitting in the Chiayi area, aftershock zone of 1999 Chichi earthquake, Taiwan. Chin. J. Geophys. 51, 115–124. doi:10.1002/cjg2.1200
Zhou, S. Y., Jiang, M. M., and Robinson, R. (2006). The role of fault interactions in the generation of the 1997 Jiashi strong earthquake swarm, Xinjiang, China. Chin. J. Geophys. 49, 1102–1109.
Zhou, S. Y., Xu, Z. H., and Chen, X. F. (2001). Analysis on the source characteristics of the 1997 Jiashi swarm, Western China. Chin. J. Geophys. 44, 654–662.
Keywords: 2020 Jiashi MS 6.4 earthquake, foreshock, seismicity detection, blind fault, shear-wave splitting
Citation: Li J, Gao Y and Zhou S (2023) Upper crust anisotropy of the 2020 Jiashi MS 6.4 earthquake. Front. Earth Sci. 11:1160676. doi: 10.3389/feart.2023.1160676
Received: 07 February 2023; Accepted: 15 May 2023;
Published: 26 May 2023.
Edited by:
Huaizhong Yu, China Earthquake Networks Center, ChinaReviewed by:
Lijun Chang, Institute of Geophysics, China Earthquake Administration, ChinaCopyright © 2023 Li, Gao and Zhou. This is an open-access article distributed under the terms of the Creative Commons Attribution License (CC BY). The use, distribution or reproduction in other forums is permitted, provided the original author(s) and the copyright owner(s) are credited and that the original publication in this journal is cited, in accordance with accepted academic practice. No use, distribution or reproduction is permitted which does not comply with these terms.
*Correspondence: Jin Li, bGlqaW42MjA1QDE2My5jb20=
Disclaimer: All claims expressed in this article are solely those of the authors and do not necessarily represent those of their affiliated organizations, or those of the publisher, the editors and the reviewers. Any product that may be evaluated in this article or claim that may be made by its manufacturer is not guaranteed or endorsed by the publisher.
Research integrity at Frontiers
Learn more about the work of our research integrity team to safeguard the quality of each article we publish.