 Darren Tan1*
 David Fee1
 Alicia J. Hotovec-Ellis2
 Jeremy D. Pesicek3
 Matthew M. Haney4
 John A. Power4
 Társilo Girona1
- 1Geophysical Institute, Alaska Volcano Observatory, University of Alaska Fairbanks, Fairbanks, AK, United States
- 2United States Geological Survey, California Volcano Observatory, Moffett Field, CA, United States
- 3United States Geological Survey, Volcano Disaster Assistance Program, Vancouver, WA, United States
- 4United States Geological Survey, Alaska Volcano Observatory, Anchorage, AK, United States
Volcanic earthquake catalogs are an essential data product used to interpret subsurface volcanic activity and forecast eruptions. Advances in detection techniques (e.g., matched-filtering, machine learning) and relative relocation tools have improved catalog completeness and refined event locations. However, most volcano observatories have yet to incorporate these techniques into their catalog-building workflows. This is due in part to complexities in operationalizing, automating, and calibrating these techniques in a satisfactory way for disparate volcano networks and their varied seismicity. In an effort to streamline the integration of catalog-enhancing tools at the Alaska Volcano Observatory (AVO), we have integrated four popular open-source tools: REDPy, EQcorrscan, HypoDD, and GrowClust. The combination of these tools offers the capability of adding seismic event detections and relocating events in a single workflow. The workflow relies on a combination of standard triggering and cross-correlation clustering (REDPy) to consolidate representative templates used in matched-filtering (EQcorrscan). The templates and their detections are then relocated using the differential time methods provided by HypoDD and/or GrowClust. Our workflow also provides codes to incorporate campaign data at appropriate junctures, and calculate magnitude and frequency index for valid events. We apply this workflow to three datasets: the 2012–2013 seismic swarm sequence at Mammoth Mountain (California), the 2009 eruption of Redoubt Volcano (Alaska), and the 2006 eruption of Augustine Volcano (Alaska); and compare our results with previous studies at each volcano. In general, our workflow provides a significant increase in the number of events and improved locations, and we relate the event clusters and temporal progressions to relevant volcanic activity. We also discuss workflow implementation best practices, particularly in applying these tools to sparse volcano seismic networks. We envision that our workflow and the datasets presented here will be useful for detailed volcano analyses in monitoring and research efforts.
1 Introduction
Volcanic earthquake catalogs are a crucial data product used by volcano observatories in tracking the migration of volcano-seismic activity and assessing the intensity of volcanic unrest (e.g., Roman and Cashman, 2006; McNutt and Roman, 2015). At volcano observatories, seismic analysts often undertake the arduous task of determining the onset times of seismic phase arrivals in order to locate candidate earthquakes picked up by automated triggering algorithms. However, this manual procedure can sometimes fall short due to human limitations, especially during peak volcanic activity where thousands of earthquakes can occur within the span of a few days (White et al., 1998; Buurman et al., 2013a). Further, with the rapid expansion of seismic networks around the globe, the quantity of seismic data is substantially increasing, making manually driven operations less sustainable and desirable.
Due to the aforementioned reasons, automated seismic data processing has long been a subject of interest within the volcano seismology community. From standard triggering algorithms (Withers et al., 1998) and correlation detectors (Gibbons and Ringdal, 2006; Beaucé et al., 2018; Chamberlain et al., 2018) to machine learning methods (Ross et al., 2018; Zhu and Beroza, 2019; Mousavi et al., 2020), there is no shortage of tools available to automate and reduce the workload of the seismic analyst. Instead, the main pitfalls that discourage observatories from incorporating such tools are the complexities in calibrating and operationalizing them (Orozco-Alzate et al., 2012; Malfante et al., 2018; Retailleau et al., 2022; Woollam et al., 2022). Different observatories store seismic data in different formats, sometimes even in separate databases, and the variable background noise levels at different volcanoes may also necessitate specifically tuned algorithm settings as well. The dependence of certain tools on dense seismic networks may also cause them to fail in areas with sparse networks (Frank and Abercrombie, 2018; Lomax and Savvaidis, 2022), further complicating their use. As such, the implementation of most of these tools is non-trivial, and they usually require expert intervention in order to acquire believable results at an adequate confidence level. For example, Lapins et al. (2021) leveraged transfer learning (Pan and Yang, 2010; Zhuang et al., 2020) to adapt the Generalized Phase Detection algorithm (Ross et al., 2018) for earthquake detection at volcanoes and produced an increase in detected seismicity beyond the capabilities of the base algorithm. Additionally, the types of volcano seismicity vary widely (e.g., long period events vs. volcano tectonic events (McNutt and Roman, 2015)), and no single algorithm may be appropriate for identifying or locating the seismicity.
In this study, we have developed a Python-based catalog enhancement framework to streamline the integration of four popular and open-source seismological tools at the Alaska Volcano Observatory (AVO), as part of the NSF-funded PREEVENTS eruption forecasting project. The framework integrates detection, matched-filtering, and relocation tools to improve analyst-derived seismic catalogs, creating high-precision catalogs that can inform interpretations of volcanic unrest and/or provide insight into subsurface volcanic processes. Unlike numerous popular machine learning methods that commence from the phase-picking stage, our workflow leverages the analyst-derived catalog and uses their events as a starting set of located earthquake templates, and introduces an option of adding more templates through an independent scan of the continuous seismic data. We also provide additional utilities in our workflow, such as sample plotting scripts, earthquake magnitude and frequency index (Buurman and West, 2010) calculations, and integration of campaign or backfilled (non-real-time) data.
While we acknowledge the extraordinary results demonstrated by recent implementations of machine learning methods, here we focus on the novel integration of the selected tools which have each been broadly tested by the volcano seismology community. Notably, our framework does not require training data in a way that many machine learning methods do; although the analyst-derived catalog is capitalized upon for event locations, it is not required to derive an event list to interpret changes in event rate. The focus of our framework is to address the unique challenges of sparse networks, poorly resolved velocity models, and often undesirable station geometries at remote Alaska volcanoes (Dixon et al., 2019). We hope to supplement the current operational tools at AVO rather than to replace them. Further, we aim to provide a more human-verified method of deriving a complete, high-precision catalog, which can serve as a stepping stone for research and operational confidence toward the variety of hands-off, automated methods available in the seismology literature. In addition, we discuss the caveats of our selected tools, and offer reasonable starting configurations and recommendations on how key parameters can or should be adjusted. Although designed for use at AVO, our open-source workflow can be easily implemented at other volcano observatories and on stand-alone research projects.
2 Methods
Our workflow, illustrated in Figure 1, integrates the tools REDPy (Hotovec-Ellis and Jeffries, 2016), EQcorrscan (Chamberlain et al., 2018), HypoDD (Waldhauser and Ellsworth, 2000; Waldhauser, 2001), and GrowClust (Trugman and Shearer, 2017) into three key steps: 1) constructing a comprehensive and curated set of matched-filter templates, 2) running the matched-filter scan, and 3) executing relative relocation. REDPy and EQcorrscan, which both require continuous seismic data for their implementation, can be applied directly to data queried off an online client or on locally stored miniseed files, the latter being a significantly faster option. Our workflow also provides the option to incorporate campaign seismic data at different junctures, as well as the ability to calculate magnitudes for new matched-filter detections. We also provide within our tool package template scripts to plot hypocenters using PyGMT (Uieda et al., 2021). Our code is open source and publicly maintained on Github (see Data and Resources for link). Interested users should note, however, that our code primarily caters to the AVO seismic network and catalogs, and certain adjustments might be required prior to use at different volcano-seismic settings.
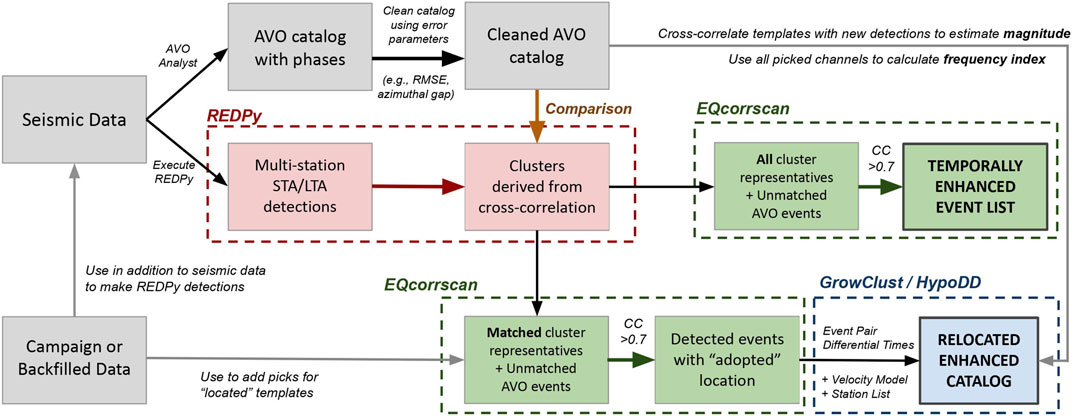
FIGURE 1. Flowchart encompassing REDPy (red dotted box), EQcorrscan (green dotted boxes) and relative relocation tools HypoDD and GrowClust (blue dotted box). Light gray lines represent optional utilities, which include the incorporation of campaign data, magnitude calculation and frequency index calculation. Note that a key comparison is made between the AVO catalog and the REDPy detections in order to grant matching REDPy cluster representatives phase picks, hypocenter, and magnitude information (this is further illustrated in Supplementary Figure S1). The two divergent EQcorrscan pathways stemming from the REDPy output are separated based on the possibility of producing event locations in the output data product. HypoDD and GrowClust can be used independently or in combination with one another for relative relocation in our workflow.
2.1 Constructing a comprehensive and curated set of matched-filter templates
Most matched-filter efforts in volcano seismology have relied on a pre-existing, analyst-derived earthquake catalog to create template waveforms (Aso et al., 2011; Zhang and Wen, 2015; Lengliné et al., 2016), with some studies using a clustering algorithm beforehand so as to reduce the total number of templates and the subsequent matched-filter processing time (Salvage et al., 2018; Abramenkov et al., 2020). While our workflow follows a similar convention, we first conduct an independent scan on the seismic data using REDPy (Hotovec-Ellis and Jeffries, 2016) in order to capture additional low frequency earthquakes and low magnitude volcano-tectonic events. Such events are often omitted in analyst-derived catalogs due to their failure in satisfying the minimum AVO requirement of having 3 P-arrivals and 2 S-arrivals, and a travel-time root-mean-square error (RMSE) below 0.30 s for hypocenter finalization (Dixon et al., 2019). REDPy is an increasingly popular tool used to detect and analyze the temporal evolution of repeating seismicity, and its applicability has been demonstrated in numerous volcanic settings (Salvage et al., 2018; Wellik et al., 2021; Hotovec-Ellis et al., 2022). In particular, REDPy utilizes a standard short-time average/long-time average (STA/LTA) algorithm (Allen, 1978) to trigger on events, before cross-correlating each event with successive triggers in an attempt to group them into clusters. Events which manage to correlate with a successive trigger above a user-defined threshold are stored as “repeaters,” while events that fail to match another event within a user-defined time window are retired as “orphans.” As a tool, REDPy stores event amplitudes and cross-correlation coefficients, and computes the inter-event time and frequency index of each repeater event. Frequency index (FI), which is calculated on a stacked spectrum across selected local seismic stations, describes the ratio of high frequency to low frequency energy of an earthquake, and its often-bimodal distribution has been used to distinguish between volcano-tectonic and low frequency earthquakes at several Alaska volcanoes (Buurman and West, 2010; Ketner and Power, 2013). REDPy also identifies the representative event of each cluster (hereinafter called the “core”) using the Ordering Points To Identify Clustering Structure (OPTICS) algorithm (Ankerst et al., 2008). The cluster cores, when ported forward as matched-filtering templates (Figure 2), allow us to represent the variety of detected seismic signals with a significantly smaller subset of events. Comparisons between the analyst-derived catalog and the REDPy cores also allow us to transfer the phase picks, magnitudes, and locations of analyst-derived events to their coincident REDPy core event (Figure 1). However, it should be noted that some analyst-derived events can be missed by REDPy if they are of low amplitude or show non-repeating behavior, and REDPy itself might not consistently pick up low frequency events given its fixed STA/LTA trigger setting. Nevertheless, the set of events that we recommend as templates for the subsequent matched-filter step are the set of all REDPy cores and the leftover analyst-derived events that do not have a coincident REDPy detection. In instances where REDPy cores do not match with any analyst-derived event, the user can also opt to select the matched event with the highest magnitude within the REDPy cluster as a replacement for the unmatched core. Doing so will maximize the number of templates with hypocenter and magnitude information, which in turn maximizes the number of relocatable detections entering the relocation step.
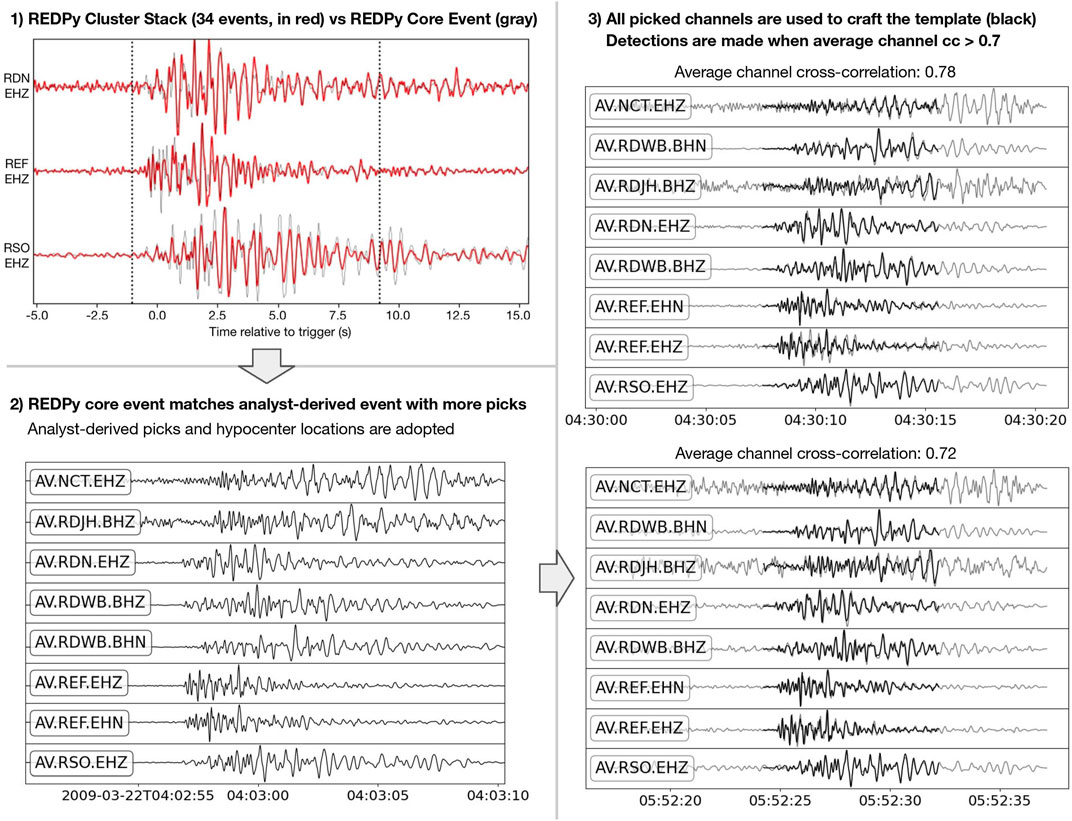
FIGURE 2. Example of how a REDPy cluster stack (panel 1, in red) correlates well with the OPTICS-derived cluster core (panel 1, in gray, almost fully obscured), which in turn coincides with an analyst-derived event with phase picks on more stations (panel 2). EQcorrscan trims the waveforms from this selected event about its phase arrivals on each channel (panel 3, black), before cross-correlating them on the continuous seismic data (panel 3, in gray). Two successful detections with average channel cross-correlation coefficients exceeding 0.7 are shown with the template waveform overlying the matching segment. All waveforms shown are obtained from our analysis of the 2009 eruption of Redoubt Volcano, Alaska.
2.2 Running the matched-filter scan
The second step in our workflow involves using EQcorrscan (Chamberlain et al., 2018) to execute a matched-filter scan using the curated set of events obtained from the previous step. EQcorrscan is another popular, open-source tool that detects and characterizes repeating seismicity by cross-correlating template waveforms on continuous seismic data. However, unlike REDPy, it does not require an increase in seismic amplitude to trigger, and is therefore better suited to detect low amplitude events or overlapping events buried in noise. EQcorrscan has been used in numerous volcanic applications (Hotovec-Ellis et al., 2018; Wech et al., 2018; Giron et al., 2020), including some studies where REDPy detections are used as templates (Salvage et al., 2018; Salvage and Eaton, 2022). EQcorrscan extensively leverages ObsPy (Beyreuther et al., 2010) for its waveform processing procedures. In order to construct templates, EQcorrscan first loads the corresponding seismic data of each input event on every phase-picked channel, before trimming the data around each phase arrival (Figure 2) and filtering them based on user specifications. A minimum signal-to-noise ratio threshold can also be set to exclude noisy data channels when constructing these templates. After template creation, EQcorrscan is able to execute template matching across the continuous seismic data using any of its three available threshold parameters: the Median Absolute Deviation (MAD) of the summed correlation across all channels for a predetermined time period (e.g., daily), the absolute summed correlation across all channels, or the average correlation across all channels. The use of MAD has been popular in many implementations of the matched-filter technique (Shelly et al., 2007; Kato et al., 2015; Yukutake et al., 2019), but our testing using visual corroboration has shown that the desirable MAD threshold varies greatly for our tested Alaska volcanoes. When experimenting with commonly used MAD thresholds between 9 and 15, we obtain an overwhelming number of bad detections
After the matched-filtering process, our workflow diverges into two paths that produce unique data products (dashed green boxes in Figure 1). The first path is straightforward—the event times of every detection, regardless of their parent template, are stored in what we term as a temporally enhanced event list. This event list is best used to determine seismic rates and analyze trends in frequency index. However, as not all detections are derived from a parent template with an analyst-derived hypocenter location, there is no spatial information offered by this data product. The second path, on the other hand, only carries forward detections whose parent templates are associated with an analyst-derived event. These detections would adopt their parent template’s picks (offset by the time difference between the template and detection events), and are assigned the same hypocenter location as their parent template, thereby overlapping them in space. Both the transference of pick information and the colocation assumption are necessary for the subsequent relative relocation step, which serves to “disperse” the matched-filter detections around their parent template’s hypocenter location using miniscule differences in phase arrival times at commonly picked stations. We further illustrate the distinction between the two data products and transference of pick and location information in Supplementary Figure S1.
2.3 Executing relative relocation methods
The final step of our workflow involves the use of relative relocation methods to relocate clusters of detected seismicity (Figure 1). This process creates higher precision hypocenter locations, ideally providing insight into subsurface volcanic features and their spatio-temporal processes (Pesicek et al., 2008; Statz-Boyer et al., 2009; Matoza et al., 2021). For this step, we use two standout double-difference relocation tools that have been extensively used in volcano seismology: HypoDD (Waldhauser and Ellsworth, 2000; Waldhauser, 2001), and GrowClust (Trugman and Shearer, 2017). Although both tools similarly relocate earthquakes by minimizing the observed and calculated travel-time differences between event pairs, there exist several noteworthy differences in their double-difference solutions. HypoDD associates event pairs by hypocenter proximity, and executes its relocations using both phase differential travel times and cross-correlation differential travel times. On the other hand, GrowClust associates event pairs by waveform similarity, and executes its relocations using only cross-correlation differential times. The two tools also use different misfit functions: HypoDD relies on the commonly used L2 norm, but GrowClust uses the L1 norm which penalizes outliers to a lesser extent. Although GrowClust has been shown to produce similar relocations as HypoDD when sufficient cross-correlation differential time observations are used (Trugman and Shearer, 2017), we find that differences in relocations in areas with sparse networks (e.g., at most Alaska volcanoes) can be drastic and clustering and relocations are often unrealistic. This is due in part to the undesirably low number of cross-correlation differential time observations at Alaska volcanoes, which we find to be usually less than 6 even at the better-instrumented volcanoes (Ruppert et al., 2011; Power et al., 2020). In the Trugman and Shearer (2017) “sparse network” example, using a minimum of 8 differential times per event pair resulted in significant differences between HypoDD and GrowClust relocations. Other independent implementations of GrowClust and HypoDD have required a minimum of 8 differential time observations per event pair to consider events well-relocated (Shelly and Hill, 2011; Montgomery-Brown et al., 2019; Matoza et al., 2021), although this number can go up to more than 20 observations per event pair at densely instrumented study areas (Shelly, 2020). Requiring at least 8 differential time observations is necessary to cover the total number of free parameters being solved for in the inversion, assuming no hypocenter parameters are fixed (Kintner et al., 2022). In addition, passing only cross-correlation differential times for relocations (such as in GrowClust) in sparse network settings might introduce an azimuthal bias, as only stations that demonstrate acceptably high correlation values between template and detection waveforms are considered in the relocation process. The inclusion of catalog differential times or absolute phase times (such as in HypoDD and tomoDD (Zhang and Thurber, 2003; 2006)) helps to address this. Solely relying on cross-correlation differential times is therefore challenging and potentially undesirable for sparsely instrumented volcanic settings.
As such, for our workflow, we propose that every template event should first be relocated using HypoDD’s phase differential time approach (i.e., using the dt.ct HypoDD input file) as a first-pass. Doing so revises the independently determined observatory hypocenter locations, shifts cluster centroids, and reduces the reliance on the seismic velocity model which may be inaccurate. The cross-correlation differential times HypoDD input file (dt.cc) can then be created using EQcorrscan’s write_correlations function, where we cross-correlate all matched-filter templates and detections with one another. The relocation by cross-correlation differential times can then be executed using either HypoDD or GrowClust, though we find that HypoDD is preferred for sparse networks due to the greater number of control parameters available (the user will be able to discard outliers and damp solutions more harshly as necessary). Such a hybrid approach has also been suggested in the relocation methods described in machine learning workflows (Zhang et al., 2022). Lastly, our workflow provides the necessary wrappers to extract the relocation outputs as ObsPy Catalog objects, regardless of the relocation tool used. Users are then able to easily save the relocated, enhanced catalog in any ObsPy-compatible format.
2.4 Other utilities
Within our open-source repository, we also provide a method to calculate earthquake magnitudes of the new matched-filter detections using an amplitude-ratio and cross-correlation based method available in EQcorrscan (Chamberlain et al., 2018). Specifically, the method calculates the relative magnitude of a new detection by comparing its amplitude with that of its parent template, while accounting for a bias due to the degradation of waveform similarity between event pairs (Schaff and Richards, 2014). The bias, which is removed via magnitude subtraction, is determined by an analytical expression that uses the cross-correlation coefficient and signal-to-noise ratios of both events. In addition to the magnitude calculation tool, we also provide a simple function that calculates frequency indices of the new detections (Buurman and West, 2010), and several plotting scripts to visualize both the temporally enhanced event list and relocated, enhanced catalog. Lastly, we include the option to incorporate campaign or backfilled data at two junctures: the first being prior to REDPy, where the data are used to enhance network sensitivities to generate more templates, and the second being after template creation, where the data are used to add picks to already-determined template events to better anchor them during relocation. Although the former method of incorporating the data allows the workflow to detect more events, it will inevitably skew event rate interpretations during the campaign period due to heightened network sensitivity.
3 Workflow calibration and application to Alaska volcanoes
In order to test and calibrate our workflow described in Section 2, we first implement the described tools on a dataset of deep seismic swarms located below Mammoth Mountain between October 2012 and January 2013. Previous work has shown that the seismicity during this 4 month period consisted of a notable “forked” distribution around an interpreted partial melt zone, and also showed several instances of migrating seismic bursts (Hotovec-Ellis et al., 2018). Applying our methods on a previously studied volcano-seismic swarm (detailed in the Supplementary Text S2) enables us to compare and benchmark our methods against a more curated implementation of EQcorrscan and HypoDD in Hotovec-Ellis et al. (2018). Specifically, Hotovec-Ellis et al. (2018) conducted a swarm-specific matched-filter scan, restricting their search for matches in a 24 h window before and after each template event to reduce computational overhead and focus on temporal changes. Further, they conducted relative relocation using a dt.cc file built with a more sophisticated weighting scheme, and relocated events had to meet a stricter requirement of having 20 differential time pairs. In comparison, our implementation scans the full duration-of-interest (4 months) using a smaller but representative set of template events, and we opt to use an unmodified dt.cc weighting scheme instead. Despite the differences, our workflow produces comparable detection numbers and relocation results (Supplementary Figures S3–S5), and this agreement gives us the confidence in our implementation to attempt more challenging volcanic settings in Alaska. We proceed to reanalyze seismic data from the 2009 eruption at Redoubt Volcano and the 2006 eruption at Augustine Volcano, which both have corresponding seismic catalogs published by AVO (Dixon et al., 2008; Dixon et al., 2010) and are well-studied in the literature. Although AVO’s catalog construction method has evolved over time (Power et al., 2019), the determination of earthquake hypocenters has consistently followed the same semi-automatic procedure where coincident amplitude triggers are visually inspected and subsequently located by a seismic analyst. It is worth noting that AVO requires several conditions to be met before an event is selected for hypocenter and magnitude determination: 1) it must have a P- and S-wave separation of less than 5 s on the closest station, 2) it must have 3 P-phases and 2 S-phases detected across at least 3 seismic stations, 3) hypocentral errors must be less than 15 km, and 4) travel-times must have an RMSE
3.1 Application to Redoubt Volcano’s 2009 eruption
Redoubt Volcano is an andesitic stratovolcano located in south-central Alaska, approximately 170 km southwest of Anchorage, Alaska’s most populous city. In March 2009, Redoubt Volcano erupted explosively after approximately 6 months of precursory seismic activity (Bull et al., 2013). The eruption had multiple explosive phases and occurred over 4.5 months, producing numerous seismic swarms and several notable shifts in background seismic rate. Redoubt Volcano’s pre-, syn- and post-eruptive seismicity have been analyzed thoroughly by numerous studies (Buurman et al., 2013a; Haney et al., 2013; Ketner and Power, 2013; Power et al., 2013; Roman and Gardine, 2013), most of which opted to improve upon the AVO catalog by using independent methods to make automated detections or recalculate hypocenter locations. Substantial effort has been made to characterize the seismic swarms which preceded explosions and accompanied dome growth (Buurman et al., 2013a; Ketner and Power, 2013), as well as to draw comparisons with Redoubt Volcano’s previous eruption in 1989–1990 (Power et al., 1994). In particular, Power et al. (2013) hypothesized that Redoubt Volcano is composed of 3 seismogenic zones: 1) a deep magmatic source zone at 28–32 km depth marked by deep long-period earthquakes, 2) a mid-crustal magma storage zone at 3–9 km depth, and 3) a shallow system of cracks from 3 km depth that penetrate the crater floor. It is also suggested that Redoubt Volcano’s shallow magma storage is likely a network of sills and dykes – previous tomographic inversions show no evidence of a large low velocity zone (Benz et al., 1996; DeShon et al., 2007).
For this eruption, we run our workflow on seismic data recorded on 10 stations situated within 25 km of the volcano’s summit (Figure 3A) over the timespan between April 2008 (before the onset of deformation in May (Grapenthin et al., 2013)) and September 2009 (return to background). Although 10 stations might seem like a reasonably dense distribution for volcanoes, network and noise issues often plague active stations in the region, causing the count of useful stations to often drop to 5 or 6 for our scenario. We additionally note that there are some short bursts of seismicity detected later in December 2009 and April 2010 (Buurman et al., 2013c), but we find them to be separated from the main eruptive unrest by months of quiescence, and choose not to extend our scan further for computational reasons. We bandpass filter seismic data from the Redoubt Volcano network between 1 and 10 Hz for triggering and cross-correlating purposes. In commencing the workflow, we run REDPy on the vertical channels of three permanent short-period seismic stations: REF, RDN and RSO, that each demonstrated minimal data gaps and high signal-to-noise, until RSO had to be dropped due to it being disabled by the first explosion on 23 March 2009. A coincident trigger on at least 2 stations is required to register a detection, and a cross-correlation coefficient of 0.85 is used to group REDPy detections into clusters. In total, REDPy detects 22,814 repeater events spanning 871 clusters over the study period. Of the 871 cluster cores, 111 are found to be associated (i.e., event time difference less than 4 s to account for early or late arrivals) with one of the 3,587 AVO analyst-derived events identified during the same timespan. All cluster cores are then consolidated with the 1,796 unmatched AVO events to be used as EQcorrscan templates in the subsequent steps. At this juncture, we leverage 4 additional campaign broadband instruments (RD01, RD02, RD03, and RDW) deployed on Redoubt Volcano from 21 March 2009 (Figure 3A), and use a simple STA/LTA algorithm (Allen, 1978) to assign additional P-picks for all template events that occurred from the start of the campaign to the end of the eruption. Using EQcorrscan, the waveform on each picked channel of each template event is filtered, downsampled to 50 Hz, and trimmed to 8-second-long segments starting from 1 s prior to the time of each phase pick. Through the matched-filter process, we derive a temporally enhanced event list with 33,281 matched-filter detections using an average cross-correlation threshold of 0.7, of which 5,719 are candidates for relocation. The relocatable events are then fed into HypoDD, where their hypocenters are iteratively shifted using first the catalog differential times, and then the cross-correlation differential times. We require a minimum of 8 catalog differential times and 3 cross-correlation differential times for event pairs to be included. Although these requirements remove a significant number of candidate events, we find that including poorly linked event pairs reduces the overall quality of the relocation results. By using the same 1D velocity model used by AVO to locate Redoubt Volcano earthquakes (Power et al., 2019), we arrive at an enhanced catalog with 3,328 successfully relocated events and 2,391 unshifted events. As a comparison, Ketner and Power (2013) detected a total of 126,789 events from January 1 to 30 June 2009, albeit using only a single station trigger, and Buurman et al. (2013b) derived a much smaller relocated catalog of 346 events that mostly occurred between April and June of 2009.
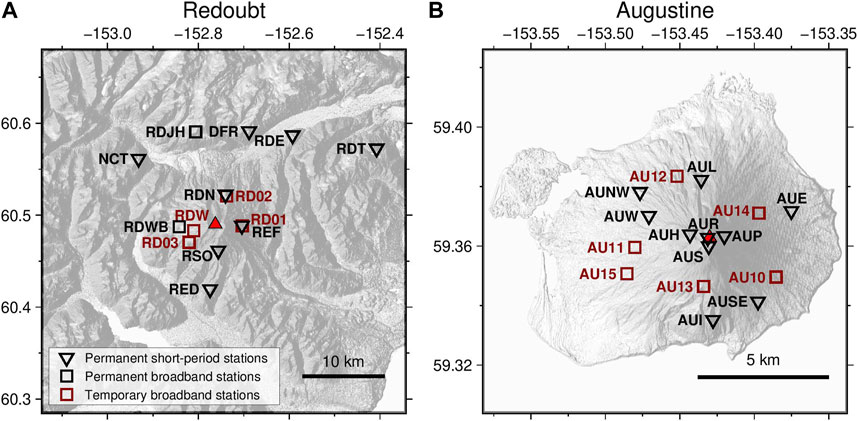
FIGURE 3. Map of Redoubt Volcano (A) and Augustine Volcano (B) showing the locations of the seismic stations used in our analysis. Black triangles represent permanent short-period stations, black squares represent permanent broadband stations, and red squares represent temporary broadband stations. The solid red triangle represents the main lava dome location during Redoubt Volcano’s eruption in 2009 and Augustine Volcano’s eruption in 2006.
Using the temporally enhanced event list, we calculate and plot trends in frequency index revealed by our workflow over the analysis time period in Figure 4. Although the Redoubt Volcano seismic network struggled with data availability and noise issues throughout 2008 (Buurman et al., 2013a) with only 2 active stations in the indicated network impairment period (Figure 4A), a noticeable increase in the seismic rate can be observed when pre- and post-impairment seismic rates are compared. Specifically, the week-long histogram bins in Figure 4A record approximately 60 events per week prior to mid-April 2008, and approximately 120 events per week in late-June 2008. This observed increase coincides with the recovery of a key station near the summit of the volcano (REF). While we cannot definitively conclude that the June 2008 uptick is the onset of pre-eruptive seismicity, comparison with background rates prior to REF’s data quality issues suggest that the observed uptick could be considered as a late time bound to the pre-eruptive ramp up. This means that seismic unrest could have picked up at least 9 months prior to the onset of the eruption, and 5 months before AVO first raised the color code from Green to Yellow. According to Power et al. (2013), the earliest reported sign of unrest of Redoubt Volcano was a strong sulfur smell downwind observed in mid-July 2008, and retrospective seismic analysis found no unusual earthquake activity associated with the onset of observable unrest (Ketner and Power, 2013). Other retrospective analyses suggest a subtle increase in radiant heat flux starting in mid-2006 (Girona et al., 2021), volcanic deformation starting from May 2008 (Grapenthin et al., 2013), and anomalous high-temperature thermal activity was not observed until after the first explosion in March 2009 (Webley et al., 2013).
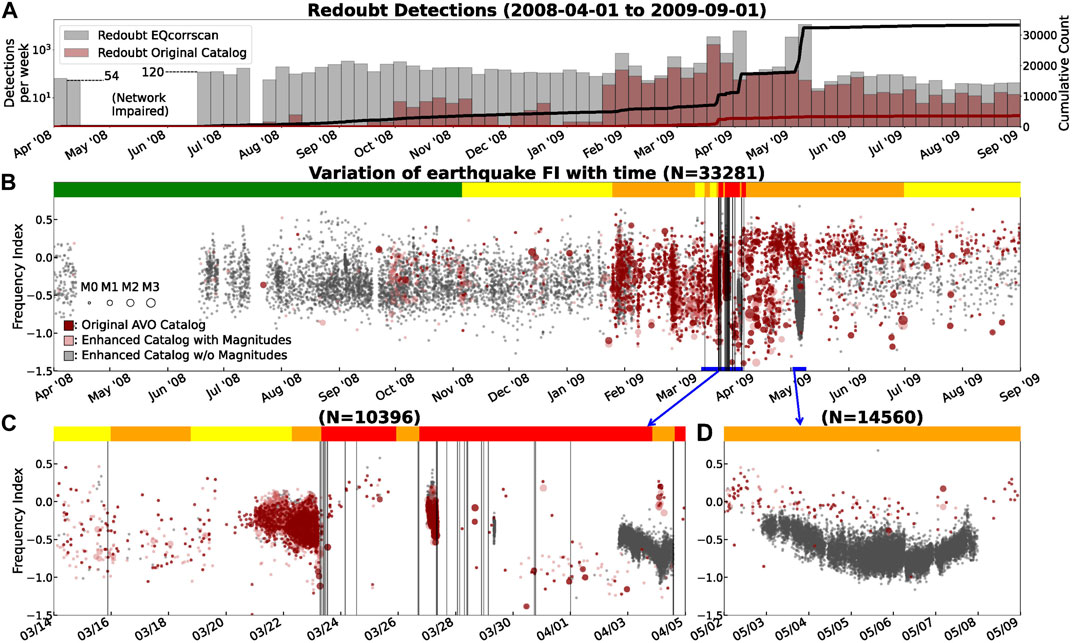
FIGURE 4. Redoubt Volcano’s temporally enhanced event list (April 2008 to September 2009) plotted as seismic event count and frequency index vs. time. (A) Number of events detected per week plotted as a log-scale histogram, along with the cumulative count of events plotted as stepped lines on a linear scale. (B) Frequency indices of all detections, sized by magnitude. Analyst-derived events from the original AVO catalog are colored in dark red while newly-detected earthquakes are colored in light red (magnitude calculated) and gray (no magnitude due to unmatched template). Black vertical lines indicate explosions recorded by AVO, and AVO color codes are illustrated as a horizontal bar at the top of each subplot. Two periods-of-interest (blue bars) are shown using a finer time axis: (C) the explosive phase in March 2009 and (D) an extensive May 2009 seismic swarm not present in the AVO catalog.
When analyzing the same plots in finer time scales, we observe the additional identification of low magnitude, high frequency earthquakes during the explosive phase in March 2009 and a sizable seismic swarm before the final recorded explosion on 5 April 2009 (light red and gray markers in Figure 4C, respectively). Perhaps of greater interest is the cluster of more than 14,000 events that we detect over a span of a week in May 2009 (Figure 4D). This extremely populous seismic swarm in May was previously identified by Ketner and Power (2013) as well, but no attempts at magnitude calculation, hypocenter determination, or source processes were made. Ketner and Power (2013) did note, however, that the swarm was contemporaneous with increased gas emissions (Lopez et al., 2013) and changes in dome extrusion behavior and composition (Bull et al., 2013; Coombs et al., 2013). The transition in frequency index just before May 7 was also noted to be synchronous with the onset of intense rockfalls (Ketner and Power, 2013). As the templates used to detect the swarm are not derived from an AVO catalog event nor an associated REDPy core, we do not have reference events to compute relative magnitudes and locations for the events. It is likely that this large swarm was omitted from the routine catalog due to the sheer number of events needed to be picked by the seismic analyst, and the difficulty of picking S arrivals for hypocenter finalization given the intensity of seismic activity.
Figure 5 compares the hypocenter distribution between the original AVO catalog and the relocated enhanced catalog. Although we do not see any clear spatial trends in time or frequency index (Supplementary Figures S6, S7), we observe a clustering of events underneath the location of Redoubt Volcano’s lava dome during its 2009 eruption. A large majority of the relocated seismicity congregates at 0–6 km depth below sea level (BSL), which is consistent with prior relocation work done by Buurman et al. (2013b). Plotting the same hypocenters as a 2D histogram (Supplementary Figure S8) also reveals that seismicity is primarily concentrated in the 0–3 km BSL depth range, which is interpreted as a seismogenic, shallow system of cracks by Power et al. (2013). Omitted from Figure 5 are several deep, long-period earthquakes recorded in December 2008 in the AVO catalog. Our workflow found no additional deep events through matched-filtering despite the templates having high signal-to-noise on their picked stations. The original deep events were also rejected by our relocation algorithm, presumably due to poor inter-event correlation.
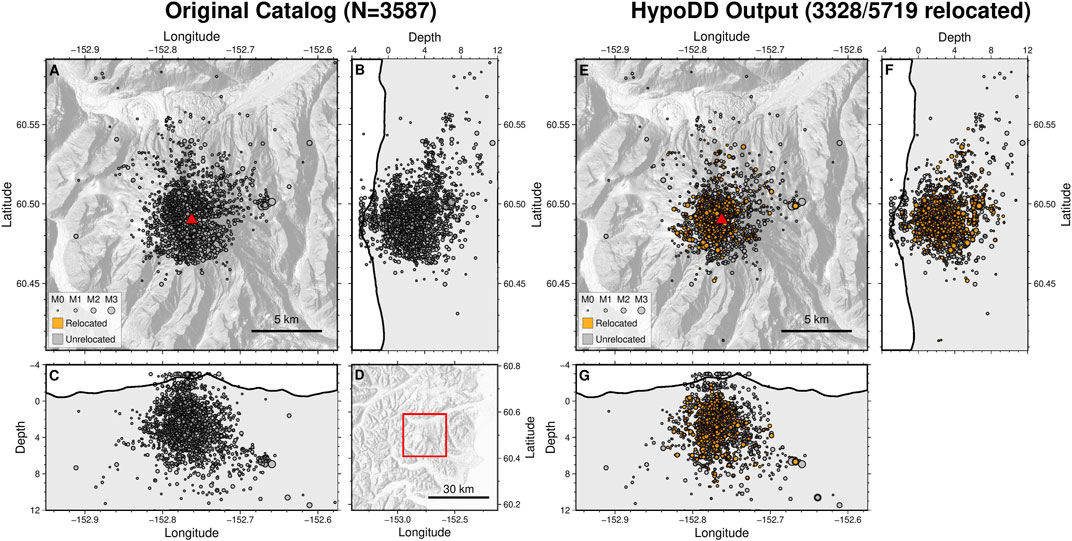
FIGURE 5. Hypocenter plots of the original AVO catalog (left) and relocated enhanced catalog (right) for Redoubt Volcano. Successfully relocated events are colored orange, while unrelocated events are colored gray. The red triangle marks the lava dome location. (A) shows the top-down view of all hypocenters from the original catalog, while (B,C) show N-S and E-W cross-sections centered on the coordinates of the dome with 0 km depth representing sea level. (D) shows the focus area relative to the wider area of Redoubt Volcano. (E–G) shows the hypocenters from the relocated enhanced catalog in the same layout as (A–C). The relocated enhanced catalog demonstrates a tighter cluster of events underneath the lava dome location, and most of the relocated seismicity congregate at 0–6 km depth below sea level. Supplementary Figure S8 plots the same hypocenters as a 2D histogram on each panel, in order to highlight finer earthquake density distribution patterns obscured by the dense cloud of seismicity.
3.2 Application to Augustine Volcano’s 2006 eruption
Augustine Volcano is another active volcano in the eastern Aleutian arc, located on its own volcanic island in Cook Inlet, 290 km from Anchorage. In January 2006, Augustine Volcano ended a 20-year repose with 13 recorded explosions over a span of 20 days. Prior to the onset of its explosive eruptions, past work noted approximately 8 months of precursory seismic activity, as well as other indicators of unrest such as edifice inflation, increased gas emissions and thermal anomalies (Cervelli et al., 2006; Zhan et al., 2022). Similar to Redoubt Volcano, the seismic activity spanning Augustine Volcano’s eruption sequence was well explored by numerous previous studies (Buurman and West, 2010; DeShon et al., 2010; Jacobs and McNutt, 2010; Power and Lalla, 2010; Dawson et al., 2011; Syracuse et al., 2011), many of which relied on additional detections and relocation efforts for their analyses. Out of the many interpretations on Augustine Volcano’s eruptive seismicity, of note are the decreased b-values in its pre-eruptive earthquake swarm (Jacobs and McNutt, 2010) and low FI events occurring contemporaneously with Augustine Volcano’s many explosions (Buurman and West, 2010). Power and Lalla (2010) suggested that Augustine Volcano’s subsurface magmatic system in 2006 was comprised of a magma source at approximately 3–5 km depth BSL—an interpretation supported by seismic, geodetic, and petrologic evidence (Cervelli et al., 2006; Larsen et al., 2010).
For this eruption, we use 15 permanent and campaign seismic stations installed on Augustine Island over the course of the eruption (Figure 3B) and analyze the time period between April 2005 (increase in seismic and rockfall activity) to May 2006 (return to background (Jacobs and McNutt, 2010; Power and Lalla, 2010)). Like the network situation at Redoubt Volcano, noise conditions and data coverage vary greatly over the course of the eruption, which significantly reduces the number of useful stations at any given time. All seismic data are bandpass filtered between 1 and 10 Hz. Although previous seismic studies found that Augustine Island earthquakes exhibit substantial high frequency energy in the 10–20 Hz range (Buurman and West, 2010), preliminary runs of REDPy and EQcorrscan that retained higher frequency components of the data introduced more noise and lowered correlations instead, which impaired each tool’s performance. In executing REDPy, we opt to use vertical channels of 4 seismic stations at a time. We start with short-period stations AUH, AUI, AUP, and AUS (Figure 3B), and whenever any of these were destroyed by a volcanic explosion we replace them with the next best (i.e., next highest signal-to-noise) station available. Specifically, AUW replaces AUS on 15 Dec 2005, AUE replaces AUP on 13 Jan 2006, and campaign broadband station AU13 replaces AUH on 27 Jan 2006. The final set of stations, AU13, AUI, AUE, and AUW, cover the final effusive phase of the Augustine Volcano’s 2006 eruption: 3 March to 16 March 2006. Although this set of stations is a mix of short-period and broadband instruments, the data are re-sampled and similarly filtered to maintain consistency in trigger sensitivity. Similar to Redoubt Volcano, we require a coincident trigger on at least 2 stations for REDPy detections, and a cross-correlation coefficient of 0.85 to group detections into clusters. In total, REDPy detects 1754 repeater events spanning 257 clusters, and of the 257 cluster cores, 78 are found to be associated with one of the 1,635 AVO analyst-derived events identified during the same timespan. All cluster cores are consolidated with the 1,285 unmatched AVO events, and additional P-picks are added using 5 out of 6 campaign stations (AU11, AU12, AU13, AU14, AU15) that were deployed from 20 December 2005 through the eruption sequence. The omitted campaign station, AU10, suffered from water damage and did not return any useful data. Using EQcorrscan, waveforms are filtered, downsampled to 50 Hz, and trimmed to 8-second-long segments on each channel before being used as templates. Altogether, we obtain 4,420 matched-filter detections in our temporally enhanced event list using a cross-correlation threshold of 0.6, and 2,084 of them are candidates for relocation. Relocations done using HypoDD with a minimum requirement of 8 catalog differential times and 3 cross-correlation differential times ultimately provide us with a relocated enhanced catalog of 1,585 events. Notably, we use a sub-sampled 1D velocity model for Augustine Volcano adapted from Syracuse et al. (2011), as preliminary relocations conducted with the AVO velocity model for Augustine Volcano (Power et al., 2019) led to skyward hypocenter migrations and numerous earthquake locations above the surface (“airquakes”).
Similar to the plots derived for Redoubt Volcano, we calculate and plot temporal trends in frequency index for the temporally enhanced event list (Figure 6), and plot hypocenter comparisons between the original AVO catalog and the relocated enhanced catalog (Figure 7). In Augustine Volcano’s case, our workflow detects a comparable number of earthquakes compared to the original AVO catalog, with notable exceptions including several clusters of low magnitude events in January and March 2006 (Figures 6A, C, D). The obvious seismic gap in the swarm of drumbeat earthquakes (Bell et al., 2017) highlighted in Figure 6D is artificial. The seismic rate during this time was so high that a continuous signal was formed and individual events could not be distinguished (Power and Lalla, 2010). This extensive swarm was also noted to coincide with the final effusive phase at Augustine Volcano (Coombs et al., 2010).

FIGURE 6. Augustine Volcano’s temporally enhanced event list (April 2005 to May 2006) plotted as seismic event count and frequency index vs. time. Figure set up is the same as Figure 4. (A) Number of events detected per week plotted as a log-scale histogram, along with the cumulative event count plotted as stepped lines on a linear scale. (B) Frequency indices of all detections, sized by magnitude. Analyst-derived events from the original AVO catalog are colored in dark red while newly detected earthquakes are colored in light red (magnitude calculated) and gray (no magnitude due to unmatched template). Black vertical lines indicate explosions recorded by AVO, and AVO color codes are illustrated as a horizontal bar at the top of each subplot. Two periods-of-interest (blue bars) are shown using a finer time axis: (C) the explosive phase in January 2006, and (D) a prominent swarm of drumbeat earthquakes omitted by the AVO catalog during the dome building phase in March 2006. The mid-swarm seismic gap shown in (D) is due to the drumbeat earthquakes occurring so rapidly in time such that individual events cannot be distinguished.
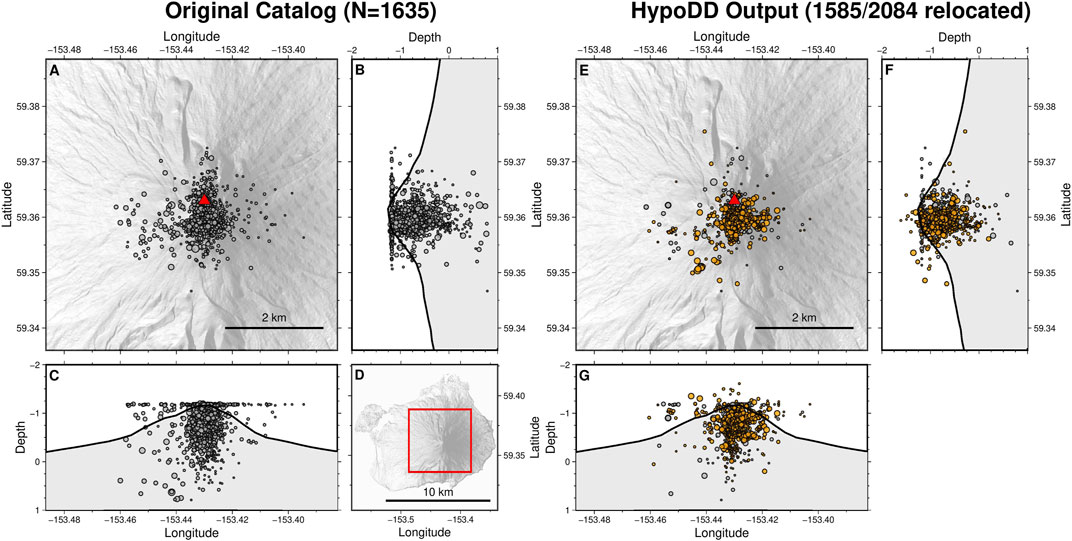
FIGURE 7. Hypocenter plots of the original AVO catalog (A–D) and relocated enhanced catalog (E–G) for Augustine Volcano. Figure set up is the same as Figure 5. The relocated enhanced catalog demonstrates a lower number of airquakes, and a compact cluster of events skewed toward the area south of the dome close to the summit, similar to relocations obtained by Syracuse et al. (2011) and Power and Lalla (2010). Overall, most of the relocated seismicity at Augustine Volcano congregates close to the surface. Supplementary Figure S11 plots the same hypocenters as a 2D histogram on each panel, in order to highlight finer earthquake density distribution patterns obscured by the dense cloud of seismicity.
In Figure 7, we observe a slight narrowing in the spread of hypocenters immediately underneath the edifice of Augustine Volcano. Our relocated catalog also consists of only two-thirds the number of events in the original AVO catalog. This seemingly low number of relocated events is somewhat expected, as previous attempts at double-difference relocation at Augustine Volcano have failed to produce stable results due to noisy site conditions, topography-induced errors, and poor station geometry (Sumiejski et al., 2009; DeShon et al., 2010). Correlation analyses by DeShon et al. (2010) also revealed that the events that occurred during Augustine Volcano’s 2006 eruption show a low degree of similarity, which limits the usefulness of double-difference methods in our workflow as they rely on cross-correlation links between event pairs. Nevertheless, the number of observed “airquakes” (as seen by the artificial suspended ceiling features in Figure 7 and Supplementary Figure S11) are reduced through our relocation efforts, and relocated events show a congregation toward the area south of the dome close to the summit. This result is similar to the relocations obtained by Syracuse et al. (2011), although their methods involve the inversion for a more accurate 3D velocity model as well. Plotting the hypocenters colored by FI or by time (Supplementary Figures S9, S10) revealed no apparent spatio-temporal trends. Lastly, we note that our hypocenter plot omits a few relocated earthquakes that are scattered at depths of 4–5 km below sea level. The omitted earthquakes are infrequently repeating low frequency events, and they are likely associated with the inferred shallow magma source at Augustine Volcano (Power and Lalla, 2010).
4 Discussion and recommendations
Our workflow provides a convenient and consistent means of augmenting analyst-derived catalogs at volcano observatories by constructing temporally enhanced, high-precision catalogs using accepted, open-source seismological tools. However, users should still exercise caution as different numerical inputs for each tool within the workflow could potentially result in variable, or even less credible, outcomes. In this section we discuss some caveats of each tool and provide recommendations for their implementation. A summary of suggested parameter values and corresponding remarks is provided in Supplementary Table S12 in the supplement.
4.1 REDPy
Firstly, REDPy offers the option of utilizing any number of stations to search for coincident STA/LTA triggers. Although single station implementations of REDPy have been able to pick up anomalous seismic activity at volcanoes (Grapenthin et al., 2022), if possible we recommend users to use at least 3 to 5 stations for coincident triggering. Using more stations provides better detection sensitivity and more accurate event cluster determinations, but comes at the expense of increased computational cost. In order to avoid an excessive number of false triggers, we also recommend the user to either use a conservative STA/LTA trigger ratio to register events or a high cross-correlation value to define repeaters. The former will ensure that REDPy permits only the most certain signals, while the latter relies on the repetitive nature of volcanic seismicity to ensure accurate detections. Using a high cross-correlation value (
4.2 EQcorrscan
For EQcorrscan, we recommend that the user first looks at the waveforms from a subset of analyst-derived events, in order to determine a suitable filter band that maximizes signal-to-noise for both the templates and the continuous data to which they will be correlated. Waveforms should also be downsampled prior to template building, to a frequency that corresponds to the lowest sampling rate in the seismic network for computational compatibility. When waveforms are trimmed about their phase arrivals, users should ensure that the pre-pick time captures pick uncertainty, and that the segment length captures the coda of the seismic arrivals. When conducting the actual matched-filter scan, users should also set a trigger interval that is at least as long as the segment length of template waveforms, so that codas of long signals are not detected as separate events. Users should also start their matched-filter scans with a relaxed threshold value (e.g., average channel cross-correlation of 0.6) to capture as many events as possible, before using the rethreshold function in EQcorrscan to raise the threshold such that lower-scoring, erroneous detections are largely filtered out. Doing so will eliminate the need to re-run the scan at a lower threshold should users find that their initial threshold is too high. To find a desirable threshold, users can conduct a sensitivity test by comparing the cumulative event counts between the matched-filter catalog and the base catalog, and visually compare the waveforms from the poorest-scoring detections with that of their templates. Lastly, users must ensure that they implement EQcorrscan’s decluster function, which serves to preserve only the best template match in instances where multiple templates correlate with the same signal in the continuous data. This is especially important as EQcorrscan’s trigger interval setting applies only to individual templates, meaning that relatively similar waveform templates (which remain ungrouped by REDPy) can detect and classify a single earthquake as many coincident earthquakes.
4.3 HypoDD/GrowClust
For relocations, we recommend crafting the dt.cc file using even shorter pre-pick and segment lengths (e.g., using 2.5 s long segments starting 0.15 s before the pick time). Unlike the matched-filter case, we want to omit signal coda to avoid overlaps between P and S phases. The trimmed segment should mainly capture the immediate onset of the phase arrival, and the segment should be cross-correlated with a maximum allowed time shift of approximately 0.4 s, although this value can go as low as 0.2 s for high quality picks. Overly small time shifts might miss the actual cross-correlation peak, while overly long time shifts increase the chance of giving erroneous lag times due to cycle skipping. We refer readers to Schaff et al. (2004) for a detailed discussion on optimizing correlation techniques. Through trial and error, we also find that only cross-correlation differential times that register a cross-correlation coefficient above 0.7 or 0.75 should be kept; any lower threshold results in inaccurate event linkages within GrowClust, which could lead to inaccurate convergence during relocation. Using a low cross-correlation threshold may also increase the possibility of incorrectly matching noise with the reference pick. As mentioned earlier in the Methods section, GrowClust performs best when event pairs have a large number of differential time observations per event pair across well-distributed stations, with the recommended number of observations being 8 and above. For error reporting, it is also suggested that users allow GrowClust to perform at least 50 bootstrap cycles, though 100 cycles might be more comprehensive if system memory permits. As for HypoDD, recommended starting iteration configurations adapted from previous relative relocation studies (Pesicek et al., 2008; Hotovec-Ellis et al., 2018; DeGrandpre et al., 2019) are covered in Supplementary Table S12. Typically, HypoDD starts off by using more relaxed search parameters and high catalog differential time weights in order to converge to the LSQR solution rapidly in its first few iterations. Parameters are then gradually tightened to solve for finer scale features, before the process is repeated for the cross-correlation differential times. The HypoDD manual suggests that condition numbers between 60 and 120 are desirable for these iterations, though our tests have shown that condition numbers that exceed those values (up to 200) can still provide reasonable relocations. Overall, the easiest and most intuitive way to identify a reasonable result is to assess the stability of the solution when starting locations, damping and outlier thresholds are varied. For rigorous error reporting, users are encouraged to refer to the HypoDD manual for suggestions, which include jackknifing of stations/events, changing the starting location of events, and perturbing the input velocity model. Other relevant works has also used HypoDD’s Singular Value Decomposition (SVD) method to estimate least square uncertainties (Pesicek et al., 2008), and conducted synthetic data location tests to evaluate the effects of limited seismic network aperture (Ruppert et al., 2011).
4.4 Implications and future developments
Numerous studies that retrospectively analyze pre-, syn- and post-eruptive seismic data often conduct independent, automated scans for detections and relocate events using pre-existing open source tools. Our open-source workflow aims to fulfill that role in producing both a temporally enhanced event list and relocated enhanced catalog for research and operational analyses. Our workflow provides a many-fold increase in the number of events detected at Redoubt Volcano, including a potential seismic uptick at least 9 months before the eruption and 4 months prior to what was previously reported. Although event waveforms are generally poorly correlated at Augustine Volcano, we show a more than 2-fold increase in the number of events there, and identify a modest number of swarms previously omitted by the AVO catalog. It is not entirely clear why our enhanced Augustine Volcano catalog has a smaller increase in the number of events and lower number of relocated events compared to Redoubt Volcano. The low degree of waveform similarity highlighted by DeShon et al. (2010) and the smaller difference between event-station and event pair distances may have contributed to the poorer performance of the matched-filter and double-difference relocation tools at Augustine Volcano. In addition, our decision to filter waveforms using bandpass limits below the high frequency component observed for Augustine Volcano events (Buurman and West, 2010) could have limited the number of detected earthquakes. The denser seismic network and the nature of seismicity at Augustine Volcano (mostly VT events with clear P and S phases) might have also allowed the analyst to locate most of the events present in the data, resulting in a smaller margin for catalog improvement. The apparent variability in the performance of cross-correlation based methods at different volcanic settings remains to be rigorously tested or determined. Future work could explore why catalog enhancing techniques perform “better” at some volcanoes than others.
The data products derived from our workflow can be helpful for situational awareness for volcano monitoring (Thelen et al., 2022), eruption forecasting (Pesicek et al., 2018), and comparison with other independently determined datasets. The higher precision hypocenter locations that our workflow produces can also support (or refute) prior interpretations of subsurface magma storage zones. Magnitudes are computed when possible and provide additional information on seismic energy release. Compared to previous work at each volcano, our workflow generates a comparable number of new detections beyond the AVO catalog without excessive fine-tuning or human intervention, and provides additional event relocations which align with previously determined cluster centroids.
Our streamlined workflow can provide a consistent and easily transferable method in arriving at the aforementioned data products, which will prove useful when comparing results across eruptions from different times and different volcanoes. Building a comprehensive library of earthquake templates would open up the possibility of near-real-time matched-filtering, where historic templates from a particular volcano can be cross-correlated on telemetered data as they arrive. Although our tools are currently not designed for real-time data, they can be applied relatively quickly (e.g., daily if a volcano demonstrates heightened unrest). We have since successfully applied all or portions of our workflow to recent unrest at Alaska volcanoes, including Mount Edgecumbe (Grapenthin et al., 2022), Davidof Volcano and Great Sitkin Volcano in the 2021–2022 period. The acquired data products directly contribute to observatory monitoring efforts by AVO, most notably by providing better event count estimates. Beyond volcanic seismicity, our workflow can also be used to examine swarms and aftershock sequences in tectonic regions (Warren-Smith et al., 2017; Hughes et al., 2021), where enhanced catalogs can be used to highlight active faults and derive progressions in cumulative moment. However, it should be noted that our workflow is inherently computationally expensive due to its correlation-heavy procedure and is best suited for quantifying and relocating well-correlated, repetitive seismicity. The processing time of the full workflow on 1–2 years of data (like in our Augustine and Redoubt Volcano case studies) is often in the order of multiple days, but this can vary significantly depending on the number of stations used, REDPy triggers and clusters, EQcorrscan templates, and relocatable detections. Subsets of the workflow can be employed in order to timely address observatory needs as they arise.
Lastly, we highlight that although technological advances are increasing the frequency at which research scientists or observatories are generating well-populated high precision catalogs, it remains unclear how their results should be archived or preserved. All observatories rely on some form of database system; observatories in the United States store catalogs in the Advanced National Seismic System (ANSS) Quake Monitoring System (AQMS), and partners worldwide rely on a variety of other systems such as SeisComP, Antelope, and Atlas among others. However, these databases mainly incorporate and maintain first-order observatory data products, and rarely host research or reanalysis catalogs which are otherwise poorly preserved in journal articles. Considering that automated catalogs will continue to be produced frequently in the near future, we suggest that observatories work toward expanding their database schema to include new or revised hypocenter information and alternative datasets. A prime example of how this can be done would be the 2018–2019 earthquake catalogs from the Alaska Amphibious Community Seismic Experiment (Barcheck et al., 2020), which are currently being hosted in the ANSS Comprehensive Earthquake Catalog (ComCat). Within the scope of the PREEVENTS eruption forecasting project, a dedicated database developer will be integrating and organizing cross-disciplinary research data products as automated tools are run for a targeted subset of Alaska volcanoes. As new and robust catalog creation tools continue to be developed in the literature, the ability of observatories to keep data products organized and accessible must keep up as well.
5 Conclusion
By integrating four popular open-source tools for earthquake detection and relocation, we have developed an end-to-end, open-source workflow that can enhance volcanic earthquake catalogs derived by volcano observatories and researchers worldwide. Our Python-based, modular workflow also enables users to run tools independently or in conjunction with one another, and assess relocations derived through the popular double-difference algorithms HypoDD, GrowClust, or a combination of both. After testing our methods on the 2012–2013 unrest sequence at Mammoth Mountain, we apply our workflow to the 2009 eruption of Redoubt Volcano and the 2006 eruption of Augustine Volcano and evaluate our workflow’s performance, highlight caveats, and make comparisons with previous results from each volcano. Our temporally enhanced event lists reveal a considerable amount of new seismicity not present in the AVO analyst-derived catalogs, including notable unrest at Redoubt Volcano that precedes the previous onset of seismicity by 4 months. In addition, our relocated enhanced catalogs concentrate the previously dispersed cloud of seismicity underneath the eruptive domes of both volcanoes. Our workflow provides a versatile and modular pipeline of tools that can derive research-grade data products and complement observatory monitoring efforts.
Data availability statement
Publicly available datasets were analyzed in this study. This data can be found here: Waveform data and hypocenter catalogs for Mammoth Mountain were downloaded from the Northern California Earthquake Data Center (NCEDC) (http://ncedc.org/), using network code NC. Waveform data from the Mammoth Mountain Broadband Experiment and for Augustine and Redoubt Volcanoes were downloaded from Incorporated Research Institutions for Seismology (IRIS) Data Management Center (https://ds.iris.edu/ds/nodes/dmc/, network codes 8E and AV). Analyst-reviewed hypocenter catalogs for both Alaska volcanoes were queried from the Advanced National Seismic System (ANSS) Quake Monitoring System (AQMS) (Power et al., 2019). Campaign data for Alaska volcanoes were initially obtained from Alaska Earthquake Center (AEC) archives, but are now available on IRIS under network code AV as well. Volcano color codes and corresponding observations of volcanic activity were made by the Alaska Volcano Observatory (www.avo.alaska.edu). Our workflow repository can be accessed at https://github.com/darren-tpk/enhance_catalog.
Author contributions
DT performed the analysis in this work and created all figures with supervision and advice from all co-authors. DT and DF wrote the manuscript. AH-E assisted with the REDPy set up and the Mammoth Mountain case study for tool calibration. AH-E and JeP contributed to the calibration of HypoDD runs on Alaska volcanoes. DF, MH and JoP provided valuable advice on working with Alaska seismic data and Alaska Volcano Observatory earthquake catalogs. TG provided helpful feedback on tool implementations and the manuscript.
Funding
Funding for this work was provided by the NSF PREEVENTS grant No. 1855126. This material is based upon work supported by the U.S. Geological Survey under Cooperative Agreement No. G21AC10384.
Acknowledgments
We thank Mike West for helpful input on the methods and assistance with data access. Scott Stihler provided key input on AVO seismic methods. Taryn Lopez and PREEVENTS collaborators also provided helpful feedback and guidance. We thank David Shelly for his constructive feedback on tool implementation and on the manuscript text.
Conflict of interest
The authors declare that the research was conducted in the absence of any commercial or financial relationships that could be construed as a potential conflict of interest.
Publisher’s note
All claims expressed in this article are solely those of the authors and do not necessarily represent those of their affiliated organizations, or those of the publisher, the editors and the reviewers. Any product that may be evaluated in this article, or claim that may be made by its manufacturer, is not guaranteed or endorsed by the publisher.
Supplementary material
The Supplementary Material for this article can be found online at: https://www.frontiersin.org/articles/10.3389/feart.2023.1158442/full#supplementary-material
References
Abramenkov, S., Shapiro, N. M., Koulakov, I., and Abkadyrov, I. (2020). Clustering of long-period earthquakes beneath Gorely Volcano (Kamchatka) during a degassing episode in 2013. Geosciences 10, 230. doi:10.3390/geosciences10060230
Allen, R. V. (1978). Automatic earthquake recognition and timing from single traces. Bull. Seismol. Soc. Am. 68, 1521–1532. doi:10.1785/bssa0680051521
Ankerst, M., Breunig, M., Kriegel, H. P., Ng, R., and Sander, J. (2008). “Ordering points to identify the clustering structure,” in Proceeding of the ACM SIGMOD international Conference on Management of Data.
Aso, N., Ohta, K., and Ide, S. (2011). Volcanic-like low-frequency earthquakes beneath Osaka Bay in the absence of a volcano. Geophys. Res. Lett. 38, L08303. doi:10.1029/2011gl046935
Barcheck, G., Abers, G. A., Adams, A. N., Bécel, A., Collins, J., Gaherty, J. B., et al. (2020). The Alaska amphibious community seismic experiment. Seismol. Soc. Am. 91, 3054–3063. doi:10.1785/0220200189
Beaucé, E., Frank, W. B., and Romanenko, A. (2018). Fast matched filter (FMF): An efficient seismic matched-filter search for both CPU and GPU architectures. Seismol. Res. Lett. 89, 165–172. doi:10.1785/0220170181
Bell, A. F., Hernandez, S., Gaunt, H. E., Mothes, P., Ruiz, M., Sierra, D., et al. (2017). The rise and fall of periodic ‘drumbeat’seismicity at Tungurahua volcano, Ecuador. Earth Planet. Sci. Lett. 475, 58–70. doi:10.1016/j.epsl.2017.07.030
Benz, H. M., Chouet, B. A., Dawson, P. B., Lahr, J. C., Page, R. A., and Hole, J. A. (1996). Three-dimensional P and S wave velocity structure of Redoubt Volcano, Alaska. J. Geophys. Res. Solid Earth 101, 8111–8128. doi:10.1029/95jb03046
Beyreuther, M., Barsch, R., Krischer, L., Megies, T., Behr, Y., and Wassermann, J. (2010). ObsPy: A Python toolbox for seismology. Seismol. Res. Lett. 81, 530–533. doi:10.1785/gssrl.81.3.530
Bull, K. F., Anderson, S. W., Diefenbach, A. K., Wessels, R. L., and Henton, S. M. (2013). Emplacement of the final lava dome of the 2009 eruption of Redoubt Volcano, Alaska. J. Volcanol. Geotherm. Res. 259, 334–348. doi:10.1016/j.jvolgeores.2012.06.014
Buurman, H., and West, M. E. (2010). “Seismic precursors to volcanic explosions during the 2006 eruption of Augustine Volcano, chapter 2,”. U.S. Geological Survey Professional Paper 1769 in The 2006 eruption of Augustine Volcano, Alaska. Editors J. A. Power, M. L. Coombs, and J. T. Freymueller, 41–57.
Buurman, H., Prejean, S., West, M., and Whalen, M. (2013a). Volcano seismicity in Alaska. PhD Dissertation. University of Alaska Fairbanks.
Buurman, H., West, M. E., and Roman, D. C. (2013b). Using repeating volcano-tectonic earthquakes to track post-eruptive activity in the conduit system at Redoubt Volcano, Alaska. Geology 41, 511–514. doi:10.1130/g34089.1
Buurman, H., West, M. E., and Thompson, G. (2013c). The seismicity of the 2009 Redoubt eruption. J. Volcanol. Geotherm. Res. 259, 16–30. doi:10.1016/j.jvolgeores.2012.04.024
Cervelli, P. F., Fournier, T., Freymueller, J., and Power, J. A. (2006). Ground deformation associated with the precursory unrest and early phases of the January 2006 eruption of Augustine Volcano, Alaska. Geophys. Res. Lett. 33. doi:10.1029/2006gl027219
Chamberlain, C. J., Hopp, C. J., Boese, C. M., Warren-Smith, E., Chambers, D., Chu, S. X., et al. (2018). EQcorrscan: Repeating and near-repeating earthquake detection and analysis in python. Seismol. Res. Lett. 89, 173–181. doi:10.1785/0220170151
Chouet, B. A. (1996). Long-period volcano seismicity: Its source and use in eruption forecasting. Nature 380, 309–316. doi:10.1038/380309a0
Coombs, M. L., Bull, K. F., Vallance, J. W., Schneider, D. J., Thoms, E. E., Wessels, R. L., et al. (2010). “Timing, distribution, and volume of proximal products of the 2006 eruption of Augustine Volcano, chapter 8,”. U.S. Geological Survey Professional Paper 1769 in The 2006 eruption of Augustine Volcano, Alaska. Editors J. A. Power, M. L. Coombs, and J. T. Freymueller, 145–186.
Coombs, M. L., Sisson, T. W., Bleick, H. A., Henton, S. M., Nye, C. J., Payne, A. L., et al. (2013). Andesites of the 2009 eruption of Redoubt Volcano, Alaska. J. Volcanol. Geotherm. Res. 259, 349–372. doi:10.1016/j.jvolgeores.2012.01.002
Dawson, P. B., Chouet, B. A., and Power, J. (2011). Determining the seismic source mechanism and location for an explosive eruption with limited observational data: Augustine Volcano, Alaska. Geophys. Res. Lett. 38. doi:10.1029/2010gl045977
DeGrandpre, K. G., Pesicek, J. D., Lu, Z., DeShon, H. R., and Roman, D. C. (2019). High rates of inflation during a noneruptive episode of seismic unrest at Semisopochnoi Volcano, Alaska in 2014–2015. Geochem. Geophys. Geosystems 20, 6163–6186. doi:10.1029/2019gc008720
DeShon, H. R., Thurber, C. H., and Rowe, C. (2007). High-precision earthquake location and three-dimensionalPwave velocity determination at Redoubt Volcano, Alaska. J. Geophys. Res. 112, B07312. doi:10.1029/2006jb004751
DeShon, H. R., Thurber, C. H., Power, J. A., Coombs, M. L., and Freymueller, J. T. (2010). “Earthquake waveform similarity and evolution at Augustine Volcano from 1993 to 2006, chapter 5,”. US Geological Survey Professional Paper 1769 in The 2006 eruption of Augustine Volcano, Alaska. Editors J. A. Power, M. L. Coombs, and J. T. Freymueller, 103–118.
Dixon, J. P., Stihler, S. D., Power, J. A., and Searcy, C. (2008). Catalog of earthquake hypocenters at alaskan volcanoes: January 1 through december 31, 2006. U.S. Geol. Surv. Data Ser. 326, 79.
Dixon, J. P., Stihler, S. D., Power, J. A., and Searcy, C. (2010). Catalog of earthquake hypocenters at alaskan volcanoes: January 1 through december 31, 2009. U.S. Geol. Surv. Data Ser. 531, 84.
Dixon, J. P., Stihler, S. D., Haney, M. M., Lyons, J. J., Ketner, D. M., Mulliken, K. M., et al. (2019). Catalog of earthquake parameters and description of seismograph and infrasound stations at alaskan volcanoes—January 1, 2013, through december 31, 2017. U.S. Geol. Surv. Data Ser. 1115, 92. doi:10.3133/ds1115
Frank, W. B., and Abercrombie, R. E. (2018). Adapting the matched-filter search to a wide-aperture network: An aftershock sequence and an earthquake swarm in Connecticut. Bull. Seismol. Soc. Am. 108, 524–532. doi:10.1785/0120170190
Gibbons, S. J., and Ringdal, F. (2006). The detection of low magnitude seismic events using array-based waveform correlation. Geophys. J. Int. 165, 149–166. doi:10.1111/j.1365-246x.2006.02865.x
Giron, R. G., Brodsky, E. E., Spica, Z. J., and Haney, M. M. (2020). “Clog and crack: Opening and closing behavior during a sustained explosive eruption as recorded by its hidden earthquakes,” in Earth and space science open archive ESSOAr.
Girona, T., Realmuto, V., and Lundgren, P. (2021). Large-scale thermal unrest of volcanoes for years prior to eruption. Nat. Geosci. 14, 238–241. doi:10.1038/s41561-021-00705-4
Gomberg, J. S., Shedlock, K. M., and Roecker, S. W. (1990). The effect of S-wave arrival times on the accuracy of hypocenter estimation. Bull. Seismol. Soc. Am. 80, 1605–1628. doi:10.1785/bssa08006a1605
Grapenthin, R., Freymueller, J. T., and Kaufman, A. M. (2013). Geodetic observations during the 2009 eruption of Redoubt Volcano, Alaska. J. Volcanol. Geotherm. Res. 259, 115–132. doi:10.1016/j.jvolgeores.2012.04.021
Grapenthin, R., Cheng, Y., Angarita, M., Tan, D., Meyer, F. J., Fee, D., et al. (2022). Return from Dormancy: Rapid inflation and seismic unrest driven by transcrustal magma transfer at Mt. Edgecumbe (L’úx Shaa) Volcano, Alaska. Geophys. Res. Lett. 49, e2022GL099464. doi:10.1029/2022GL099464
Haney, M. M., Chouet, B. A., Dawson, P. B., and Power, J. A. (2013). Source characterization for an explosion during the 2009 eruption of Redoubt Volcano from very-long-period seismic waves. J. Volcanol. Geotherm. Res. 259, 77–88. doi:10.1016/j.jvolgeores.2012.04.018
Hotovec-Ellis, A. J., and Jeffries, C. (2016). “Near real-time detection, clustering, and analysis of repeating earthquakes: Application to Mount St. Helens and Redoubt volcanoes,” in Seismological society of America annual meeting.
Hotovec-Ellis, A. J., Shelly, D. R., Hill, D. P., Pitt, A. M., Dawson, P. B., and Chouet, B. A. (2018). Deep fluid pathways beneath Mammoth Mountain, California, illuminated by migrating earthquake swarms. Sci. Adv. 4, eaat5258–8. doi:10.1126/sciadv.aat5258
Hotovec-Ellis, A. J., Shiro, B. R., Shelly, D. R., Anderson, K. R., Haney, M. M., Thelen, W. A., et al. (2022). Earthquake-derived seismic velocity changes during the 2018 caldera collapse of Kīlauea volcano. J. Geophys. Res. Solid Earth 127, e2021JB023324. doi:10.1029/2021jb023324
Hughes, L., Chamberlain, C. J., Townend, J., and Thomas, A. M. (2021). A repeating earthquake catalog from 2003 to 2020 for the raukumara peninsula, northern hikurangi subduction margin, New Zealand. Geochem. Geophys. Geosyst. 22. doi:10.1029/2021gc009670
Jacobs, K. M., and McNutt, S. R. (2010). “Using seismic b-values to interpret seismicity rates and physical processes during the preeruptive earthquake swarm at Augustine Volcano 2005–2006, chapter 3,”. U.S. Geological Survey Professional Paper 1769 in The 2006 eruption of Augustine Volcano, Alaska. Editors J. A. Power, M. L. Coombs, and J. T. Freymueller, 59–83.
Kato, A., Terakawa, T., Yamanaka, Y., Maeda, Y., Horikawa, S., Matsuhiro, K., et al. (2015). Preparatory and precursory processes leading up to the 2014 phreatic eruption of Mount Ontake, Japan. Earth, Planets Space 67, 111–11. doi:10.1186/s40623-015-0288-x
Ketner, D., and Power, J. (2013). Characterization of seismic events during the 2009 eruption of Redoubt Volcano, Alaska. J. Volcanol. Geotherm. Res. 259, 45–62. doi:10.1016/j.jvolgeores.2012.10.007
Kintner, J. A., Yeck, W. L., Earle, P. S., Prejean, S., and Pesicek, J. D. (2022). High-precision characterization of seismicity from the 2022 hunga Tonga-hunga ha’apai volcanic eruption. Seismol. Res. Lett. 94, 589–602. doi:10.1785/0220220250
Lanza, F., Roman, D. C., Power, J. A., Thurber, C. H., and Hudson, T. (2022). Complex magmatic-tectonic interactions during the 2020 Makushin Volcano, Alaska, earthquake swarm. Earth Planet. Sci. Lett. 587, 117538. doi:10.1016/j.epsl.2022.117538
Lapins, S., Goitom, B., Kendall, J.-M., Werner, M. J., Cashman, K. V., and Hammond, J. O. (2021). A little data goes a long way: Automating seismic phase arrival picking at Nabro volcano with transfer learning. J. Geophys. Res. Solid Earth 126, e2021JB021910. doi:10.1029/2021jb021910
Larsen, J. F., Nye, C. J., Coombs, M. L., Tilman, M., Izbekov, P., and Cameron, C. (2010). “Petrology and geochemistry of the 2006 eruption of Augustine Volcano, chapter 15,”. U.S. Geological Survey Professional Paper 1769 in The 2006 eruption of Augustine Volcano, Alaska. Editors J. A. Power, M. L. Coombs, and J. T. Freymueller, 335–382.
Lengliné, O., Duputel, Z., and Ferrazzini, V. (2016). Uncovering the hidden signature of a magmatic recharge at Piton de la Fournaise volcano using small earthquakes. Geophys. Res. Lett. 43, 4255–4262. doi:10.1002/2016gl068383
Lomax, A., and Savvaidis, A. (2022). High-precision earthquake location using source-specific station terms and inter-event waveform similarity. J. Geophys. Res. Solid Earth 127, e2021JB023190. doi:10.1029/2021jb023190
Lopez, T., Carn, S., Werner, C., Fee, D., Kelly, P., Doukas, M., et al. (2013). Evaluation of Redoubt Volcano’s sulfur dioxide emissions by the ozone monitoring instrument. J. Volcanol. Geotherm. Res. 259, 290–307. doi:10.1016/j.jvolgeores.2012.03.002
Malfante, M., Dalla Mura, M., Métaxian, J.-P., Mars, J. I., Macedo, O., and Inza, A. (2018). Machine learning for volcano-seismic signals: Challenges and perspectives. IEEE Signal Process. Mag. 35, 20–30. doi:10.1109/msp.2017.2779166
Matoza, R. S., Okubo, P. G., and Shearer, P. M. (2021). Comprehensive high-precision relocation of seismicity on the island of Hawai‘i 1986–2018. Earth Space Sci. 8, e2020EA001253. doi:10.1029/2020ea001253
McNutt, S. R., and Roman, D. C. (2015). Volcanic seismicity. Elsevier Inc. doi:10.1016/b978-0-12-385938-9.00059-6
Montgomery-Brown, E. K., Shelly, D. R., and Hsieh, P. A. (2019). Snowmelt-triggered earthquake swarms at the margin of long valley caldera, California. Geophys. Res. Lett. 46, 3698–3705. doi:10.1029/2019gl082254
Mousavi, S. M., Ellsworth, W. L., Zhu, W., Chuang, L. Y., and Beroza, G. C. (2020). Earthquake transformer—An attentive deep-learning model for simultaneous earthquake detection and phase picking. Nat. Commun. 11, 3952–4012. doi:10.1038/s41467-020-17591-w
Orozco-Alzate, M., Acosta-Muñoz, C., and Londoño-Bonilla, J. M. (2012). “The automated identification of volcanic earthquakes: Concepts, applications and challenges,” in Earthquake research and analysis-seismology, seismotectonic and earthquake geology, 345–370.
Pan, S. J., and Yang, Q. (2010). A survey on transfer learning. IEEE Trans. Knowl. Data Eng. 22, 1345–1359. doi:10.1109/tkde.2009.191
Pesicek, J. D., Thurber, C. H., DeShon, H. R., Prejean, S. G., and Zhang, H. (2008). Three-dimensional P-wave velocity structure and precise earthquake relocation at Great Sitkin Volcano, Alaska. Bull. Seismol. Soc. Am. 98, 2428–2448. doi:10.1785/0120070213
Pesicek, J. D., Wellik, J. J., Prejean, S. G., and Ogburn, S. E. (2018). Prevalence of seismic rate anomalies preceding volcanic eruptions in Alaska. Front. Earth Sci. 6. doi:10.3389/feart.2018.00100
Power, J. A., and Lalla, D. J. (2010). “Seismic observations of Augustine Volcano, 1970–2007, chapter 1,”. U.S. Geological Survey Professional Paper 1769 in The 2006 eruption of Augustine Volcano, Alaska. Editors J. A. Power, M. L. Coombs, and J. T. Freymueller, 3–40.
Power, J. A., Lahr, J. C., Page, R. A., Chouet, B. A., Stephens, C. D., Harlow, D. H., et al. (1994). Seismic evolution of the 1989–1990 eruption sequence of Redoubt Volcano, Alaska. J. Volcanol. Geotherm. Res. 62, 69–94. doi:10.1016/0377-0273(94)90029-9
Power, J. A., Stihler, S. D., Chouet, B. A., Haney, M. M., and Ketner, D. M. (2013). Seismic observations of Redoubt Volcano, Alaska—1989–2010 and a conceptual model of the Redoubt magmatic system. J. Volcanol. Geotherm. Res. 259, 31–44. doi:10.1016/j.jvolgeores.2012.09.014
Power, J. A., Friberg, P. A., Haney, M. M., Parker, T., Stihler, S. D., and Dixon, J. P. (2019). A unified catalog of earthquake hypocenters and magnitudes at volcanoes in Alaska—1989 to 2018. U.S. Geological Survey Scientific Investigations Report 2019– 5037, 17.
Power, J. A., Haney, M. M., Botnick, S. M., Dixon, J. P., Fee, D., Kaufman, A. M., et al. (2020). Goals and development of the Alaska Volcano Observatory seismic network and application to forecasting and detecting volcanic eruptions. Seismol. Res. Lett. 91, 647–659. doi:10.1785/0220190216
Retailleau, L., Saurel, J.-M., Zhu, W., Satriano, C., Beroza, G. C., Issartel, S., et al. (2022). A wrapper to use a machine-learning-based algorithm for earthquake monitoring. Seismol. Soc. Am. 93, 1673–1682. doi:10.1785/0220210279
Roman, D. C., and Cashman, K. V. (2006). The origin of volcano-tectonic earthquake swarms. Geology 34, 457–460. doi:10.1130/g22269.1
Roman, D. C., and Gardine, M. D. (2013). Seismological evidence for long-term and rapidly accelerating magma pressurization preceding the 2009 eruption of Redoubt Volcano, Alaska. Earth Planet. Sci. Lett. 371, 226–234. doi:10.1016/j.epsl.2013.03.040
Ross, Z. E., Meier, M.-A., Hauksson, E., and Heaton, T. H. (2018). Generalized seismic phase detection with deep learning. Bull. Seismol. Soc. Am. 108, 2894–2901. doi:10.1785/0120180080
Ruppert, N. A., Prejean, S., and Hansen, R. A. (2011). Seismic swarm associated with the 2008 eruption of Kasatochi Volcano, Alaska: Earthquake locations and source parameters. J. Geophys. Res. Solid Earth 116, B00B07. doi:10.1029/2010jb007435
Salvage, R. O., and Eaton, D. W. (2022). The influence of a transitional stress regime on the source characteristics of induced seismicity and fault activation: Evidence from the 30 november 2018 fort st. John ML 4.5 induced earthquake sequence. Bull. Seismol. Soc. Am. 112, 1336–1355. doi:10.1785/0120210210
Salvage, R. O., Avard, G., de Moor, J. M., Pacheco, J. F., Marin, J. B., Cascante, M., et al. (2018). Renewed explosive phreatomagmatic activity at poás volcano, Costa Rica in April 2017. Front. Earth Sci. 6, 1–18. doi:10.3389/feart.2018.00160
Schaff, D. P., and Richards, P. G. (2014). Improvements in magnitude precision, using the statistics of relative amplitudes measured by cross correlation. Geophys. J. Int. 197, 335–350. doi:10.1093/gji/ggt433
Schaff, D. P., Bokelmann, G. H. R., Ellsworth, W. L., Zanzerkia, E., Waldhauser, F., and Beroza, G. C. (2004). Optimizing correlation techniques for improved earthquake location. Bull. Seismol. Soc. Am. 94, 705–721. doi:10.1785/0120020238
Shelly, D. R., and Hill, D. P. (2011). Migrating swarms of brittle-failure earthquakes in the lower crust beneath Mammoth Mountain, California. Geophys. Res. Lett. 38. doi:10.1029/2011gl049336
Shelly, D. R., Beroza, G. C., and Ide, S. (2007). Non-volcanic tremor and low-frequency earthquake swarms. Nature 446, 305–307. doi:10.1038/nature05666
Shelly, D. R. (2020). A high-resolution seismic catalog for the initial 2019 Ridgecrest earthquake sequence: Foreshocks, aftershocks, and faulting complexity. Seismol. Res. Lett. 91, 1971–1978. doi:10.1785/0220190309
Statz-Boyer, P., Thurber, C., Pesicek, J., and Prejean, S. (2009). High precision relocation of earthquakes at Iliamna Volcano, Alaska. J. Volcanol. Geotherm. Res. 184, 323–332. doi:10.1016/j.jvolgeores.2009.04.016
Sumiejski, L., Thurber, C., and DeShon, H. R. (2009). Location of eruption-related earthquake clusters at Augustine Volcano, Alaska, using station-pair differential times. Geophys. J. Int. 176, 1017–1022. doi:10.1111/j.1365-246x.2008.04037.x
Syracuse, E. M., Thurber, C. H., and Power, J. A. (2011). The Augustine magmatic system as revealed by seismic tomography and relocated earthquake hypocenters from 1994 through 2009. J. Geophys. Res. Solid Earth 116, B09306. doi:10.1029/2010jb008129
Thelen, W. A., Matoza, R. S., and Hotovec-Ellis, A. J. (2022). Trends in volcano seismology: 2010 to 2020 and beyond. Bull. Volcanol. 84, 26–10. doi:10.1007/s00445-022-01530-2
Trugman, D. T., and Shearer, P. M. (2017). GrowClust: A hierarchical clustering algorithm for relative earthquake relocation, with application to the Spanish springs and sheldon, Nevada, earthquake sequences. Seismol. Res. Lett. 88, 379–391. doi:10.1785/0220160188
Uieda, L., Tian, D., Leong, W. J., Toney, L., Schlitzer, W., Grund, M., et al. (2021). PyGMT: A Python interface for the generic mapping tools (v0.5.0). Zenodo. doi:10.5281/zenodo.7481934
Waldhauser, F., and Ellsworth, W. L. (2000). A double-difference earthquake location algorithm: Method and application to the northern Hayward fault, California. Bull. Seismol. Soc. Am. 90, 1353–1368. doi:10.1785/0120000006
Waldhauser, F. (2001). HypoDD–A program to compute double-difference hypocenter locations. U.S. Geological Survey Open-File Report 01–113
Warren-Smith, E., Chamberlain, C. J., Lamb, S., and Townend, J. (2017). High-precision analysis of an aftershock sequence using matched-filter detection: The 4 May 2015 ML 6 Wanaka earthquake, Southern Alps, New Zealand. Seismol. Res. Lett. 88, 1065–1077. doi:10.1785/0220170016
Webley, P. W., Lopez, T. M., Ekstrand, A. L., Dean, K. G., Rinkleff, P., Dehn, J., et al. (2013). Remote observations of eruptive clouds and surface thermal activity during the 2009 eruption of Redoubt volcano. J. Volcanol. Geotherm. Res. 259, 185–200. doi:10.1016/j.jvolgeores.2012.06.023
Wech, A., Tepp, G., Lyons, J., and Haney, M. (2018). Using earthquakes, T waves, and infrasound to investigate the eruption of bogoslof volcano, Alaska. Geophys. Res. Lett. 45, 6918–6925. doi:10.1029/2018GL078457
Wellik, J. J., Prejean, S. G., and Syahbana, D. K. (2021). Repeating earthquakes during multiple phases of unrest and eruption at mount agung, bali, Indonesia, 2017. Front. Earth Sci. 9. doi:10.3389/feart.2021.653164
White, R. A., Miller, A. D., Lynch, L., and Power, J. (1998). Observations of hybrid seismic events at soufriere hills volcano, Montserrat: July 1995 to september 1996. Geophys. Res. Lett. 25, 3657–3660. doi:10.1029/98gl02427
Withers, M., Aster, R., Young, C., Beiriger, J., Harris, M., Moore, S., et al. (1998). A comparison of select trigger algorithms for automated global seismic phase and event detection. Bull. Seismol. Soc. Am. 88, 95–106. doi:10.1785/bssa0880010095
Woollam, J., Münchmeyer, J., Tilmann, F., Rietbrock, A., Lange, D., Bornstein, T., et al. (2022). SeisBench—a toolbox for machine learning in seismology. Seismol. Soc. Am. 93, 1695–1709. doi:10.1785/0220210324
Yukutake, Y., Abe, Y., and Doke, R. (2019). Deep low-frequency earthquakes beneath the Hakone volcano, central Japan, and their relation to volcanic activity. Geophys. Res. Lett. 46, 11035–11043. doi:10.1029/2019gl084357
Zhan, Y., Le Mével, H., Roman, D. C., Girona, T., and Gregg, P. M. (2022). Modeling deformation, seismicity, and thermal anomalies driven by degassing during the 2005-2006 pre-eruptive unrest of Augustine Volcano, Alaska. Earth Planet. Sci. Lett. 585, 117524. doi:10.1016/j.epsl.2022.117524
Zhang, H., and Thurber, C. H. (2003). Double-difference tomography: The method and its application to the Hayward fault, California. Bull. Seismol. Soc. Am. 93, 1875–1889. doi:10.1785/0120020190
Zhang, H., and Thurber, C. (2006). Development and applications of double-difference seismic tomography. Pure Appl. Geophys. 163, 373–403. doi:10.1007/s00024-005-0021-y
Zhang, M., and Wen, L. (2015). Earthquake characteristics before eruptions of Japan’s Ontake volcano in 2007 and 2014. Geophys. Res. Lett. 42, 6982–6988. doi:10.1002/2015gl065165
Zhang, M., Liu, M., Feng, T., Wang, R., and Zhu, W. (2022). LOC-FLOW: An end-to-end machine learning-based high-precision earthquake location workflow. Seismol. Res. Lett. 93, 2426–2438. doi:10.1785/0220220019
Zhu, W., and Beroza, G. C. (2019). PhaseNet: A deep-neural-network-based seismic arrival-time picking method. Geophys. J. Int. 216, 261–273.
Keywords: volcano seismology, volcano monitoring, matched filter, relative relocation, cross correlation, Redoubt Volcano, Augustine Volcano, Alaska
Citation: Tan D, Fee D, Hotovec-Ellis AJ, Pesicek JD, Haney MM, Power JA and Girona T (2023) Volcanic earthquake catalog enhancement using integrated detection, matched-filtering, and relocation tools. Front. Earth Sci. 11:1158442. doi: 10.3389/feart.2023.1158442
Received: 03 February 2023; Accepted: 20 April 2023;
Published: 09 May 2023.
Edited by:
Yosuke Aoki, The University of Tokyo, JapanReviewed by:
Sacha Lapins, University of Bristol, United KingdomAleksey Ostapchuk, Institute of Geosphere Dynamics (RAS), Russia
Sophie Butcher, University of Edinburgh, United Kingdom
Copyright © 2023 Tan, Fee, Hotovec-Ellis, Pesicek, Haney, Power and Girona. This is an open-access article distributed under the terms of the Creative Commons Attribution License (CC BY). The use, distribution or reproduction in other forums is permitted, provided the original author(s) and the copyright owner(s) are credited and that the original publication in this journal is cited, in accordance with accepted academic practice. No use, distribution or reproduction is permitted which does not comply with these terms.
*Correspondence: Darren Tan, cHRhbkBhbGFza2EuZWR1