 Laura Ortiz-Giraldo
 Blanca A. Botero
 Johnny Vega
94% of researchers rate our articles as excellent or good
Learn more about the work of our research integrity team to safeguard the quality of each article we publish.
Find out more
ORIGINAL RESEARCH article
Front. Earth Sci. , 01 June 2023
Sec. Geohazards and Georisks
Volume 11 - 2023 | https://doi.org/10.3389/feart.2023.1157881
This article is part of the Research Topic Geo-information for Geohazard and Georisk View all 11 articles
Landslides caused by rainfall are one of the most frequent causes of disasters in tropical countries and mountainous terrain and can block rivers generating landslide dams. This paper presents a methodology for the estimation of the obstruction of water streams generated by rainfall-induced shallow landslides. The spatial distribution of the landslide hazard was estimated in terms of the Factor of Safety (FoS) values using the deterministic method with physical basis SLIDE (Slope - Infiltration - Distributed Equilibrium). The rainfall regimes of the study area were estimated by means of a simple scaling Log Normal Model. Subsequently, the resulting areas with a high hazard level that could detach and reach the riverbed were identified as sources for the simulation of the debris flow runout using the Rapid Mass Movement Simulation model with its debris flow module, (i.e., RAMMS-DF), estimating zones of the riverbed that should be analyzed in detail. Finally, the effects of river channel obstructions generated after debris flow movement were analyzed by means of the Iber, a well-known, physically based 2D hydraulic model and their possible changes on the river hydraulic. In order to generate a workflow that allows the application of the SLIDE methodology and the preparation of inputs for the subsequent processes of debris flow propagation and hydraulic modeling of the river corridor of analysis, a Python-based toolbox was created. Our results highlight the changes in the fluvial dynamics in the corridor of the river of analysis after the landslide dams generated by the occurrence of rainfall-induced landslide and debris flow hazard chain for the different return periods. In all cases, the material deposited in the river channel was sufficient to change the hydraulic regime of the river corridor, showing longer delay times in the transit of the flow, in addition to the decrease in the specific flow. This would imply a water shortage in the study basin of the hydroelectric project; however, in the scope of this project it is not possible to really determine the real effects that could be generated by this event.
Landslides triggered by rainfall are one of the most frequent causes of disasters in tropical countries and mountainous terrains (Cui and Guo, 2021; Aristizábal et al., 2022; Dhanai et al., 2022). Climate change has led to an unprecedented increase in the frequency and intensity of rainfall, and a greater number of landslides are triggered by rainfall along hillsides. (Thomas et al., 2023). According to the World Health Organization, between 1998 and 2017, landslides affected an estimated 4.8 million people and caused more than 18,000 deaths worldwide (UNISDR and CRED, 2017). Landslides can be classified into different types based on the slope movement mechanism and rate, the material involved, the mechanical behavior, or the movement stage (Hungr et al., 2014). Debris flows are a landslide type (or a specific case), composed of several materials including soil, rock, and water. It is an extremely rapid flow-type landslide, which tends to travel long distances from its source in a steep channel (Arghya et al., 2022; Trujillo-Vela et al., 2022). Landslides and debris flows are frequent hazards that seriously endanger lives and livelihoods, causing fatalities, property damage and impacts on engineering projects. They are a cause for concern worldwide (Gan and Zhang, 2019; Baggio et al., 2021; Fustos-Toribio et al., 2021).
Rainfall-induced shallow landslide has the potential to evolve into debris flows and thereby gather more channel sediments and cause significant destruction along its path and in the downstream areas (Thomas et al., 2023). Debris flows can block rivers and form hazards, causing great losses, i.e., they correspond to a chain of hazards caused by landslides and rainfall-triggered debris flows (Chen et al., 2022). A chain of multiple hazards can be defined as a series of hazards that occur in succession that are triggered by a single hazard resulting in an amplification of damage in both time and space relative to each of the constituent hazards if they happened separately (Zhu et al., 2021; Guo J. et al., 2022). These natural hazards are often caused by the diverse geographic and physiographic features, triggered by both natural as well as anthropogenic factors. Alike, blockage of a mainstream by tributary debris flow events is a natural phenomenon of local river evolution between the confluences of the streams (Vega and Hidalgo, 2021).
The physically based method is a respectable approach for susceptibility analysis of shallow landslides because is the most physically (geotechnical) simple model, based on the limit equilibrium theory, which is used to ascertain a given slope’s safety factor, reproducing the physical processes governing landslide occurrence (Chae et al., 2017; Armaș et al., 2021). Some examples are The Transient Rainfall Infiltration and Grid-based Regional Slope Stability (TRIGRS); Shallow Landslide Stability Model (SHALSTAB); The Fast Shallow Landslide Assessment Model (FSLAM); Probabilistic estimation of the threat due to landslides and mass movements in hillsides (EPADYM) and the model Slope Infiltration Distributed Equilibrium (SLIDE), among others. These models evaluate the spatial distribution of the hazard in terms of Factor of Safety (FoS) for rainfall-induced landslides (Chikalamo, 2018), applying infinite slope models which make them mostly applicable for the analysis of shallow landslides. The TRIGRS model considers partially saturated conditions and transient flows (Aristizábal et al., 2022; Rana and Babu, 2022); SHALSTAB model assumes that local surface topography is the dominant control of landslide occurrence, which makes it appealing for DEM-based landslide analyses (Moreira Melo et al., 2021); FSLAM was developed to calculate large areas (>100 km2) with a high-resolution topography in a very short computational time (Medina et al., 2021). This model includes two different sub-models: the hydrological model, which calculated the rainfall infiltration into the soil layer and the resulting position of the water table, and the geotechnical model, which applies the widely used infinite slope theory to calculate the slope stability (Guo Z. et al., 2022; Hürlimann et al., 2022); EPADYM model calculates the reliability index, failure probability and stability factor of a slope under seismic and static conditions (Hidalgo and Vega, 2021). On the other hand, SLIDES illustrates the dynamical relations between FoS and accumulation of rainfall over time when the shallow surface of soil reaches saturation and has enormous potential for rainstorm-induced landslide evaluation (Chikalamo, 2018; Chen et al., 2019).
Debris flow runout may refer to the entire horizontal distance (path) length measured on a map. Determining this distance of the landslide-debris flow chain is one of the most important tasks during the hazard assessment and zoning because of the complexity of the phenomenon and the variability of controlling factors (Liu et al., 2022). With the development of computation, numerical methods have gradually become an efficient and powerful tool for simulating landslide movement processes and understanding the complex dynamic process (Zhang J. et al., 2022). Some examples of debris flow propagation prediction models that have recently been widely used in the literature are: The FLO 2D model is a 2D finite difference model that can simulate non-Newtonian floods and debris flows (Do et al., 2020; Liu et al., 2022); the Flow path assessment of gravitational hazards at a regional scale model (FLOW R) can calculate the extent and paths of debris flows (Franco-Ramos et al., 2020; Arghya et al., 2022); the Debris flow simulation 2D model (DFS 2D) can be used to simulate the dynamics of debris flows considering multiple rheologies (Abraham et al., 2022; Liu et al., 2022). The Rapid Mass Movement Simulation model (RAMMS) has a debris flow module to analyze the dynamic process of geological disasters (Graf and McArdell, 2008; Christen et al., 2010; Franco-Ramos et al., 2020; Mikoš and Bezak, 2021; Zhang X. et al., 2022; Liu et al., 2022; Zhou et al., 2022); RAMMS is one of the most used one’s landslide runout methods allowing estimate flow velocity, deposition height, accumulation distribution, flow velocity and debris flow development propagation footprint of the debris flow materials (Mikoš and Bezak, 2021; Zhang X. et al., 2022; WSL Institute for Snow and Avalanche Research SLF, 2022).
Some authors have already made successful progress in landslide-debris flow chain evaluations, as (an et al. (2021); Zhou et al., 2022 and (Zhang Y. et al., 2022). However, most of them are focused on the analysis of the chain up to debris flow runout modeling. One of the current challenges is to improve the predictability of such events reaching a river and generating landslide dams, causing the loss of water supply in communities and hydroelectric projects. River-blocking induced debris flows have become common in numerous catchments of mountainous topography with a strong hydroclimatic variability, in response to climate and environmental changes (Qiang et al., 2020; Zhou et al., 2022). The early identification of landslide dam disasters has received considerable attention in recent years. Extensive studies are available nowadays (Kun-Ting et al., 2018; Li et al., 2020a; Hu et al., 2020; Zhang Y. et al., 2022). These studies have focused mainly on the blockage of the river, classifying it as a partial or total obstruction, as well as the evaluation of the interaction of the landslide dam material with the river flow.
Hydraulic modeling has been used to evaluate changes in flow behavior (González-Cao et al., 2019). For hydraulic modeling, there is extensive use of hydraulic simulations in the literature of the HEC RAS 2D and Iber models. HEC RAS 2D is a model for unsteady flow based on the Navier–Stokes (Roldán et al., 2022); Iber 2D is a free model package for simulating unsteady free surface turbulent flow and transport processes in shallow water flows based on 2D Saint-Venant Equations (Bladé et al., 2014; Hafnaoui and Debabeche, 2021). Iber represents a better option for modeling rivers with more irregular geometries, especially when there is a special interest in the hydraulic behavior of the flow it has been successfully used in a wide range of applications, including impacts of dam breakage (Hoyos and Botero, 2019; Ruiz-Villanueva et al., 2020; Díaz-Salas et al., 2021; Pérez-Montiel et al., 2022).
The early identification of landslide dam disasters has received considerable attention in recent years, these studies have mostly focused on dam failures and dam-breach floods (Nian et al., 2021; Zeng et al., 2022). Nevertheless, little is known about water shortages after a river blockage due rainfall-triggered landslides, nor about the change in the flow regime after a landslide dam formation. This leads to the need to evaluate the possible effects of these disaster chains on water resources and adopt strategies to protect the water streams of supply. It is fundamental to investigate and complement those studies of disaster chains up to the evaluation of the generation of the obstruction and its possible impacts. Uncontrolled transport of debris flow can be a major problem in maintaining the proper operation of hydroelectric facilities in the future (Walczak et al., 2021). Enhanced resilience to future obstructions on the river generated by debris flow landslide dam chain triggered by rain will be essential for reliable electricity supply and ensuring greater long-term opportunities (Chen et al., 2023).
In this paper, we propose an integral assessment of river channel obstructions due to the occurrence of the chain of hazards produced by rainfall-induced landslides and the subsequent occurrence of debris flows in tropical mountainous regions. We estimated the spatial distribution of shallow landslides hazard in terms of FoS values by the physical-based model SLIDE. High hazard zones that may detach and generate obstructions in a river channel were identified. Debris flow propagation was carried out using the RAMMS model. Then, an analysis of the consequences considering the deposition height on the riverbed was conducted, considering its influence on river hydraulics and potential water supply affectation. Changes in the hydraulic variables of the river flow after the debris flow movement and the generation of landslide dams in the river channel were analyzed using the Iber model, identifying their possible influence on the water shortage in the intake structures of the hydroelectric project. The methodology was applied in a sub-basin river for hydropower generation purposes. A toolbox was created with the purpose of generating a workflow that allows the application of the SLIDE methodology and the preparation of inputs for the subsequent processes of debris flow propagation simulation and hydraulic modeling of the fluvial corridor of analysis. This toolbox it is fully integrated with one of the most popular GIS environments, ArcGIS, developed by the company Esri (Dysarz, 2018).
The proposed methodology can be a useful tool for specialists interested in taking mitigation measures that contribute to the reduction of economic losses, development of protocols in the event of a disaster or choosing possible locations for the construction of new infrastructures considering exclusion criteria, as well as for its implementation in the updating and future land planning for local authorities. The understanding of the complete process of the hazard chain can be a key tool to reduce these natural disasters.
The study area is located in the northwest of Colombia, northern part of the Central Andes Mountain range, as shown in Figures 1A, B, the water intake structure for the Small Hydropower Plant (SHP) defines the subbasin of study in the Ovejas river. The subbasin area of the Ovejas River is 77 km2 and it has an average flow of 3.2 m3/s, and a complex topography formed by a mountainous relief with altitude range is between 2,198 m.a.s.l. and 2,600 m.a.s.l. Precipitation is mainly convective and orographic type with a multiannual average precipitation of approximately 2,200 mm/year. Its climate corresponds to a subtropical humid forest and humid tropical hydrometeorological conditions (Aristizábal et al., 2017). The rainfall in the study zone shows a bimodal distribution peaking between April–May and October (García-Delgado et al., 2021). The available meteorological stations represent the pluviometric phenomena in the study area. This information was acquired through the National Meteorological Service (IDEAM).
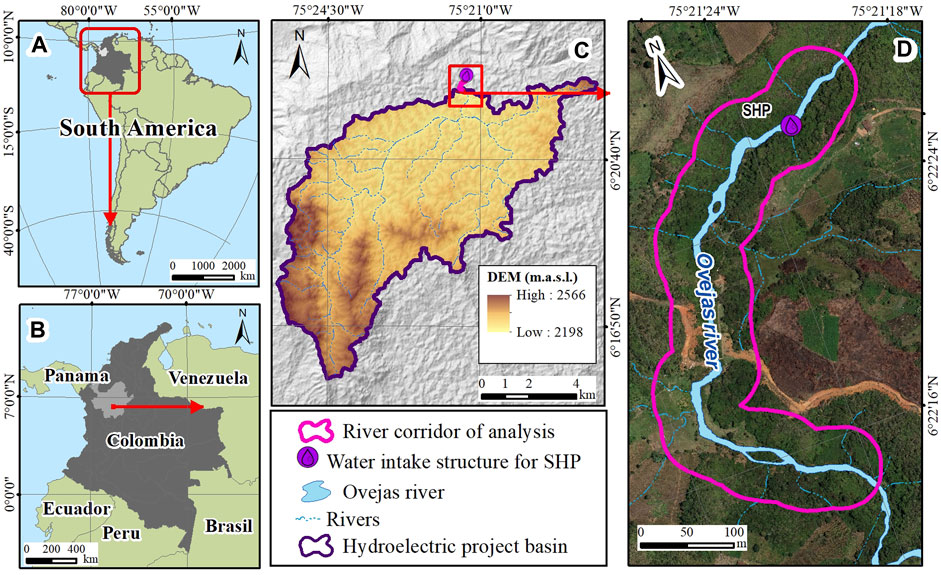
FIGURE 1. Location map. (A) Location of Colombia on a continent scale. (B) Location of Antioquia on a country scale (C) Location of the hydropower basin with a digital elevation model. (D) River corridor of analysis.
The study basin was traced at the water intake Structure for the SHP (Figure 1C) based on an Advanced Land Observing Satellite Digital Elevation Model (ALOS DEM) downloaded from the Alaska Satellite Facility (ASF DAAC, 2015 and PALSAR_Radiometric_Terrain_Corrected_high_res,), with a grid cell size of 12.5 m and with this information the morphometric characteristics and hydrologic parameters of the study basin were estimated. (Figure 1C). Additionally, a river corridor of analysis of 40 m on each side of the river and a longitudinal distance of 600 m upstream from the water intake structure site is proposed to model the runout of rainfall induced landslide debris flow hazard chain and hydraulic processes in such a way that it would be possible to develop the project study in feasible computational times (Figure 1D). For this river corridor was used the detailed topographic information provided by the SHP project owner. This topography corresponds to a LiDAR survey (Light Detection and Ranging or Laser Imaging Detection and Ranging), acquired in 2018, with a pixel resolution of 0.5 m. This information was complemented with information of the study area obtained from the River Basin Regulation and Management Plans (AMVAÁrea Metropolitana del Valle de Aburrá, 2015).
The basin is characterized as a topographically undulating area, with steep slopes in some areas of the upper part of the river corridor of analysis and in the immediate of the SHP water intake structure, reaching up to 67% slope (Figure 2A). These topographical factors condition climate and influence the spatial rainfall distribution and create favorable conditions for the formation of landslides and debris flows.
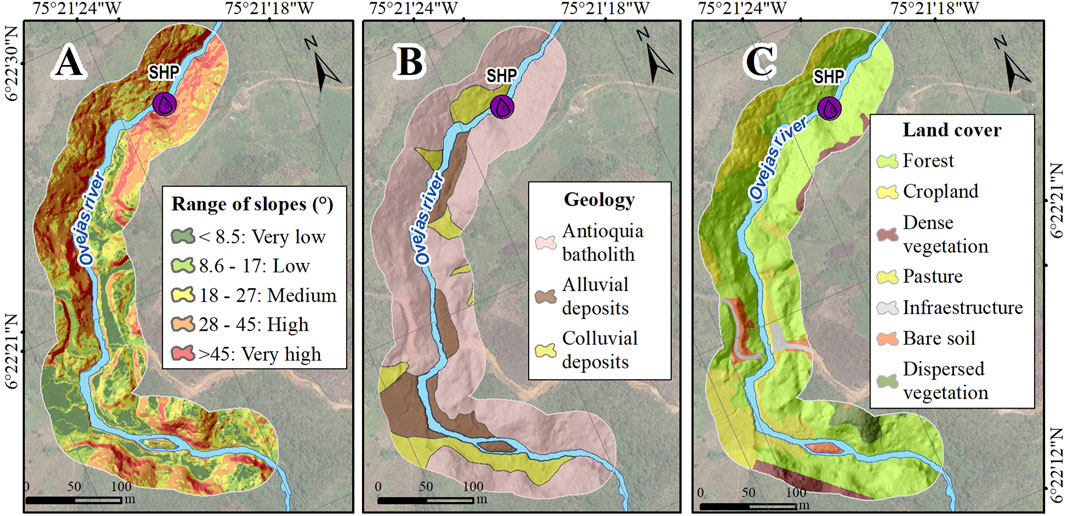
FIGURE 2. (A) Slope map of river corridor of analysis. (B) Spatial distribution of the geological units. (C) Land coverage map.
The river corridor of analysis comprises three main geological units: Antioquia batholith, Alluvial deposits and Colluvial deposits (Integral, 2020). The riverbed of the Ovejas river is narrow and contains alluvial deposits with a predominance of fine granulometry and large blocks of fresh rock from lateral landslides in the valley (Figure 2B) (Integral, 2020). The Antioquia batholith is the rock that outcrops in the study area, is a massive intrusive body of predominantly sandy silt granulometry (Marin et al., 2021). There are several colluvial deposits on the left bank of the Ovejas river, they are the result of current erosional processes. In general, they show high humidity and reptation phenomena. The alluvial deposits are poorly selected deposits with variable granulometry from gravel to silt. The geological map and its information of soil and lithology of the area of study were obtained from the detailed prefeasibility studies provided by the SHP project owner (Integral, 2020). The land cover (Figure 2C) corresponds mostly to natural forest, but there are also some areas of crops, bare soil, vegetation, and infrastructure zones.
In this study, the methodology can be schematized into three successive phases: The workflow is presented in Figure 3. The first implemented process was the landslide hazard assessment using SLIDE model. This method was developed by Liao et al. (2010) to evaluate the spatial distribution of the hazard in terms of FoS for rainfall-induced shallow landslides. As inputs, the model requires IDF (intensity-duration-frequency) curves, soil thickness and soil geomechanical parameters. The second process was the modeling of debris flow propagation (runout) using the Rapid Mass Movement Simulation model with its debris flow module (RAMMS- DF). Inputs for RAMMS were the DEM and the release areas resulting from the SLIDE hazard zoning methodology. The rainfall-runoff processes were simulated by HEC-HMS, the Soil Conservation Service-Curve number (SCS-CN), SCS Unit Hydrograph and Muskingum methods were used for loss, transformation, and routing calculations, respectively, obtaining the hydrographs for different return periods (Tr). The last process was the simulation of the effect of the river obstruction in the river corridor using the Iber model, which requires as input the flow hydrographs for the return periods analyzed and the heights of material deposition obtained from the RAMMS simulation.
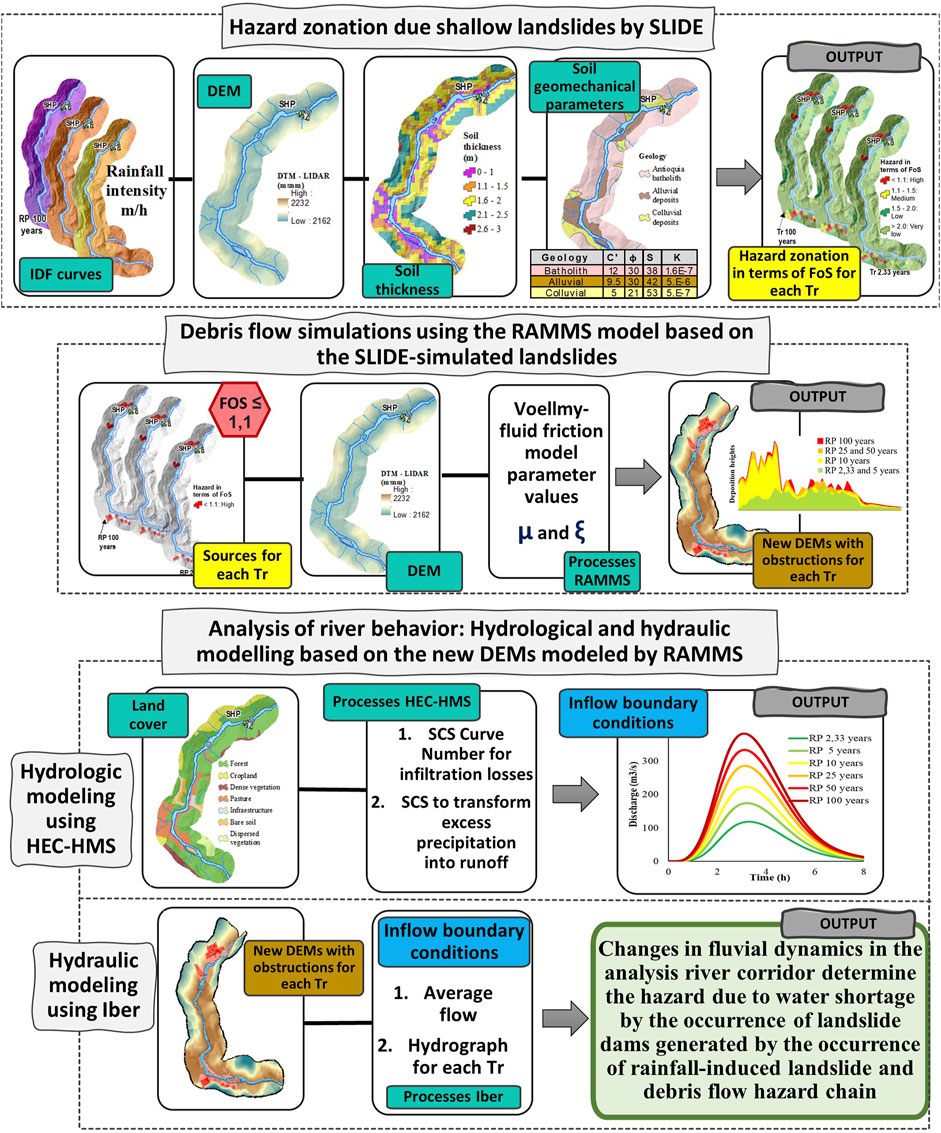
FIGURE 3. Workflow for the proposed methodology in this study.
This methodology was developed from the semi-automation of the analysis processes, through the generation of a toolbox for ArcGis based on scripting language Python 2.7 based on the ArcPy package with the purpose to generate a workflow that allows the application of the SLIDE methodology and the preparation of inputs for the subsequent processes of simulation of debris flow propagation and hydraulic modeling of the river corridor of analysis. This optimizes and complements the work and decision making of the expert for the application of the methodology from a set of procedures, tools and utilities specially designed to process data under the environment of Geographic Information Systems (GIS). For the use of the toolbox is necessary to have the GIS raster cells of the digital elevation model, the geological and geomorphological information of the study area, coverages, soil parameters, rainfall distribution as a triggering factor, among other input parameters of the different models. At forward subsections these phases are explained in more detail.
The spatial distribution of rainfall induced landslide hazard in terms of FoS values was estimated by a deterministic model with physical basis SLIDE, which integrates the infinite slope model with a rainfall infiltration model. The analysis was focused on shallow landslides to identify those areas susceptible according to the intrinsic soil parameters and the morphometric configuration of the terrain. Additionally, the model allows to simulate rainfall events as a triggering factor and the response of soil to such events. The FoS was obtained by the ratio of stabilizing forces to destabilizing forces. Slopes are typically considered stable when FoS is ≥1; while a landslide is predicted when FoS <1 (Liao et al., 2012). Thus, the transition between stability and collapse can be seen mathematically as a decrease in the FoS to values below unity (Montoya Botero, 2018; Tyagi et al., 2022). In this study, high hazard zones were considered with a FoS ≤1.1, thus presenting a conservative scenario (Vega and Hidalgo, 2016).
Given the complexity of shallow landslide studies, the following simplifying assumptions are made in the SLIDE model: The slope is considered infinite with low soil thickness, the failure is considered flat and water downflow occurs, both parallel to the slope and the evapotranspiration, underground seepage and surface flow are avoided in the water balance. Therefore, the infiltration amount approximately equals to the maximum of saturated hydraulic conductivity (Li et al., 2020b). This model considers some simplified hypotheses on the water down flow and defines a direct correlation between the FoS of the slopes and the rainfall depth (Montrasio et al., 2013). A relation between the rainfall amount and the final expression of FoS has been set up and translated into a simple mathematical formulation of model SLIDE. Г gamma is the variable that introduces in a compact way, the variables that represent the soil properties: specific gravity, porosity, degree of saturation, while Ω Omega involves the geometric variables such as slope and soil thickness susceptible to sliding. The FoS is calculated as follows (Liao et al., 2011):
Where β is the slope angle [°], ϕ is the friction angle [°], C is the soil cohesion [kpa], is a fractional parameter between 0 and 1 of soil thickness by infiltration. Parameter m, which changes in time, calculated by using Eq. 5. Gs is the specific gravity, n is the porosity, Sr is the degree of saturation [%], H is the soil thickness [m] and
The saturated part of the soil layer that directly correlates precipitation with FoS is expressed by the parameter
Where t is time [h], ∆ t is time step m1, is initial value of m and mt is calculated at each time-step. It is rainfall intensity [m/h] and K is the hydraulic conductivity of saturated soil [m/h] (Liao et al., 2010).
The physical mechanism of movement corresponds to superficial, translational landslides with rupture surfaces parallel to the slope surface. This model makes large assumptions for the estimation of the FoS hazard, so it was considered to resample the digital elevation model of 0.5 m lidar resolution of the study area in an elevation model with a spatial resolution of 10 m in the modeling of Landslide Hazard assessment in terms of FoS. The zoning was performed for the entire study basin; however, to carry out the study in computationally feasible terms, the analysis river corridor (Figure 1D) was delimited for subsequent debris flow runout processes and dynamic evaluations of the hydraulic behavior of the river.
The spatial distribution, duration, and intensity of rainfall play an important role in triggering landslides (Liao et al., 2011). The rainfall scenarios in the slope stability model SLIDE are represented by the rainfall intensity values (Eq. 5 in Eq. 2). There were no meteorological stations with available IDF curves in the study area, so these curves had to be estimated using the simple scaling methodology (Pulgarín and Poveda, 2008). The expression corresponding to the simple scaling is shown in Eq. 6:
Where Id, q is the maximum intensity for a duration d for a non-exceedance probability [m/h], Idref maximum intensity of a reference duration [m/h] E[Idref] expected value [m/h], ϕq quantile for a non-exceedance probability q from the standard Normal distribution [m/h], θ the scaling exponent.
The reference duration was 24 h according to the information available in IDEAM rainfall gauges. In the absence of an annual series of maximum rainfall in 24 h for the study basin, the annual series of maximum daily rainfall available were used, considering an increase of 11% (Pulgarín Dávila, 2009). For the analysis river corridor, hourly rainfall intensities were estimated up to the time of concentration of the SHP basin for the analyzed return periods of 2.33, 5, 10, 10, 10, 25, 50, and 100 years.
The depth of the potentially unstable soil is a critical parameter that strongly influences the stability of slopes (Oliveira et al., 2017). The evaluation of such thickness, susceptible to sliding or detachment, is essential before the analysis of problems involving hydrological processes developed on slopes, as well as slope stability (Fernandes Azevedo et al., 2015). The estimation of soil thickness is based on the behavior of the soil in relation to the slope of the terrain; high slopes imply less soil accumulation. The model of the soil susceptible to sliding is represented by the following equation (Montoya Botero, 2018).
Where H Soil thickness [m]; hmax Maximum soil thickness [m]; hmin minimum soil thickness [m]; θ slope angle value [°]; θlim is the slope angle value threshold for which higher values imply that the thickness of soil susceptible to sliding is minimal/negligible or even null [°]; a Dimensionless parameter that controls the estimating of soil thickness depending on the curvature of the terrain; the values were chosen according to predominant soil types of the geological units in tropical zones. The curvature controls the zones of water accumulation or spreading, which directly influences the degree of soil moisture and/or saturation and, therefore, the generation of debris flows (Náquira Bazán, 2009), and x represents the horizontal distance from a cell to the nearest drainage network. The term
Slope steepness is one of the key factors in determining landslide debris flow hazard chain. Most avalanches occur on slopes that have an incline of 35°–45° (Calcaterra et al., 2022). The choice of the slope limit in this study was made after analyzing the descriptive statistics of the slope distribution in the analyzed river corridor (Figure 2). The mean slope angle is 24°, while the standard deviation is 11°. Thus, it was decided to consider a critical value (θlim) for the slope of 35°, slightly higher than the measure comprising the mean plus standard deviation. The value of the variable a was set at 0.04 (Montrasio et al., 2013), while the maximum and minimum predicted thicknesses were assigned for each geologic unit, for the potential depth of rainfall-induced landslides (Integral, 2020). By applying a map algebra through the ArcGis platform as a Geographic Information System (GIS), the parameters involved were integrated and the model of soil thickness susceptible to landslide was spatialized.
For the application of the SLIDE model, the LiDAR topography survey (0.5 m pixel resolution) was resampled to obtain a DEM with a spatial resolution of 10 m, because the physical mechanism of movement corresponds to shallow landslide with failure surface parallel to the slope surface. For the geological characterization of the study area, the available information from the Colombian Geological Service was reviewed, such as topographic maps, geological maps and aerial photographs. Additionally, the owner of the SHP project carried out a soil exploration of the study site and subsequent laboratory analysis to determine the lithological characteristics, the thickness of the meteorization profiles, as well as the morphometric and morphodynamic configuration of the terrain. According to these exploration studies and the correlations reported in the literature for the soils found in the study area, the strength parameters and the geomechanical properties of the soils were defined, as well as the adopted depth values for the estimation of the soil thickness susceptible to landslide. Figure 2B shows the spatial distribution of the geological units of the study basin, and the soil properties required for SLIDE model and values for soil thickness estimation are summarized in Table 1.
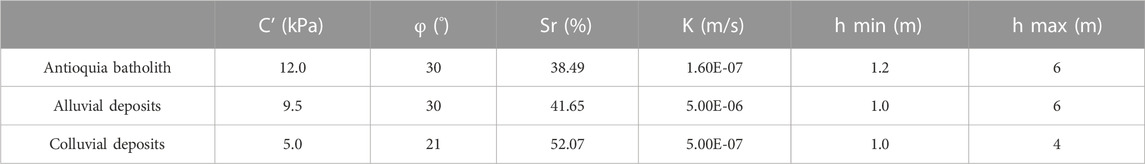
TABLE 1. Soil parameters for landslides assessment.
Rapid Mass Movement Simulation (RAMMS) with the debris flow module (called RAMMS: DEBRIS FLOW or RAMMS-DF) was developed to simulate the runout of muddy and debris-laden flows in complex terrain (Mikoš and Bezak, 2021) for practical and research-oriented applications. The model used in RAMMS employs the Voellmy–Salm fluid model, is based on a depth-averaged 2D solution to the implemented law of motion over 3D topography. The core of the program is an efficient second-order numerical solution of the depth-averaged equations of motion (the shallow water equations) for granular flows (Liu et al., 2021). This model can quickly simulate debris flows, and obtain motion parameters including motion distance, velocity impact pressure, and flow path, in three-dimensional terrain (Zhang X. et al., 2022).
Debris flow comprises three distinct zones: the source zone, the transportation zone, and the deposition zone. The area from where the debris flow initiates or the mobilization starts is the source zone (Dash et al., 2023). The initial height is determined by the user when defining the source area of the debris flow as a single or multiple block-release (initiation) zones can easily be specified by polygons by GIS-type drawing tools; alternatively, an input hydrograph can be used to specify the discharge as a function of time (Zimmermann et al., 2020).
The landslides footprint of the sliding mass emerging from was estimated using RAMMS-DF. According to the available information in the study basin the block release methodology was chosen using a polygon layer of triggering zones. The release areas were defined by polygons with shapefile containing the results of the SLIDE methodology hazard zoning methodology with high hazard zones. (Section 3.2). Source areas were considered as those with FoS <1.1 (Hidalgo and Vega, 2021). The block release module needs to use a release area with a given initial depth, which was set with the soil thickness estimated previously (Section 3.2.2). Additionally, for the launch of RAMMS module a DEM is necessary, hence, the LiDAR data was used.
There are several equations that control the modeling of RAMMS model, in addition to their corresponding input parameters, highlighting some of them such as the flow height (H), the gravity (g), slope angle (
For the river corridor of analysis, different scenarios were modeled by varying dry Coulomb friction coefficient μ and a turbulent friction coefficient ξ (m/s2), to represent different scenarios to obtain the maximum and minimum flow propagation, observing how the magnitude of the debris flow decreases and increases slightly as μ and ξ increase. Values of μ typically range from 0.05 to 0.4 (dimensionless). Values of μ greater than 0.4 rarely provide useful simulation results. ξ describes the turbulent behavior of the flow. Small values of ξ are usually reported for granular flows, while relatively large values of ξ are sometimes associated with muddy flows. ξ is more delicate to calibrate and the tool suggests values between 100 and 200 m/s2 (WSL Institute for Snow and Avalanche Research SLF, 2022). Nevertheless, since there are no records of historical events in the study area that provide information that completely describes the rheological parameters of the soil, the Voellmy friction parameters were estimated according to the known characteristics of the soil mentioned in Section 3.2.3 and the suggestions of the RAMMS user’s manual, obtaining μ = 0.4 and ξ = 100 m/s2.
The HEC-HMS model was used to analyze the rainfall–runoff processes of the SHP basin and to compute the hydraulic processes in the river corridor of study the numerical model Iber was implemented.
The Hydrologic Engineering Center and Hydrologic Modeling System HEC-HMS (Feldman, 2000 and U.S. Army Corps of Engineers, 2018), could be used for many hydrological simulations (Hamdan et al., 2021)). HEC-HMS is an accessible rainfall-runoff model, being one of the most widely used for hydrological simulations and offers a wide range of methods and modules to estimate runoff from rainfall, e.g., loss models, transformation models, routing methods, among others (Sahu et al., 2020; Reddy and Pramada, 2022). For more details about this model and its different methods, please consult in US Army Corps of Engineers Hydrologic Engineering Center (www.hec.usace.army.mil/software/hec-hms/).
The hydrologic model HEC-HMS was employed to determine the peak discharge for each return period for the study basin because in the study area there are no discharge records series to perform a frequency analysis and obtain the maximum discharge for the return periods of the study. This approach employs a rainfall-runoff model. The hypothesis that supports this methodology establishes that a maximum rainfall estimated for a given return period produces a maximum discharge for that same return period. Three main processes were considered in the methodology developed in this case of study:
• The Soil Conservation Service (SCS) Curve Number method was used to compute the infiltration losses. This method implements the curve number methodology for incremental losses since it was designed to calculate the infiltration during periods of heavy rainfall (González-Cao et al., 2019). Based on land cover and soil texture a CN of 81.5 was obtained, which suggests that the general conditions of the territory tend to favor runoff over infiltration. The input parameters were the vegetation cover maps corresponding to antecedent moisture condition II. The soils of the study watershed are part of hydrological group C.
• The SCS UH (Unit Hydrograph) method was applied to transform the excess rainfall into runoff, having as input the maximum rainfall for each return period with rainfall duration equal to the time of concentration of the study watershed.
• The Muskingum routing method was used for flow routing of the channel reaches because it provides a good approach in basins with similar slopes (González-Cao et al., 2019; Hamdan et al., 2021).
Iber is a free software that implements a family of bidimensional hydraulic mathematical models for the simulation of free surface flows in rivers and estuaries (Bladé et al., 2014; Pérez-Montiel et al., 2022). The equations are solved by the finite volume method on the grid nodes. The numerical schemes used in Iber are robust and stable in any situation, suitable for discontinuous flows, specifically for torrential channels and irregular regimes. The finite volume numerical methodology solves Shallow Water Equations in two dimensions (García-Alén et al., 2022). Modeling in Iber model requires a three-dimensional terrain model or mesh as starting data and the incorporation of the boundary conditions, the initial conditions, as well as the assignment of the terrain roughness coefficients (García et al., 2022). More information about this model can be found at (www.iberaula.es).
To construct the geometry of the meshes for each scenario, the information from the Lidar survey of the study area processed in ASCII format was used, in addition to the new DEMS modified with the heights of the landslide dams obtained with the RAMMS model in Section 3.3, building models with a maximum size of 1 m, minimum size of 0.5 m and tolerance of 0.1. Studies on the influence of mesh size in hydraulic modeling in flood plains with elements from 6 to 24 cm have given satisfactory results in flood levels (Bomers, 2020).The mesh size used for Iber is smaller for a better detail of the results but at the same time considering a feasible computation time, so it was considered adequate.
Roughness coefficients expressed by Manning’s n values were assigned from the land cover map (Figure 2C). Two types of inflow boundary conditions were established: the estimated hydrographs for each return period and the average flow of the stream. For the outflow conditions, given that there is no information associated with flood events such as depths at the end of the analysis section, a supercritical/critical regime was assumed for each scenario (Bladé et al., 2014). Once the simulation was completed, the results were exported to raster for better handling of the information in ArcGIS (www.esri.com).
The rainfall intensity for each return period was estimated with the generated IDF curves. Figure 4 shows the rainfall intensity maps with a duration equal to the estimated basin time of concentration of 3 h. The highest intensities were found towards the south and southeast of the river corridor of analysis.
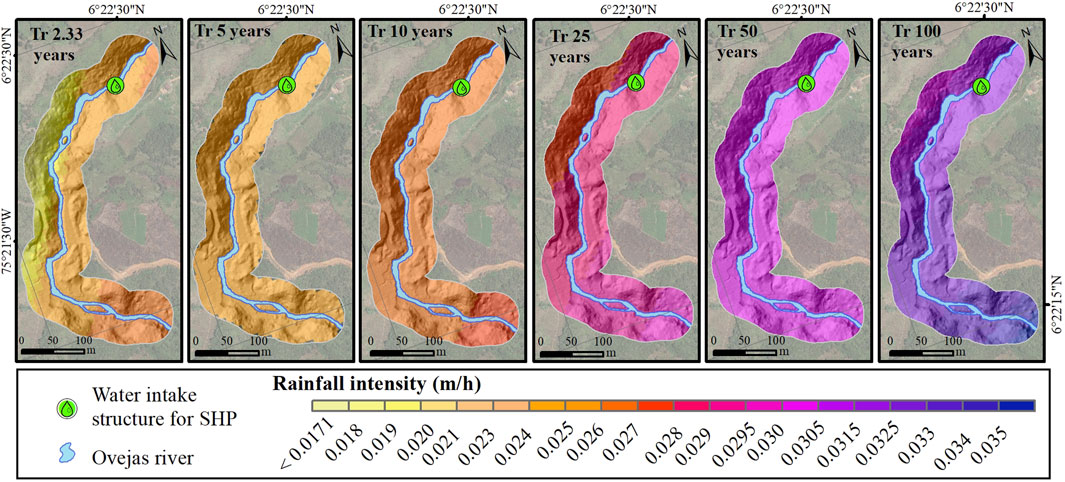
FIGURE 4. Rainfall intensities for the basin concentration time.
From the rainfall intensities for each return period, SLIDE model estimated the landslide hazard according to the FoS values. Four categories based on FoS values were used. Lowers values indicates higher potential for landslides occurrence. (Figure 5).
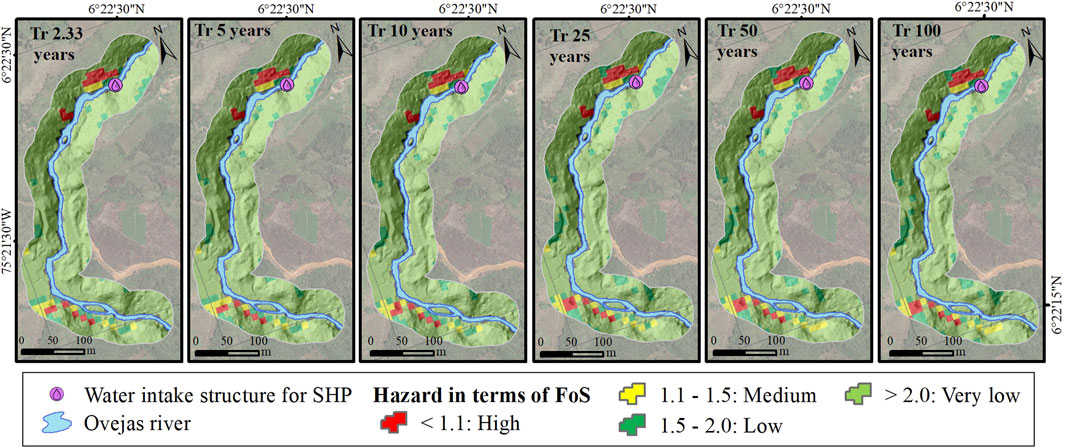
FIGURE 5. Landslide Hazard assessment in terms of FoS.
Based on Figure 5, it is observed that moderate and high hazard zones were distributed mainly in soils susceptible to landslides of greater soil thickness, where higher rainfall events progressively affect soil saturation and its possible failure, highlighting the influence of topographic features on the stability of the terrain. It is important to highlight that although slopes are a factor that have a high degree of influence, they do not control the landslide hazard zoning and it is affected by soil parameters, including the soil thickness susceptible to sliding. Since the model follows a correlation between FoS and rainfall, the high and medium hazard zones determined by soil thicknesses with very low FoS (H < 1.6 m), increase simultaneously with the return period analyzed for each scenario (with respect to the very low hazard zones). However, it should be noted that for the return periods of 2.33 and 5 years, the safety factor had the same spatial distribution. The same consideration is true for the 25 and 50 years return periods.
The results of the landslide hazard assessment in terms of FoS and landslide propagation were compared with the historical landslide inventory published in the Information System of Mass Movements (SIMMA) by the Colombian Geological Service; DesInventar disaster database (http://www.desinventar.org) and the international disasters database EM-DAT. The results found were isolated cases in the basin that are scarcely documented and correspond to the year 2011; however, no events were reported in the river corridor under analysis. For this reason, no parameter calibration was performed, and the parameters recommended by the literature for the type of soil in the study area were considered. Landslide susceptibility and hazard studies are essential for updating land use plans in the municipalities of the Colombian territory (Aristizábal et al., 2022).
For landslide propagation assessment, source areas were considered as those areas with FoS <1.1. All the identified high hazard areas are in recent colluvial deposits. It is evident in Figure 5 that as the return period increases, the hazard areas increase; however, for return periods 2.33 and 5 years, the areas of hazards susceptible to landslide with FoS <1.1 are the same; this situation is also present for return periods 25 and 50 years, thus having the same spatial distribution of hazard in term of FoS for the river corridor of analysis, likewise it will have the same propagation footprint in the simulations to determine the runout. These cells were intersected with the soil thickness result to obtain the initial thickness of soil susceptible to landslide as input for the debris flow runout simulations using the RAMMS model.
Figure 6 shows the estimated propagation footprint of the sliding mass emerging from the release sources identified and the maximum deposition heights of the material for the different rainfall scenarios.
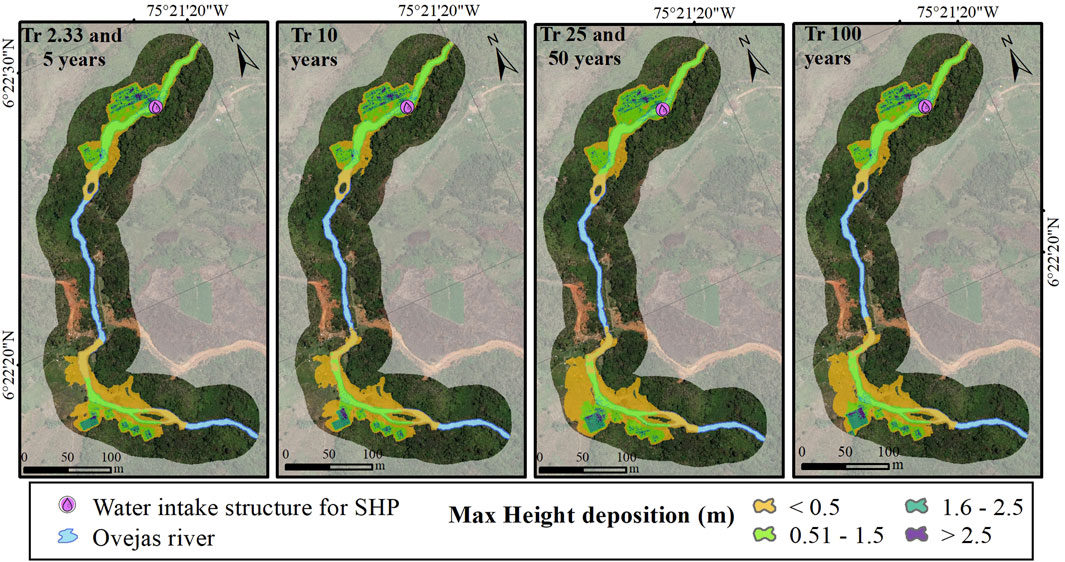
FIGURE 6. Landslide propagation footprint in Ovejas river for each return period.
The results obtained were conditioned by the spatial resolution of the terrain elevation model. In all scenarios analyzed, the material removed from the release areas reached the Ovejas riverbed. Increases in the extent and heights of material deposition were evident in the river corridor, reaching in all rainfall scenarios a propagation in the riverbed and even in the area where the water intake structure is located. Therefore, it would be convenient to analyze alternatives for mitigating the identified hazards in the design of the project’s water intake structures; however, the risk issue is not within the scope of this study.
Once the results of the runout of the debris flow were obtained, the river corridor was evaluated longitudinally to identify those areas of the river channel that should be studied with greater attention and should require a potential intervention for the protection of the riverbed. The initial point of analysis was defined at the northern end of the project, upstream of the water intake structure for SHP. Figure 7 shows the longitudinal axis of the river in the analysis corridor with the heights of deposition. The color scale corresponds to each return period.
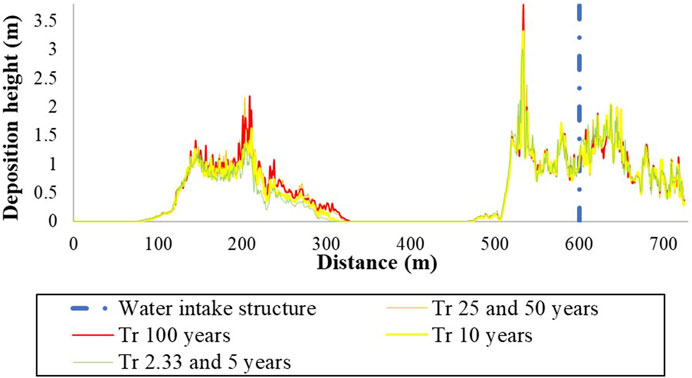
FIGURE 7. Longitudinal profile of deposition height for each return period.
For nearest areas of the sources of material detachment (distances of 100,300,500, and 700 m), there is a high probability that the material will reach the riverbed of the Ovejas River in the return periods analyzed. The section of the river between 500 and 700 m is the most likely to be affected because it is the area with the highest number of sources with FoS <1.1. These critical areas must be managed to mitigate the vulnerability of the intake engineering works in the channel.
To evaluate these results obtained from the modeling of debris flow propagation footprint, the cross section at 600 m in longitudinal profile in the river corridor (just upstream of the SHP project water intake structure) was analyzed to observe the deposition heights that could generate an obstruction of the stream. The results are shown in Figure 8.
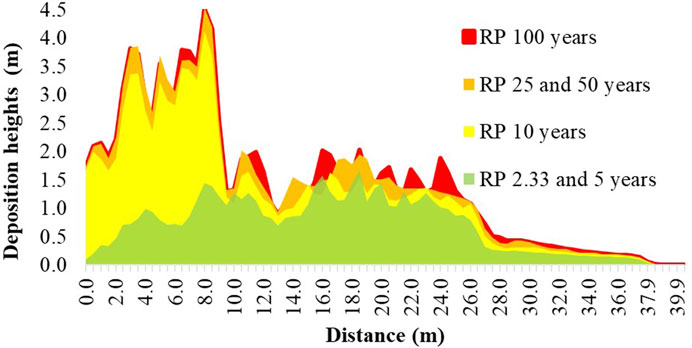
FIGURE 8. Landslide propagation profile in the cross section upstream of the SHP project for each return period.
Figure 8 shows the heights of material deposition increased simultaneously with the return period analyzed for each scenario and the corresponding number of release sources identified for these. These sources were identified as having a high hazard using the SLIDE model. It should be noted that precipitation as a triggering factor is higher as the return period increases but has a lower probability of recurrence.
This section will show the results of the changes in the specific flow and in the delay times for average flow, being the same flow and different meshes, as well as for each hydrograph, being different hydrographs and different meshes. Delay times refer to the time in which the flow decreases or falls below the average flow or design flow, due to the obstruction of the channel. In a SHP this time may represent an important interval during which the flow for generation falls below the minimum allowed, or in the case of an intake for water supply, this time may imply an interval in which there is a lack of supply.
The first step in the modeling was to obtain the characteristics of the basin and the generation of analysis sub-basins and their drainage network from the GIS module of HEC-HMS, as well as some hydrological parameters. In the meteorological model of HEC-HMS, we applied the hietograms of each of the sub-basins estimated for each return period.
The hydraulic modeling was carried out for different flow and meshes scenarios for the return periods of 2.33, 5, 10, 10, 25, 50, and 100 years, to show the changes in flow height, flow rate and delay time that the flow suffers with the obstruction or landslide dams modeled in RAMMS. The delay time and the decrease in flow are variables that define the hazard due to water shortage in hydroelectric generation.
To identify the delay that can be generated after the obstructions in the channel, the transit of the average flow through the river corridor was modeled with the topography without obstruction (original mesh) and with the topography incorporating the landslide dams generated by the propagation of the debris flow for the different return periods. The specific discharge in [m2/s] in the grid cell indicates the flow per unit length passing through the cross section of the river. Values of the specific flow indicate a concentration of flow due to the narrowing of the section because of the obstruction. The Changes in specific discharge for different meshes of return period with average flow are shown in Figure 9.
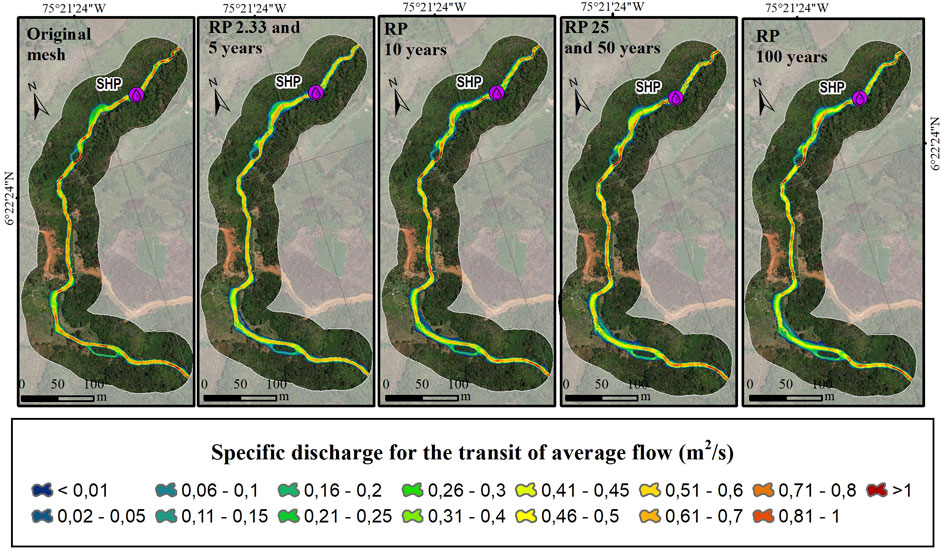
FIGURE 9. Changes in specific discharge for different return period meshes with the transit of average flow.
The time delay and the decrease in flow are variables that define the hazard due to water shortage in hydroelectric generation or community supply. The transit time of the average flow in the river corridor was 580 s for the original mesh. Table 2 shows the time of transit for each return period and the additional time required to transit the average flow with respect to the original mesh.
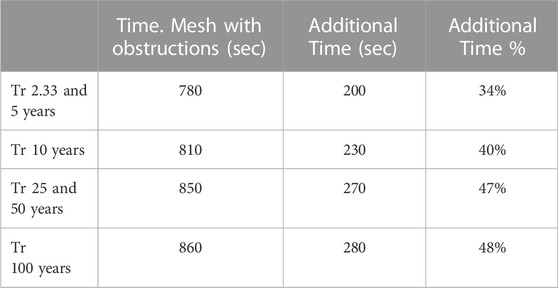
TABLE 2. Delay time for average flow.
The modeling results shows that the obstructions generated by the chain of landslides and debris flow modified the hydraulic conditions of the river, influencing the flow transit time in the river corridor. On the other hand, the specific discharge was analyzed between the different scenarios in a section upstream of the water intake structure of the project.
For all return periods analyzed there was a decrease in specific flow, with lower values as the return period increased, reaching reductions of more than 50% of the specific flow. This could result in a shortage of water supply, meaning that the project may not be able to generate energy at a given moment due to the absence of the specific flow at the water intake structure site or may leave a community without water supply.
The channel blockage was caused by a chain of debris flows from rainfall-induced landslides, itself with an associated return period. Under the assumption that the response of the basin will have the same return period, the behavior of the stream in each of the meshes and their corresponding hydrographs according to return the period was modeled. The results are presented in Figures 10–15. Each figure contains in the lower right corner the comparative specific flow rates for each simulation in the upstream section of the intake structure of the project.
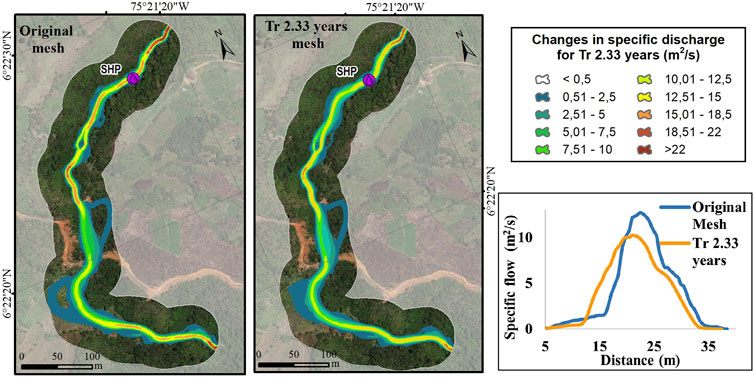
FIGURE 10. Specific discharge for original mesh and for Tr 2.33 years.
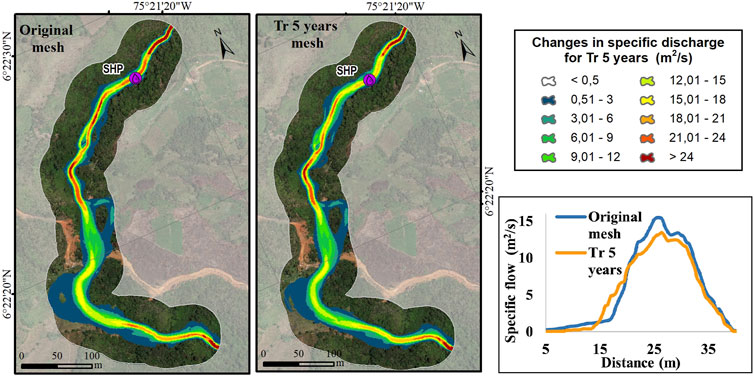
FIGURE 11. Specific discharge for original mesh and for Tr flow of 5 years.
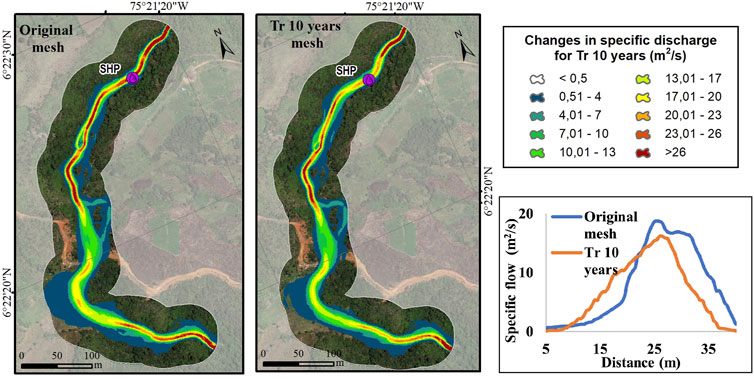
FIGURE 12. Specific discharge for original mesh and for Tr flow of 10 years.
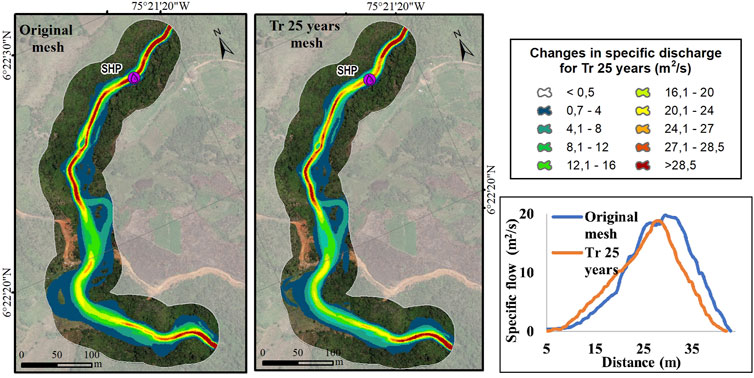
FIGURE 13. Specific discharge for original mesh and for Tr flow of 25 years.
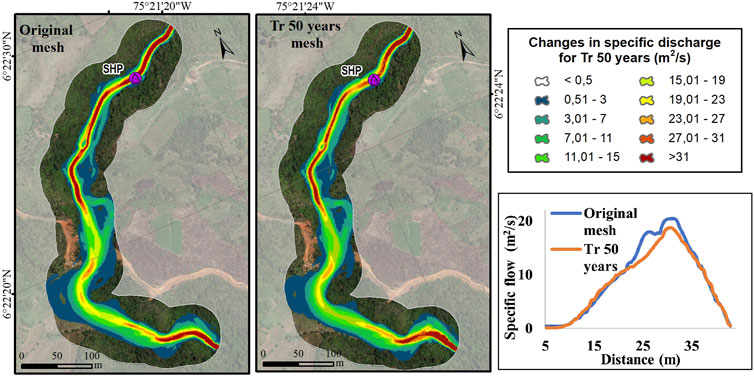
FIGURE 14. Specific discharge for original mesh and for Tr flow of 50 years.
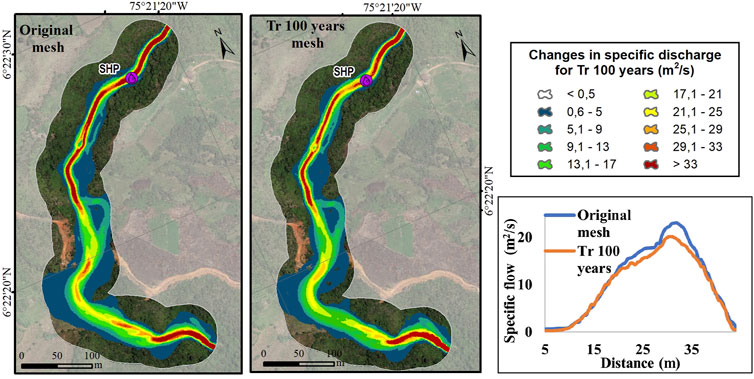
FIGURE 15. Specific discharge for original mesh and for Tr flow of 100 years.
The results show that the transit time of the hydrographs in the analyzed river corridor increased for the meshes with landslide dams, its increased time was similar in all return periods, this time increase is equivalent to 11%.The results also showed a decrease in the specific flow in all the scenarios analyzed due to the landslide dams in the river channel, representing up to a 20% decrease in the specific flow.
The shallow landslides assessment was based on an infinite slope stability model, in which the failure surface is assumed to be flat, in which the uncertainty of the geomechanical parameters of the soil was not considered. The applied methodology is able to simulate rainfall-induced landslides, but it remains difficult to predict the exact time when the slope is prone to instability. In addition, rainfall data can influence the model simulation, especially at the time when landslides occur.
The reliability of the propagation results depends on the determination and calibration of debris flow model parameters that more closely represent the ground conditions and flow characteristics of the material, this process can be performed using two approaches: In the first approach, soil parameters can be obtained from laboratory tests of data collected in the field and are appropriately used and processed for early warning calibration. However, field observations of debris flow behavior and rheology are difficult and still scarce and laboratory experiments are difficult to translate to field situations (Von Boetticher et al., 2017). In the second approach, a retrospective analysis of well-documented past debris flow events is carried out, in which the source zone and propagation zone of the mass movement can be clearly identified to obtain the flow intensity parameters in which calibrated values of the input parameters can be used to predict the parameters of the potential debris flow in the future, however, in the study area there are no historical records that allow carrying out this analysis, leaving an open path for future research in cases where there are no precedent events for the calibration of the models. The challenge in the application of dynamic models is the estimation or calibration of key model parameters.
The delay or detention times of the river flow upstream of the catchment and the temporary variation of the flow downstream of the obstruction can be critical for the hydroelectric generation of a project, as well as for the supply of a population downstream of the obstruction. This would imply a shortage in the water catchment, which could be reflected in the reduction of energy generation by the hydroelectric plants or the shortage of the aqueduct of a community, which is recommended for further study. As well as the study of possible obstructions that could obstruct and collapse the catchment. This is an issue that should be addressed more rigorously in the future, in the scope of this study it is not possible determine the real impact that this event could have on the generation of energy or the supply of communities.
The evaluation of landslide mitigation measures is very complex and must consider more aspects. In this article, we do not intend to make an exhaustive review of the landslide dam that may be generated. To offer a deeper discussion, we only focus on the chain as such that can be triggered and its possible effects, especially to the water supply shortage of the SHP under study or in other possible small hydroelectric powers and communal aqueducts, which are the main users of rural basis in this type of mountainous areas, which can be a good attempt to encourage the scientific communities as potential future research step.
In this work, a comprehensive assessment of landslide dam by the occurrence of rainfall induced landslide debris flow hazard chain using deterministic method was presented. SLIDE model was implemented for develop a stability analysis in terms of FoS through multiple rainfall return periods, identifying high hazard zones that may detach sliding material and generate obstructions in the river channel. Medium and high hazards were observed in the areas of geological units of recent colluvial deposits that are coincident with high slopes. Hazard increases as the return period increases. It is important to note that although slopes are a factor that probably have a high degree of influence, they do not control the hazard zoning and are affected by soil parameters, including the thickness susceptible to landslide. The lower FoS values are mainly distributed towards areas with thicker landslide-susceptible soils, where more intense precipitation events progressively affect soil saturation and possible collapse, which is consistent with the model and its intention to simulate natural events. For all the scenarios analyzed, there is a predominance of low to exceptionally low hazard levels in the Antioquia Batholith.
RAMMS-DF was used to simulate debris flow. The sources identified as high hazard zones propagated the material until it reached the riverbed, generating partial obstructions in the analysis section located near the water intake structure for the Small Hydropower Plant. However, in not one of the scenarios analyzed was there a total obstruction of the river cross section according to the morphology of the channel and the heights deposited on the riverbed.
The hazard of obstruction of water sources due to the occurrence of landslides dams was evaluated in terms of the retention of the flow. It was found that when evaluating the hydraulic behavior of the river channel against landslide dams generated by the occurrence of rainfall-induced landslide and debris flow hazard chain for the different return periods, the obstructions were sufficient to change the hydraulic regime of the study river corridor showing longer delay times in the flow transit, in addition to the decrease in the specific flow. For average flow conditions with obstructions in the riverbed, the specific flow rate showed reductions of more than 50%. For hydrographs of different return periods, the results show a decrease in specific flow in all scenarios analyzed, up to 20%. Additionally, for these hydrographs, the results show that the transit time increased by up to 11%.
These results have potential application in the management of slope disaster prevention and the assessment of the hazard chain of rainfall-induced shallow landslides and the consequent generation of debris flows. (Han et al., 2021).
The raw data supporting the conclusion of this article will be made available by the authors, without undue reservation.
LO-G developed the theory and performed the computations. All authors contributed to the study conception and design BB and JV verified the analytical methods. All authors contributed to the article and approved the submitted version.
The proposed methodology in this study is framed within the guidelines and products of the research program “Vulnerability, resilience and risk of communities and supplying basins affected by landslides and avalanches,” code 1118-852-71251, project “Functions for vulnerability assessment due to water shortages by landslides and avalanches: micro-basins of southwest Antioquia”, contract 80740-492-2020 held between Fiduprevisora and the Universidad de Medellín, with resources from the National Financing Fund for science, technology and innovation, “Francisco José de Caldas”. We also thank Integral S.A. for the information provided of the Guamito Hydroelectric Project Feasibility Study developed in 2019. PALSAR DEM data was downloaded from the Alaska Satellite Facility (ASF).
The authors declare that the research was conducted in the absence of any commercial or financial relationships that could be construed as a potential conflict of interest.
All claims expressed in this article are solely those of the authors and do not necessarily represent those of their affiliated organizations, or those of the publisher, the editors and the reviewers. Any product that may be evaluated in this article, or claim that may be made by its manufacturer, is not guaranteed or endorsed by the publisher.
The Supplementary Material for this article can be found online at: https://www.frontiersin.org/articles/10.3389/feart.2023.1157881/full#supplementary-material
Abraham, M. T., Satyam, N., Pradhan, B., and Tian, H. (2022). Debris flow simulation 2D (DFS 2D): Numerical modelling of debris flows and calibration of friction parameters. J. Rock Mech. Geotechnical Eng. 14, 1747–1760. doi:10.1016/J.JRMGE.2022.01.004
AMVAÁrea Metropolitana del Valle de AburráCorporaciones Autónomas RegionalesCorporación Autónoma Regional del Centro de AntioquiaCorporación Autónoma Regional de las Cuencas de los Ríos Negro y Nare (2015). Plan de Ordenación y Manejo de la Cuenca Hidrográfica del Río Aburrá. Available at: https://www.corantioquia.gov.co/planes-de-ordenacion-y-manejo-de-la-cuenca-hidrografica-pomca/ (Accessed May 7, 2023).
Arghya, A. B., Hawlader, B., and Guthrie, R. H. (2022). “A comparison of two runout programs for debris flow assessment at the Solalex-Anzeindaz region of Switzerland,” in Géorisques - VIII - Geohazards (Quebec, Canada). Available at: https://www.stantec.com/en/ideas/a-comparison-of-two-runout-programs-for-debris-flow-assessment-solalex-anzeindaz-region-switzerland (Accessed May 1, 2023).
Aristizábal, E., Garcia, E. F., Marin, R. J., Gómez, F., Guzmán-Martínez, J., Aristizábal, E., et al. (2022). Rainfall-intensity effect on landslide hazard assessment due to climate change in north-western Colombian Andes. Medellín, Colombia: Revista Facultad de Ingeniería Universidad de Antioquia, 51–66. doi:10.17533/UDEA.REDIN.20201215
Aristizábal, E., Martínez-Carvajal, H., and García-Aristizábal, E. (2017). Modelling shallow landslides triggered by rainfall in tropical and mountainous basins. Adv. Cult. Living Landslides 207, 207–212. doi:10.1007/978-3-319-53485-5_23
Armaș, I., Gheorghe, M., and Silvaș, G. C. (2021). Shallow landslides physically based susceptibility assessment improvement using InSAR. Case study: Carpathian and subcarpathian prahova valley, Romania. Remote Sens. 13, 2385. doi:10.3390/RS13122385
ASF DAAC (2015). ALOS PALSAR_Radiometric_Terrain_Corrected_high_res. Available at: https://asf.alaska.edu/data-sets/derived-data-sets/alos-palsar-rtc/alos-palsar-radiometric-terrain-correction/ (Accessed November 11, 2021).doi:10.5067/Z97HFCNKR6VA
Baggio, T., Mergili, M., and D’Agostino, V. (2021). Advances in the simulation of debris flow erosion: The case study of the Rio Gere (Italy) event of the 4th August 2017. Geomorphology 381, 107664. doi:10.1016/J.GEOMORPH.2021.107664
Bladé, E., Cea, L., Corestein, G., Escolano, E., Puertas, J., Vázquez-Cendón, E., et al. (2014). Iber — river modelling simulation tool. Rev. Int. Métodos Numéricos Cálculo Diseño Ing. 30, 1–10. doi:10.1016/J.RIMNI.2012.07.004
Bomers, A. (2020). Hydraulic modelling approaches to decrease uncertainty in flood frequency relations. PhD Thesis. (University of Twente: Enschede, Netherlands) doi:10.3990/1.9789036549288
Calcaterra, D., Martire, D. Di, Guerriero, L., Tomás, R., Košová, V., Molokáč, M., et al. (2022). Avalanche hazard modelling within the kráľova hoľa area in the low tatra mountains in Slovakia. Land 11, 766. doi:10.3390/LAND11060766
Chae, B. G., Park, H. J., Catani, F., Simoni, A., and Berti, M. (2017). Landslide prediction, monitoring and early warning: A concise review of state-of-the-art. Geosciences J. 21 (6), 1033–1070. doi:10.1007/S12303-017-0034-4
Chen, W., Tsai, F., Kainz, W., Thomas, J., Gupta, M., Srivastava, P. K., et al. (2023). Assessment of a dynamic physically based slope stability model to evaluate timing and distribution of rainfall-induced shallow landslides. ISPRS Int. J. Geo-Information 12, 105. doi:10.3390/IJGI12030105
Chen, Y., Zhao, L., Wang, Y., Jiang, Q., and Qi, D. (2019). Precipitation data and their uncertainty as input for rainfall-induced shallow landslide models. Front. Earth Sci. 13, 695–704. doi:10.1007/s11707-019-0791-7
Chen, Z., He, S., Shen, W., and Wang, D. (2022). Effects of defense-structure system for bridge piers on two-phase debris flow wakes. Acta Geotech. 17, 1645–1665. doi:10.1007/s11440-021-01296-5
Chikalamo, E. E. (2018). Comparing modelling approaches for landside early warning: A case study of bogowonto catchment, central java, Indonesia, Thesis. Enschede, The Netherlands: ITC Faculty Geo-Information Science and Earth Observation.
Christen, M., Kowalski, J., and Bartelt, P. (2010). Ramms: Numerical simulation of dense snow avalanches in three-dimensional terrain. Cold Reg. Sci. Technol. 63, 1–14. doi:10.1016/J.COLDREGIONS.2010.04.005
Cui, P., and Guo, J. (2021). Evolution models, risk prevention and control countermeasures of the valley disaster chain. Gongcheng Kexue Yu Jishu/Advanced Eng. Sci. 53, 5–18. doi:10.15961/J.JSUESE.202100285
Dash, R. K., Samanta, M., and Kanungo, D. P. (2023). “Debris flow hazard in India: Current status, research trends, and emerging challenges,” in Landslides: Detection, Prediction and Monitoring Editors P. Thambidurai, and T.N. Singh (Manhattan, NY, USA: Springer, Cham), 211–231. doi:10.1007/978-3-031-23859-8_10
Dhanai, P., Singh, V. P., and Soni, P. (2022). Rainfall triggered slope instability analysis with changing climate. Indian Geotechnical J. 52, 477–492. doi:10.1007/s40098-021-00581-0
Díaz-Salas, A. M., Guevara-Pérez, E., and Vidal-Moreno, J. D. (2021). Modelamiento numérico de un flujo de escombros asociado a una rotura de presa en la subcuenca Quillcay, Áncash, Perú. Rev. Ing. UC 28, 35–46. doi:10.54139/revinguc.v28i1.4
Do, H. M., Long, K., Zi, Y., Guo, Z., Yin, K. L., and Guo, Z. Z. (2020). A comparative study on the integrative ability of the analytical hierarchy process, weights of evidence and logistic regression methods with the Flow-R model for landslide susceptibility assessment. Geomatics, Nat. Hazards Risk 11 (1), 2449–2485. doi:10.1080/19475705.2020.1846086
Dysarz, T. (2018). Development of RiverBox—an ArcGIS toolbox for river bathymetry reconstruction. Water 10, 1266. doi:10.3390/W10091266
Fernandes Azevedo, G., Montoya Botero, E., Martínez, H. E., García, E., and Newton, M. S. (2015). “Estimativa da profundidade do solo pelo uso de técnicas de geoprocessamento, estudo de caso: Setor Pajarito, Colômbia,” in XVII Brazilian symposium on remote sensing. João pessoa, Brazil April 2015.
Franco-Ramos, O., Ballesteros-Cánovas, J. A., Figueroa-García, J. E., Vázquez-Selem, L., Stoffel, M., and Caballero, L. (2020). Modelling the 2012 lahar in a sector of jamapa gorge (pico de Orizaba volcano, Mexico) using RAMMS and tree-ring evidence. Water 12, 333. doi:10.3390/W12020333
Fustos-Toribio, I. J., Morales-Vargas, B., Somos-Valenzuela, M., Moreno-Yaeger, P., Muñoz-Ramirez, R., Rodriguez Araneda, I., et al. (2021). Debris flow event on Osorno volcano, Chile, during summer 2017: New interpretations for chain processes in the southern Andes. Nat. Hazards Earth Syst. Sci. 21, 3015–3029. doi:10.5194/NHESS-21-3015-2021
Gan, J., and Zhang, Y. X. (2019). Numerical simulation of debris flow runout using ramms: A case study of luzhuang gully in China. Comput. Model Eng. Sci. 121, 981–1009. doi:10.32604/cmes.2019.07337
García, J. V. G., Panta, J. E. R., Reynoso, D. S. F., Ayala, C. R., Hidalgo, R. R., García, F. G. G., et al. (2022). Modelación hidráulica en Iber para prevención de inundaciones en la cuenca Tesechoacán. Rev Mex Cienc 13, 159–181. doi:10.29298/RMCF.V13I71.1238
García-Alén, G., González-Cao, J., Fernández-Nóvoa, D., Gómez-Gesteira, M., Cea, L., and Puertas, J. (2022). Analysis of two sources of variability of basin outflow hydrographs computed with the 2D shallow water model Iber: Digital Terrain Model and unstructured mesh size. J. Hydrol. (Amst) 612, 128182. doi:10.1016/J.JHYDROL.2022.128182
García-Delgado, H., Villamizar-Escalante, N., Bermúdez, M. A., Bernet, M., and Velandia, F. (2021). Climate or tectonics? What controls the spatial-temporal variations in erosion rates across the eastern cordillera of Colombia? Glob. Planet Change 203, 103541. doi:10.1016/J.GLOPLACHA.2021.103541
González-Cao, J., García-Feal, O., Fernández-Nóvoa, D., Domínguez-Alonso, J. M., and Gómez-Gesteira, M. (2019). Towards an automatic early warning system of flood hazards based on precipitation forecast: The case of the miño river (NW Spain). Nat. Hazards Earth Syst. Sci. 19, 2583–2595. doi:10.5194/NHESS-19-2583-2019
Graf, C., and McArdell, B. (2008). “Simulation of debris flow runout before and after construction of mitigation measures: an example from the Swiss Alps,” in International Conference Debris Flows: Disasters, Risk, Forecast, Protection (Pyatigorsk, Russia), 233–236. Available at: https://elibrary.ru/item.asp?id=37236604 (Accessed May 7, 2023).
Guo, J., Cui, Y., Xu, W., Yin, Y., Li, Y., and Jin, W. (2022a). Numerical investigation of the landslide-debris flow transformation process considering topographic and entrainment effects: A case study. Landslides 19, 773–788. doi:10.1007/s10346-021-01791-6
Guo, Z., Torra, O., Hürlimann, M., Abancó, C., and Medina, V. (2022b). Fslam: A qgis plugin for fast regional susceptibility assessment of rainfall-induced landslides. Environ. Model. Softw. 150, 105354. doi:10.1016/J.ENVSOFT.2022.105354
Hafnaoui, M. A., and Debabeche, M. (2021). Numerical modeling of the hydraulic jump location using 2D Iber software. Model Earth Syst. Environ. 7, 1939–1946. doi:10.1007/s40808-020-00942-3
Hamdan, A. N. A., Almuktar, S., and Scholz, M. (2021). Rainfall-runoff modeling using the HEC-HMS model for the Al-adhaim river catchment, northern Iraq. Hydrology 8, 58. doi:10.3390/HYDROLOGY8020058
Hidalgo, C. A., and Vega, J. A. (2021). Probabilistic landslide risk assessment in water supply basins: La liboriana River Basin (salgar-Colombia). Nat. Hazards 109, 273–301. doi:10.1007/s11069-021-04836-0
Hoyos, H., and Botero, B. A. (2019). Vulnerability assessment with scarce information for a quantitative flood risk model. Case study monteria-Colombia. IOP Conf. Ser. Mater Sci. Eng. 471, 102005. doi:10.1088/1757-899X/471/10/102005
Hu, H., Zhou, G. G. D., Song, D., Cui, K. F. E., Huang, Y., Choi, C. E., et al. (2020). Effect of slit size on the impact load against debris-flow mitigation dams. Eng. Geol. 274, 105764. doi:10.1016/J.ENGGEO.2020.105764
Hungr, O., Leroueil, S., and Picarelli, L. (2014). The Varnes classification of landslide types, an update. Landslides 11, 167–194. doi:10.1007/s10346-013-0436-y
Hürlimann, M., Guo, Z., Puig-Polo, C., and Medina, V. (2022). Impacts of future climate and land cover changes on landslide susceptibility: Regional scale modelling in the val d’Aran region (pyrenees, Spain). Landslides 19, 99–118. doi:10.1007/s10346-021-01775-6
Kun-Ting, C., Chia-Hsing, L., Xiao-Qing, C., Gui-Sheng, H., Xiao-Jun, G., Chjeng-Lun, S., et al. (2018). An assessment method for debris flow dam formation in taiwan. Earth Sci. Res. J. 22, 37–43. doi:10.15446/ESRJ.V22N1.62389
Li, Y., Chen, J., Zhou, F., Song, S., Zhang, Y., Gu, F., et al. (2020a). Identification of ancient river-blocking events and analysis of the mechanisms for the formation of landslide dams in the Suwalong section of the upper Jinsha River, SE Tibetan Plateau. Geomorphology 368, 107351. doi:10.1016/J.GEOMORPH.2020.107351
Li, Y., Chen, J., Zhou, F., Song, S., Zhang, Y., Gu, F., et al. (2020b). Identification of ancient river-blocking events and analysis of the mechanisms for the formation of landslide dams in the Suwalong section of the upper Jinsha River, SE Tibetan Plateau. Geomorphology 368, 107351. doi:10.1016/J.GEOMORPH.2020.107351
Liao, Z., Hong, Y., Adler, R. F., and Bach, D. (2011). “A physically based SLIDE model for landslide hazard assessments using remotely sensed data sets,” in Geomechanics and geotechnics (Boca raton, FL, USA: CRC Press), 807–813. doi:10.1201/B10528-127
Liao, Z., Hong, Y., Wang, J., Fukuoka, H., Sassa, K., Karnawati, D., et al. (2010). Prototyping an experimental early warning system for rainfall-induced landslides in Indonesia using satellite remote sensing and geospatial datasets. Landslides 7, 317–324. doi:10.1007/s10346-010-0219-7
Liu, T., Wang, Y., Yu, H., and Chen, Y. (2022). Using statistical functions and hydro-hydraulic models to develop human vulnerability curves for flash floods: The flash flood of the Taitou catchment (China) in 2016. Int. J. Disaster Risk Reduct. 73, 102876. doi:10.1016/J.IJDRR.2022.102876
Liu, X., Zhao, C., Zhang, Q., Lu, Z., Li, Z., Yang, C., et al. (2021). Integration of Sentinel-1 and ALOS/PALSAR-2 SAR datasets for mapping active landslides along the Jinsha River corridor, China. Eng. Geol. 284, 106033. doi:10.1016/J.ENGGEO.2021.106033
Marin, R. J., Velásquez, M. F., and Sánchez, O. (2021). Applicability and performance of deterministic and probabilistic physically based landslide modeling in a data-scarce environment of the Colombian Andes. J. South Am. Earth Sci. 108, 103175. doi:10.1016/J.JSAMES.2021.103175
Medina, V., Hürlimann, M., Guo, Z., Lloret, A., and Vaunat, J. (2021). Fast physically-based model for rainfall-induced landslide susceptibility assessment at regional scale. Catena (Amst) 201, 105213. doi:10.1016/J.CATENA.2021.105213
Mikoš, M., and Bezak, N. (2021). Debris flow modelling using RAMMS model in the alpine environment with focus on the model parameters and main characteristics. Front. Earth Sci. (Lausanne) 8, 732. doi:10.3389/feart.2020.605061
Montoya Botero, E. (2018). Metodologia para aplicação de redes neurais artificiais para sistemas de alerta de escorregamentos deflagrados por chuvas em regiões montanhosas. Available at: https://repositorio.unb.br/handle/10482/33056 (Accessed May 7, 2023).
Montrasio, L., Valentino, R., Losi, G. L., Corina, A., Rossi, L., and Rudari, R. (2013). Space-time hazard assessment of rainfall-induced shallow landslides. Landslide Sci. Pract. Glob. Environ. Change 4, 283–293. doi:10.1007/978-3-642-31337-0_37
Moreira Melo, C., Kobiyama, M., Paulo Michel, G., Madruga de Brito, M., Lu, Z., and Miguel Ferreira, T. (2021). The relevance of geotechnical-unit characterization for landslide-susceptibility mapping with SHALSTAB. GeoHazards 2, 383–397. doi:10.3390/GEOHAZARDS2040021
Náquira Bazán, M. V. (2009). Susceptibilidad de Remociones en Masa en las Costas de Fiordos Cercanos a Hornopirén, X Región. Available at: https://repositorio.uchile.cl/handle/2250/103473 (Accessed May 7, 2023).
Nian, T., Li, D., Liang, Q., Wu, H., and Guo, X. (2021). Multi-phase flow simulation of landslide dam formation process based on extended coupled DEM-CFD method. Comput. Geotech. 140, 104438. doi:10.1016/J.COMPGEO.2021.104438
Oliveira, S. C., Zêzere, J. L., Lajas, S., and Melo, R. (2017). Combination of statistical and physically based methods to assess shallow slide susceptibility at the basin scale. Nat. Hazards Earth Syst. Sci. 17, 1091–1109. doi:10.5194/NHESS-17-1091-2017
Pérez-Montiel, J. I., Cardenas-Mercado, L., and Nardini, A. G. C. (2022). Flood modeling in a coastal town in northern Colombia: Comparing MODCEL vs. IBER. Water 14, 3866. doi:10.3390/W14233866
Pulgarín Dávila, E. G. (2009). Fórmulas regionales para la estimación de curvas intensidad-frecuencia-duración basadas en las propiedades de escala de la lluvia (región andina colombiana). Available at: https://repositorio.unal.edu.co/bitstream/handle/unal/70277/98671272.2009_1.pdf?sequence=3 (Accessed May 1, 2023).
Pulgarín, E., and Poveda, G. (2008). “Estimación de curvas IDF basadas en las propiedades de escala de la lluvia,” in Proceedings of the XVIII Seminario Nacional de Hidráulica e Hidrología. Bogotá, Colombia May 2008.
Qiang, X., Dalei, P., Chaoyang, H., Xing, Q., Kuanyao, Z., Dehao, X., et al. (2020). Theory and method of monitoring and early warning for sudden loess landslide—A case study at heifangtai terrace. J. Eng. Geol. 28 (1), 111–121. doi:10.13544/J.CNKI.JEG.2019-038
Rana, H., and Babu, G. L. S. (2022). Regional back analysis of landslide events using TRIGRS model and rainfall threshold: An approach to estimate landslide hazard for kodagu, India. Bull. Eng. Geol. Environ. 81, 160–216. doi:10.1007/s10064-022-02660-9
Reddy, B. S. N., and Pramada, S. K. (2022). A hybrid artificial intelligence and semi-distributed model for runoff prediction. Water Supply 22, 6181–6194. doi:10.2166/WS.2022.239
Roldán, F., Salazar, I., González, G., Roldán, W., and Toro, N. (2022). Flow-type landslides analysis in arid zones: Application in La chimba basin in antofagasta, atacama desert (Chile). Water 14, 2225. doi:10.3390/W14142225
Ruiz-Villanueva, V., Gamberini, C., Bladé, E., Stoffel, M., and Bertoldi, W. (2020). Numerical modeling of instream wood transport, deposition, and accumulation in braided morphologies under unsteady conditions: Sensitivity and high-resolution quantitative model validation. Water Resour. Res. 56, e2019WR026221. doi:10.1029/2019WR026221
Sahu, S. A. L. I. L., Pyasi, S. K., and Galkate, R. V. (2020). A review on the HEC-HMS rainfall–runoff simulation model. Int. J. Agric. Sci. Res. 10 (4), 183–190.
Thomas, J., Gupta, M., Srivastava, P. K., and Petropoulos, G. P. (2023). Assessment of a dynamic physically based slope stability model to evaluate timing and distribution of rainfall-induced shallow landslides. ISPRS Int. J. Geoinf 12, 105. doi:10.3390/IJGI12030105
Trujillo-Vela, M. G., Ramos-Cañón, A. M., Escobar-Vargas, J. A., and Galindo-Torres, S. A. (2022). An overview of debris-flow mathematical modelling. Earth Sci. Rev. 232, 104135. doi:10.1016/J.EARSCIREV.2022.104135
Tyagi, A., Kamal Tiwari, R., and James, N. (2022). A review on spatial, temporal and magnitude prediction of landslide hazard. J. Asian Earth Sci. X 7, 100099. doi:10.1016/J.JAESX.2022.100099
UNISDRCRED (2017). Economic losses, poverty and disasters 1998-2017. (Geneva, Switzerland: UNDRR). doi:10.13140/RG.2.2.35610.08643
Vega, J. A., and Hidalgo, C. A. (2021). “Methodology for landslides assessment causing river channel obstructions and the consequent water shortage in rural communities,” in ICL contribution to landslide disaster risk reduction (Manhattan, NY, USA: Springer, Cham). doi:10.1007/978-3-030-60227-7_32
Vega, J. A., and Hidalgo, C. A. (2016). Quantitative risk assessment of landslides triggered by earthquakes and rainfall based on direct costs of urban buildings. Geomorphology 273, 217–235. doi:10.1016/J.GEOMORPH.2016.07.032
Von Boetticher, A., Turowski, J. M., Mcardell, B. W., Rickenmann, D., Hürlimann, M., Scheidl, C., et al. (2017). DebrisInterMixing-2.3: A finite volume solver for three-dimensional debris-flow simulations with two calibration parameters-Part 2: Model validation with experiments. Geosci. Model Dev. 10, 3963–3978. doi:10.5194/gmd-10-3963-2017
Walczak, N., Walczak, Z., and Nieć, J. (2021). Influence of debris on water intake gratings in small hydroelectric plants: An experimental study on hydraulic parameters. Energies 14, 3248. doi:10.3390/EN14113248
WSL Institute for SnowAvalanche Research SLF (2022). RAMMS::DEBRISFLOW User Manual A numerical model for debris flows in research and practice User Manual v1.8.0 Debris Flow RAMMS rapid mass movement simulation Title picture: Debris Flow at Illgraben, Available at: https://ramms.slf.ch/ramms/downloads/RAMMS_DBF_Manual.pdf.
Zeng, P., Wang, S., Sun, X., Fan, X., Li, T., Wang, D., et al. (2022). Probabilistic hazard assessment of landslide-induced river damming. Eng. Geol. 304, 106678. doi:10.1016/J.ENGGEO.2022.106678
Zhang, J., Qiu, H., Tang, B., Yang, D., Liu, Y., Liu, Z., et al. (2022a). Accelerating effect of vegetation on the instability of rainfall-induced shallow landslides. Remote Sens. (Basel) 14, 5743. doi:10.3390/RS14225743
Zhang, X., Li, Lei, and Xu, C. (2022b). Large-scale landslide inventory and their mobility in lvliang city, shanxi province, China. Nat. Hazards Res. 2, 111–120. doi:10.1016/J.NHRES.2022.05.002
Zhang, Y., Xu, X., Li, Z., Yi, R., Xu, C., and Luo, W. (2022c). Modelling soil thickness using environmental attributes in karst watersheds. Catena (Amst) 212, 106053. doi:10.1016/J.CATENA.2022.106053
Zhou, W., Qiu, H., Wang, L., Pei, Y., Tang, B., Ma, S., et al. (2022). Combining rainfall-induced shallow landslides and subsequent debris flows for hazard chain prediction. Catena (Amst) 213, 106199. doi:10.1016/J.CATENA.2022.106199
Zhu, L., He, S., Qin, H., He, W., Zhang, H., Zhang, Y., et al. (2021). Analyzing the multi-hazard chain induced by a debris flow in Xiaojinchuan River, Sichuan, China. Eng. Geol. 293, 106280. doi:10.1016/J.ENGGEO.2021.106280
Keywords: landslide dam, debris flow, hazard chain, rainfall-induced landslide, RAMMS model, SLIDE model
Citation: Ortiz-Giraldo L, Botero BA and Vega J (2023) An integral assessment of landslide dams generated by the occurrence of rainfall-induced landslide and debris flow hazard chain. Front. Earth Sci. 11:1157881. doi: 10.3389/feart.2023.1157881
Received: 03 February 2023; Accepted: 24 May 2023;
Published: 01 June 2023.
Edited by:
Zefa Yang, Central South University, ChinaReviewed by:
Zizheng Guo, Hebei University of Technology, ChinaCopyright © 2023 Ortiz-Giraldo, Botero and Vega. This is an open-access article distributed under the terms of the Creative Commons Attribution License (CC BY). The use, distribution or reproduction in other forums is permitted, provided the original author(s) and the copyright owner(s) are credited and that the original publication in this journal is cited, in accordance with accepted academic practice. No use, distribution or reproduction is permitted which does not comply with these terms.
*Correspondence: Laura Ortiz-Giraldo, bG9ydGl6NzM2QHNveXVkZW1lZGVsbGluLmVkdS5jbw==
Disclaimer: All claims expressed in this article are solely those of the authors and do not necessarily represent those of their affiliated organizations, or those of the publisher, the editors and the reviewers. Any product that may be evaluated in this article or claim that may be made by its manufacturer is not guaranteed or endorsed by the publisher.
Research integrity at Frontiers
Learn more about the work of our research integrity team to safeguard the quality of each article we publish.