 Abinash Bal1
 Santanu Misra1*
 Manab Mukherjee1Tapas Kumar Dutta2Debasis Sen3
 Abhijit Patra2Elangovan Raja4
- 1Experimental Rock Deformation Laboratory, Department of Earth Sciences, Indian Institute of Technology Kanpur, Kanpur, Uttar Pradesh, India
- 2Department of Chemistry, Indian Institute of Science Education and Research, Bhopal, India
- 3Solid State Physics Division, Bhabha Atomic Research Centre, Mumbai, India
- 4Keshava Deva Malaviya Institute of Petroleum Exploration (KDMIPE), ONGC, Dehradun, India
Heterogeneous nanopore structure and distribution regulate the gas trapping, desorption kinetics, and diffusion in shale matrices. In shale, pores range from continuous micro- and mesopore size distributions, varying with organic (total organic matter-TOC) and inorganic constituents (clay content, Fe-bearing minerals, quartz, etc.). Previous research only showed a linear relationship of pore parameters with these intrinsic properties of shale, which limits our understanding of the concurrent influence of multiple intrinsic rock properties. As a result, in this work, we established multivariate dependency of nanopore structure, distribution, and complexity (from low-pressure N2 and CO2 sorption and small-angle scattering; SAXS/MSANS) in the previously little-studied Cambay shales and provided a better tool (partial least square regression) for analyzing the simultaneous effect of intrinsic shale properties on multiply connected pore-parameters. Furthermore, we discretized continuous pore-size distribution into individual pore families using deconvolution to understand the pore space better. Additionally, predicted shale formation environment in terms of deposition probability (P+) and dissolution probability (P−) using a dynamic model of the fractal interface by precipitation and dissolution. Our findings indicate that the Cambay shales have a high potential for future hydrocarbon exploration (S2: 2.42–12.04 mg HC/g rock), “very good” (2-4 wt.%) to “excellent” (>4 wt.%) TOC content, and thermally mature type II–III admixed and type III kerogen. Deconvolution of the micro- and mesopore size distributions reveals that pore width (w) ranges ∼15.30–35 nm occupies greater than 50% of the total pore volume, and its pore volume increases with the presence of quartz, Fe-bearing minerals, and clay content. However, pores with w∼ 3.60–15.30 nm increase exclusively with TOC. In the micro- and early mesopore region, pore volume decreases with TOC from w∼ 0.30–0.75 nm and increases with TOC from w∼ 0.75–3.60 nm. Furthermore, TOC in shale increases the specific surface area and pore volume (micro-, meso-, and total pores), enhancing both sorption and free gas storage capacities. Cambay shales were likely deposited in three distinct environments, with precipitation probability (P+) values of 1, 0.7–0.8, and 0.5, as revealed by a fractal dimension (Ds) analysis of multiple samples.
1 Introduction
Estimation of the stored gas, its extraction, and overall shale-gas reservoir characterization are essential for the successful planning and implementation of shale-gas exploration projects (Loucks et al., 2009; Ross and Bustin, 2009). In this direction, pore structure characterization (e.g., geometry, shape, distribution, and pore throat connectivity) is one of the fundamental tasks for estimating the oil and gas recovery potential in shale-gas reservoirs, which typically have low porosity and ultralow-permeability (Kuila, 2013). Additionally, pore size information is essential for gas (hydrogen, CO2) and nuclear waste storage operations, along with reservoir performance. The abundance of nanopores in shale stores a substantial volume of gas through adsorption, while interconnected pore conduits facilitate fluid transportation (Kuila, 2013; Holmes et al., 2019a). Furthermore, estimating pore size in shale is critical and can vary from millimeters to nanometers (Holmes et al., 2019a). Based on their diameters, the nanopores are generally subdivided into micro- (<2 nm), meso- (2–50 nm), and macropores (>50 nm) (Thommes et al., 2015). Therefore, developing a comprehensive shale reservoir nano porous structural framework necessitates quantitative research of pore sizes, shapes, and structures. The mineralogy, total organic carbon (TOC), and reservoir depth influence the pores (Kuila, 2013; Yang et al., 2016b) and must be integrated into the assessment.
Pore size characterization is performed using radiation- and/or fluid-based methods. Characterizations using electron microscopy (scanning and transmission), high-resolution X-ray CT scan, nuclear magnetic resonance (NMR), small-angle X-ray scattering (SAXS), and small-angle neutron scattering (SANS) fall under radiation-based methods (Talabi et al., 2009; Jin et al., 2011; Curtis et al., 2012; Gu et al., 2015). On the other hand, Mercury intrusion porosimetry (MIP), helium pycnometer, and low-pressure gas sorption (LPGS) are well-established fluid-based methods (Lu et al., 1995; Kuila, 2013; Saidian et al., 2016). Among all these, the LPGS (N2 and CO2) method is widely accepted and a reliable technique; because the gas can access a broad range of pore sizes ranging from 0.3 to 200 nm without affecting and/or altering the pores (Larsen et al., 2005; Bourg, 2015; Saidian et al., 2016). MIP covers a few nanometers to hundreds of micrometers but distorts the pores at high intrusion pressures. In general, fluid invasion techniques cannot access and characterize the isolated pores, which host a significant volume of hydrocarbons and can be recovered by enhanced recovery techniques. To overcome the limitations of fluid invasion techniques, small-angle scattering (SAS), viz. SAXS and SANS are suitable alternatives to characterize accessible and inaccessible pores (Liu et al., 2017; Chandra et al., 2020; Zhang et al., 2021).
A significant volume of pore characterization data is available from shale samples across the globe, employing all such techniques. Analyses and interpretations of these data triggered multiple schools of thought, particularly the influence and role of geological parameters (i.e., TOC, clay content, thermal maturity, depth of reservoir) in governing the pore network architecture (Kuila, 2013; Mastalerz et al., 2013; Gasparik et al., 2014a; Fan et al., 2014; Cao et al., 2015; Yang et al., 2016b; Saidian et al., 2016; Sun et al., 2016; Bakshi et al., 2017; Tripathy et al., 2018; Holmes et al., 2019a; Liu et al., 2019; Chandra et al., 2022). For example (Ross and Bustin, 2008), showed a positive correlation between pore capacity (total pore volume considering macro-, meso-, and micropores) and TOC. In contrast (Kuila, 2013), demonstrated that there is a statistically insignificant correlation between the pore capacity and TOC, clay content, and thermal maturity. Further (Gasparik et al., 2014a), showed that shale with high TOC does not correlate with pore capacity. In another line of studies (Mastalerz et al., 2013), found an increase in maturity modifies pore capacity and affects the proportion of micro-, meso-, and macropores. (Sun et al. (2016) found organic porosity is independent of organic matter maturity in Niutitang shale, China. However, kerogen and clay components in shale largely control the pore volume in meso- and micropores (Lu et al., 1995; Heller and Zoback, 2014; Wang et al., 2016). The composition and content of clay minerals govern the methane (CH4) adsorption in shale. The CH4 adsorption capacity in shale reduces in the following order of clay mineralogy: montmorillonite > kaolinite > illite > illite/smectite mixed-layer > chlorite (Fan et al., 2014).
The discussion above suggests that shale-gas reservoirs are extremely heterogeneous in their pore characteristics and compositions. Most of the studies reveal linear relationships between pore parameters and different intrinsic geological parameters and did not explore the complex relationships among them (Liu et al., 2019). We hypothesize that more than one geological parameter (individual minerals, TOC, maturity, depth, etc.) can simultaneously control the different pore attributes (pore volume, specific surface area- SSA, CO2 uptake capacity, pore structure complexity, etc.). Statistical tools, such as multivariate partial least square (PLS) regression, are suitable for measuring the dependency of the simultaneous effect of more than one geological property (independent variables) on different pore parameters (dependent variables). This technique is important because an individual intrinsic property showing a positive linear correlation with a pore parameter can also show a negative or positive correlation with the same pore parameter when the roles of other intrinsic parameters are considered simultaneously. Previous studies correlated with meso-, micro-, and macropore volume (Kuila, 2013; Bakshi et al., 2018; Holmes et al., 2019a) but did not discretize the continuous pore size distributions, which can relate the individual pore families having multimodal pore size distributions with the intrinsic geological parameters of shale.
We studied the shales from the important petroliferous Cambay basin; primarily to discretize the continuous pore size distribution into multiple pore families employing deconvolution and to investigate the simultaneous influence of multiple geological parameters (individual minerals, TOC, and depth) on a particular pore attribute (micro-, meso-, total pore volume, SSA, CO2 uptake capacity, surface roughness, and complexity) through multivariate partial least square (PLS) regression. The dependency measure of a continuous distributed of pore families with the mineralogy and TOC has also been provided together with the depositional environment for the pore surface roughness and complexity via a dynamic model of the surface fractal interface. We emphasize that our study is not restricted only to characterizing the pore-scale properties of one of the important petroliferous basins of India, but we address that the multiple intrinsic parameters simultaneously alter the pore-scale properties of a particular shale-gas reservoir.
2 Brief overview and geological setting of the Cambay basin
The Cambay basin is elongated (425 km long trending NNW-SSE), narrow (40 km in the north and around 100 km in the south), and intra-cratonic rift basin situated in the northwestern part of India (Figure 1A) (Padhy et al., 2016). Tectono-stratigraphically, the basin is divided into the South Cambay basin comprising two blocks: Narmada and Broach blocks, and the North Cambay basin containing three blocks: Tarapur, Ahmedabad-Mesna, and Sanchor-Patan blocks (Figure 1A). A series of ‘transfer faults trending ENE-WSW to NE-SW and ‘listric normal faults, striking N-S to NNW-SSE, passes through the basin. In the early Paleocene (early syn-rift), Olpad formation was deposited under a fluvial environment. Following subsidence and marine transgression in late Paleocene deposits, the Cambay shale is the principal source of facies (Jaiswal et al., 2018). Later in Eocene, the transgressive phase equivalent of the ‘Younger Cambay shale’ of the south Cambay basin deposited three hydrocarbon-bearing units known as Mandhali, Mesna, and Chhatral (members of Kadi formation) in the northern part of the Cambay basin (Figure 1B) (Padhy et al., 2016; Jaiswal et al., 2018).
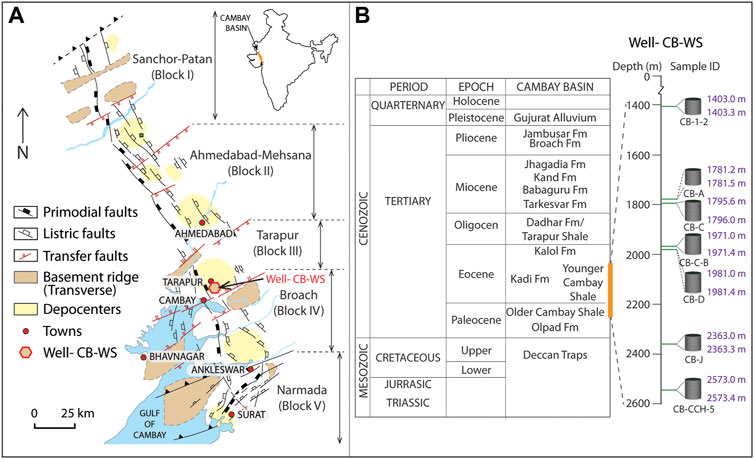
FIGURE 1. (A) The tectonic map of Cambay basin (reproduced with permission from Kundu et al., 1993; Indian petroleum publisher), The location of Well- CB-WS is highlighted by a hexagon. (B) Generalized stratigraphy of Cambay basin and schematic representation of shale core samples obtained from older Cambay shale and younger Camay shale formation of well-CB-WS. The vertical axes and the relative placement of the samples (cylindrical cores of 10 cm diameter) in both represent the depths at which samples are recovered. Sample names are mentioned at the bottom of each core, and the depth intervals are cited at the top and bottom of each core.
3 Sample preparation and methodology
3.1 Sample collection and preparation
Tertiary shale core samples (1,403–2,574 m depth) from the Well- CB-WS located in Cambay basin, India, were used in this study (Figure 1A). The cores represent older and younger Cambay shale formations of the late Palaeocene and early Eocene epochs, respectively (Figure 1B) (Padhy et al., 2016). Approximately 50 g of shale sampled was chipped from each core and then powdered using a rock pulverizer at 300 rpm for 25 min. The powdered specimens were then sieved below 90 µm for the following tests and analysis.
3.2 X-ray diffraction and rock-eval pyrolysis
We performed the X-ray diffraction (XRD) analysis to determine the mineralogy of shales samples using a PANalytical’s X'Pert Pro system, equipped with Cu anode (K-α1λ − 1.5406 Å and K-α2λ− 1.5444 Å) at 40 kV operating voltage following a continuous scan step of 0.0131°/s for 2θ from 3° to 60°. The mineral phases are identified and quantified by X'Pert HighScore Plus software and the Rietveld refinement technique, respectively. A Rock-Eval 6 instrument was used for the rock eval pyrolysis and TOC analysis of the samples. These parameters (S1, S2, S3, TOC, Tmax) together with hydrogen index (HI), oxygen index (OI), and production index (PI)) are evaluated following the method described in (Tissot and Welte, 1978). Vitrinite reflectance (%EVRo) of the samples is calculated using the following equation (Jarvie et al., 2001):
3.3 Low-pressure gas (N2 and CO2) sorption (LPGS)
Low-pressure N2 and CO2 sorptions are performed using a Quantachrome Autosorb iQ to characterize mesopores and micropores of the shale samples. Before the analysis, we degassed 0.5–2 g of samples at 250 °C for 720 min under vacuum (<10 µm Hg) until the achievement of out-gassing rate <0.005 Torr/min for at least 15 min. This process ensures the removal of adsorbed clay-bound and capillary water without altering the mineral and solid organic matter structures and sample texture. N2 sorption experiments were carried out at a constant liquid-nitrogen temperature (77.350 K). N2 pressure (P) was increased stepwise from predefined to saturation pressure (P0 ≤760 torrs) and then decreased stepwise to the same predefined pressure, generating the isotherm profile. The isotherm profile, corresponding to a specific specimen, represents the volume of N2 adsorbed or desorbed in cm3/g at STP with a relative pressure (P/P0) ranging from 0.0075 to 0.995. Similarly, CO2 adsorption was measured stepwise at 273K (in a temperature-controlled water bath) up to the saturation vapor pressure of CO2 (1 bar).
The shapes of the pores are deciphered by comparing the obtained linear isotherm with the IUPAC-defined standard profiles (Thommes et al., 2015). SSA is determined using multipoint BET (Brunauer et al., 1938). Here, P/P0 in the adsorption arm ranging from 0.05 to <0.3 are considered for specific surface area analysis, assuming monolayer adsorption was complete. Total specific pore volume
The average pore diameter (D) is determined considering the specific geometries of the pores. D of cylindrical, spherical, and slit-shaped pores are calculated using
For fractal characterization of accessible pores, the Frenkel-Halsey-Hill (FHH) adsorption isotherm model (Hill, 1952; Frenkelʹ, 1955) is employed (Sun et al., 2016; Liu et al., 2019):
where, A is the power-law exponent, which depends on the fractal dimension (Df) and adsorption mechanisms. C is a constant. Df is calculated from the slope (Sf) of the straight line in the lnV versus ln[ln(P0/P)] FHH plot using the following equation:
3.4 Small-angle scattering (SAS)
Small-angle scattering (SAS) technique has been used to characterize the total pores (accessible + inaccessible). A Cu-Kα source fitted X-ray scattering (SAXS) facility (scattering vector; q-range of 0.01–0.22 Å−1) and a double-crystal-based medium resolution MSANS (q range of ∼0.0003–0.017 Å−1) (Mazumder et al., 2001) are used for this purpose. The SAXS and MSANS profiles have been normalized at a common q range to form a single scattering profile under two-phase approximation. The polydisperse size-distribution model (PDSM) analyzed the PSD of shale in Irena macros of the IGOR Pro 8 software using the maximum entropy method, which assumes random-sized spherical pores (Ilavsky and Jemian, 2009; King et al., 2015). The model-equation is expressed as:
where,
where, DS is the surface fractal dimension of the total pore,
The plotting of SAS data in absolute scale involves certain errors as the accurate measurement of the exact thickness of the powdered samples sandwiched between Kapton tapes is difficult. Further, the two-phase approximation and the assumption of spherical shape of the pores in shale may not necessarily be correct for shale. In two-phase approximation, we take the SLD value calculated from the volume-weighted average of mineral phases and the SLD of the pore (zero). However, the SLDs are not similar (Sun et al., 2020), and the SLDs of organic matter can vary depending on the chemical compositions.
4 Results and analyses
4.1 Mineralogy and geochemical properties
Powder X-ray diffraction data revealed that Cambay shales are mainly composed of clay minerals (kaolinite, illite, and muscovite), Fe-bearing minerals (pyrite and siderite), and quartz (Table 1, Supplementary Figure S1). Quartz content varies from 12% (CB-D) to 48% (CB-J) and is absent in shallowest sample (CB-1–2). Amongst the Fe-bearing minerals, pyrite content ranges from 5% (CB-C-B) to 34% (CB-1–2) but is absent in samples CB-D and CB-J, which have siderite as Fe-bearing minerals. The primary clay mineral kaolinite is present in all the samples, ranging from 18% (CB-CCH-5) to 53% (CB-C). Illite is present only in CB-1–2 (29%), CB-A (21%), and CB-B (22%). Muscovite is exclusive for CB-CCH-5 (19%). Overall, the total clay content in the Cambay shale varies from a minimum of 26% in CB-J to a maximum of 70% in CB-B (Table 1). In the Jambusa-Broach Block of the Cambay shale (De et al., 2020), discovered a predominance of kaolinite and chlorite clay minerals deposited under marginal-marine to marine conditions. The formation of kaolinite was favored by acidic conditions and high leaching environments, indicating a tropical humid climate with intense chemical weathering and leaching processes. The presence of pyrite framboids suggests the occurrence of reducing conditions in the bottom water. In the north tectonic blocks of the Cambay basin, illite, kaolinite, smectite, and chlorite were identified as the dominant clay minerals, with illite being the most abundant (62%–65%). Compared to other minerals, such as quartz and feldspar, these blocks’ carbonate mineral content is relatively low (Sharma and Sircar, 2019). TOC contents, calculated via rock eval pyrolysis, range from 5.03 (CB-A) to 1.28 wt.% (CB-D) (Table 1). Tmax (

TABLE 1. Weight percentages of the constitutive minerals of the Cambay shales derived from XRD analysis, followed by Rietveld refinement technique. Rock eval pyrolysis and TOC content of the Cambay shales. S1: Free hydrocarbons present in rock (mg HC/g of rock); S2: Remaining generation potential (mg HC/g of rock); S3: Oxidizable Carbon (mg CO2/g rock); TOC: Total Organic Carbon (wt.%); Tmax: Temperature (°C) of maximum amount of pyrolyzate (S2) generation from the kerogen; HI: Hydrogen Index [(S2/TOC)×100 mg HC/g TOC]; OI: Oxygen Index [(S3/TOC) ×100 mg CO2/g TOC]; EVRo%: Estimated Vitrinite Reflectance [0.018×Tmax-7.16] and PI: Production Index [S1/(S1+S2)]. The "-" in the table indicate the absence of the phase(s) in the sample.
4.2 Micropore and mesopore attributes
4.2.1 Pore morphology (low-pressure N2 sorption analysis and micro imaging)
The N2 adsorption-desorption data of the seven samples are plotted in Figure 2, depicting the volume of gas adsorbed at STP vs. relative pressure (P/P0). All adsorption-desorption hysteresis loops are of type IV, suggesting the mesopores’ dominance in the samples. Most samples show type H3 loops (Figure 2), indicating the presence of significant plate-like particles in the samples, resulting in narrow slit-shaped pores (Thommes et al., 2015). The adsorption-desorption profiles in all the samples coincide at extremely low relative pressure, except in the specimen CB-CCH-5, which is due to the presence of wedge- and slit-shaped pores (Li et al., 2019). Slopes of the adsorption curves changed at different segments of P/P0, suggesting micropore filling at extremely low P/P0, followed by monolayer and multilayer adsorptions at relatively higher P/P0 (Figure 2). The knee-bend in the adsorption curves indicates the completion of monolayer adsorption at P/P0 ≈ 0.3 in most of the samples. At P/P0 ∼0.5, most samples show sudden closures of desorption to adsorption limbs, while CB-A and CB-C show gentler closures, and CB-D shows none. This phenomenon is attributed to the tensile strength effect in which the desorption curves coincide with the adsorption curves (Thommes et al., 2015). The sudden collapsing of the hemispheric meniscus at P/P0 ∼0.5 represents the presence of pores smaller than 4 nm (Cao et al., 2015). This can also be verified from the mesopore modal width of CB-A and CB-C, which is around 14 nm, and CB-D around 36 nm (Table 2). All other samples have mesopore modal widths <4 nm (Table 2).
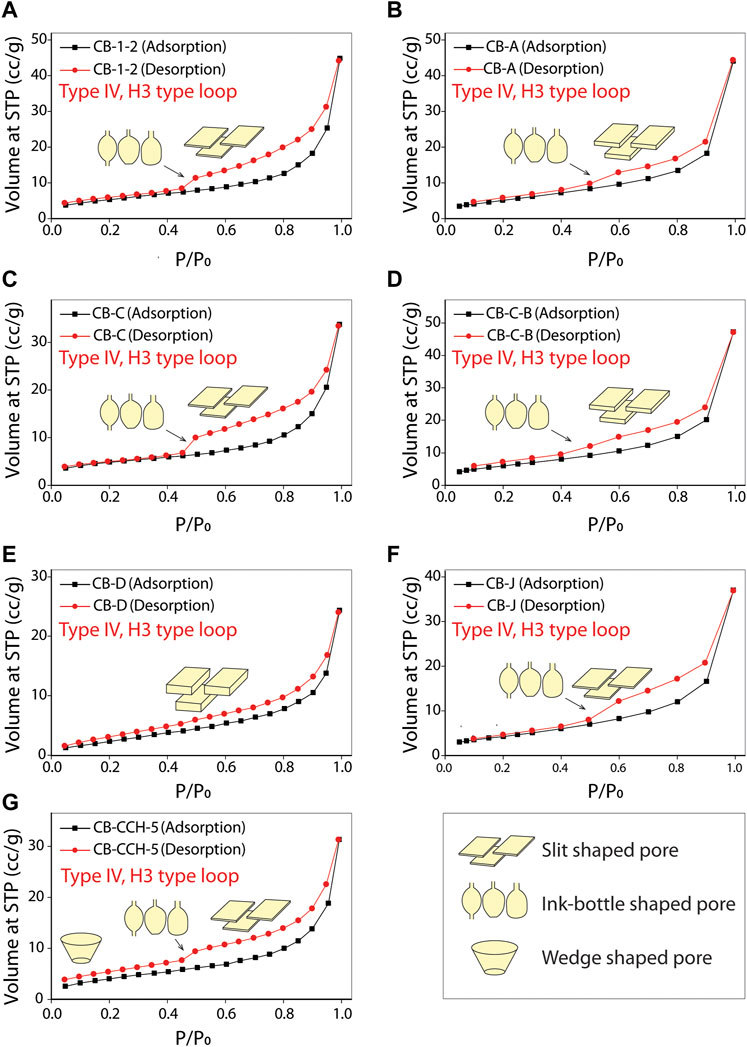
FIGURE 2. (A–G) Low-pressure N2 adsorption and desorption isotherms of the Cambay shales showing type IV pattern and H3 hysteresis loop according to IUPAC classification (Thommes et al., 2015).
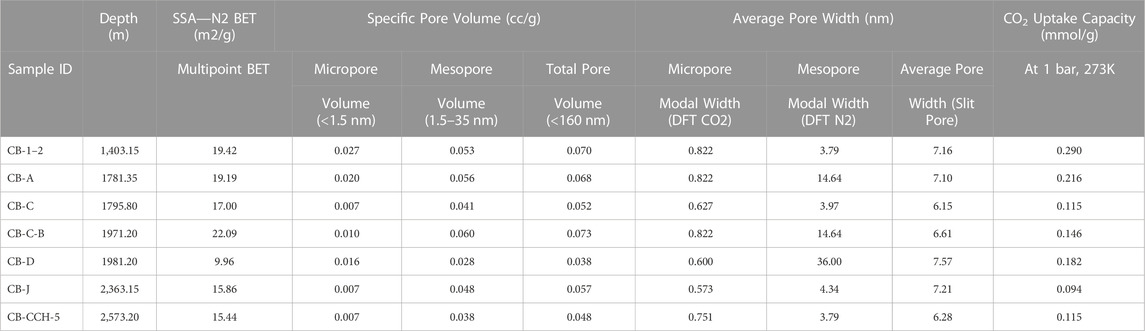
TABLE 2. Various pore parameters of the Cambay shales with depth. SSA was estimated using both multipoint BET. Micropore, mesopore, and total pore volume estimated using the NLDFT model CO2 at 273K, NLDFT equilibrium model-N2 at 77K, and converting the total N2 adsorbed volume of adsorbate at STP to equivalent liquid volume (
Micro-imaging (using FESEM: field emission scanning electron microscopy) also shows intragranular elongated and semi-circular slit-type pores are more prevalent in clay minerals (Figure 3A). Pyrites feature a few heterogeneous inter-crystalline pores, whereas intragranular phyllosilicates have complex, elongated, tapering pores (Figures 3B–D).
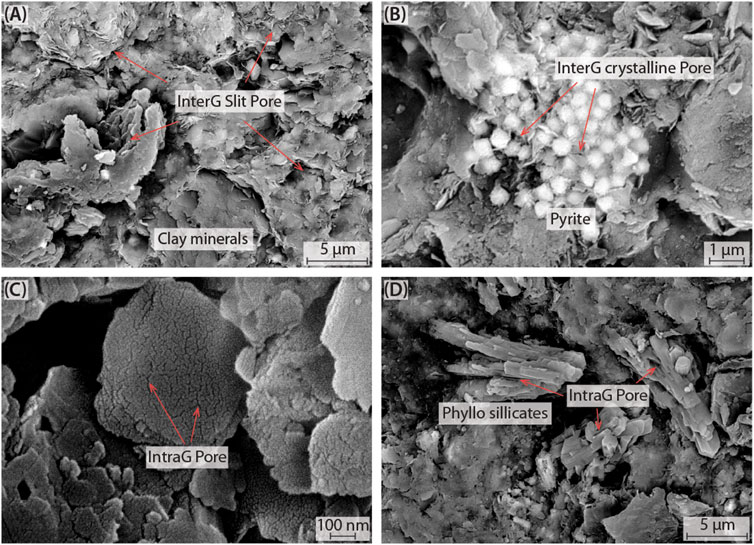
FIGURE 3. FE-SEM micrographs of Cambay shales illustrating the intricate pore structures within the intragranular (intraG) and intergranular (interG) matrices. (A) Displays narrow, elongated, and semi-circular slit pores situated between the clay minerals in the intergranular region. (B) Exhibits inter-crystalline pores observed in pyrite. (C, D) Reveal heterogeneous and non-uniform intragranular pores within the clay minerals.
4.2.2 Micropore analysis (low-pressure CO2 adsorption)
We used low-pressure CO2 adsorption data to characterize <2 nm pores. The slopes of all adsorption curves are relatively higher at the beginning of adsorption, and it gradually decreases with increasing P/P0, suggesting a higher initial adsorption rate, followed by a slower adsorption rate (Figure 4A). Analysis of the data reveals that micropore volume ranges from 0.007 cc/g (CB-J and CB-CCH-5) to 0.027 cc/g (CB-1–2), and Micropore modal width varies in a narrow range of 0.573–0.822 nm (Table 2).
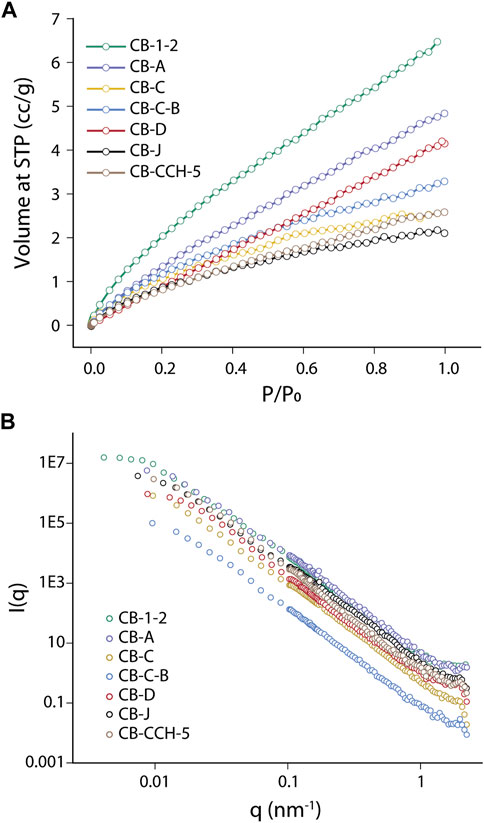
FIGURE 4. (A) CO2 adsorption isotherms of the Cambay shales depicting type I isotherm profile. (B) Overlapped SAXS (small angle X-ray scattering) and SANS (small angle neutron scattering) intensity profiles of I(q) (arbitrary unit) versus q (nm-1) for Cambay shales, providing valuable insights into the form- and structureal factor of the Cambay shales.
4.2.3 Mesopore analysis
4.2.3.1 Specific surface area, pore volume, and pore width
The data from the adsorption arm at 0.05≤ P/P0 <0.3 are considered for SSA calculation, assuming the completion of monolayer adsorption. In our samples, SSA varies from 22.09 m2/g (CB-C-B) to 9.960 m2/g (CB-D) (Supplementary Figure S2A, Table 2). However, sample heterogeneities (composition, adsorption affinity, pore structure complexity) make the SSA calculation erroneous within the 0.05≤ P/P0 <0.3. We, therefore, determined the P/P0 fitting ranges using the ‘Rouquerol transform plot’ (Rouquerol et al., 2007; Kuila, 2013) (Supplementary Figure S2B,C, Supplementary Table S1) and calculated the equivalent specific surface area (eSSA) using ‘modified BET plot’ summarized in Table 2. Most of the samples (CB-1-2, CB-C-B, CB-CCH-5) have 0.05–0.30 fitting ranges of P/P0, but the sample CB-A and CB-J have a fitting range of 0.05–0.40, and sample CB-D has 0.10–0.40 (Supplementary Figure S2B,C, Supplementary Table S1). The comparison between SSA and eSSA shows that the modified BET technique yields higher (0.39%–8.23%) SSA than the multipoint BET technique (Table 2, Supplementary Table S1). In our samples, the specific pore volume, total-, meso-, and micropore volume ranges between 0.038 and 0.070 cc/g, 0.028–0.060 cc/g, and 0.007–0.027 cc/g, respectively. Mesopore volume constitutes more than 60% of total pore volume (Table 2, Supplementary Figure S3). The linear isotherm data suggest that the pore geometry in all the samples is slit-shaped (Figure 2). We, therefore, determined the average pore width (wa) considering slit-shaped pore geometry (
4.2.3.2 Continuous PSD (NLDFT CO2 and NLDFT N2 model) and analysis
We used adsorption arms of N2 and CO2 isotherms for the PSD analysis, as desorption arms limit the accuracy of the results in the 4–5 nm pore size region due to the tensile strength effect (Thommes et al., 2015). NLDFT model for CO2 as adsorbate at 273 K has been used for estimating PSDs of micropores (<1.5 nm) and slit pores, whereas NLDFT equilibrium model-N2 at 77 K evaluated the PSD of mesopore (1.5–35 nm). The PSD is limited to 35 nm as the NLDFT kernel for slit-type pores is limited to 35 nm. The PSD curves of all samples exhibit multimodal characteristics with several volumetric maxima (Supplementary Figure S4A, Figure 5). For a better understanding and quantitative assessment of the different pore architectures, we have applied the deconvolution method (Ulm et al., 2007) to determine the mean size and standard deviation of each pore family from their corresponding continuous pore size distribution curve (Figure 5). The distinct peak from PSD indicates the distinct pore size family. Normal (Gaussian) distribution describes the events regardless of whatever probability distribution describes the individual experiments. Here, we assume the pores could be divided into j=1 to n pore size families with sufficient contrast in pore size distributions. The jth pore family occupies a volume fraction fj of the total porosity. The theoretical probability density function (PDF;
where
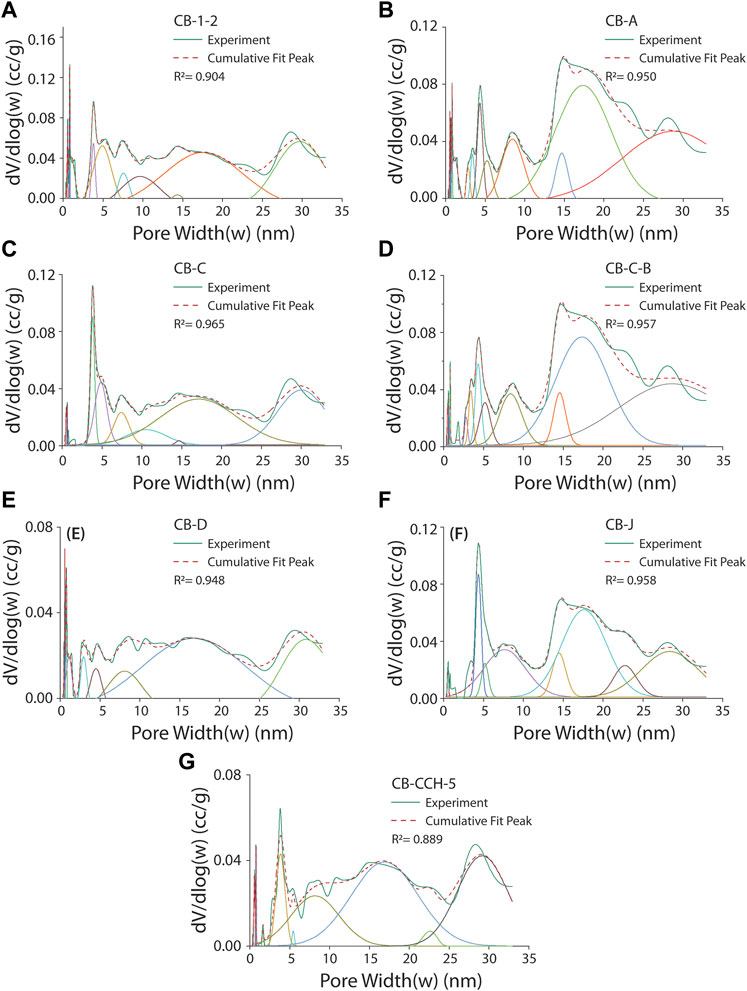
FIGURE 5. (A–G) Continuous pore size distribution analysis using deconvolution techniques in the Cambay shales. Different colour-normal curves represent the different pore families (see in Table 3 for details).
In Eq. 8,
The deconvoluted pore size results of all the samples are presented as normal distribution curves with different colors corresponding to a particular pore family (Figure 5). The red dashed line is the fitted line to the solid green color experimental results. The fitting coefficients of all the curves are >0.889, suggesting a good fit between experimental and modeled data. The results show 3 to 4 families in the micropore region and 6 to 9 families in the mesopore region. The modal width of the micropore and mesopore families are ∼0.53, 0.62, 0.80, 1.12 nm, and ∼3.5, 5.1, 8.0, 14.6, 17.5, and 29.0 nm, respectively (Table 3).
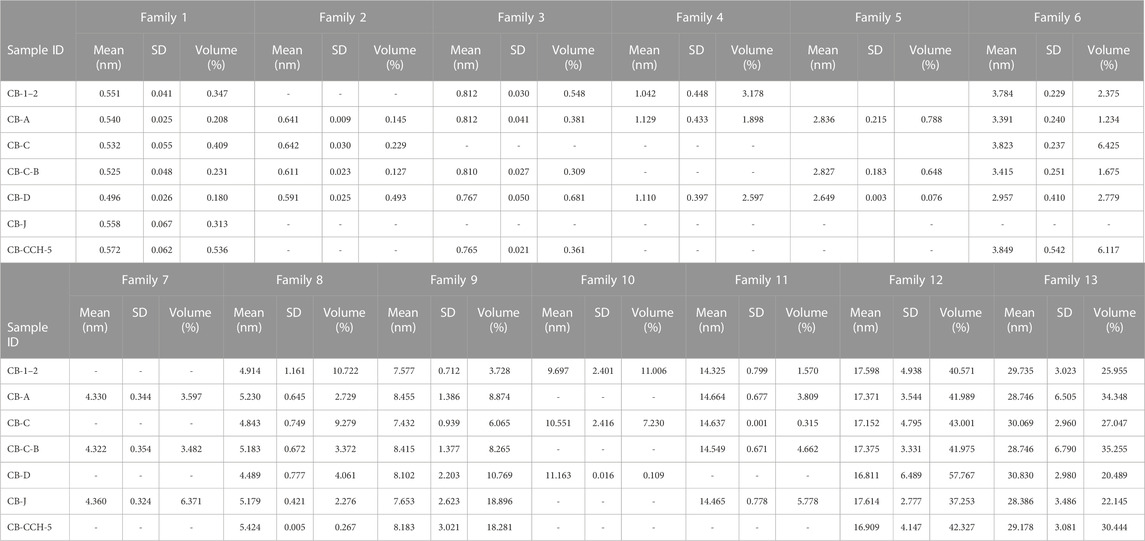
TABLE 3. Deconvolution results of continuous pore size distribution into different pore families with similar mean pore diameter (see Figure 5). SD: Standard deviation.
4.2.3.3 Fractal characterization (Dfhh model)
We have analyzed the linear isotherm data and prepared the FHH plots (Supplementary Figures S5A,B) to understand the fractal dimensions (Df) of the pores (Table 4). There are two distinct linear segments in the FHH plot of all samples; one at 0<P/P0 < 0.5 (Region 1) and the other one at 0.5 < P/P0 <1 (Region 2) (Supplementary Figures S5A,B). We can verify this transitional change of fractal characteristics using the closures of the hysteresis loops at P/P0 ≈ 0.5 for all isotherm curves (Supplementary Figure S5A). Two fractal dimensions, Df1 and Df2, from the two linear segments of regions 1 and 2 (Supplementary Figure S5B) are calculated using Eq. 4 (Table 4). Df1 are relatively low due to greater negative slopes, varying from 2.06 (CB-D) to 2.60 (CB-C). Df2 are higher because of lower negative slope and lie within a narrow range of 2.63 (CB-CCH-5) to 2.67 (CB-C-B and CB-J) (Table 4).
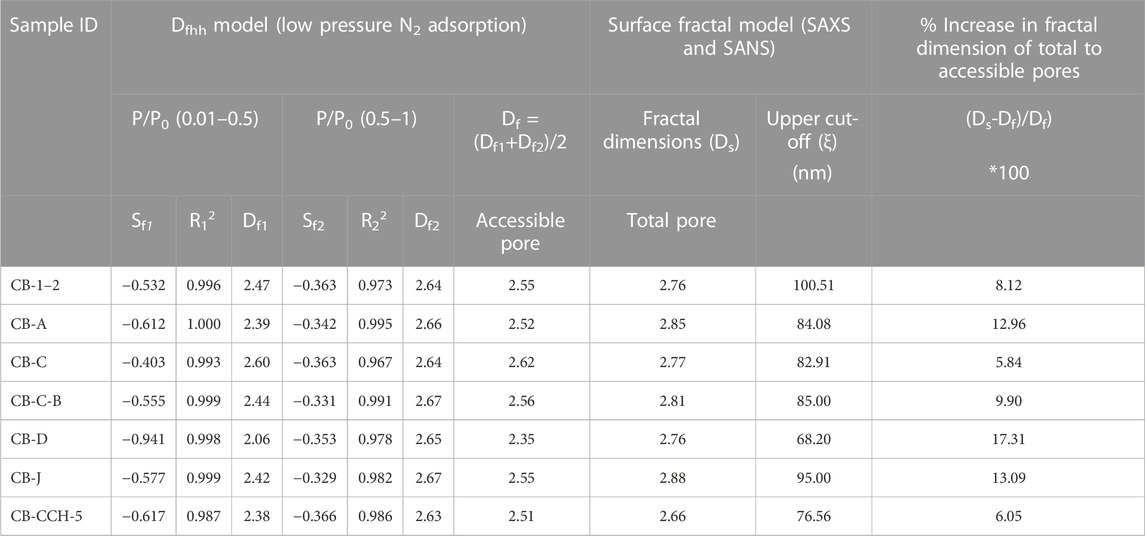
TABLE 4. Fractal fitting parameters and fractal dimensions calculated using the Frenkel-Halsey-Hill (FHH) adsorption isotherm model (Supplementary Figure S5B), Here Sf1, R12, and Df1 represent the slope of the straight line, coefficient of determination, and fractal dimension, respectively, in the lnV vs ln[ln(P0/P)] FHH plot for the relative pressure range (P/P0) of 0.01–0.50, and Sf2, R22, and Df2 represent the slope of the straight line, coefficient of determination, and fractal dimension respectively, in the lnV versus ln[ln(P0/P)] FHH plot for the relative pressure range (P/P0) of 0.50–1.00 (Supplementary Figure S5A). Surface fractal dimension (DS) and upper cut-off limit (ξ) of fitting, using the surface fractal fitting model in I(q) vs q intensity profile. (Supplementary Figure S5C).
4.3 Small-angle scattering (SAS)
The SAS profiles of seven samples show similar slopes but have different intensity profiles (Figure 4B). We have used the polydisperse size distribution model (PDSM) (Ilavsky and Jemian, 2009) (see Eq. 5) to fit the scattering profiles to obtain the pore size distributions (Supplementary Figure S4B). The average SLD of each sample was determined by taking the SLD of individual minerals (Sun et al., 2020) and their corresponding volume fractions. The pore size distribution plot shows that the pore diameters range from 9 to 80 nm and are bimodal to multimodally distributed. The modal diameter of each sample varies from 10 to 20 nm (Supplementary Figure S4B).
Surface fractal dimensions (Ds) of the total pores (accessible and inaccessible pores) vary from 2.66 (CB-CCH-5) to 2.88 (CB-J) (Table 4, Supplementary Figure S5B). The upper cut-off (ξ) of fitting ranges from 68.20 nm (CB-D) to 100.51 nm (CB-1–2). The data further demonstrate that the Ds is greater than Df for the accessible by 5.84%–13.09% (Table 4).
5 Discussion
5.1 Source rock characterization
The hydrocarbon generation potential of source rock depends on the amount, type, and maturity of the inherent organic matter (Crick et al., 1988). Our results, particularly the rock eval pyrolysis and TOC analysis (Table 1), show that the Cambay shales have good remaining hydrocarbon generation potential (S2: 2.42 -12.04 mg HC/g rock) and very good (2-4 wt.%) to excellent (>4 wt.%) TOC content. The HIs of the studied samples vary from 165.33 to 239.36 mg HC/g rock and indicate type II–III admixed and type III organic matter (Figures 6A,B) (Peters and Cassa, 1994). Tmax > 435 °C indicates that all samples contain mature kerogens (Figure 6A). The estimated vitrinite reflectance (0.67 < EVRo < 1.05%) suggests that the samples are in the thermally mature zone where liquid hydrocarbons are the dominant product and capable of generating oil and thermogenic gas upon thermal cracking (Gentzis, 2013). HI vs TOC plot (Figure 6C) also shows that kerogen lies in a fair to good oil source.
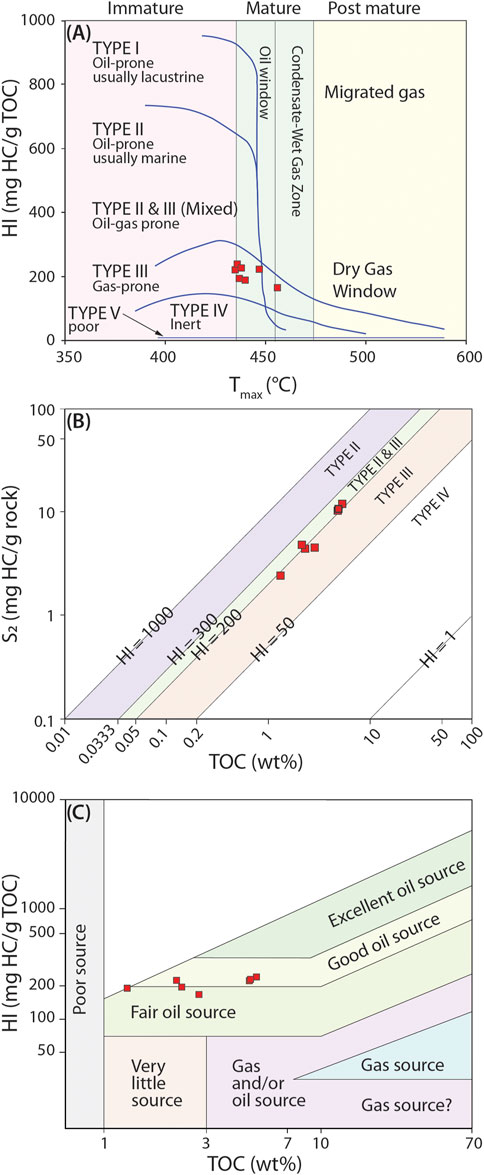
FIGURE 6. Source rock characterization using rock eval pyrolysis data. (A) HI vs Tmax plot (Espitalié et al., 1987) indicating the kerogen type and thermal maturity of the Camby shales. (B) Relation between hydrocarbons release under S2 curve and TOC (Langford and Blanc-Valleron, 1990) of the Cambay shales indicating kerogen type (C) HI vs TOC plot (Jackson et al., 1980) of the Cambay shales showing nature of the source rock.
5.2 Dependency measure of pore parameters
5.2.1 Multivariate PLS regression
We have applied multivariate PLS regression to find the dependency measure between independent and dependent variables in shale samples. We considered micro-, meso-, total pore volume, SSA, CO2 uptake capacity, Df1, Df2, and Ds as dependent variables, whereas the mineral composition and TOC as selected to be independent variables. The PLS regression predicts the relationships between a set of dependent variables [Y] from a set of independent variables [X] when the number of dependent and independent variables is different (Geladi and Kowalski, 1986; Haenlein and Kaplan, 2004). This technique generalizes and combines features from principal component analysis and multiple regression model, defined as
where
5.2.1.1 Dependency measure of pore parameters with mineral composition and TOC
The PLS fitting results between independent and dependent variables show the TOC has a positive dependency measure with micro-, meso- and total pore volumes (Figure 7A, Supplementary Table S2). Quartz, Fe-bearing minerals, and clay have positive dependency measures with micropore volume, while negative dependency measures with mesopore and total pore volume (Figure 7A, Supplementary Table S2). Similar to the mesopore and total pore volume, the SSA, Df2, and Ds have a positive dependency measure with TOC and negative with quartz, Fe-bearing, and clay minerals (Figures 7B,C). CO2 uptake capacity shows a positive dependency measure, while Df1 has a negative dependency measure with all the independent variables (Figure 7C). In summary, TOC in Cambay shale strongly enhances the storage capacity by increasing SSA and pore volumes (micro-, meso-, total pore volume), eventually enabling higher sorption and free gas storage capacity. An increase in TOC also enhances pore structure complexity and roughness. CO2 storage capacity shows a positive dependency measure with all the independent variables (Figure 7B). The Cambay shale, therefore, is a good site for CO2 sequestration.
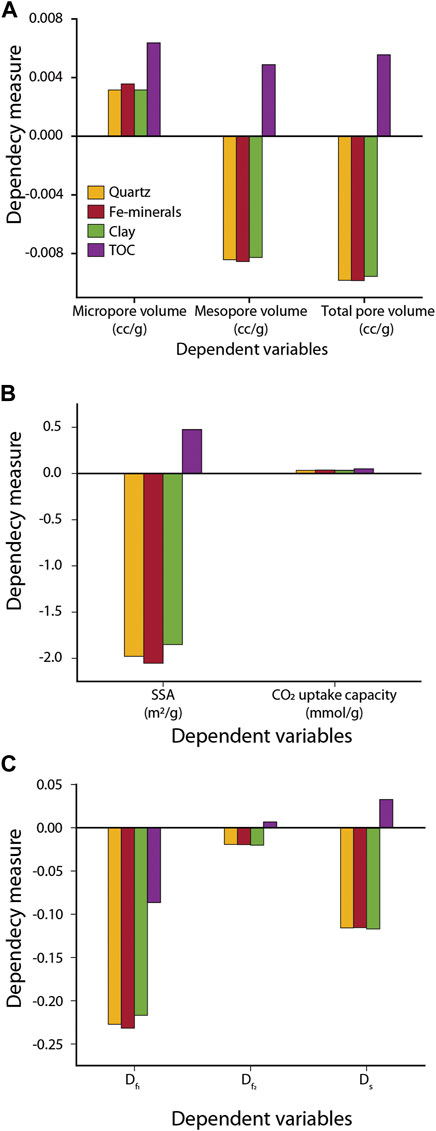
FIGURE 7. Dependency measure of independent variables (clay, Fe-bearing minerals, quartz, and TOC) with (A) micro-, meso-, total pore volume, (B) SSA, CO2 uptake capacity at 273K and 1bar, (C) fractal dimensions (Df1, Df2, Ds) obtained using multivariate PLS. The colour keys in (B) and (C) is same as (A).
5.2.1.2 Dependency measure of pore families with mineral composition and TOC
Deconvolution of the continuous pore size distribution by CO2 NLDFT at 273K and slit pore, N2 NLDFT at 77K model divides the pores into 13 pore families (Figure 5; Table 3). Families 1 to 4 belong to the micropore region, while families 5 to 13 belong to the mesopore region (Figures 8A-D; Table 3). We also checked the dependency measure of these pore families with the mineral composition and TOC (Figures 8C,D, Supplementary Table S3). In this analysis, the mineral composition and TOC are taken as independent variables, and the volume percent of each pore family as dependent variables (Supplementary Table S3).
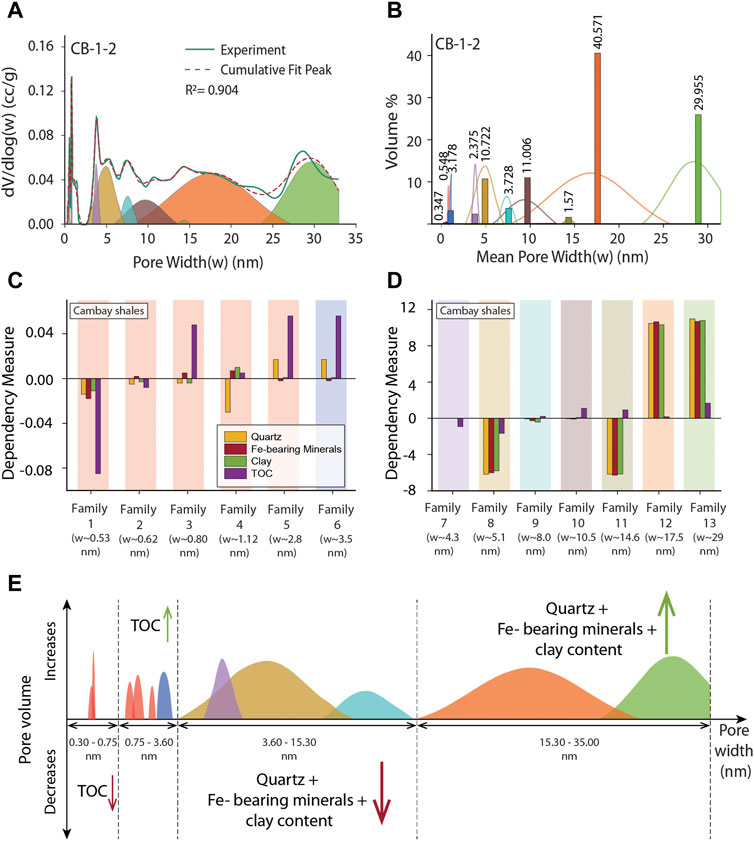
FIGURE 8. (A) Deconvolution of continuous micro- and mesopore size distributions into discretized individual Gaussian normal distribution (shown by different colors) pore families. (B) Volume percentage and mode of each pore families. (C, D) Multivariate dependency measure of each pore families with multiple intrinsic rock parameter (Quartz, Fe-bearing minerals, clay, and TOC) using PLS regression. (E) Schematic representation of the distribution of micropore and mesopore sizes within four larger pore families with comparable dependence measurements on intrinsic rock parameters. [Same color key has been used for pore families A to E].
Mesopore constitutes 95% of the total pore volume fraction, of which families 12 and 13 occupy more than 50% (Figures 8A,B and Supplementary Table S3). Family 12 and 13 show a strong positive dependency on quartz, Fe-bearing minerals, and clay (Figures 8C,D, and Supplementary Table S3). This indicates a higher concentration of quartz, Fe-bearing minerals (pyrite, siderite), and clay tends to increase the volume fraction of relatively larger pores (w ∼17.5 nm and 29 nm). While family 9, 10, and 11 show only positive dependency measures with TOC and negative dependency measures with other independent variables (Figures 8C,D and Supplementary Table S3). In the micropore region (families 1–4), families 3 and 4 constitute significant volume fractions (∼40–90% of micropore volume). They display a positive dependency measure with TOC and Fe-bearing minerals and a negative dependency measure with quartz and clay.
The micropore and early mesopore regions (up to a pore width of 3.60 nm) are primarily governed by TOC (Yang et al., 2016b). In contrast, the mesopore region (3.6–35.0 nm) is regulated by minerals such as Quartz, Fe-bearing minerals, and clay content (Figure 8E). The volume fraction of mesopore increases with hard minerals, including quartz, pyrite, feldspar, and dolomite. These minerals play a significant role in determining the size distribution and abundance of meso- and macropores (Liu et al., 2017).
5.2.2 Relationship between pore parameters and depth
Variation of pore parameters (SSA, micropore volume, mesopore volume, total pore volume, avg. pore width, mesopore modal pore width, and micropore modal pore width), clay content, TOC, EVRo, production index (PI), and CO2 uptake capacity with depth is illustrated in Figure 9. EVRo and PI show an increasing trend, while CO2 uptake capacity and micropore volume decrease with depth (Figure 9). An increase in pressure and temperature with depth increases the vitrinite reflectance value (VRo) of kerogen; therefore, it increases the production index (PI). The pore parameters such as SSA, mesopore volume, total pore volume, average pore width, mesopore modal pore width, and micropore modal width do not show any overall trend with depth (Figure 9).
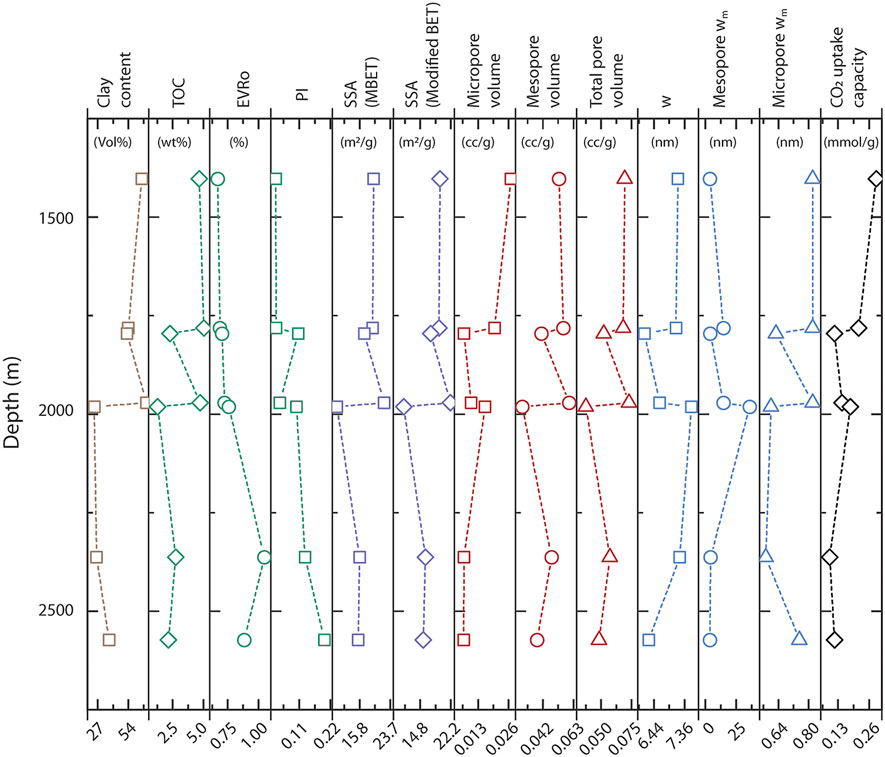
FIGURE 9. Variation of clay content, TOC, equivalent vitrinite reflectance (EVRo), production index (PI), CO2 uptake capacity, and different pore parameters [SSA by both multipoint BET (MBET) and modified BET technique, micro-, meso-, total pore volume, average pore width (wa), mesopore modal width (mesopore wm), micropore modal width (micropore wm)] with depth of the Cambay shales.
The porosity of shale decays exponentially with depth due to compaction (Magara, 1980). With the increase in depth, the diameter of macropores (>50 nm) formed in the intergranular space reduces due to overburden stress. In contrast, the modification of meso-and micropores that primarily occupy the intragranular space or the surface of the organic and inorganic matter of shale is negligible. Overall, the mesopores hardly altered with depth. We, therefore, conclude that depth has no or less significant role in controlling the mesopore architecture of the Cambay shales.
5.3 Fractal characterization
We have analyzed our adsorption and scattering data in the light of fractal theory. Fractal dimensions of a self-similar object vary between 2 and 3 for smooth- and rough surfaces, respectively (Pfeifer and Avnir, 1984). At relatively low P/P0, monolayer adsorption occurs on the surface by the Van der Waals force of attraction between the adsorbate and adsorbents, which characterizes the pore surface fractal dimension (Df1). At relatively high P/P0, multilayer adsorption followed by capillary condensation portrays the pore structure fractal dimension (Df2). Df1 and Df2 provide the roughness and structural complexity of the pore, respectively (Xiong et al., 2015), and have a significant role in the storage, desorption, and diffusion of gas in the shale matrix. The following subsections present the fractal characteristics of the accessible and inaccessible pores in the Cambay shale.
5.3.1 Fractal characterization of the total pore (accessible and inaccessible pore)
Fractal dimension of total pores Ds increases from 5.84% (CB-C) to 17.31% (CB-D) compared to the average surface fractal value (Df) of the accessible pore (Table 4). The lower surface roughness of accessible pores might be due to the smoothening of surface contact by fluids in the physisorption process or the fluid present in the source rock.
5.3.2 Dynamic model of the fractal interface by precipitation and dissolution
Dynamic processes like dissolution, precipitation, and diagenetic condition control the alteration of the pore surface fractal dimension in sedimentary rock-like shales (Aharonov and Rothman, 1996; Sen et al., 2002). Fractal dimension increases with an increase in diagenetic alteration. The alteration in fractal space is governed by reaction-limited growth and transport-limited growth (Aharonov and Rothman, 1996). In sedimentary rocks, ‘reaction-limited kinetics’ governs the growth (Nagy and Lasaga, 1992). The fractal dimension of a self-affine pore interface is related to the height (h(x)) evolved over the lateral extent of the surface interface (S). A statistical parameter can define the interface width (W), as
here,
Here, exponent
We have generated 100×100 lattice space using simple discrete particle models of interfaces, roughening by deposition and dissolution variation (Figures 10A–F) (Aharonov and Rothman, 1996). Steps fill the original square lattice in a checkerboard manner, i.e., every filled site is a step of height 1 and surrounded by nearest holes by height 0. At every iteration of the deposition phenomenon, a block of height 2 is assigned to fill up randomly at local minima, and for the dissolution phenomenon, the subtraction of a block of height 2 is randomly chosen from the local maxima. At each iteration, a deposition event occurs with a probability of
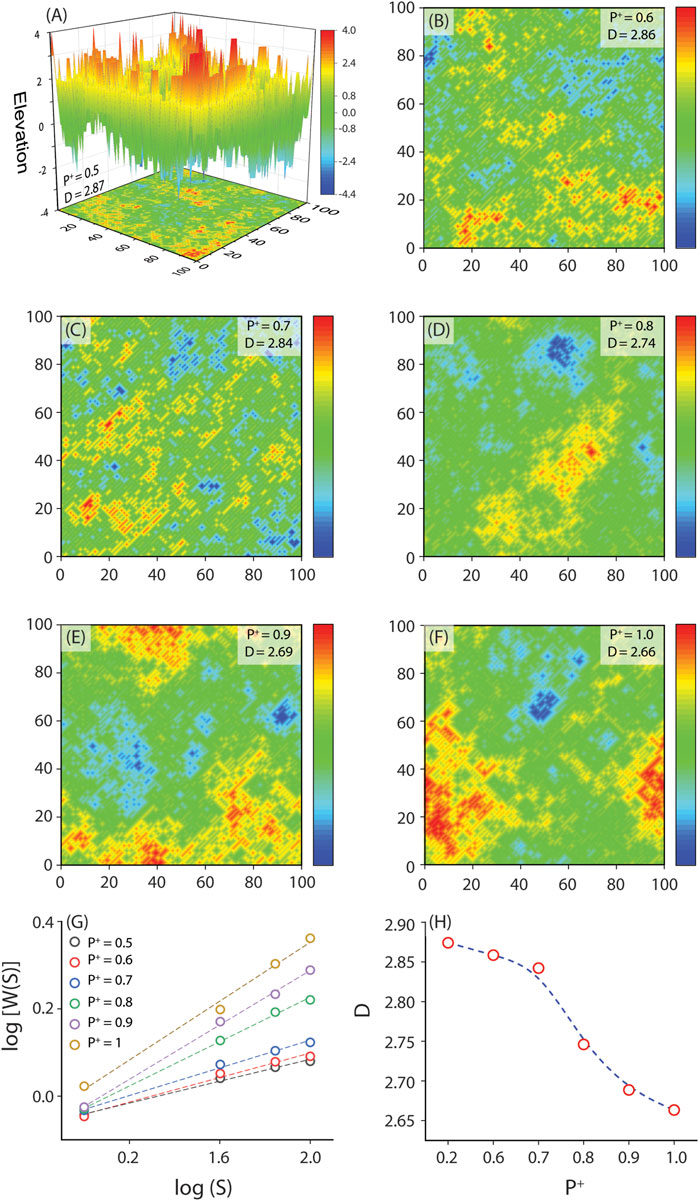
FIGURE 10. Variation of pore surface interface with the deposition and dissolution growth. (A–F) Computed simulation of 100×100 lattice fractal surface at different deposition probabilities and their corresponding fractal dimension. The blue indicates the lowest height, whereas the red indicates the maximum height. (G) Variation of interface width W(S) with system size (S) for different deposition probabilities P+. Dashed lines are the fitting lines for different deposition probabilities. (H) Variation of surface fractal dimension of pore interface with P+.
Interfaces obtained for different deposition probability and their corresponding fractal dimension are shown in Figures 10G,H. The data reveal that deposition and dissolution probabilities greatly control the pore surface roughness. As the deposition probability increases, the surface becomes smoother (Figure 10H), while increasing dissolution probability yields pores with rough surfaces. Ds of Cambay shale has three modal clusters: 2.66 (CB-CCH-5), ∼2.78 (CB-1-2, CB-C, CB-C-B, and CB-D), and ∼2.87 (CB-A and CB-J) (Table 4), suggesting variable deposition and dissolution environments in Cambay shales. The deposition environment was prevalent when the deepest sample (CB-CCH-5, Ds = 2.66) was forged
5.4 Implications of this study
The present study and previous research in a similar direction firmly establish that intrinsic shale properties significantly control the pore parameters of shales. We compared the dependency of pore parameters on different inherent rock properties of global shales and our data obtained from the Cambay shale (Table 5) (Kuila, 2013; Gasparik et al., 2014a; Fan et al., 2014; Rexer et al., 2014; Taotao et al., 2015; Saidian et al., 2016; Bakshi et al., 2017; Holmes et al., 2019a; Liu et al., 2019). Similar to Silurian, Green River, Eagle Ford, Baltic, Barnet, Bakke, Damodar, Assam, Wuffeng, Lomngmaxi shale, etc., SSA and total pore volume vs TOC and clay content in the Cambay shale show a positive linear correlation (Supplementary Figure S6) (Yang et al., 2016a; Saidian et al., 2016; Bakshi et al., 2017; Holmes et al., 2019a) Interestingly, this result contradicts what we have analyzed using statistical multivariate PLS regression (Figures 7A,B; Section 5.2.1.1), and we attribute this difference of outcomes occur due to the dissimilar nature of the two analytical models. The advantage of multivariate partial least square regression (PLS) over normal linear correlation is its ability to handle the simultaneous influence of multiple variables on the outcome. Unlike linear correlation, PLS captures complex relationships and interdependencies among variables, making it suitable for analyzing intricate systems. PLS can handle collinearity issues, reduce dimensionality by identifying key variables, and effectively handle noisy data and outliers. By considering these advantages, multivariate PLS offers a more comprehensive understanding of the data, enabling researchers to extract meaningful insights and improve the accuracy of their analyses (Geladi and Kowalski, 1986; Haenlein and Kaplan, 2004).
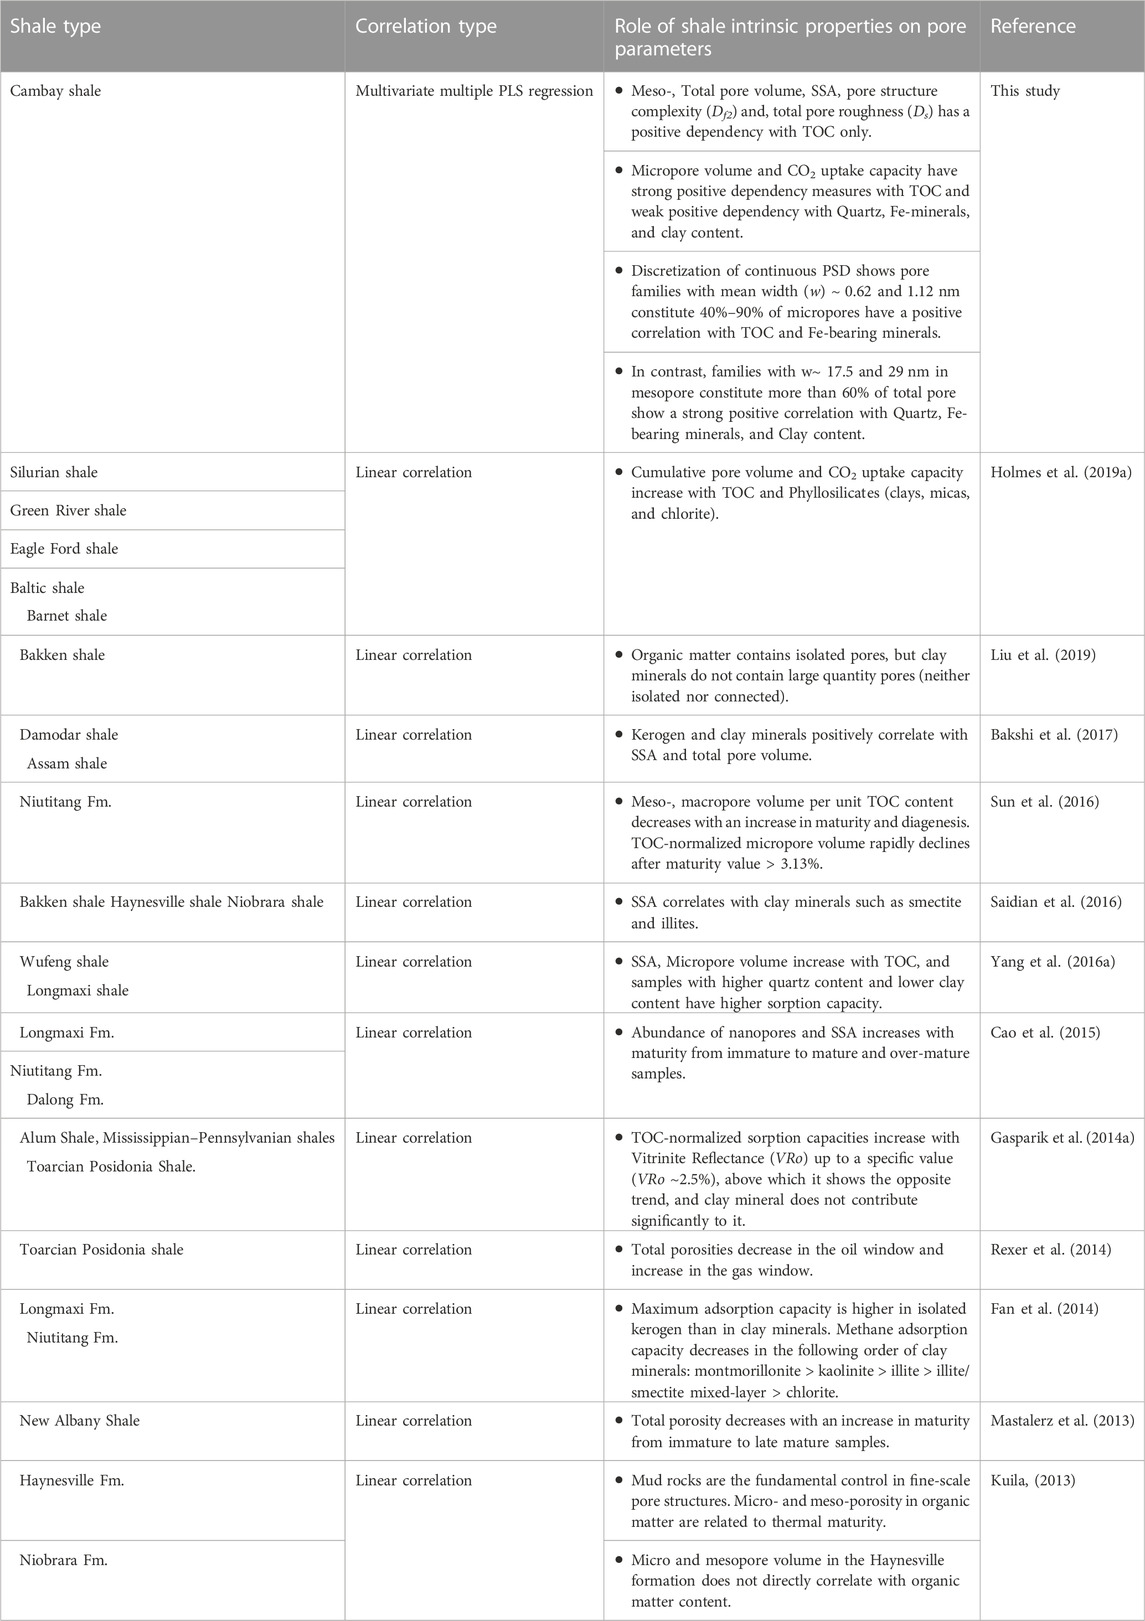
TABLE 5. Comparison of different studies evaluating the role of shale intrinsic properties (geological properties) on pore parameters in global shale reservoirs.
Our experimental data and analysis show that an independent variable can show positive or negative dependency measures for multiple dependent variables. For example, multivariate PLS analysis demonstrated that TOC positively correlates with the micro-, meso-, and total pore volumes (Figures 7A,B). The same analysis also revealed a negative correlation between the inorganic mineral contents and micro-, meso-, and total pore volume. Interestingly, the deconvolution of the continuous PSD yielded a dissimilar dependency measure relationship for the different pore families. Families 3 and 4 (w∼ 0.62 and 1.12 nm), which constitute 40%–90% of micropores, have a positive correlation with TOC and Fe-bearing minerals. Families 12 and 13 (w∼ 17.5 and 29 nm) constitute more than 60% of total pores in the mesopore domain, showing a strong positive correlation with the inorganic mineral contents (Figures 8A–E).
We demonstrate that the discretization of multimodal continuous PSD provides information on each pore size cluster; the geological control governing the pore architecture is not similar across the entire pore size spectrum. Therefore, studying the role of geological parameters in controlling the pore parameters of each pore cluster will help us predict the storage and diffusion of hydrocarbons in ultralow permeable nano-porous rocks like shale more accurately. Additionally, the dynamic model of fractal interface infers the depositional environment of shale with respect to deposition probability
6 Conclusion
We have studied shale specimens from the Cambay Basin, a potential shale-gas reservoir in India. Detailed characterization and analysis of the integrated nanopore (accessible and inaccessible) structure, distribution, and complexity of the Cambay shale are performed using both low-pressure fluid- and radiation-based analytical techniques. We have performed statistical analyses (multivariate PLS, deconvolution, and fractal) to comprehend better the volumetric distribution of storage capacity, dependency measures between intrinsic and extrinsic parameters, and control of the depositional environment in pore architecture.
Cambay shales have good remaining hydrocarbon generation potential (S2: 2.42 -12.04 mg HC/g rock) and significant TOC content (2-5 wt%). The reservoir rock has type II–III admixed and type III thermally mature kerogen (Tmax > 435 °C). Vitrinite reflectance and production index (PI) increase with depth, while CO2 uptake capacity and micropore volume show decreasing trends with depth. In general, most pore parameters analyzed in our study have no or negligible relationships with the depth. We attribute this to the fact that mesopores and micropores are primarily formed in the intragranular space or the surface of the organic and inorganic matter of shale, which hardly alters with depth.
Our multivariate PLS results suggest that higher TOC in Cambay shale strongly enhances the overall storage capacity (sorption and free gas) by increasing SSA and pore volume (micro-, meso-, total pore volume). Additionally, the TOC augments the complexity and roughness of the pore structure. In the deconvoluted discretized pore families, we, however, find a different influence of geological parameters on pore architecture. By deconvolution of the pore size distribution, pores are grouped into 13 families. Families 1–4 (w < 1.12 nm) are found in the micropore zone, whereas families 5–13 (2.8 < w < 29 nm) are found in the mesopore zone. Pores within the mesopore families with w∼17.5 nm and 29 nm constitute > 50% of the pore volume. In this mesopore faction, the pore volume increases with the increasing inorganic mineral contents but decreases with increasing TOC proportion. Interestingly, within the micropore family, w∼0.80 and 1.12 nm show a positive dependency measure with TOC and Fe-bearing minerals but a negative dependency measure with quartz and clay content. The present results are based on multivariate PLS analysis between geological parameters and pore parameters. We emphasize that this dataset and analysis are unique as most of the global shale-gas reservoirs were characterized previously by using linear correlation.
Pore surface roughness and complexity of accessible pores are less (6%–17%) than the total pores (accessible and inaccessible pores). The fractal dimension of total pores show trimodal clustering at ∼2.66, 2.78, and 2.87, suggesting that the Cambay shales were formed in three dissimilar environments: one being strongly depositional, the other being moderately depositional, and the final a mixture of deposition and dissolution. Based on the pore character (roughness), individual pore family modal apertures, SSA, total pore volume, and kerogen type, we conclude that Cambay shale-gas reservoir has a high free gas storage and recovery potential.
Data availability statement
The original contributions presented in the study are included in the article/Supplementary Material, further inquiries can be directed to the corresponding author.
Author contributions
Conceptualization: AB, SM, Methodology: AB, SM, and MM, Investigation, Data curation: AB, TD, DS, and AP, Formal analysis, Software: AB, Writing- Original draft: AB, SM, Review & Editing: AB, SM, MM, TD, DS, and AP. Supervision: SM, Resources: AB, SM, and ER. All authors contributed to the article and approved the submitted version.
Funding
This work was supported by Pan IIT-ONGC research grant awarded to SM by Keshava Deva Malaviya Institute of Petroleum Exploration (KDMIPE), ONGC, Dehradun.
Acknowledgments
We express our sincere appreciation and gratitude for the valuable suggestions provided by the reviewers and the editorial guidance received from Prof. Xinmin Ge. The ACMS at IIT Kanpur supported the XRD and low-pressure N2 adsorption tests. Low-pressure CO2 adsorption tests were performed at IISER, Bhopal. SAS measurements were conducted at BARC, India. AB acknowledges a senior doctoral research fellowship and infrastructural facilities from IIT Kanpur. TD thanks IISER Bhopal for a doctoral fellowship
Conflict of interest
Author ER was employed by ONGC, India.
The remaining authors declare that the research was conducted in the absence of any commercial or financial relationships that could be construed as a potential conflict of interest.
Publisher’s note
All claims expressed in this article are solely those of the authors and do not necessarily represent those of their affiliated organizations, or those of the publisher, the editors and the reviewers. Any product that may be evaluated in this article, or claim that may be made by its manufacturer, is not guaranteed or endorsed by the publisher.
Supplementary material
The supplementary material for this article can be found online at: https://www.frontiersin.org/articles/10.3389/feart.2023.1157122/full#supplementary-material
References
Aharonov, E., and Rothman, D. H. (1996). Growth of correlated pore-scale structures in sedimentary rocks: A dynamical model. J. Geophys Res. 101, 2973–2987. doi:10.1029/95jb03209
Bakshi, T., Prusty, B. K., Pathak, K., Nayak, B. R., Mani, D., and Pal, S. K. (2017). Source rock characteristics and pore characterization of Indian shale. J. Nat. Gas. Sci. Eng. 45, 761–770. doi:10.1016/j.jngse.2017.06.010
Bakshi, T., Prusty, B. K., Pathak, K., and Pal, S. K. (2018). Pore characteristics of Damodar valley shale and their effect on gas storage potential. J. Pet. Sci. Eng. 162, 725–735. doi:10.1016/j.petrol.2017.10.091
Bourg, I. C. (2015). Sealing shales versus brittle shales: A sharp threshold in the material properties and energy Technology uses of fine-grained sedimentary rocks. Environ. Sci. Technol. Lett. 2, 255–259. doi:10.1021/acs.estlett.5b00233
Brunauer, S., Emmett, P. H., and Teller, E. (1938). Adsorption of gases in multimolecular layers. J. Am. Chem. Soc. 60, 309–319. doi:10.1021/ja01269a023
Cao, T. T., Song, Z. G., Wang, S. B., and Xia, J. (2015). A comparative study of the specific surface area and pore structure of different shales and their kerogens. Sci. China Earth Sci. 58, 510–522. doi:10.1007/s11430-014-5021-2
Chandra, D., Vishal, V., Bahadur, J., Agrawal, A. K., Das, A., Hazra, B., et al. (2022). Nano-scale physicochemical attributes and their impact on pore heterogeneity in shale. Fuel 314, 123070. doi:10.1016/j.fuel.2021.123070
Chandra, D., Vishal, V., Bahadur, J., and Sen, D. (2020). A novel approach to identify accessible and inaccessible pores in gas shales using combined low-pressure sorption and SAXS/SANS analysis. Int. J. Coal Geol. 228, 103556. doi:10.1016/j.coal.2020.103556
Crick, I. H., Boreham, C. J., Cook, A. C., and Powell, T. G. (1988). Petroleum geology and geochemistry of middle proterozoic McArthur basin, northern Australia II: Assessment of source rock potential. Am. Assoc. Pet. Geol. Bull. 72, 1495–1514. doi:10.1306/703C99D8-1707-11D7-8645000102C1865D
Curtis, M. E., Sondergeld, C. H., Ambrose, R. J., and Rai, C. S. (2012). Microstructural investigation of gas shales in two and three dimensions using nanometer-scale resolution imaging. Am. Assoc. Pet. Geol. Bull. 96, 665–677. doi:10.1306/08151110188
De, S., Aastha, E., and Sengupta, D. (2020). Depositional environment and geomechanical properties of Cambay shale: Potential reservoir for shale oil and gas in India. Arabian J. Geosciences 13, 455. doi:10.1007/s12517-020-05462-z/
Espitalié, J., Marquis, F., and Sage, L. (1987). “Organic geochemistry of the paris basin,” in Conference on petroleum geology of North West Europe, USA, 29 October 1986 (IEEE), 71–86.
Fan, E., Tang, S., Zhang, C., Guo, Q., and Sun, C. (2014). Methane sorption capacity of organics and clays in high-over matured shale-gas systems. Energy Explor. Exploitation 32, 927–942. doi:10.1260/0144-5987.32.6.927
Gasparik, M., Bertier, P., Gensterblum, Y., Ghanizadeh, A., Krooss, B. M., and Littke, R. (2014a). Geological controls on the methane storage capacity in organic-rich shales. Int. J. Coal Geol. 123, 34–51. doi:10.1016/j.coal.2013.06.010
Geladi, P., and Kowalski, B. R. (1986). Partial least-squares regression: A tutorial. Anal. Chim. Acta 186, 1–17. doi:10.1016/0003-2670(86)80028-9
Gentzis, T. (2013). A review of the thermal maturity and hydrocarbon potential of the Mancos and Lewis shales in parts of New Mexico, USA. Int. J. Coal Geol. 113, 64–75. doi:10.1016/J.COAL.2012.09.006
Gu, X., Cole, D. R., Rother, G., Mildner, D. F. R., and Brantley, S. L. (2015). Pores in marcellus shale: A neutron scattering and FIB-sem study. Energy Fuels 29, 1295–1308. doi:10.1021/acs.energyfuels.5b00033
Haenlein, M., and Kaplan, A. M. (2004). A beginner’s guide to partial least squares analysis. Underst. Stat. 3, 283–297. doi:10.1207/s15328031us0304_4
Heller, R., and Zoback, M. (2014). Adsorption of methane and carbon dioxide on gas shale and pure mineral samples. J. Unconv. Oil Gas Resour. 8, 14–24. doi:10.1016/j.juogr.2014.06.001
Hill, T. L. (1952). Theory of physical adsorption. Adv. Catal. 4, 211–258. doi:10.1016/S0360-0564(08)60615-X
Holmes, R., Aljamaan, H., Vishal, V., Wilcox, J., and Kovscek, A. R. (2019a). Idealized shale sorption isotherm measurements to determine pore capacity, pore size distribution, and surface area. Energy Fuels 33, 665–676. doi:10.1021/acs.energyfuels.8b02726
Ilavsky, J., and Jemian, P. R. (2009). Irena: Tool suite for modeling and analysis of small-angle scattering. J. Appl. Crystallogr. 42, 347–353. doi:10.1107/S0021889809002222
Jackson, K. S., Hawkins, P. J., and Bennett, A. J. R. (1980). Regional facies and geochemical evaluation of the southern Denison trough, Queensland. APPEA J. 20, 143–158. doi:10.1071/AJ79013
Jaiswal, S., Bhattacharya, B., and Chakrabarty, S. (2018). High resolution sequence stratigraphy of middle eocene hazad member, jambusar-broach block, Cambay Basin, India. Mar. Pet. Geol. 93, 79–94. doi:10.1016/j.marpetgeo.2018.03.001
Jarvie, D. M., Claxton, B. L., Henk, F., and Breyer, J. T. (2001). “Oil and shale gas from the barnett shale,” in AAPG annual meeting program (Texas: Worth Basin).
Jin, L., Rother, G., Cole, D. R., Mildner, D. F. R., Duffy, C. J., and Brantley, S. L. (2011). Characterization of deep weathering and nanoporosity development in shale - a neutron study. Am. Mineralogist 96, 498–512. doi:10.2138/am.2011.3598
King, H. E., Eberle, A. P. R., Walters, C. C., Kliewer, C. E., Ertas, D., and Huynh, C. (2015). Pore architecture and connectivity in gas shale. Energy Fuels 29, 1375–1390. doi:10.1021/ef502402e
Kuila, U. (2013). Measurement and interpretation of porosity and pore-size distribution in mudrocks: The whole story of Shale. [PhD thesis]. Colorado School of Mines. Available at: https://hdl.handle.net/11124/78999.
Langford, F. F., and Blanc-Valleron, M.-M. (1990). Interpreting Rock-Eval pyrolysis data using graphs of pyrolizable hydrocarbons vs. total organic carbon. Am. Assoc. Petroleum Geol. Bull. 74 (6), 799–804. doi:10.1306/0C9B238F-1710-11D7-8645000102C1865D
Larsen, J. W., Islas-Flores, C., Aida, M. T., Opaprakasit, P., and Painter, P. (2005). Kerogen chemistry 2. Low-temperature anhydride formation in kerogens. Energy Fuels 19, 145–151. doi:10.1021/ef0498519
Li, Y., Wang, Z., Pan, Z., Niu, X., Yu, Y., and Meng, S. (2019). Pore structure and its fractal dimensions of transitional shale: A cross-section from east margin of the ordos basin, China. Fuel 241, 417–431. doi:10.1016/j.fuel.2018.12.066
Liu, K., Ostadhassan, M., Sun, L., Zou, J., Yuan, Y., Gentzis, T., et al. (2019). A comprehensive pore structure study of the Bakken Shale with SANS, N2 adsorption and mercury intrusion. Fuel 245, 274–285. doi:10.1016/j.fuel.2019.01.174
Liu, K., Ostadhassan, M., Zhou, J., Gentzis, T., and Rezaee, R. (2017). Nanoscale pore structure characterization of the Bakken shale in the USA. Fuel 209, 567–578. doi:10.1016/j.fuel.2017.08.034
Loucks, R. G., Reed, R. M., Ruppel, S. C., and Jarvie, D. M. (2009). Morphology, genesis, and distribution of nanometer-scale pores in siliceous mudstones of the mississippian barnett shale. J. Sediment. Res. 79, 848–861. doi:10.2110/jsr.2009.092
Lu, X. C., Li, F. C., and Watson, A. T. (1995). Adsorption measurements in Devonian shales. Fuel 74, 599–603. doi:10.1016/0016-2361(95)98364-K
Magara, K. (1980). Comparison of porosity-depth relationships of shale and sandstone. J. Petroleum Geol. 3, 175–185. doi:10.1111/j.1747-5457.1980.tb00981.x
Mastalerz, M., Schimmelmann, A., Drobniak, A., and Chen, Y. (2013). Porosity of Devonian and Mississippian New Albany Shale across a maturation gradient: Insights from organic petrology’, gas adsorption, and mercury intrusion. Am. Assoc. Pet. Geol. Bull. 97, 1621–1643. doi:10.1306/04011312194
Mazumder, S., Sen, D., Saravanan, T., and Vijayaraghavan, P. R. (2001). A medium resolution double crystal based small-angle neutron scattering instrument at Trombay. Curr. Sci. 81 (3), 257–262.
Nagy, K. L., and Lasaga, A. C. (1992). Dissolution and precipitation kinetics of gibbsite at 80°C and pH 3: The dependence on solution saturation state. Geochim. Cosmochim. Acta 56, 3093–3111. doi:10.1016/0016-7037(92)90291-P
Padhy, P. K., Kumar, A., Chandra, Y. R., Das, S. K., Jha, S. K., and Advani, D. R. (2016). Shale oil exploration from paleocene-early eocene sequence in Cambay Rift Basin, India. Proc. Indian Natl. Sci. Acad. 82, 945–963. doi:10.16943/ptinsa/2016/48495
Pandey, J., and Dave, A. (1998). Stratigraphy of Indian petroliferous basins, XVI. Indian Colloquium on Micropaleontology and stratigraphy. Goa: National Institute of Oceanography.
Peters, K. E., and Cassa, M. R. (1994). Applied source rock geochemistry,” in The petroleum system—from source to trap. Editors L. B. Magoon, and W. G. Dow doi:10.1306/M60585C
Pfeifer, P., and Avnir, D. (1984). Erratum: Chemistry in noninteger dimensions between two and three. I. Fractal theory of heterogeneous surfaces [J. Chem. Phys. 79, 3558 (1983)]. J. Chem. Phys. 80 (3558), 4573. doi:10.1063/1.447307
Radlinski, A. P., Mastalerz, M., Hinde, A. L., Hainbuchner, M., Rauch, H., Baron, M., et al. (2004). Application of SAXS and SANS in evaluation of porosity, pore size distribution and surface area of coal. Int. J. Coal Geol. 59, 245–271. doi:10.1016/j.coal.2004.03.002
Rexer, T. F., Mathia, E. J., Aplin, A. C., and Thomas, K. M. (2014). High-pressure methane adsorption and characterization of pores in posidonia shales and isolated kerogens. Energy Fuels 28, 2886–2901. doi:10.1021/ef402466m
Ross, D. J. K., and Bustin, R. M. (2008). Characterizing the shale gas resource potential of Devonian-Mississippian strata in the Western Canada sedimentary basin: Application of an integrated formation evaluation. Am. Assoc. Pet. Geol. Bull. 92, 87–125. doi:10.1306/09040707048
Ross, D. J. K., and Bustin, R. M. (2009). The importance of shale composition and pore structure upon gas storage potential of shale gas reservoirs. Mar. Pet. Geol. 26, 916–927. doi:10.1016/j.marpetgeo.2008.06.004
Rouquerol, J., Llewellyn, P., and Rouquerol, F. (2007). Is the BET equation applicable to microporous adsorbents? Stud. Surf. Sci. Catal. 160, 49–56. doi:10.1016/s0167-2991(07)80008-5
Saidian, M., Godinez, L. J., and Prasad, M. (2016). Effect of clay and organic matter on nitrogen adsorption specific surface area and cation exchange capacity in shales (mudrocks). J. Nat. Gas. Sci. Eng. 33, 1095–1106. doi:10.1016/j.jngse.2016.05.064
Sen, D., Mazumder, S., and Tarafdar, S. (2002). Pore morphology and pore surface roughening in rocks: A small-angle neutron scattering investigation. J. Mater Sci. 37, 941–947. doi:10.1023/A:1014391629262
Sharma, V., and Sircar, A. (2019). Mineralogical assemblage of Cambay shale of North Cambay basin, Gujarat, India. Gujarat, India 9, 87–95. doi:10.1007/s13202-018-0505-9
Sun, M., Yu, B., Hu, Q., Chen, S., Xia, W., and Ye, R. (2016). Nanoscale pore characteristics of the lower cambrian Niutitang formation shale: A case study from well yuke #1 in the southeast of chongqing, China. Int. J. Coal Geol. 154 (155), 16–29. doi:10.1016/j.coal.2015.11.015
Sun, M., Zhao, J., Pan, Z., Hu, Q., Yu, B., Tan, Y., et al. (2020). Pore characterization of shales: A review of small angle scattering technique. J. Nat. Gas. Sci. Eng. 78, 103294. doi:10.1016/J.JNGSE.2020.103294
Talabi, O., AlSayari, S., Iglauer, S., and Blunt, M. J. (2009). Pore-scale simulation of NMR response. J. Pet. Sci. Eng. 67, 168–178. doi:10.1016/j.petrol.2009.05.013
Taotao, C., Zhiguang, S., Wang, S., and Jia, X. (2015). A comparative study of the specific surface area and pore structure of different shales and their kerogens. Sci. China Earth Sci. 58, 510–522. doi:10.1007/s11430-014-5021-2
Thommes, M., Kaneko, K., Neimark, A. V., Olivier, J. P., Rodriguez-Reinoso, F., Rouquerol, J., et al. (2015). Physisorption of gases, with special reference to the evaluation of surface area and pore size distribution (IUPAC Technical Report). Pure Appl. Chem. 87, 1051–1069. doi:10.1515/pac-2014-1117
Tissot, B. P., du Petrole, E. N. S., and Welte, D. H. (1978). Petroleum Formation and occurrence: A new approach to oil and gas exploration. Book Ger. 1, 6. doi:10.1007/978-3-642-96446-6
Tripathy, A., Srinivasan, V., and Singh, T. N. (2018). A comparative study on the pore size distribution of different Indian shale gas reservoirs for gas production and potential CO2 sequestration. Energy Fuels 32 (3), 3322–3334. doi:10.1021/acs.energyfuels.7b04137
Ulm, F. J., Vandamme, M., Bobko, C., Alberto Ortega, J., Tai, K., and Ortiz, C. (2007). Statistical indentation techniques for hydrated nanocomposites: Concrete, bone, and shale. J. Am. Ceram. Soc. 90, 2677–2692. doi:10.1111/j.1551-2916.2007.02012.x
Wang, Y., Zhu, Y., Liu, S., and Zhang, R. (2016). Pore characterization and its impact on methane adsorption capacity for organic-rich marine shales. Fuel 181, 227–237. doi:10.1016/j.fuel.2016.04.082
Xiong, J., Liu, X., and Liang, L. (2015). An investigation of fractal characteristics of marine shales in the southern China from nitrogen adsorption data. J. Chem. 2015, 1, 12. doi:10.1155/2015/303164
Yang, R., He, S., Hu, Q., Hu, D., Zhang, S., and Yi, J. (2016a). Pore characterization and methane sorption capacity of over-mature organic-rich Wufeng and Longmaxi shales in the southeast Sichuan Basin, China. Mar. Pet. Geol. 77, 247–261. doi:10.1016/j.marpetgeo.2016.06.001
Yang, R., He, S., Yi, J., and Hu, Q. (2016b). Nano-scale pore structure and fractal dimension of organic-rich Wufeng-Longmaxi shale from Jiaoshiba area, Sichuan Basin: Investigations using FE-SEM, gas adsorption and helium pycnometry. Mar. Pet. Geol. 70, 27–45. doi:10.1016/j.marpetgeo.2015.11.019
Keywords: nanopore discretization, shale gas, multivariate dependence measure, dynamic model of fractal interface, petroliferous Cambay shale, low-pressure gas (N2 and CO2) sorption, small angle scattering
Citation: Bal A, Misra S, Mukherjee M, Dutta TK, Sen D, Patra A and Raja E (2023) Concurrent influence of geological parameters on the integrated nano-pore structure and discretized pore families of the petroliferous Cambay shale assessed through multivariate dependence measure. Front. Earth Sci. 11:1157122. doi: 10.3389/feart.2023.1157122
Received: 02 February 2023; Accepted: 29 June 2023;
Published: 20 July 2023.
Edited by:
Xinmin Ge, China University of Petroleum (East China), ChinaReviewed by:
Pratik Kumar Das, Indian Institute of Engineering Science and Technology, Shibpur, IndiaVikram Vishal, Indian Institute of Technology Bombay, India
Kripamoy Sarkar, Indian Institute of Technology Dhanbad, India
Copyright © 2023 Bal, Misra, Mukherjee, Dutta, Sen, Patra and Raja. This is an open-access article distributed under the terms of the Creative Commons Attribution License (CC BY). The use, distribution or reproduction in other forums is permitted, provided the original author(s) and the copyright owner(s) are credited and that the original publication in this journal is cited, in accordance with accepted academic practice. No use, distribution or reproduction is permitted which does not comply with these terms.
*Correspondence: Santanu Misra, c21pc3JhQGlpdGsuYWMuaW4=