
95% of researchers rate our articles as excellent or good
Learn more about the work of our research integrity team to safeguard the quality of each article we publish.
Find out more
ORIGINAL RESEARCH article
Front. Earth Sci. , 06 September 2023
Sec. Biogeoscience
Volume 11 - 2023 | https://doi.org/10.3389/feart.2023.1155482
This article is part of the Research Topic Biogeochemical Changes Across the Mesozoic–Paleogene Climate Extremes View all 7 articles
 Mihaela Melinte-Dobrinescu1,2*
 Gabriel Ion1
 Eliza Anton1Vlad Apotrosoaei1,2Andrei Briceag1Constantin Lazăr1,2
This study aims to investigate a marlstone and claystone succession located at the southern end of the Eastern Carpathians, a region where oceanic anoxic event 2 (OAE2) has not been pointed out so far. Toward the upper half of this succession, a 17-cm-thick black shale was identified. The investigated depositional interval lies within the late Cenomanian–early Turonian, encompassing the UC3d up to UC7 nannofossil zones. The δ13C values fluctuated between 2.06‰ and 3.89‰, showing a positive isotope excursion that was assigned to OAE2. The δ13C isotope curve displays the following intervals: pre-excursion, first build-up, trough, second build-up, plateau, and post-excursion. Within the second build-up interval of OAE2, a substantial shift in CaCO3 values, accompanied by high concentrations of total organic carbon and a significant decline in the abundance and diversity of calcareous nannofossil assemblages, was observed. The nannofossil turnover related to OAE2 climax revealed predominance of Watznaueria barnesiae and temporary disappearance from the record of surface-water higher fertility taxa, such as Biscutum constans, Zeugrhabdotus erectus, and Discorhabdus ignotus. Above OAE2, peaks of Eprolithus floralis, followed by increased abundance of Eiffellithus turriseiffelii and Nannoconus spp., were identified. In the lower part of the studied succession (i.e., the upper Cenomanian UC3d nannofossil subzone), during the pre-excursion characterized by low δ13C values and less negative δ18O values, a small group of nannofossils more related to mid- and high-paleolatitudes, such as Crucibiscutum salebrosum, Repagulum parvidentatum, and Seribiscutum primitivum, is present, always showing a low abundance.
The recent sea-level rise (Dangendorf et al., 2017), which occurs in response to increasing levels of atmospheric greenhouse gases associated with global warming, is a remarkably concerning issue in modern times. Such sudden changes in climate events have been reported in the Earth’s history at several intervals, such as the Quaternary glacial–interglacial episodes and older, in the Cretaceous, where such changes were accompanied by high sea-level fluctuations (Haq, 2014).
The mid-Cretaceous, described as “Cretaceous Greenhouse,” is one of the intervals of a high sea level associated with a very warm and humid climate (Arthur et al., 1985; Miller et al., 2005; Sames et al., 2016). It is linked to superplume occurrence and high rates of ocean crust formation (Larson, 1991). Reflecting these events, most of the globally recognized oceanic anoxic events (OAEs) occur within the Aptian–Turonian interval (Jenkyns, 2010). These OAEs are believed to occur in an interval of an extreme high volcanism and to be associated with methane hydrate decomposition (Hesselbo et al., 2000).
A prominent OAE that occurred during the mid-Cretaceous is OAE2, also known as the Cenomanian–Turonian boundary event (Schlanger and Jenkyns, 1976; Jenkyns et al., 1994; Jenkyns, 2010), which has shown a rapid global positive excursion spanning from the late Cenomanian to the earliest Turonian interval. In general, the aforementioned interval is described as “supergreenhouse” (Hallam, 1985; Hay and Floegel, 2012), characterized by a significant global increase in atmosphere and ocean temperatures and short-term sea-level changes, linked to various processes such as aquifer-eustasy and high fluctuation of the atmospheric CO2 content (i.e., Wagreich et al., 2014; Wendler and Wendler, 2016). These modifications have led to changes in the diversity and abundance of marine planktonic organisms, especially the calcareous nannoplankton, which is very sensitive to environmental changes. The calcareous nannofossil fluctuations from low to middle and high paleolatitudes in both hemispheres indicate a distinctive pattern of high productivity in the initial phase of OAE2 (Paul et al., 1999; Hardas and Mutterlose, 2007; Linnert and Mutterlose, 2015), followed by a “starving interval” during the OAE2 climax and recovery in post-OAE2 (Lamolda et al., 1994; Premoli-Silva et al., 1989; Wang et al., 2001; Erba, 2004; Li et al., 2006; Voigt et al., 2006; Gertsch et al., 2010; Linnert et al., 2010; Melinte-Dobrinescu et al., 2013; Petrizzo et al., 2022, among many others).
Notably, the “long” definition of OAE2 includes the interval from the base of the carbon isotope excursion up to the stable background δ13C values found at the top of the event, whereas the “short” definition includes the interval up to the end of the δ13C value plateau. According to Sageman et al. (2006), the age of the “long” OAE2 is 866 ± 19 Ky, being comparable with those found in the Maverick Basin of Texas (920 ± 170 Ky; Eldrett et al., 2015) and Gongzha, Tibet (820 ± 25 Ky; Li et al., 2017). Jarvis et al., 1988; Jarvis et al., 2006) reported four successive peaks of δ13C isotope values within the OAE2: A (the oldest peak), B (the second peak), C (the third peak), and D (the youngest peak). In Dover and Eastbourne, the fluctuation pattern of the δ13C isotope (Paul et al., 1999) shows strong similarities to those described by Jarvis et al. (2006). In the Tethyan Realm (i.e., north Spain), the OAE2 contains the first build-up, trough, second build-up, and plateau (Oba et al., 2011; Melinte-Dobrinescu et al., 2013).
Yet, in the Eastern Carpathians, only the Albian–Cenomanian boundary event has been reported by assessing isotope and biotic fluctuations (Melinte-Dobrinescu et al., 2015). The presence of OAE2 was observed in the Southern Carpathians in a shallow marine setting based on isotope analysis and calcareous nannofossil biostratigraphy but in the absence of a lithological overprint, such as black shales (Melinte-Dobrinescu and Bojar, 2008). Cetean et al. (2008) reported the Cenomanian–Turonian boundary event in an expanded Albian–lower Turonian succession of drilling located in the southern Eastern Carpathians based on lithology assessment (occurrence of black and dark-gray shales) and foraminifer and calcareous nannofossil turnover; however, the authors did not perform chemostratigraphic investigations. They also observed rich and diversified agglutinated foraminiferal assemblages that disappeared within the hypothesized OAE2 interval, characterized mainly by the presence of Glomospira charoides and Haplophragmoides spp., which are taxa indicative of an oxygen-depleting paleoenvironment.
The present study aimed to constrain OAE2 in the Eastern Carpathians with an integrated analysis of bio- and chemostratigraphy. Our investigations focus on the calcareous nannofossil biostratigraphy for the assignment of the age, and carbon and oxygen isotopes for reconstructing the paleoenvironmental changes. A correlation with other sections of the Tethyan and Boreal realms enclosing the OAE2 is also presented.
The Romanian Carpathians, including the Eastern Carpathians, Southern Carpathians, and Apuseni Mountains, comprise several tectonic units progressively assembled during the closure of two oceanic realms that are kinematically linked to the evolution of the Alpine Tethys (Săndulescu, 1984; Schmid et al., 2008; Mațenco et al., 2010; Mațenco, 2017). The sedimentary cover of the Eastern Carpathians is included in a thin-skinned nappe system (Figure 1), i.e., the Outer Dacides in W and the Moldavides in E (Săndulescu, 1984).
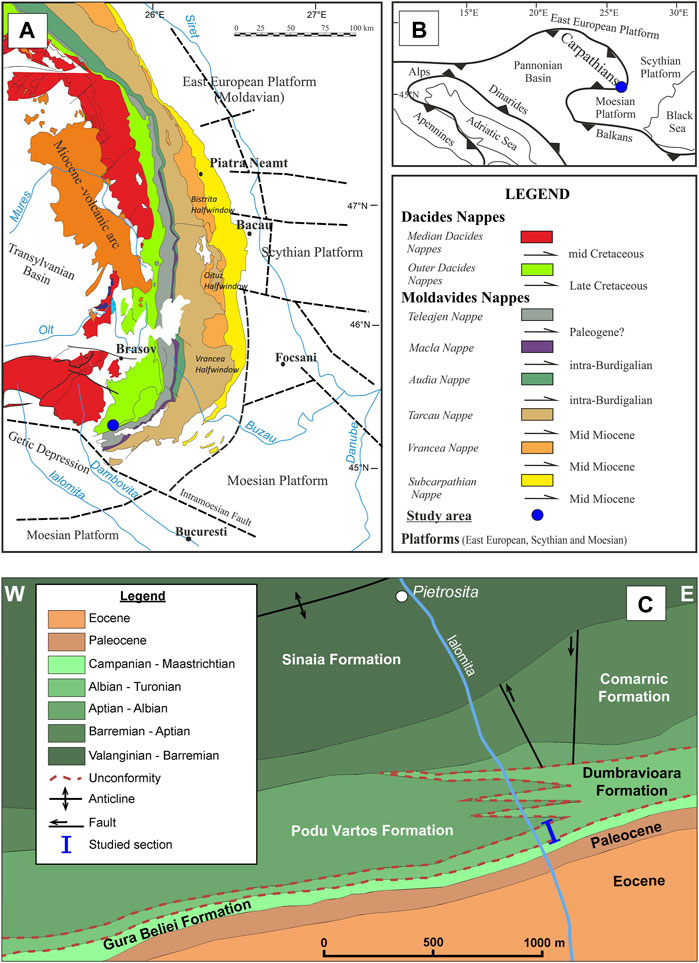
FIGURE 1. (A) Location of the study succession in the southern end of the Eastern Carpathians (tectonic map after Săndulescu, 1983; Maţenco, 2017). (B) Study area location in the simplified Alpine–Carpathian tectonic context. (C) Geological map of the investigated area showing the location of the study section (modified after Ştefănescu, 1995).
The sedimentary cover of the Outer Dacides and Moldavides is mainly composed of Valanginian–lower Albian deep-water deposits, such as turbidites and pelagites (Melinte-Dobrinescu et al., 2009). The post-tectonic deposition started in the upper Albian, following the meso-Cretaceous movements (Ştefănescu et al., 1981; Ştefănescu and Melinte, 1996).
The study area, located at the southern end of the Eastern Carpathians (Figure 1), is a very complicated region in terms of a tectonic viewpoint because of the cumulative effects of successive tectonic phases produced since the Albian up to the Burdigalian (Murgeanu et al., 1963; Ştefănescu, 1995). Large Cretaceous–Paleogene outcrops are distributed on both banks of the Ialomiţa River, south of Pietrosiţa town (Figures 1, 2). The Lower Cretaceous deposits, belonging to the Outer Dacides (Ceahlău Nappe), contain the Sinaia and Comarnic units, which are mainly composed of Tithonian to lower Aptian calcareous turbidites (Patrulius et al., 1976). The Comarnic Formation is unconformably covered by hemipelagic sediments of the Dumbrăvioara Formation, which belongs to the post-tectonic cover and encompasses, according to the identified macrofaunas and microfaunas (Ştefănescu and Zamfirescu, 1964; Cetean et al., 2008), the upper Albian–Turonian interval (Figures 1, 2). The Dumbrăvioara Formation is unconformably covered by red hemipelagic deposits of the Gura Beliei Formation. The red marlstone and claystone rocks of this unit contain rich and diversified calcareous nannofossil assemblages, indicating the Campanian–early Paleocene age (Melinte and Jipa, 2005).
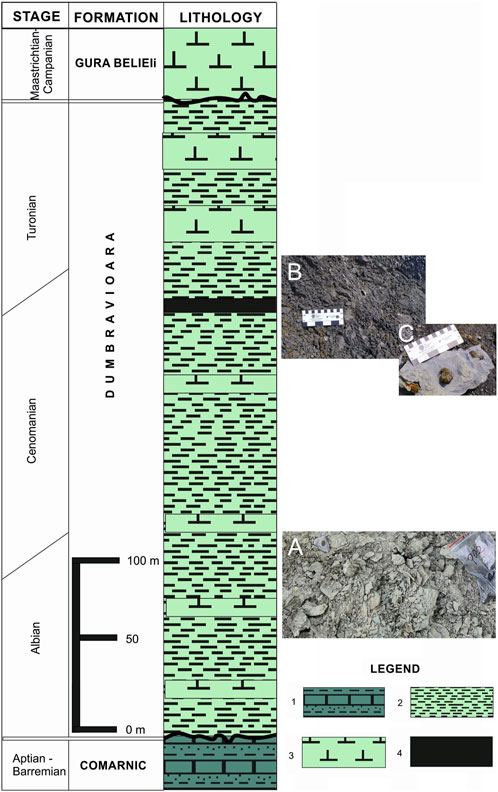
FIGURE 2. Lithology of the Cretaceous sediments cropping out on both banks of the Ialomiţa River, including the Dumbrăvioara unit under study. The 17-cm thickness of the black shale level is not to scale. Photographs: (A) gray claystone and marlstone, (B) black shale, and (C) pyrite concretions.
The investigated Dumbrăvioara Formation is mainly made of greenish and gray marlstone and claystone. Toward the upper half of the succession, a 17-cm-thick black shale was observed, along with pyrite concretions around this shale level (Figure 2). The stratigraphic thickness of the study section was 19.8 m. Overall, 49 samples were investigated for both calcareous nannofossils and geochemistry, and sampling was performed every 30 cm.
Calcareous nannofossil assemblages were examined under a polarizing light microscope at 1,250× magnification. Smear slides were prepared according to standard techniques (Bown and Young, 1998), without centrifuging or cleaning, to retain the original composition. At least 300 nannofossil specimens were counted for each sample in randomly distributed longitudinal traverses; the percentage of each taxon was calculated relative to the total calcareous nannofossil assemblages. Abundance was calculated as the average number of nannofossil specimens found in the fields of view. Taxonomic identification follows Perch-Nielsen (1985) and Burnett (1998). Biostratigraphy follows Burnett (1998).
An analysis of a set of stable isotopes was performed on bulk carbonates at the University of Graz. Samples were weighed into tubes and flushed with 99.995% helium. After flushing, phosphoric acid was added to the samples, followed by heating for 1 h, subjecting them to overnight acid reactions to carry out complete conversion of carbonate to CO2. The CO2 gas released from the samples was then analyzed by continuous-flow–isotope ratio mass spectrometry (CF-IRMS). CO2 was sampled from the tubes into a continuously flowing stream using a double-hole needle. The CO2 gas was passed through a packed column gas chromatograph. The resultant chromatographic peak was carried forward into the ion source of Europa Scientific 20-20 IRMS, where it was ionized and accelerated. Gas species of different masses were separated in a magnetic field and simultaneously measured using a Faraday cup collector array to calculate the isotopomers of CO2 at m/z 44, 45, and 46. The phosphoric acid used for digestion in the isotope analysis was prepared according to the method reported by Coplen et al. (1983), and it was injected into the vials through the septum. The overall analytical reproducibility was ±0.05‰ for δ13C and ±0.1‰ for δ18O. The results of the stable isotope analysis were expressed in per mil, relative to the Pee Dee Belemnite Standard (PDB) for carbon and oxygen.
The carbonate δ18O signal is sensitive to diagenesis (Schrag et al., 1995). Because the study area provides a relatively homogeneous lithology, it is possible that the overprint during burial diagenesis uniformly affected the oxygen isotope signal (Stoll and Schrag, 2000). For this reason, the oxygen stable isotope data were interpreted only qualitatively, in terms of cooling or warming trends, and further correlations with other sections encompassing the Cenomanian–Turonian boundary interval were realized only based on the carbon isotope and biostratigraphy.
The CaCO3 content was computed through a volumetric test based on the CO2 concentration, which consists of titration of a measured sediment quantity with 0.5 N HCl and retrotitration with 0.5 N NaOH in the presence of phenolphthalein. The total organic carbon (TOC) was analyzed by titration, based on the oxidation of carbon with excess potassium dichromate in a sulfuric acid medium.
Overall, 41 species were identified. The diversity (number of species per sample) varied between 3 and 30, while the abundance (number of specimens per field of view) varied between 2 and 8. The most abundant species were Watznaueria barnesiae and Eprolithus floralis, which jointly constituted 34%–83% of the total assemblages throughout the succession under study. Other common taxa were Nannoconus truittii, Nannoconus elongatus, Nannoconus multicadus, Rhagodiscus spp. (including Rhagodiscus asper and Rhagodiscus angustus), Eiffellithus turriseiffelii, and Tranolithus phacelosus (Figure 3; Supplementary Table S1).
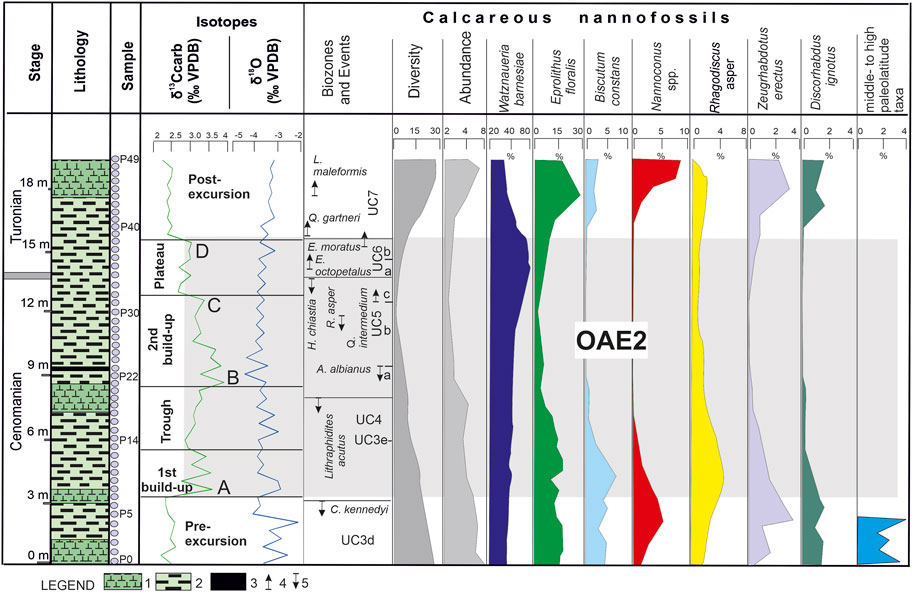
FIGURE 3. Lithostratigraphy, chemostratigraphy, calcareous nannofossil biostratigraphy, and relative abundance in the analyzed section. Legend: 1—claystone; 2—marlstone; 3—black shale; 4—first occurrence; 5—last occurrence.
Biscutum constans was present more consistently in the lower and upper parts of the succession, with a maximum of 7.1% toward its base. Other genera of the nannofossil assemblages were Prediscosphaera spp. (especially Prediscosphaera cretacea) and Zeugrhabdotus spp. (Zeugrhabdotus embergeri, Zeugrhabdotus erectus, and Zeugrhabdotus diplogrammus). Zeugrhabdotus erectus and Discorhabdus ignotus occurred more consistently toward the base and top of the succession but at very low abundance (i.e., a maximum of 3.4% for Z. erectus and 1.9% for Discorhabdus ignotus). Both taxa temporarily disappeared within the OAE2 climax (Figure 3). In the lower part of the succession, Crucibiscutum salebrosum, Repagulum parvidentatum, and Seribiscutum primitivum were present at low abundance, accounting for up to 4% of the total assemblage in the short interval where they occurred (Figures 3, 4; Supplementary Table S1).
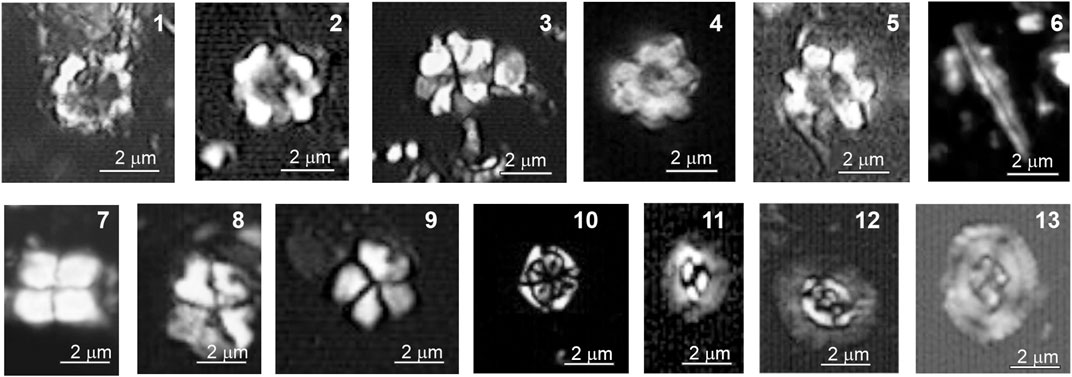
FIGURE 4. Calcareous nannofossil microphotographs of the studied upper Cenomanian–lower Turonian succession. All microphotographs were taken under a light microscope; N+, crossed-nicols; NII, polarized light; scale bar: microns. 1, 2, Eprolithus floralis (Stradner, 1962; Stover, 1966); 1, Sample 15; 2, Sample 28; 3, Eprolithus octopetalus (Varol, 1992); Sample 37; 4, 5, Eprolithus moratus (Stover, 1966; Burnett, 1998); Sample 35; 6, Lithraphidites acutus (Verbeek & Manivit; Manivit et al., 1977); Sample 21; 7, Quadrum gartneri (Prins & Perch-Nielsen; Manivit et al., 1977); Sample 40; 8, 9, Quadrum intermedium (Varol, 1992); 8, Sample 33; 9, Sample 40; 10, Corollithion kennedyi (Crux, 1981); Sample 6; 11, Biscutum constans (Górka, 1957) (Black and Barnes, 1959); Sample 5; 12, Crucibiscutum salebrosum (Black, 1971; Jakubowski, 1986); Sample 3; 13, Helenea chiastia (Worsley, 1971); Sample 33.
The calcareous nannofossils assemblages included several taxa that were important for biostratigraphy (Figure 4), such as Corollithion kennedyi, Lithraphidites acutus, Helenea chiastia, Axopodorhabdus albianus, Quadrum intermedium, R. asper, Eprolithus octopetalus, Eprolithus moratus, Quadrum gartneri, and Lucianorhabdus maleformis.
The oldest nannofossil event observed in the studied succession was the last occurrence (LO) of C. kennedyi (sample P7; Supplementary Table S1), which marked the base of the UC3e subzone in the late Cenomanian (Figure 3). The base of UC4 could not be recognized as Cylindralithus biarcus was not present. The top of UC4 was recognized based on the LO of L. acutus (sample P21; Supplementary Table S1), which is a late Cenomanian event. The UC5 subzones, namely, A, B, and C, were identified based on the LO of A. albianus (base of UC5b; sample P23), followed by the first occurrence (FO) of Q. intermedium (base of UC5c; sample P31; Figures 3, 4; Supplementary Table S1). The LO of R. asper is placed in UC5b (sample P30). The base of UC6 was marked by the LO of H. chiastia (sample P34, Supplementary Table S1).
At the Global Boundary Stratotype Section and Point (GSSP) of the Turonian stage, the disappearance interval of H. chiastia indicated the Cenomanian–Turonian boundary (Kennedy et al., 2004); hence, we considered that the Cenomanian–Turonian boundary falls within the UC5c nannofossil subzone. In UC6, two bioevents, the successive FOs of E. octopetalus (sample P35) and E. moratus (sample 37), were recorded, the latter indicating the boundary between the UC6a and UC6b subzones (Figures 3, 4; Supplementary Table S1).
The base of UC7 was marked by the FO of Q. gartneri (sample 38), an early Turonian event (Lamolda et al., 1994; Burnett, 1998; Tsikos et al., 2004; Boulila et al., 2020). The youngest recorded nannofossil event was the FO of L. maleformis (sample P44), placed slightly above the FO of Q. gartneri, consistent with the findings of Burnett (1998). In some regions (i.e., the Bohemian Basin and the Outer Western Carpathians), the FO of L. maleformis was found to be synchronous with the FO of Q. gartneri, both nannofossil events recorded at the base of UC7 (Švábenická, 2012). The biozone UC8 was not recorded in the succession as Eiffellithus eximius (its FO marks the base of this nannofossil zone) was not present in the identified calcareous nannofossil assemblages.
The lower part of the section showed low values, ranging between 2.23‰ and 2.54‰ (Figure 3). The values sharply increased to up to 3.68‰, which was slightly above the LO of C. kennedyi. We consider that this oldest increase in the isotope δ13C encountered in this succession represents the beginning of OAE2, i.e., peak A reported by Jarvis et al. (2006, 2011), described herein as the first build-up of OAE2. Upward of the succession, the values gradually decreased, representing a trough interval (Figures 3, 5; Table 1). Slightly above the LO of L. acutus, we identified high isotope δ13C values, i.e., a peak of 3.89‰, which reflected the second build-up of OAE2. It was the highest value recorded in the section and was assumed to be peak B reported by Jarvis et al. (2006, 2011). The second build-up comprised several nannofossil events, such as the LO of A. albianus and the FO of Q. intermedium, extending within the UC5 zone.
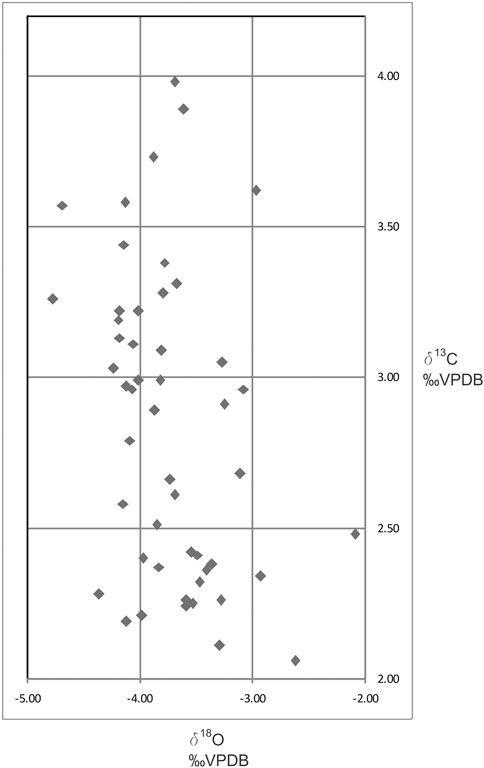
FIGURE 5. δ13C versus δ18O stable isotope cross-plot in the investigated section. Data are presented for analysis of bulk sediments and are presented in ‰ VPDB (Vienna Pee Dee Belemnite).
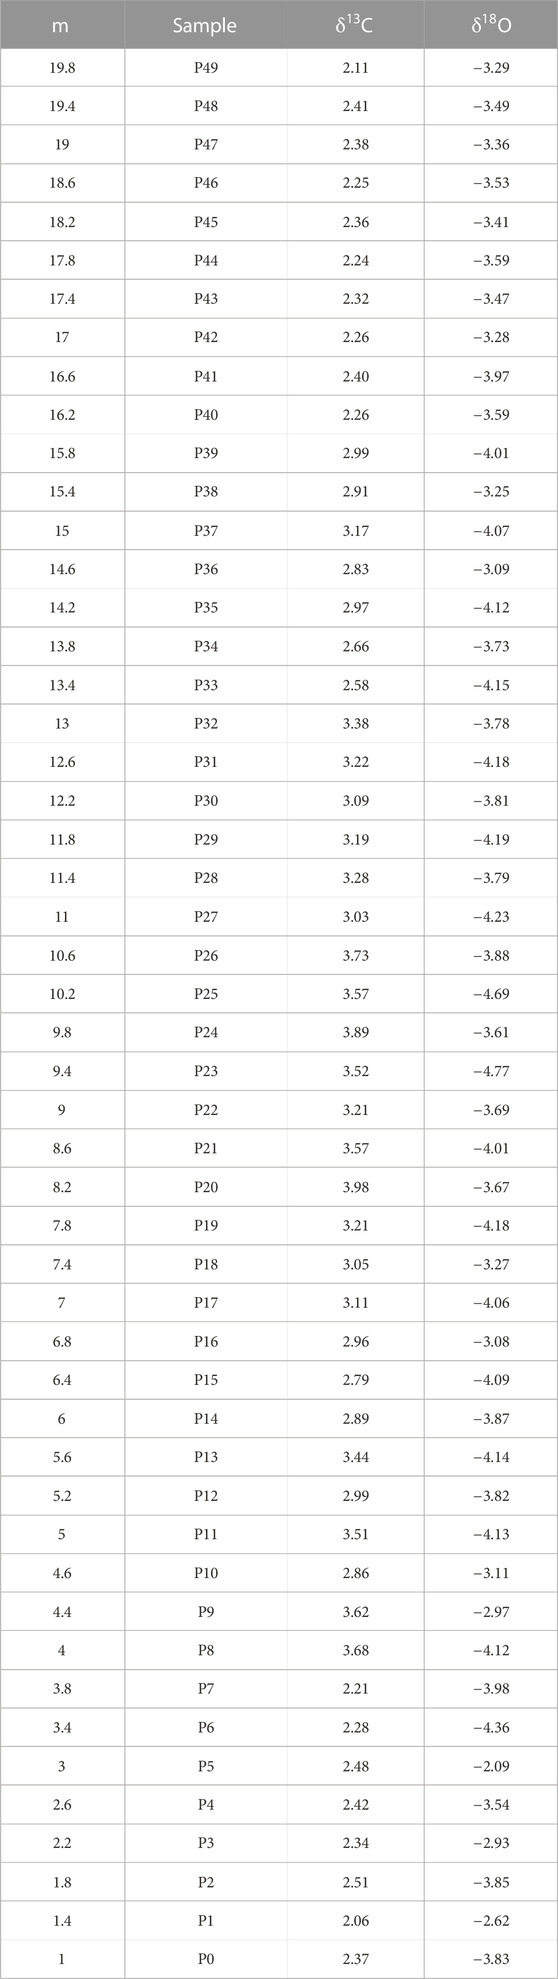
TABLE 1. Data on δ13C and δ18O stable isotope analyses.
Toward the end of the second build-up of OAE2, just below the LO of H. chiastia, a smaller peak of 3.38‰ (sample 32) was observed, which probably represented peak C described by Jarvis et al. (2006, 2011). Upward of the succession, an interval of lower and constant δ13C values, described herein as the plateau, was identified; it spanned from the top of UC5 up to the base of UC7. At the end of the plateau, we recorded the youngest peak of the succession, i.e., 2.99‰, which was just below the FO of Q. gartneri, which possibly correlated with peak D identified by Jarvis et al. (2006, 2011). The youngest studied interval (i.e., post-excursion) was characterized by δ13C values, similar to those recorded in the pre-excursion interval.
The isotope δ18O values fluctuate between −4.8‰ and −2.2‰ (Figure 3; Table 1). The highest values were recorded in the lower part of the succession, which was below the LO of C. kennedyi. A shift to more negative values (approximately −4‰) was observed concomitant with the increase in δ13C, which was at the base of the first build-up phase of OAE2. Upward of the succession, the fluctuations in δ18O were minor, i.e., between −4.1‰ and −3.8‰.
CaCO3 values varied between 5% and 78% (Figure 6). The lowest values corresponded to the level of black shale cropping out in the succession, whereas the highest values were identified at the base and the top of the section, with the latest being above the end of OAE2. The CaCO3 values first showed a decline toward the upper part of the first build-up, within the trough, and the second build-up (intervals that include peaks A and B reported by Jarvis et al., 2006; 2011). The CaCO3 values were increasing in the upper part of the plateau phase (above peak C) and showed higher values above the end of OAE2.
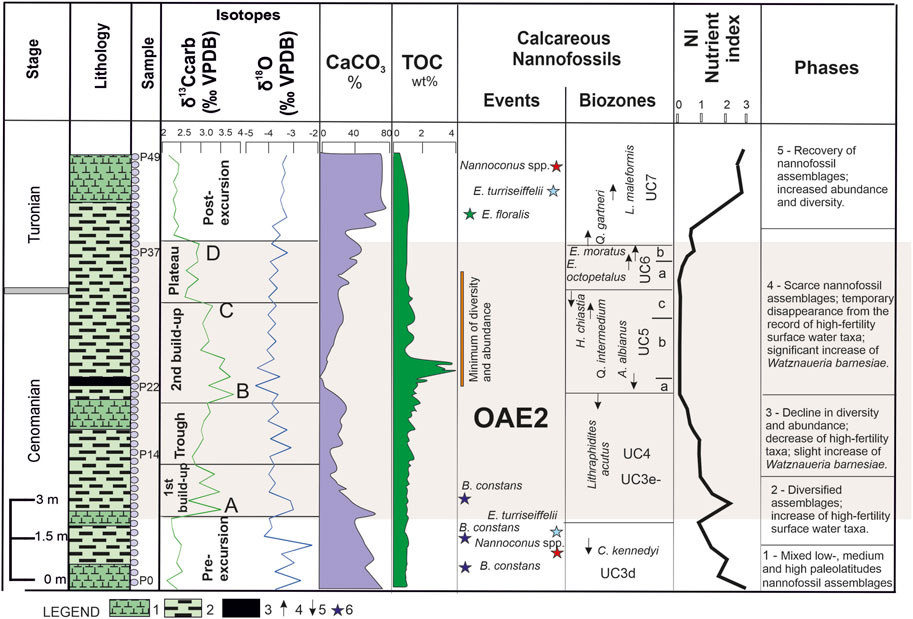
FIGURE 6. Geochemistry, calcareous nannofossil events, nutrient index, and phases identified in this study based on calcareous nannofossils. Legend: 1, claystone; 2, marlstone; 3, black shale; 4, first occurrence; 5, last occurrence; 6, higher abundance (Watznaueria barnesiae >70%; Eprolithus floralis >25%; Nannoconus spp. >9%; Biscutum constans >7%; Eiffellithus turriseiffelii >9%).
The TOC (total organic carbon) values are generally low through the studied interval, showing little fluctuations, i.e., between 0.6 wt% and 0.9 wt%. A single peak was observed enclosing the black shale depositional interval, with values ranging from 3.7 wt% to 3.9 wt%. The high TOC values are coeval with a very low CaCO3 content and a substantial shift in diversity and abundance of calcareous nannofossil assemblages (Figure 6).
The calcareous nannofossil distribution pattern indicated significant changes throughout the studied OAE2 interval. According to the observed fluctuations, several phases were identified (older first), as shown in Figure 6.
Phase 1 was characterized by low-to-middle paleolatitude taxa (Watkins, 1992; Erba, 1992, 1994; Lamolda et al., 1994; Lees et al., 2005; Herrle et al., 2010; Aguado, 2016), the most common being W. barnesiae, Rhagodiscus spp., Nannoconus spp., Biscutum constans, E. turriseiffelii, T. phacelosus, Z. embergeri, Eprolithus spp., and Quadrum spp. The lowest part of the succession encloses a small group of species more related to high paleolatitudes, such as C. salebrosum, Repagulum parvidentatum, and S. primitivum (Watkins et al., 1996; Mutterlose et al., 2005). This is the only interval with such an occurrence in the succession, consistent with the increased abundance of higher fertility taxa, such as Biscutum constans, Discorhabdus ignotus, and Z. erectus, along with the highest values for the isotope δ18O. In terms of OAE2, this part corresponds to the pre-excursion.
Phase 2 was characterized by a declining tendency in terms of the abundance and diversity of nannofossil assemblages. The taxa more related to high paleolatitudes vanished, while Biscutum constans showed two successive peaks. Toward the base of this phase, a peak of Nannoconus spp. was recorded, followed by the peak of E. turriseiffelii. In terms of OAE2, based on δ13C fluctuation, this phase extended from the pre-excursion up to the lower part of the first build-up (including peak A described by Jarvis et al., 2006). The disappearance of cooler surface-water nannofossils along with the shift to more negative values of the isotope δ18O indicated a possible warming tendency at the base of this phase, followed by a short cooling trend.
Phase 3 was characterized by high abundance of W. barnesiae and decreased values of E. floralis, accompanied by a significant decrease in Biscutum constans. This phase extended within the upper part of the first build-up, the trough, and the lower part of the second build-up of OAE2 (including peak B of Jarvis et al., 2006).
Phase 4 was characterized by a drastic decline in calcareous nannofossil assemblage, a trend that extends to the upper part of the second build-up (including peak C reported by Jarvis et al., 2006) and the plateau (including peak D of Jarvis et al., 2006). Higher fertility surface-water taxa such as Biscutum constans and Z. erectus (Erba, 2004; Mutterlose et al., 2005; Erba et al., 2019) disappeared. The assemblages consist mainly of W. barnesiae (up to 75%–80% of the total assemblages).
Phase 5 was characterized by recovery in terms of nannofossils linked to OAE2 termination. It encloses successive peaks of E. floralis, Nannoconus spp., and E. turriseiffelii. In this phase, the abundance of W. barnesiae consistently decreased, and Biscutum constans reappeared in the record.
To estimate, based on calcareous nannofossils, the paleoecological changes of mid-Cretaceous times, including OAEs, Herrle et al. (2003) proposed two indices: the temperature index (TI) and the nutrient index (NI). Since then, TI and NI have been successfully applied to the Aptian–Turonian interval (Herrle, 2003; Herrle et al., 2003; 2010; Herrle and Mutterlose, 2003; Tiraboschi et al., 2009; Bottini et al., 2015; Aguado et al., 2016; Bottini and Erba, 2018) for deciphering modifications in surface-water temperature and fertility.
In this study, we calculated NI using the following formula: NI = {SUM (% of mesoeutrophic taxa)/(% of mesoeutrophic taxa + % of oligotrophic taxa) * 100}. The mesoeutrophic group includes Biscutum constans, Z. erectus, and D. ignotus, whereas the oligotrophic group is represented by W. barnesiae.
Biscutum constans is an indicator of high-fertility surface-water condition (Erba, 2004; Mutterlose et al., 2005; Linnert et al., 2011; Aguado et al., 2016). Roth (1981) was the first to use Biscutum constans as an indicator of high-fertility surface-water conditions, while Watkins (1989) assumed that Biscutum constans may be associated with mesotrophic surface-water conditions rather than eutrophic conditions. Decreased abundance of Biscutum spp. throughout OAE2 was observed in many European sections of mid-to-high paleolatitudes (Lamolda et al., 1994; Paul et al., 1999; Mutterlose and Kessels, 2000; Gale et al., 2002; Herrle and Mutterlose, 2003; Melinte-Dobrinescu and Bojar, 2008; Bottini et al., 2015), as recorded in the investigated succession of the Eastern Carpathians.
Zeugrhabdotus erectus is another proxy of high-fertility surface-water conditions and indicates eutrophic conditions, probably because it has a higher nutrient preference than Biscutum taxa (Erba, 1992). It was assumed that the high abundance of smaller Zeugrhabdotus specimens (<5 μm) mirrored the elevation but at somewhat lower fertility conditions than Biscutum species (Kessels et al., 2003), whereas a predominance of Z. erectus over Biscutum spp. reflected more coastal environments, with a higher input of nutrients (Möller and Mutterlose, 2014; Aguado et al., 2016). Discorhabdus ignotus is also regarded as a high-fertility proxy, showing a preference for mesoeutrophic surface-water conditions (Herrle, 2003; Bornemann et al., 2005; Aguado et al., 2014; 2016).
Watznaueria barnesiae is the most abundant Cretaceous species and one of the nannofossils with the highest resistance to dissolution. Assemblages containing more than 40% W. barnesiae are assumed to have undergone heavy alterations (Roth and Krumbach, 1986). Watznaueria barnesiae is regarded as an oligotrophic taxon, being a K-strategist species (Mutterlose and Kessels, 2000). Some authors hypothesized that its high abundance is indicative of high surface-water temperature (Watkins, et al., 1996; Sheldon et al., 2010). However, no consensus exists regarding the paleoecology of W. barnesiae, which is associated with various conditions, from eutrophic to mesotrophic or oligotrophic conditions (Lees et al., 2005). Because this species is resistant to dissolution, its blooms occur in intervals of intense diagenetic processes and/or because of the surface-water geochemical changes; this leads to the disappearance of nannofossils more sensitive to ecological modifications. These changes have also been demonstrated in the present study, i.e., owing to an increase of more than 80% in the abundance of W. barnesiae, placed in the interval of very low CaCO3 and high TOC.
In general, the NI of the investigated succession in the Eastern Carpathians shows low values through the late Cenomanian–early Turonian interval (Figure 6). The highest values were identified below the OAE2 setting, characterized by an increased abundance of Biscutum constans, Z. erectus, and D. ignotus. This interval also contains the single occurrence of the nannofossils associated with mid-to-high paleolatitudes (Bown et al., 1998; Mutterlose et al., 2005), such as Crucibiscutum salebosum, Repagulum parvidentatum, and S. primitivum. Based on these findings, we assume a mesotrophic to eutrophic setting for the oldest studied interval (late Cenomanian, UC3d biozone). The mesoeutrophic setting was temporarily replaced by an oligotrophic one as NI decreased concomitantly with the increased abundance of Nannoconus spp. and E. turriseiffelii. The nannoconids are mostly indicative of warm surface water and are considered oligotrophic taxa (Busson and Noël, 1991; Street and Bown, 2000; Lees et al., 2005; Mattioli et al., 2014); possibly, the same pattern was shown by E. turriseiffelii, also regarded as a cosmopolitan oligotrophic nannofossil (Eleson and Bralower, 2005; Mutterlose et al., 2005).
Upward of the succession, the NI increases, indicative of the higher abundance of Biscutum constans. Productivity improved for a short interval in the initial phase of OAE2. Toward the upper part of the first build-up, the NI continuously decreased. From the second build-up to the upper part of the plateau, the NI was null as all the high-fertility taxa had disappeared from the record. This interval was characterized by very scarce calcareous nannofossil assemblages, which are composed of very few species (W. barnesiae, E. floralis, Z. embergeri, and Rhagodiscus spp.; Figures 3, 6; Supplementary Table S1). These depauperate assemblages probably indicate very strong diagenesis, which is also reflected by the extremely low CaCO3 content (Figure 6). Recent findings (Slater et al., 2022) linked the subsequent dissolution of CaCO3 in the last phase of OAEs to the high organic matter content that may lead to the occurrence of acidic pore waters.
From the upper part of UC6, the NI showed a progressive increase, indicating the highest values in the UC7 zone. Probably, the recovery of diversity and abundance, accompanied by the substantial shift in W. barnesiae, reflects an improvement of the nannofossil world, linked to changes in ocean chemistry, after the anoxic setting disappears. A similar scenario of nannofossil fluctuations found in the Eastern Carpathians across the OAE2 was described from various regions of the Tethyan and Boreal realms. In Central Tunisia, Aguado et al. (2016) reported that the most eutrophic conditions developed during deposition of the lowermost part of the Whiteinella archaeocretacea foraminifer zone, corresponding to the UC3 and UC4 nannofossil zones. The TI based on calcareous nannofossil assemblages indicates an initial warming at the beginning of the OAE2, followed by progressive cooling, a similar trend reflected by δ18Obulk values. In another Tethyan section in Austria, nannofossil indices and dinoflagellate associations have shown rather low productivity, possibly associated with the low nutrient input in the upper part of the OAE interval (Pavlishina and Wagreich, 2012).
The blooms of E. floralis were encountered above the end of OAE2 in the Eastern Carpathian succession, a pattern described for many Tethyan and Boreal sections (Paul et al., 1994; Erba et al., 2019). As elsewhere, in the investigated succession, the abundance of W. barnesiae consistently increased during the OAE2 climax, coincident with the lowest CaCO3 concentration recorded in the section. This event could be an effect of diagenesis rather than a primary signal. Through the Plenus Marls (UK) across OAE2, very high percentages of W. barnesiae were also identified, but it was assumed these are not linked to any change in lithology and/or diagenetic processes, thus reflecting a primary signal, not a post-burial effect (Lamolda et al., 1994). Previous studies indicate that during the Cenomanian–Turonian boundary event, other groups of the organism bloomed, i.e., the calcareous dinoflagellate genus Thoracosphaera (Melinte-Dobrinescu et al., 2013), cyanobacteria (Duque-Botero and Maurrasse, 2005; Duque-Botero et al., 2009), and the nannofossil Braarudosphaera bigelowii (Cunha and Shimabukuro, 1997). Probably, the occurrence of these organisms is linked to the eutrophication event produced in the initial phases of OAE2 and post-excursion, reflecting not only the global changes but also the regional settings of these times.
Based on bio- and chemostratigraphy, we identified OAE2 in the Eastern Carpathians in a marlstone and claystone succession, enclosing a 17-cm-thick black shale. The investigated interval covers the UC3d to UC7 biozones, spanning the Cenomanian–Turonian boundary interval. The fluctuation pattern of the δ13C isotope led to the identification of several OAE2 intervals, such as the first build-up, trough, second build-up, and plateau. Peaks A, B, C, and D reported by Jarvis et al. (2006, 2011) are included at the base of the first build-up (peak A), at the base and the top of the second build-up (peaks B and C), and in the plateau (peak D). We assumed that the Cenomanian–Turonian boundary falls in the upper part of the UC5c nannofossil subzone, at the LO of H. chiastia, as pointed out at the GSSP of the Turonian boundary (Kennedy et al., 2004). Therefore, the main part of the OAE2 is comprised in the late Cenomanian (including peaks A, B, and C). The earliest Turonian comprises only peak D (the main part of the plateau).
The fluctuation pattern of NI is indicative of a mesoeutrophic paleosetting in the lower and upper parts of the investigated intervals throughout the pre- and post-excursion. During OAE2, oligotrophic conditions expanded, except for the short interval at the beginning of OAE2, where productivity increased, with Biscutum constans showing a shift in its abundance. A cooling interval at the base of the studied succession, characterized by the occurrence of cooler surface-water taxa, such as C. salebrosum, Repagulum parvidentatum, and S. primitivum, along with a high abundance of Biscutum constans, was observed. This event occurred within the UC3e nannofossil subzone, in the pre-excursion interval, and may reflect a transgressive event in the Eastern Carpathian region.
The raw data supporting the conclusions of this article will be made available by the authors, without undue reservation.
MD developed the project concept and implementation details with input from her PhD student VA; GI and AB carried out most of the fieldwork with some level of assistance from the other co-authors. MD, EA, VA, and CL were involved in manuscript preparation, including figures. All authors contributed to the article and approved the submitted version.
This work was supported by the Grant of the Romanian Agency of Education and Research CNCS-UEFSCDI, project number PNIII-P4-ID-PCE-2020-09471—Acronym OCEANROC, No. 42/2021, within PNCDI III.
The authors thank the reviewers, whose comments substantially improved an earlier version of this paper.
The authors declare that the research was conducted in the absence of any commercial or financial relationships that could be construed as a potential conflict of interest.
All claims expressed in this article are solely those of the authors and do not necessarily represent those of their affiliated organizations, or those of the publisher, the editors, and the reviewers. Any product that may be evaluated in this article, or claim that may be made by its manufacturer, is not guaranteed or endorsed by the publisher.
The Supplementary Material for this article can be found online at: https://www.frontiersin.org/articles/10.3389/feart.2023.1155482/full#supplementary-material
SUPPLEMENTARY TABLE S1 | Distribution chart of the identified calcareous nannofossils. P (present) = 1–3 specimens/8 FOVs; R (rare) = 1–3/5 FOVs; F (few) = 4–7/5 FOVs; C (common) = 7–10/5 FOVs; A (abundant) = >10/5 FOVs; in gray —biostratigraphic markers. FOV: field of view.
Aguado, R., de Gea, G. A., and O'Dogherty, L. (2014). Integrated biostratigraphy (calcareous nannofossils, planktonic foraminifera, and radiolarians) of an uppermost Barremian–lower Aptian pelagic succession in the Subbetic Basin (southern Spain). Cretac. Res. 51, 153–173. doi:10.1016/j.cretres.2014.06.002
Aguado, R., Reolid, M., and Molina, E. (2016). Response of calcareous nannoplankton to the Late Cretaceous Oceanic Anoxic Event 2 at Oued Bahloul (central Tunisia). Palaeogeogr. Palaeoclim. Palaeoecol. 459, 289–305. doi:10.1016/j.palaeo.2016.07.016
Arthur, M. A., Dean, W. E., and Schlanger, S. O. (1985). “Variations in the global carbon cycle during the Cretaceous related to climate, volcanism, and changes in atmospheric CO2,” in The carbon cycle and atmospheric CO2: Natural Variations Archean to Present. Editors E. T. Sundquist, W. S. Broecker, and Geophys (Washington D.C.: Monogr. Ser.), 504–529.
Bornemann, A., Pross, J., Reichelt, K., Herrle, J. O., Hemleben, C., and Mutterlose, J. (2005). Reconstruction of short-term palaeoceanographic changes during the formation of the Late Albian ‘Niveau Breistroffer’ black shales (Oceanic Anoxic Event 1d, SE France). J. Geol. Soc. Lond. 162, 623–639. doi:10.1144/0016-764903-171
Bottini, C., and Erba, E. (2018). Mid-Cretaceous paleoenvironmental changes in the western Tethys. Clim. Past. 14, 1147–1163. doi:10.5194/cp-14-1147-2018
Bottini, C., Erba, E., Tiraboschi, D., Jenkyns, H. C., Schouten, S., and Sinninghe Damsté, J. S. (2015). Climate variability and ocean fertility during the Aptian Stage. Clim. Past. 11, 383–402. doi:10.5194/cp-11-383-2015
Boulila, S., Charbonnier, G., Spangenberg, J. E., Gardin, S., Glabrun, B., Briard, J., et al. (2020). Unraveling short- and long-term carbon cycle variations during the Oceanic Anoxic Event 2 from the Paris Basin Chalk. Glob. Planet. Change 186, 103126. doi:10.1016/j.gloplacha.2020.103126
Bown, P. R., Rutledge, D. C., Crux, J. A., and Gallagher, L. T. (1998). “Lower Cretaceous,” in Calcareous Nannofossil Biostratigraphy (British Micropalaeontological Society Publication Series). Editor P. R. Bown (Dordrecht, Boston, London: Chapman & Hall Ltd/Kluwer Academic Press, Kluwer Academic Publishers), 86–131.
Bown, P. R., and Young, J. R. (1998). “Techniques,” in Calcareous Nannofossil Biostratigraphy (British Micropalaeontological Society Publication Series). Editor P. R. Bown (London: Chapman and Kluwer Academic), 16–28.
Burnett, J. A. (1998). “Upper Cretaceous,” in Calcareous Nannofossil Biostratigraphy (British Micropalaeontological Society Publication Series). Editor P. R. Bown (Dordrecht, Boston, London: Chapman & Hall Ltd/Kluwer Academic Press, Kluwer Academic Publishers), 132–199.
Busson, G., and Noël, D. (1991). Les nannoconidés indicateurs environnementaux des océans et mers épicontinentales du Jurassique terminal et du Crétacé inférieur. Oceanol. Acta 14, 333–356.
Cetean, C. G., Balc, R., Kaminski, M. A., and Filipescu, S. (2008). Biostratigraphy of the Cenomanian-Turonian boundary in the Eastern Carpathians (Dâmboviţa Valley): preliminary observations. Geologia 53, 11–23. doi:10.5038/1937-8602.53.1.2
Coplen, T., Kendall, C., and Hopple, J. (1983). Comparison of stable isotope reference samples. Nature 302, 236–238. doi:10.1038/302236a0
Cunha, A. S., and Shimabukuro, S. (1997). Braarudosphaera blooms and anomalous enrichments of Nannoconus: evidence from the Turonian south Atlantic, Santos basin, Brazil. JNR 19, 51–55.
Dangendorf, S., Marcos, M., Wöppelmann, G., Conrad, C. P., Frederikse, T., and Riva, R. E. M. (2017). Reassessment of 20th century global mean sea level rise. PNAS 114, 5946–5951. doi:10.1073/pnas.1616007114
Duque-Botero, F., and Maurrasse, F. J. M-R. (2005). Cyanobacterial productivity, variations in the organic matter and facies of the Indidura formation (Cenomanian–Turonian), Northeastern Mexic. J. Iber. Geol. 31, 87–100.
Duque-Botero, F., Maurrasse, F. J. M-R., Hickey-Vargas, R., Melinte, M. C., Jaffe, R., and Lopez-Oliva, J. G. (2009). Microspheroids accumulations and geochemical characterization of a Cenomanian–Turonian anoxic basin: the record of the Indidura Formation, NE Mexico, 93. Washington D.C.: SEPM Sp. Publ, 171–186.
Eldrett, J. S., Ma, C., Bergman, S. C., Lutz, B., Gregory, F. J., Dodsworth, P., et al. (2015). An astronomically calibrated stratigraphy of the Cenomanian, Turonian and earliest Coniacian from the Cretaceous Western Interior Seaway, USA: implications for global chronostratigraphy. Cretac. Res. 56, 316–344. doi:10.1016/j.cretres.2015.04.010
Eleson, J. W., and Bralower, T. J. (2005). Evidence of changes in surface water temperature and productivity at the Cenomanian/Turonian Boundary. Micropaleontol. 51, 319–332. doi:10.2113/gsmicropal.51.4.319
Erba, E., Bottini, C., Faucher, G., Gambacorta, G., and Visentin, S. (2019). The response of calcareous nannoplankton to Oceanic Anoxic Events: the Italian pelagic record. BSPI 58, 51–71. doi:10.4435/BSPI.2019.08
Erba, E. (2004). Calcareous nannofossils and Mesozoic oceanic anoxic events. Mar. Micropaleontol. 52, 85–106. doi:10.1016/j.marmicro.2004.04.007
Erba, E. (1992). Middle Cretaceous calcareous nannofossils from the Western Pacific (Leg129): evidence for paleoequatorial crossings. Proc. ODP. Sci. Results 129, 189–201.
Gale, A. S., Hardenbol, J., Hathway, B., Kennedy, W. J., Young, J. R., and Phansalkar, V. (2002). Global correlation of Cenomanian (Upper Cretaceous) sequences: evidence for Milankovitch control on sea level. Geology 30, 291–294. doi:10.1130/0091-7613(2002)030<0291:GCOCUC>2.0.CO;2
Gertsch, B., Adatte, T., Keller, G., Tantawy, A. A. A. M., Berner, Z., Mort, H. P., et al. (2010). Middle and Late Cenomanian Oceanic Anoxic Events in shallow and deeper shelf environments of western Morocco. Sedimentology 57, 1430–1462. doi:10.1111/j.1365-3091.2010.01151.x
Hallam, A. (1985). A review of Mesozoic climates. J. Geol. Soc. 142, 433–445. doi:10.1144/gsjgs.142.3.0433
Haq, B. U. (2014). Cretaceous eustasy revisited. Glob. Planet. Change 113, 44–58. doi:10.1016/j.gloplacha.2013.12.007
Hardas, P., and Mutterlose, J. (2007). Calcareous nannofossil assemblages of Oceanic Anoxic Event 2 in the equatorial Atlantic: evidence of an eutrophication event. Mar. Micropaleontol. 66, 52–69. doi:10.1016/j.marmicro.2007.07.007
Hay, W. W., and Flögel, S. (2012). New thoughts about the Cretaceous climate and oceans. Earth Sci. Rev. 115, 262–272. doi:10.1016/j.earscirev.2012.09.008
Herrle, J. O., Kosler, P., and Bollmann, J. (2010). Palaeoceanographic differences of early Late Aptian black shale events in the Vocontian Basin (SE France). Palaeogeogr. Palaeoclim. Palaeoecol. 297, 367–376. doi:10.1016/j.palaeo.2010.08.015
Herrle, J. O., and Mutterlose, J. (2003). Calcareous nannofossils from the Aptian–Lower Albian of southeast France: palaeoecological and biostratigraphic implications. Cretac. Res. 24 (1), 1–22. doi:10.1016/S0195-6671(03)00023-5
Herrle, J. O., Pross, J., Friedrich, O., Kössler, P., and Hemleben, C. (2003). Forcing mechanisms for Mid-Cretaceous black shale formation: evidence from the upper Aptian and lower Albian of the Vocontian Basin (SE France). Palaeogeogr. Palaeoclim. Palaeoecol. 190, 399–426. doi:10.1016/S0031-0182(02)00616-8
Herrle, J. O. (2003). Reconstructing nutricline dynamics of Mid-Cretaceous oceans: evidence from calcareous nannofossils from the Niveau Paquier black shale (SE France). Mar. Micropaleontol. 47, 307–321. doi:10.1016/S0377-8398(02)00133-0
Hesselbo, S. P., Gröcke, D. R., Jenkyns, H. C., Bjerrum, C. J., Farrimond, P., Morgans Bell, H. S., et al. (2000). Massive dissociation of gas hydrate during a Jurassic oceanic anoxic event. Nature 406, 392–395. doi:10.1038/35019044
Jarvis, I., Carson, G. A., Hart, M. B., Leary, P. N., and Tocher, B. A. (1988). The Cenomanian–Turonian (late Cretaceous) anoxic event in SW England: evidence from hooken cliffs near beer, SE devon. Newsl. Stratigr. 18, 147–164. doi:10.1127/nos/18/1988/147
Jarvis, I., Gale, A. S., Jenkyns, H. G., and Pearch, M. A. (2006). Secular variation in late Cretaceous carbon isotopes: a new δ13C carbonate reference curve for the Cenomanian–Campanian (99.6–70.6 ma) Cretaceous carbon isotopes. Geol. Mag. 143, 561–608. doi:10.1017/S0016756806002421
Jarvis, I., Lignum, J. S., Gröcke, D. R., Jenkyns, H. C., and Pearce, M. A. (2011). Black shale deposition, atmospheric CO2 drawdown, and cooling during the Cenomanian–Turonian oceanic anoxic event. Paleoceanography 26, PA3201. doi:10.1029/2010PA002081
Jenkyns, H. C., Gale, A. S., and Corfield, R. M. (1994). Carbon- and oxygen-isotope stratigraphy of the English Chalk and Italian Scaglia and its palaeoclimatic significance. Geol. Mag. 131, 1–34. doi:10.1017/S0016756800010451
Jenkyns, H. C. (2010). Geochemistry of oceanic anoxic events. Geochem. Geophys. 11, Q03004. doi:10.1029/2009GC002788
Kennedy, W. J., Gale, A. S., Less, J. A., and Caron, M. (2004). The Global Boundary Stratotype Section and Point (GSSP) for the base of the Cenomanian Stage, Mont Risou, Hautes-Alpes, France. Episodes 27, 21–32. doi:10.18814/epiiugs/2004/v27i1/003
Kessels, K., Mutterlose, J., and Ruffell, A. (2003). Calcareous nannofossils from late Jurassic sediments of the Volga Basin (Russian platform): evidence for productivity-controlled black shale deposition. Int. J. Earth Sci. Geol. (Runschau) 92, 743–757. doi:10.1007/s00531-003-0343-x
Lamolda, M. A., Gorostidi, A., and Paul, C. R. C. (1994). Quantitative estimates of calcareous nannofossil changes across the Plenus Marls (latest Cenomanian), Dover, England: implications for the generation of the Cenomanian-Turonian Boundary Event. Cretac. Res. 14, 143–164. doi:10.1006/cres.1994.1007
Larson, R. L. (1991). Latest pulse of Earth: evidence for a mid-Cretaceous superplume. Geology 19, 547–550. doi:10.1130/0091-7613(1991)019<0547:lpoeef>2.3.co;2
Lees, J. A., Bown, P. R., and Mattioli, E. (2005). Problems with proxies? Cautionary tales of calcareousnannofossil palaeoenvironmental indicators. Micropaleontol. 51, 333–343. doi:10.2113/gsmicropal.51.4.333
Li, X., Jenkyns, H. C., Wang, C., Hu, X., Chen, X., Wei, Y., et al. (2006). Upper Cretaceous carbon- and oxygen-isotope stratigraphy of hemipelagic carbonate facies from southern Tibet, China. J. Geol. Soc. 163, 375–382. doi:10.1144/0016-764905-046
Li, Y.-X., Montañez, I. P., Liu, Z., and Ma, L. (2017). Astronomical constraints on global carboncycle perturbation during Oceanic Anoxic Event 2 (OAE2). Earth Planet Sci. Lett. 462, 35–46. doi:10.1016/j.epsl.2017.01.007
Linnert, C., and Mutterlose, J. (2015). Boreal Early Turonian calcareous nannofossils from nearshore settings-implications for paleoecology. Palaios 30, 728–742. doi:10.2110/palo.2014.099
Linnert, C., Mutterlose, J., and Erbacher, J. (2010). Calcareous nannofossils of the Cenomanian/Turonian boundary interval from the Boreal Realm (Wunstorf, northwest Germany). Mar. Micropaleont. 74, 38–58. doi:10.1016/j.marmicro.2009.12.002
Linnert, C., Mutterlose, J., and Mortimore, R. (2011). Calcareous nannofossils from Eastbourne (South-eastern England) and the paleoceanography of the Cenomanian–Turonian boundary interval. Palaios 26, 298–313. doi:10.2110/palo.2010.p10-130r
Maţenco, L., Krézsek, C., Merten, S., Schmid, S., Cloetingh, S., and Andriessen, P. (2010). Characteristics of collisional orogens with low topographic build-up: an example from the Carpathians. Terra nova. 22, 155–165. doi:10.1111/j.1365-3121.2010.00931.x
Mațenco, L. (2017). “Tectonics and exhumation of Romanian Carpathians: inferences from kinematic and thermochronological studies,”. Landform dynamics and evolution in Romania. Editors M. Rădoane, and A. A. Vespremeanu-Stroe (Berlin, Germany: Springer International Publishing), 15–56.
Mattioli, E., Pittet, B., Riquier, L., and Grossi, V. (2014). The mid-Valanginian Weissert Event as recorded by calcareous nannoplankton in the Vocontian Basin. Palaeogeogr. Palaeoclimatol. Palaeoecol. 414, 472–485. doi:10.1016/j.palaeo.2014.09.030
Melinte, M. C., and Jipa, D. (2005). Campanian–Maastrichtian marine red beds in Romania: biostratigraphic and genetic significance. Cretac. Res. 26, 49–56. doi:10.1016/j.cretres.2004.11.002
Melinte-Dobrinescu, M. C., Bernández, E., Kaiho, K., and Lamolda, M. A. (2013). Cretaceous Oceanic Anoxic Event 2 in the Arobes section, northern Spain: Calcareous nannofossil fluctuations and isotopic events. J. Geol. Soc. Lond. 382, 82–98. doi:10.1144/SP382.7
Melinte-Dobrinescu, M. C., and Bojar, A.-V. (2008). Biostratigraphic and isotopic record of the Cenomanian–Turonian deposits in the Ohaba-Ponor section (SW Haţeg, Romania). Cretac. Res. 29, 1024–1034. doi:10.1016/j.cretres.2008.05.018
Melinte-Dobrinescu, M. C., Brustur, T., Jipa, D., and Szobotka, S. A. (2009). “Eastern Carpathian Cretaceous Oceanic Red Beds: Lithofacies, biostratigraphy and paleoenvironment,” in Cretaceous oceanic red beds: stratigraphy, composition, origins and paleoceanographic/paleoclimatic significance. Editors X. Hu, C. Wang, R. W. Scott, M. Wagreich, and L. Jansa (Washington D.C.: SEPM Spec. Publ.), 91–107.
Melinte-Dobrinescu, M. C., Roban, R.-D., and Stoica, M. (2015). Palaeoenvironmental changes across the Albian-Cenomanian boundary interval of the Eastern Carpathians. Cretac. Res. 54, 68–85. doi:10.1016/j.cretres.2014.10.010
Miller, K. G., Kominz, M. A., Browning, J. V., Wright, J. D., Mountain, G. S., Katz, M. E., et al. (2005). The Phanerozoic record of global sea-level change. Science 310, 1293–1298. doi:10.1126/science.1116412
Möller, C., and Mutterlose, J. (2014). Middle Hauterivian biostratigraphy and palaeoceanography of the Lower Saxony Basin (Northwest Germany). Z. Dt. Ges. Geowiss. (Ger. J. Geosci.) 165, 501–520. doi:10.1127/1860-1804/2014/0084
Murgeanu, G., Filipescu, M. G., Patrulius, D., Tocorjescu, M., Contescu, L., Jipa, D., et al. (1963). Privire generală asupra flisului cretacic de la Curbura Carpaţilor. Ghidul Excursiilor. B. Carpaţii Orient. Asoc. Geol. Carpato-Balcan. Congr. V., 1–101.
Mutterlose, J., Bornemann, A., and Herrle, O. (2005). Mesozoic calcareous nannofossils – state of the art. Pal. Z. 79, 113–133. doi:10.1007/bf03021757
Mutterlose, J., and Kessels, K. (2000). Early Cretaceous calcareous nannofossils from high latitudes: implications for palaeobiogeography and palaeoclimate. Palaeogeogr. Palaeoclimatol. Palaeoecol. 160, 347–372. doi:10.1016/S0031-0182(00)00082-1
Oba, M., Kaiho, K., Okabe, T., Lamolda, M. A., and Wright, J. D. (2011). Short-term euxinia coinciding with rotaliporid extinctions during the Cenomanian–Turonian transition in the middle-neritic eastern North Atlantic inferred from organic compounds. Geology 39, 519–522. doi:10.1130/G31805.1
Patrulius, D., Neagu, T., Avram, E., and Pop, G. (1976). The Jurassic-Cretaceous boundary beds in Romania. An. Inst.de Geol. Geofiz. 50, 71–125.
Paul, C. R. C., Lamolda, M. A., Mitchell, S. F., Vaziri, M. R., Gorostidi, A., and Marshall, J. D. (1999). The Cenomanian–Turonian boundary at Eastbourne (Sussex, UK): a proposed European reference section. Palaeogeogr. Palaeoclimatol. Palaeoecol. 150, 83–121. doi:10.1016/S0031-0182(99)00009-7
Pavlishina, P., and Wagreich, M. (2012). Biostratigraphy and paleoenvironments in a northwestern Tethyan Cenomanian–Turonian boundary section (Austria) based on palynology and calcareous nannofossils. Cretac. Res. 38, 103–112. doi:10.1016/j.cretres.2012.02.005
Perch-Nielsen, K. (1985). “Mesozoic Calcareous nannofossils,” in Plankton stratigraphy. Cambridge Earth science series. Editors H. M. Bolli, J. B. Saunders, and K. Perch Nielsen (Cambridge: Cambridge University Press), 329–426.
Petrizzo, M. R., Amaglio, G., Watkins, D. K., MacLeod, K. G., Huber, B. T., Hasegawa, T., et al. (2022). Biotic and paleoceanographic changes across the Late Cretaceous Oceanic Anoxic Event 2 in the southern high latitudes (IODP sites U1513 and U1516, SE Indian Ocean). Paleoceanogr. Paleoclimatol. 37, e2022PA004474. doi:10.1029/2022PA004474
Premoli Silva, I., Erba, E., and Tornaghi, M. E. (1989). Paleoenvironmental signals and changes in surface fertilityin mid Cretaceous Corg-rich pelagic facies of the Fucoid Marls (Central Italy). Geobios Mem. Spec. 11, 225–236. doi:10.1016/S0016-6995(89)80059-2
Roth, P. H., and Krumbach, K. R. (1986). Middle Cretaceous calcareous nannofossil biogeography and preservation in the Atlantic and Indian oceans: implications for paleoceanography. Mar. Micropaleontol. 10, 235–266. doi:10.1016/0377-8398(86)90031-9
Roth, P. H. (1981). Mid-Cretaceous calcareous nannoplankton from the central Pacific: implications for paleoceanography. Initial Rep. DSDP 62, 471–489.
Sageman, B. B., Meyers, S. R., and Arthur, M. A. (2006). Orbital time scale and new C-isotope record for Cenomanian–Turonian boundary Stratotype. Geology 34, 125–128. doi:10.1130/G22074.1
Sames, B., Wagreich, M., Wendler, J. E., Haq, B. U., Conrad, C. P., Melinte-Dobrinescu, M. C., et al. (2016). Review: short-term sea-level changes in a greenhouse world — a view from the Cretaceous. Palaeogeogr. Palaeoclimatol. Palaeoecol. 441, 393–411. doi:10.1016/j.palaeo.2015.10.045
Schlanger, S. O., and Jenkyns, H. C. (1976). Cretaceous oceanic anoxic events: causes and consequences. Geol. Mijnb. 55, 179–184.
Schmid, S. M., Bernoulli, D., Fügenschuh, B., Matenco, L., Schefer, S., Schuster, R., et al. (2008). The Alpine-Carpathian-Dinaridic orogenic system: correlation and evolution of tectonic units. Swiss J. Geosci. 101, 139–183. doi:10.1007/s00015-008-1247-3
Schrag, D. P., DePaulo, D. J., and Richter, F. M. (1995). Reconstructing past sea surface temperatures: correcting for diagenesis of bulk marine carbonate. Geochim. Cosmochim. Acta 59, 2265–2278. doi:10.1016/0016-7037(95)00105-9
Sheldon, E., Ineson, J., and Bown, P. (2010). Late Maastrichtian warming in the boreal realm: Calcareous nannofossil evidence from Denmark. Palaeogeogr. Palaeoclimatol. Palaeoecol. 295, 55–75. doi:10.1016/j.palaeo.2010.05.016
Slater, S. M., Bown, P., Twitchett, R. J., Danise, S., and Vajda, V. (2022). Global record of ‘ghost’ nannofossils reveals plankton resilience to high CO2 and warming. Science 376, 853–856. doi:10.1126/science.abm7330
Ştefănescu, M., and Melinte, M. (1996). “Cretaceous - early Miocene subsidence and the related source and reservoir rocks in the Moldavids,”. Oil and Gas in Alpidic Thrustbelts and Basins of Central and Eastern Europe. Editors G. Wessly, and W. Liebl (EAPG Sp. Publ.), 5, 197–204.
Ştefănescu, M., Săndulescu, M., Butac, A., Pătruţ, I., and Zaharescu, P. (1981). “Genetical and structural relations between the flysch and (the East Carpathian model),” in The 12th Capatho-Balkan Geol. Assoc. Congr. Bucharest. Guidebook series (Bucharest, Romania: Geological Institute of Romania), 19, 1–91.
Ştefănescu, M. (1995). Stratigraphy and structure of the Cretaceous-Paleogene flysch deposits between Prahova and Ialomita valleys. Rom. J. Tect. Reg. Stratigr. 76, 4–49.
Ştefănescu, M., and Zamfirescu, M. (1964). Iviri noi de Vraconian-Cenomanian în zona conglomeratelor de Ciucaș-Zăganu. St. Cerc. Geol. Geofiz. Geogr. Geol. 9, 61–72.
Stoll, H. M., and Schrag, D. P. (2000). High-resolution stable isotope records from the Upper Cretaceous rocks of Italy and Spain: glacial episodes in a greenhouse planet? Geol. Soc. Am. Bull. 112, 308–319. doi:10.1130/0016-7606(2000)112<308:HSIRFT>2.0.CO;2
Street, C., and Bown, P. R. (2000). Palaeobiogeography of Early Cretaceous (Berriasian–Barremian) calcareous nannoplankton. Mar. Micropalaeontol. 39, 265–291. doi:10.1016/S0377-8398(00)00024-4
Švábenická, L. (2012). Nannofossil record across the Cenomanian—Coniacian interval in the Bohemian Cretaceous Basin and Tethyan foreland basins (Outer Western Carpathians), Czech Republic. Geol. Carpath., 63, 201–217. doi:10.2478/v10096-012-0018-2
Tiraboschi, D., Erba, E., and Jenkyns, H. C. (2009). Origin of rhythmic Albian black shales (Piobbico core, central Italy): Calcareous nannofossil quantitative and statistical analyses and paleoceanographic reconstructions. Paleoceanogr. 24, PA2222. doi:10.1029/2008PA001670
Tsikos, H., Jenkyns, H. C., Walsworth-Bell, B., Petrizzo, M. R., Forster, A., Kolonic, S., et al. (2004). Carbon-isotope stratigraphy recorded by the Cenomanian–Turonian Oceanic Anoxic Event: correlation and implications based on three key localities. J. Geol. Soc. 161, 711–719. doi:10.1144/0016-764903-077
Voigt, S., Gale, A. S., and Voigt, T. (2006). Sea-level change, carbon cycling and palaeoclimate during the late Cenomanian of northwest Europe; an integrated palaeoenvironmental analysis. Cretac. Res. 27, 836–858. doi:10.1016/j.cretres.2006.04.005
Wagreich, M., Lein, R., and Sames, B. (2014). Eustasy, its controlling factors, and the limno-eustatic hypothesis - concepts inspired by Eduard Suess. Austrian J. Earth Sci. 107, 115–131.
Wang, C., Hu, X. M., Jansa, L., Wan, X. Q., and Tao, R. (2001). The Cenomanian–Turonian anoxic event in southern Tibet. Cretac. Res. 22, 481–490. doi:10.1006/cres.2001.0271
Watkins, D. K. (1989). Nannoplankton productivity fluctuations and rhythmically-bedded pelagic carbonates of the Greenhorn Limestone (Upper Cretaceous). Palaeogeogr. Palaeoclim. Palaeoecol. 74, 75–86. doi:10.1016/0031-0182(89)90020-5
Watkins, D. K. (1992). Upper Cretaceous nannofossils from Leg 120, Kerguelen Plateau, Southern Ocean. Proceedings of the Ocean Drilling Program, Scientific Results, College Station, TX, 343–370. doi:10.2973/odp.proc.sr.120.180.1992
Watkins, D. K., Wise, S. W., Pospichal, J. J., and Crux, J. (1996). “Upper Cretaceous calcareous nannofossil biostratigraphy and paleoceanography of the Southern Ocean,” in Microfossils and Oceanic Environments (Aberystwyth: Aberystwyth Press), 355–338.
Keywords: Cenomanian-Turonian boundary, calcareous nannofossils, δ13C positive excursion, paleoenvironment, paleobiogeography
Citation: Melinte-Dobrinescu M, Ion G, Anton E, Apotrosoaei V, Briceag A and Lazăr C (2023) First record of Oceanic Anoxic Event 2 in the Eastern Carpathians: implications for chemostratigraphic and biostratigraphic correlations. Front. Earth Sci. 11:1155482. doi: 10.3389/feart.2023.1155482
Received: 31 January 2023; Accepted: 12 July 2023;
Published: 06 September 2023.
Edited by:
Xi Chen, China University of Geosciences, ChinaReviewed by:
Michael Wagreich, University of Vienna, AustriaCopyright © 2023 Melinte-Dobrinescu, Ion, Anton, Apotrosoaei, Briceag and Lazăr. This is an open-access article distributed under the terms of the Creative Commons Attribution License (CC BY). The use, distribution or reproduction in other forums is permitted, provided the original author(s) and the copyright owner(s) are credited and that the original publication in this journal is cited, in accordance with accepted academic practice. No use, distribution or reproduction is permitted which does not comply with these terms.
*Correspondence: Mihaela Melinte-Dobrinescu, bWVsaW50ZUBnZW9lY29tYXIucm8=
Disclaimer: All claims expressed in this article are solely those of the authors and do not necessarily represent those of their affiliated organizations, or those of the publisher, the editors and the reviewers. Any product that may be evaluated in this article or claim that may be made by its manufacturer is not guaranteed or endorsed by the publisher.
Research integrity at Frontiers
Learn more about the work of our research integrity team to safeguard the quality of each article we publish.