 Qinglin Chen1
 Chao Zhang
94% of researchers rate our articles as excellent or good
Learn more about the work of our research integrity team to safeguard the quality of each article we publish.
Find out more
ORIGINAL RESEARCH article
Front. Earth Sci., 20 March 2023
Sec. Geoscience and Society
Volume 11 - 2023 | https://doi.org/10.3389/feart.2023.1154791
This article is part of the Research TopicAdvances in Sustainable Mine Tailings ManagementView all 13 articles
The non-linear mechanical characteristics of tailings under high pressure are the research foundation of large-scale high tailings dams. Considering the high stress caused by high tailing ponds, consolidated drained triaxial shear tests were carried out. The deterioration mechanism of non-linear mechanics was revealed by particle crushing. The test results show that sample density has a great influence on volumetric strain under low pressure. However, volumetric strain is not related to sample density under high pressure. The shear strength of the tailings is significantly non-linear. The internal friction angle under low pressure can still be obtained by the traditional linear Mohr–Coulomb criterion and the internal friction angle under high pressure by the power function of the Mohr criterion. The particle crushing of tailings occurs not only at high pressure but also at low pressure. The value of the breakage index increases with sample density. The non-linear mechanics of shear strength are affected by particle breakage. The breakage index value increases linearly with increasing shear strength, indicating that the high density of the deep part of the tailings dam is prone to particle crushing, which affects the stability of the large-scale high dam.
Tailings are the lower-grade tailings residue after ore has been sorted and the tailings disposed of by manually constructing a tailings pond (Wu et al., 2020; Chen et al., 2023). More than 1.4 billion tons of tailings are disposed of in tailings ponds every year in China, and a total of 14.6 billion tons had been deposited in tailings ponds by 2014 (Zhou et al., 2020). Tailings dams are being piled higher and higher due to the numerous demands for mineral resources and the restricted use of land resources. At present, there are at least 26 tailings dams with a height greater than 100 m and at least 10 tailings dams with a storage capacity over 100 million m3. The highest tailings dam in the world is the Wanniangou tailings dam in Sichuan Province, China, with a total dam height of 325 m and a total storage capacity of 326 million m3 (Wang, 2014). The largest tailings dam in Asia is the Dexing No. 4 tailings dam, with a total dam height of 208 m and a storage capacity of 890 million m3. Stress in the deep regions of high tailings ponds has reached 4 MPa (Wu et al., 2017). Potential safety threats to the stability of the dam are becoming more prominent because the stress level in the dam increases with its height.
Catastrophic accidents caused by the collapse of high tailings dams occur frequently (Rico et al., 2008). Deaths from tailings dam instability are not uncommon. For example, on 18 October 2000, a tailings pond collapsed in Nandan County, Guangxi Province, leading to 28 deaths and 56 injuries (Guo, 2010). In 2008, a tailings pond collapsed in Xianfen County, Shanxi Province, causing a tailings discharge of 268,000 m3, covering an area of 30.2 ha, and resulting in 276 deaths and 34 injuries (Guo and Wu, 2009). On 5 November 2015, the collapse of a tailings pond in the state of Minas Gerais, Brazil led to 19 deaths and is considered the worst environmental disaster. On 25 January 2019, a tailings pond collapsed in Brumadinho, Brazil, leading to 58 deaths and 305 missing people (Zhang et al., 2020).
The statistical analysis of many tailings pond accidents reveals many reasons for tailings pond accidents, including rainstorms, overtopping, earthquake liquefaction, seepage failure, dam foundation instability, dam structure failure, and load increase. The final cause of dam instability, which mainly refers to changes in the stress fields and seepage fields of tailings dams caused by the aforementioned factors (Wang et al., 2021), is discussed. It is worth noting that the instability characteristics of tailings ponds are completely different at high stress and low stress, so it is necessary to study them. The mechanical characteristics of the soil are significantly different under high pressure than under low pressure. The strength of the soil under high pressure varies non-linearly and is accompanied by particle crushing. Slope stability prediction for large-scale high slopes is a complex, non-linear system problem (Wang G. G. et al., 2020; Wang J. X. et al., 2020). The compression and strength characteristics of tailings sand under high pressure were studied by Zhang (1995), who believed the shear strength envelope to be related to the saturation of tailings sand and drainage consolidation conditions. The shear strength parameter of tailings is significantly less in the deep zone than in the shallow zone (Zhang et al., 2010). To study the strength characteristics of tailings materials under high pressure, numerous triaxial tests were carried out under high pressure, as well as a power function Mohr strength criterion, as established by Liu et al. (2012). Wang et al. (2023) simulated the tailings pond accumulation process using soil tests and indoor physical model tests and found that the saturation line increased with increasing dam height in the physical model. The triaxial compression tests were carried out using a high-pressure triaxial apparatus by Zhang et al. (2020) and revealed that the tailings exhibit strain softening under low confining pressure and strain hardening under high confining pressure. Chen et al. (2022) conducted consolidated undrained axial shear tests with a high-pressure triaxial apparatus to study the mechanical behavior of sandwich tailings under high confining pressure and compared the results against tests under low confining pressure. The triaxial compression and triaxial elongation of Cambria sand under high pressure were carried out by Lade and Bopp (2005) and revealed that the internal friction angle of Cambria sand is larger in triaxial compression than in triaxial elongation.
In reality, the deposition structure of high tailings dams is very complex. Consolidated drained tests of tailings under high stress caused by high dam tailings ponds were carried out. The mechanical properties of three sets of tailings specimens with different initial densities were investigated. The deterioration mechanism of non-linear mechanics was explained by particle breakage.
Strain-controlled high-pressure triaxial equipment mainly includes four major components: a pressure testing machine, a high-pressure triaxial pressure chamber, a pressure volume controller, and a data acquisition system. The triaxial pressure chamber is made of stainless steel, with a wall thickness of 12 mm, and the perimeter pressure connection pipe is made of copper, with a maximum perimeter pressure of 5 MPa and a counterpressure of 1 MPa. The maximum travel of the motor is 80 mm. The maximum load of the axial load sensor is 60 kN, the maximum measurement range of the axial displacement sensor is 20 mm, and the volume variation capacity of the pressure volume controller is 200 mL. Three types of tests can be performed: unconsolidated undrained shear (UU shear), consolidated undrained shear (CU shear), and consolidated drained shear (CD shear). The high-pressure triaxial testing machine is shown in Figure 1.
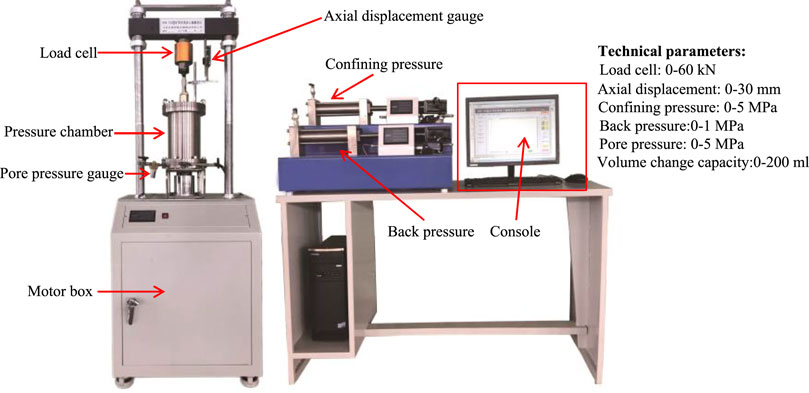
FIGURE 1. Strain-controlled high-pressure triaxial apparatus.
The tailings samples were taken from the No. 4 tailings dam in the Dexing copper mine in Jiangxi Province (Wu et al., 2017), the largest tailings dam in Asia, with a maximum design height of 208 m. The undisturbed tailings are gray and non-cohesive, with a particle-specific gravity of 2.7, an average particle size of 0.65 mm, and an inhomogeneity factor of 3.4. The tailings contain 1.4% cohesive particles, 12.1% powder particles, and 86.5% sand particles. The particle size distribution curve is shown in Figure 2 and the physical property indexes are shown in Table 1.
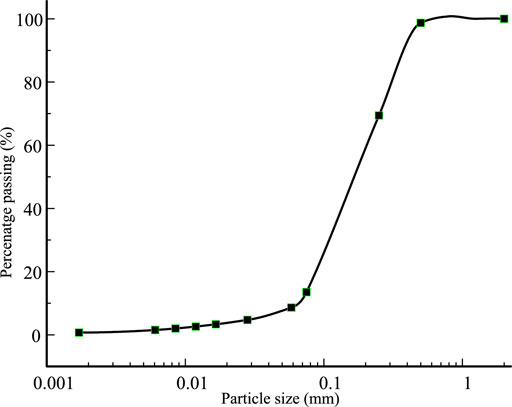
FIGURE 2. Particle size distribution of tailings.

TABLE 1. Mineral composition of tailings.
The German Bruker AXSD8-Focus X-ray diffractometer was used to analyze the mineral composition of the tailings, and the results are shown in Table 1. The tailings are mainly composed of quartz sand, with a content of 53.61%; the other mineral components are illite, plagioclase, dolomite, and calcite, in descending order of content. Microscopic SEM images of the tailing samples are shown in Figure 3. The tailings particles exist in granular form, and their surface morphology is uneven and angular. Some of the particles have sharp edges, and the particles do not have a uniform profile.
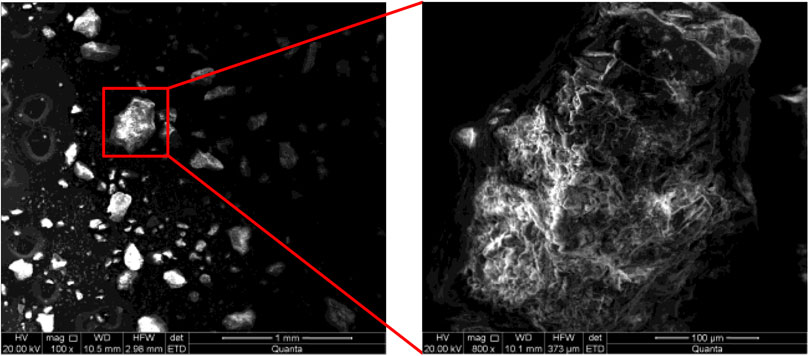
FIGURE 3. Shape topography of tailing particles.
According to test regulations (GB/T50123, 1999), the size diameter of the tailings sample in the triaxial test was 39.1 mm and the height was 80 mm. Specimen preparation was performed using the wet sample preparation method (Wood et al., 2008). The moisture content of the samples was 10%. To ensure homogeneity, the specimens were prepared by the layered tamped method: the prepared samples were poured into the sampler three times and were then tamped with a tamping rod. The contact surface of each layer was shaved.
To study the mechanical properties of tailings under high pressure, three densities of specimens were set to 1.4 g/cm3, 1.6 g/cm3, and 1.8 g/cm3, representing loose, medium, and dense tailings specimens. The test confining pressure was 0.2 MPa, 0.4 MPa, 0.8 MPa, 1.2 MPa, 2 MPa, 3 MPa, 4 MPa, and 5 MPa in this test. Less than 0.8 MPa is low confining pressure, and more than 0.8 MPa is high confining pressure. Because the accumulation rate of a tailings dam is slower than that of pore pressure dissipation during dam construction, the consolidated drained test method was adopted in this test. To prevent the rubber membrane being broken during the test, a reasonable thickness of the rubber membrane should be selected for different confining pressures. Based on the literature (Henkel and Gilbert, 1952; Ren, 2018), a rubber film with a thickness of 0.38 mm was chosen for specimens with confining pressures of less than 0.8 MPa. For specimens with confining pressures greater than 0.8 MPa and less than 2 MPa, a rubber film with a thickness of 0.5 mm was chosen. For specimens with a confining pressure greater than 2 MPa, a 1-mm rubber film was used. When a prepared tailings specimen is installed directly in the triaxial pressure chamber, the specimens are easily disturbed and damaged. Therefore, the freezing method was used before installing the specimen: the specimen was installed in the triaxial pressure chamber after freezing, then saturated using the head saturation method while the confining pressure was slowly applied. The shear rate was 0.074 mm/min, and the test was stopped when the axial strain reached 15% (GB/T50123 1999).
Isotropic compression tests were conducted on three tailings specimens with different densities under confining pressures of 0–5 MPa. The consolidation volume change in the test was measured by the drainpipe. After the consolidation time reached 4 h, the specimen pore pressure dropped to zero and the drainage volume was kept constant. Therefore, the specimen consolidation was close to stability after 4 h. The isotropic consolidation curves of tailings specimens with different densities could be obtained and are shown in Figure 4.
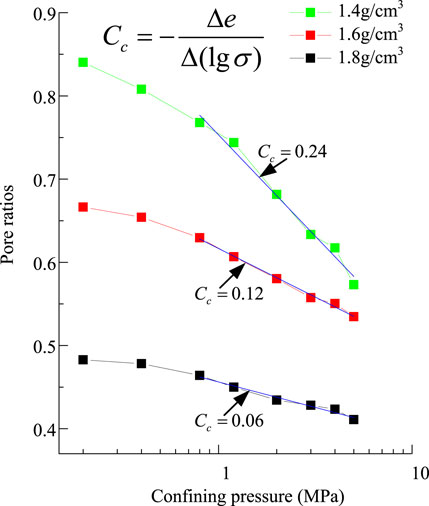
FIGURE 4. Consolidation curves of specimens with different densities.
The pore ratio of the specimens of three different densities decreased with increased confining pressure. The pore ratio for the three groups of specimens did not approach a fixed value in the pressure range of 5 MPa. The pore ratio for specimens with densities of 1.4 g/cm3 and 1.6 g/cm3 gradually approached 0.55. The pore ratio of the specimen with density of 1.8 g/cm3 still had a large deviation from the other two groups of specimens. The consolidation curves for three groups of specimens were curvilinear under low confining pressure and a straight line under high confining pressure. In the range of high confining pressure, the linear fitting method was used to obtain a straight-line segment; the slope of the straight-line segment could be expressed by the compression index Cc, defined as
In the formula,
Figure 5 presents the stress–strain curves of the tailings for specimens at the three different densities. For the specimens with densities of 1.4 g/cm3, the stress–strain curves are all strain-hardened. The stress increases with increasing axial strain, the strain-elastic phase is not obvious, and the specimens show mainly strain-plastic behavior.
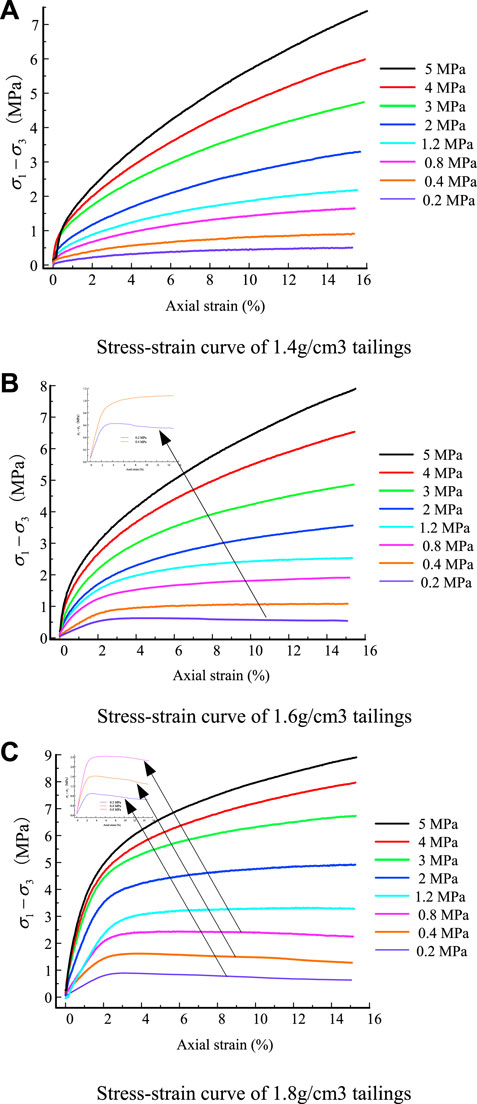
FIGURE 5. Stress–strain relationships of tailings for different densities. (A) Stress–strain curve for 1.4 g/cm3 tailings. (B) Stress–strain curve for 1.6 g/cm3 tailings. (C) Stress–strain curve for 1.8 g/cm3 tailings.
For the specimens with a density of 1.6 g/cm3, the stress–strain curve is only strain-softening at 0.2 MPa confining pressure and is strain-hardening at other confining pressures. At an axial strain of 0%–2%, the specimens mainly exhibit strain–elastic behavior with a rapid increase in stress. When the axial strain is greater than 2%, the specimen mainly exhibits strain–plastic behavior with a slow increase in stress.
For the specimens with a density of 1.8 g/cm3, the stress–strain curves under 0.2 MPa, 0.4 MPa, and 0.8 MPa confining pressure are of the strain-softening type. The stress increases rapidly and reaches a peak rapidly, then drops after the peak. The peak corresponds to an axial strain of 3%. Other stress–strain curves exhibit hardening types. The stress increases rapidly and then slowly with increasing axial strain.
In summary, the stress–strain curves of the specimens at high confining pressure (σ3>0.8 MPa) exhibit a strain-hardening type regardless of whether they are loose or dense specimens. The hardening behavior of the specimens increases with increasing confining pressure, which means that the specimens’ strain type at high pressure is independent of their density. At low pressures (σ3<0.8 MPa), the strain-softening behavior of the specimen is more likely to be present with increasing density. Dense specimens are prone to softening behavior under low pressure.
Figure 6 presents the relationship between the peak strength and confining pressure of different-density specimens. The higher the density of the specimen, the higher the peak strength. The difference between the peak strengths of the specimens increases with increased confining pressure. The peak strength shows a downward deflection, which indicates an obvious non-linear strength behavior of the tailings; this means that the strength parameter of the tailings is variable under high pressure and can be explained by the Mohr–Coulomb criterion. The criterion is expressed in Eq. 2:
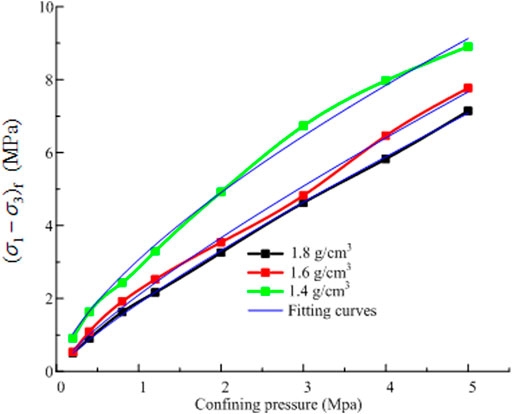
FIGURE 6. Relationship between shear strength and confining pressure.
Only when the strength parameter is a constant value is the relationship between the peak strength (σ1–σ3)f and the confining pressure σ3 linear, according to Eq. 2. An obvious non-linear strength behavior occurred in the test. Therefore, the strength parameter in Eq. 2 is variable. The internal friction angle is gradually decreasing because the strength is deteriorated by particle crushing under high pressure.
The relationship between the peak strength (σ1–σ3)f and the confining pressure under high pressures can be represented by the non-linear strength mathematical model proposed by Yin et al. (1980). It is defined as
where a and b are test constants.
The parameters a and b can be obtained by Eq. 3. The fitting results are shown in Table 2. The fitted curves are in good agreement with the peak strength. The parameter a, which increases with increasing specimen density, represents the linear growth rate of the peak strength. The parameter b decreases with increasing specimen density and represents the non-linear growth rate of the peak strength; it indicates that there are obvious non-linear strength behaviors for tailings specimens under high pressure.
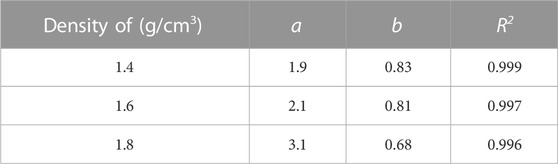
TABLE 2. Fitting parameters of shear strength.
Figure 7 presents the relationship between the initial elastic modulus and the confining pressure for different-density specimens. The initial elastic modulus is the slope of the stress–strain curve at the initial stage. The evolution law of the initial elastic modulus is similar to the peak strength. The initial modulus increases with confining pressure. The between the initial elastic modulus and the confining pressure is non-linear. It can be expressed by Eq. 4:
where c and d are the test constants.
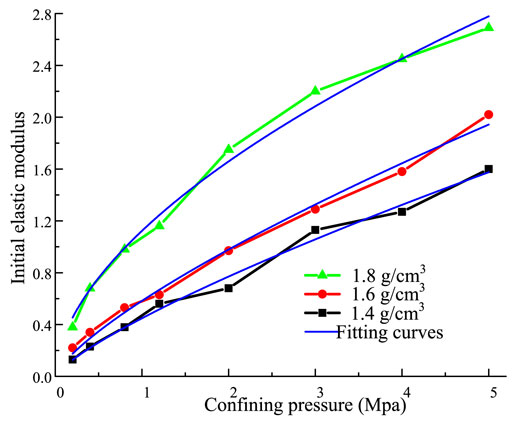
FIGURE 7. Relationship between initial elastic modulus and confining pressure.
The parameters c and d can be obtained by Eq. 4. The fitting results are shown in Table 3. The fitted curve is in good agreement with the initial elastic modulus. The parameters c and d have the same variation as the parameters a and b. The parameter c increases as the density of the specimen increases, which represents the linear growth rate of the initial elastic modulus. The constant d, which decreases with increasing specimen density, represents the non-linear growth rate of the initial elastic modulus.
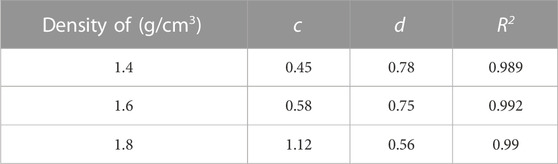
TABLE 3. Fitting parameters of the initial elastic modulus.
Figure 8 presents the maximum stress ratio of tailings with three different densities. The maximum stress ratio increases with the density of the specimen. The maximum stress ratio for the tailings of three different densities is significantly affected by the confining pressure and decreases with increasing confining pressure; the decreasing rate of the curve decreases with increasing confining pressure. When the confining pressure is 5 MPa, the maximum stress ratios of the tailings with three different densities are generally around 2.8. When the confining pressure is less than 0.8 MPa, the maximum stress ratio of tailings with three different densities decreases rapidly with increasing confining pressure. When the confining pressure is greater than 0.8 MPa, the maximum stress ratio of tailings with three different densities decreases slowly with increasing confining pressure. The Mohr–Coulomb criterion was rewritten by the stress ratio. It is expressed as
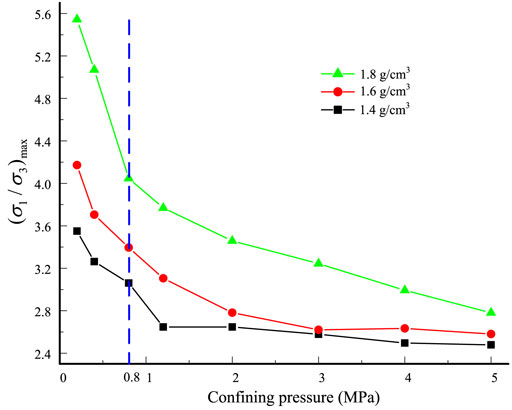
FIGURE 8. Maximum stress ratio of tailings for three different densities.
When the strength parameter is constant, the relationship between the maximum stress ratio and the confining pressure is hyperbolic. When the confining pressure is low, the maximum stress ratio is caused by the confining pressure because the strength parameter is constant. When the confining pressure is high, the strength parameter is variable due to particle breakage. The maximum stress ratio is caused by both confining pressure and particle breakage. Therefore, the relationship between the maximum stress ratio of the tailings and confining pressure under high confining pressure is not hyperbolic.
Figure 9 presents the volumetric strain of tailings with three different densities. For specimens with a density of 1.4 g/cm3, volumetric strain decreases with increasing axial strain. Shear shrinkage occurred for all specimens. The volumetric strain of the specimen increases with confining pressure. For the specimen with a density of 1.6 g/cm3, when the confining pressure was 0.2 MPa, the volumetric strain of the specimen decreased until the axial strain reached 2% and then increased with increasing axial strain. Shear dilation occurred. For the specimen under confining pressure of less than 0.2 MPa, the volumetric strain of the specimen decreased with increasing axial strain. Shear shrinkage occurred. For the specimen with a density of 1.8 g/cm3, when the confining pressure was less than 0.8 MPa, the volumetric strain of the specimen decreased until the axial strain reached 1% and then increased with increasing axial strain. Shear dilation occurred. When the confining pressure was more than 0.8 MPa, the volumetric strain of the specimen decreased with increasing axial strain. Shear dilation occurred.
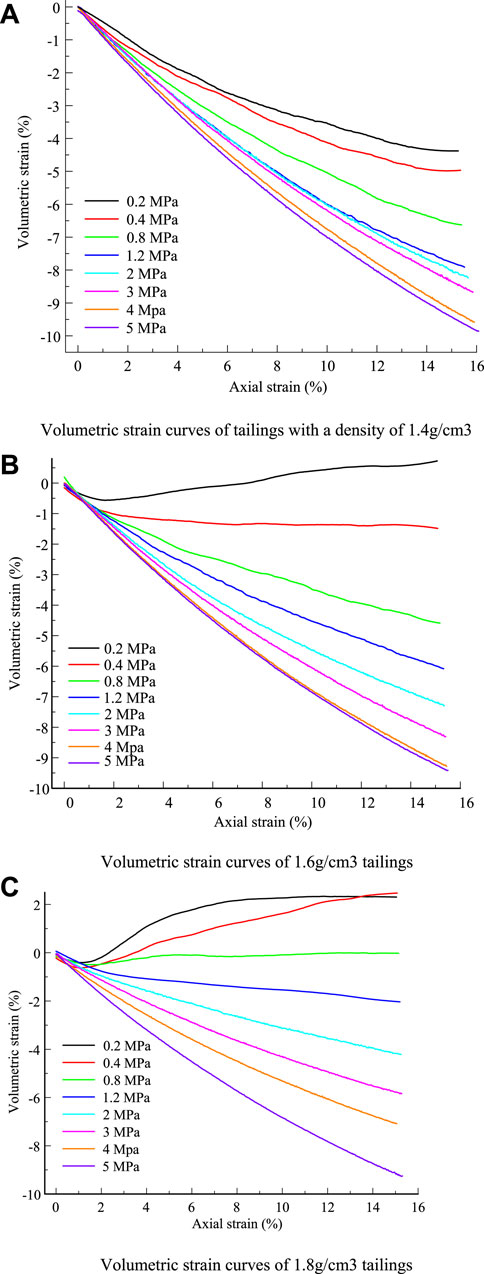
FIGURE 9. Volumetric strain of tailings for different densities. (A) Volumetric strain curves of tailings with a density of 1.4 g/cm3. (B) Volumetric strain curves of 1.6-g/cm3 tailings. (C) Volumetric strain curves of 1.8-g/cm3 tailings.
In summary, the density of the specimen has a great effect on volumetric strain under low pressure (a confining pressure of less than 0.8 MPa). There are two types of volumetric strain: 1) the volumetric strain of the sample decreasing with increasing axial strain and 2) the volumetric strain of the sample decreasing until it reaches a certain strain, and then increasing with increasing axial strain. These curves can be divided into three phases. 1) In the volumetric strain decrease stage, the particle pores are filled by tailings particles under axial pressure and confining pressure. The volume of the sample decreases until the volume reaches a minimum value, which is the expansion point. 2) In the volumetric strain increase stage, the particle pores increase due to the shear expansion effect. The volume of the sample increases. 3) In the volumetric strain-invariant stage, when the axial strain reaches a certain value, the volume of the specimen remains at a certain value, which is called the critical state. For the samples under confining pressure greater than 0.8 MPa, the volumetric strain of the specimen is negligibly affected by the density. The volumetric strain of all samples decreases with increasing axial strain, which can be explained by the mechanism of particle motion during shearing.
For dense specimens under low pressure, the motion of particles is mainly in the form of rotation and slip. The tailings particles are rearranged during the shear test. The pores between the particles of the dense specimen expand, resulting in an increase in the pores. The volume of the specimen increases.
For loose specimens under low pressure, the pores of the particles continue to be filled by the particles during the shearing process because the initial pores of the tailings are large. The volume of the specimen is decreased.
For specimens under high pressure, particle rotation and sliding are limited. The movement of particles is mainly particle breakage. The fine particle fragments continue to fill the particle pores, reducing the volume of the specimen. The specimen becomes more and more dense.
The volumetric strain curve of all specimens under high pressure decreases with increasing axial strain. To investigate the relationship between density and maximum volumetric strain of the specimen under high pressure, the relationship between maximum volumetric strain and confining pressure was drawn. Figure 10 presents the maximum volumetric strain under different confining pressures. The relationship between maximum volumetric strain and confining pressure was fitted, and the fitting coefficients of each curve were all greater than 0.9. The fitting function of each curve is shown as, respectively,
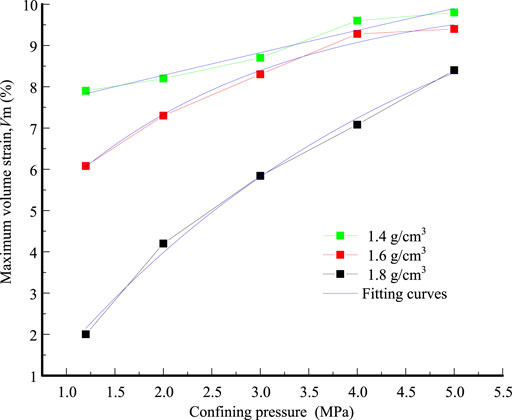
FIGURE 10. Maximum volume strain under different confining pressures.
The maximum volumetric strain of the tailing specimen increases exponentially in relation to the confining pressure. The increase rate decreases with increasing confining pressure. When the confining pressure is 5 MPa, the maximum volumetric strain is almost close to the certain value. A more interesting finding is that the maximum volume strain for different-density specimens will converge to the same value when the confining pressure σ3 tends to infinity. This means that the volumetric strain of the sample is greatly affected by density under low pressure and that the volume strain of the sample is independent of sample density under high pressure.
Numerous tests have shown that the linear Mohr–Coulomb strength theory is no longer applicable to high-stress-level conditions. To describe the strength characteristics under high stress, many non-linear strength criteria have been proposed. However, some disadvantages exist for these criteria. Because the shear stress index parameter is constant. The parabolic Mohr strength criterion causes limited adjustment of the bending degree of the curve, resulting in test data that do not fit well. For the hyperbolic Mohr strength criterion, a characteristic of the hyperbolic curve is that it has an asymptote; this causes the shear stress to vary approximately linearly with normal stress under high-stress conditions and to deviate from the experimental data. Charles and Watts (1980) proposed a power function Mohr strength criterion to overcome the shortcomings of the parabolic and hyperbolic Mohr strength criterion. Therefore, the power function Mohr strength criterion was used to describe the strength characteristics of tailings under high confining pressure in this paper. The power function Mohr strength criterion is expressed as
where m, n, and l are constant values.
The data were fitted by Eq. 7 using an iterative method. The detailed iterative steps are referred to in Liu et al. (2012). Figure 11 presents the power function Mohr envelope of the tailings with three different densities under high pressure. The fitting coefficients were all greater than 0.95, and the fitting formulas were as follows:
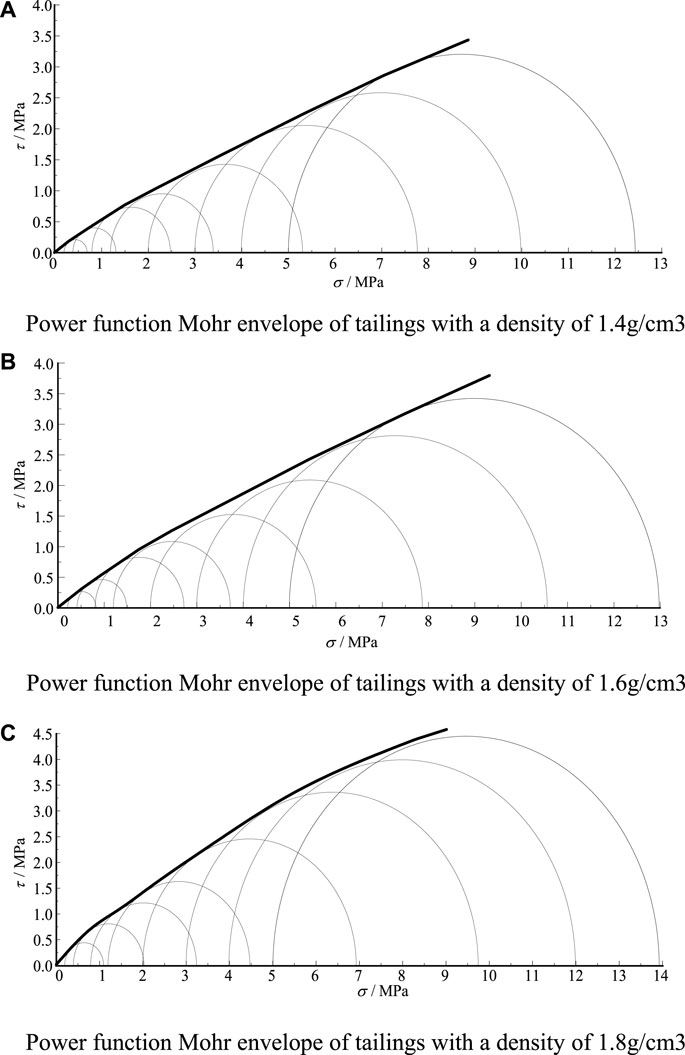
FIGURE 11. Power function Mohr envelope of tailings. (A) Power function Mohr envelope of tailings with a density of 1.4 g/cm3. (B) Power function Mohr envelope of tailings with a density of 1.6 g/cm3. (C) Power function Mohr envelope of tailings with a density of 1.8 g/cm3.
The strength characteristics of the tailings under high pressure are well-represented by the power function Mohr strength criterion. The linear growth rate of the strength envelope increases with increasing sample density, and the non-linear growth rate of the strength envelope decreases. The deviation between the internal friction angles calculated using Eq. 8 and those calculated by the conventional linear Mohr–Coulomb criterion under low confining pressure. Deviation increases with the increase of density and confining pressure, which is consistent with the conclusions obtained by Liu et al. (2012). It is recommended that the conventional linear Mohr–Coulomb criterion be used to obtain the internal friction angle under low confining pressures and that the power function Mohr strength criterion be used to obtain the internal friction angle under high confining pressures. The formula is calculated as
where φ is the internal friction angle, σ3 is the effective normal stress, c is the cohesion, and τ is the shear force.
The recommended internal friction angles of tailings at low and high pressures can be calculated by Eq. 9. The recommended values of the internal friction angle are shown in Table 4.
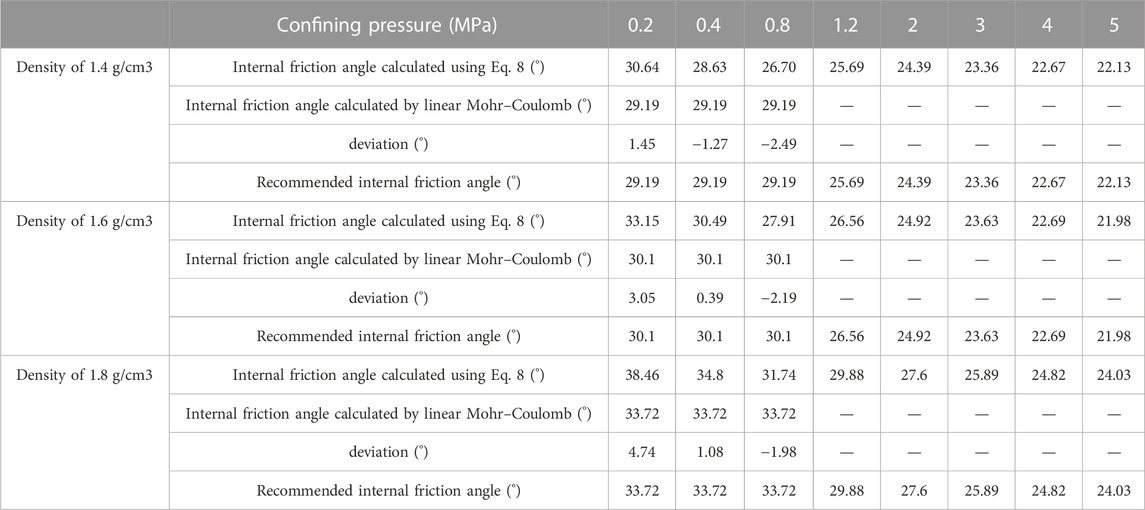
TABLE 4. Internal friction angle of tailings for different densities.
Figure 12 presents the relationship between the recommended internal friction angle and the confining pressure of samples of different densities. The internal friction angle of samples under high pressure is significantly lower than that of samples under low pressure. All three groups of specimens with different densities showed a large decrease in the internal friction angle, with a decrease of 7.06° for the loose specimen (1.4 g/cm3), 8.12° for the medium dense specimen (1.6 g/cm3), and 9.69° for the dense specimen (1.8 g/cm3). The internal friction angles of specimens with densities of 1.4 g/cm3 and 1.6 g/cm3 coincide when the confining pressure reaches 4 MPa. The internal friction angle of the specimen with density 1.8 g/cm3 also gradually approaches that of the other two groups of specimens. The significant reduction in the internal friction angle of the tailings under high pressure is very likely to destabilize the high-pile tailings dam. If strength parameters obtained under low pressure are used in the analysis of the stability of the high-pile tailings dam, the calculation results will undoubtedly be undesirable. Therefore, it is necessary that the test results be obtained under high pressure. For high-dam stability analysis, zoning assignment calculation is recommended.
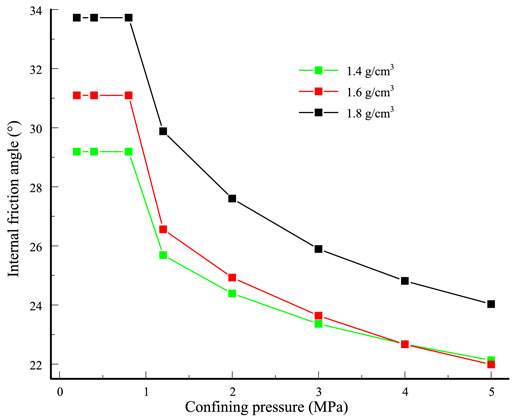
FIGURE 12. Relationship between the recommended internal friction angle and confining pressure of samples for different densities.
The mechanical behavior of geotechnical material is obviously affected by particle crushing. Therefore, the engineering structure will have less stability when particle breakage takes place. The deterioration mechanism of non-linear mechanics can be explained by particle breakage. To study the particle crushing of soil particles, Hyodo et al. (2002) and Nakata et al. (1999) both obtained information related to particle crushing using the marked particle method. The marked particle method, by which some particles are identified, was used in this study. Calcite was used as the marked particle because its hardness (Mohs hardness 3) is lower than that of quartz, which is the main mineral in the tailings. The surface of calcite particles is smooth and flat. It is easy to compare morphological changes before and after the test. The size of the marked particles was 5 mm, and the marker particles were placed in the middle of the specimen so that they would be in similar stress environments.
To compare the effect of density on particle crushing, the marked particles before and after the test, under confining pressure of 4 MPa, were compared; Figure 13 presents the morphological changes in the marked particles before and after the test. There were large differences in the surfaces of the marked particles before and after the test. The number of indentations at the marked particles increased with the density of the specimen, indicating that particle crushing is more prone to occur in dense samples.
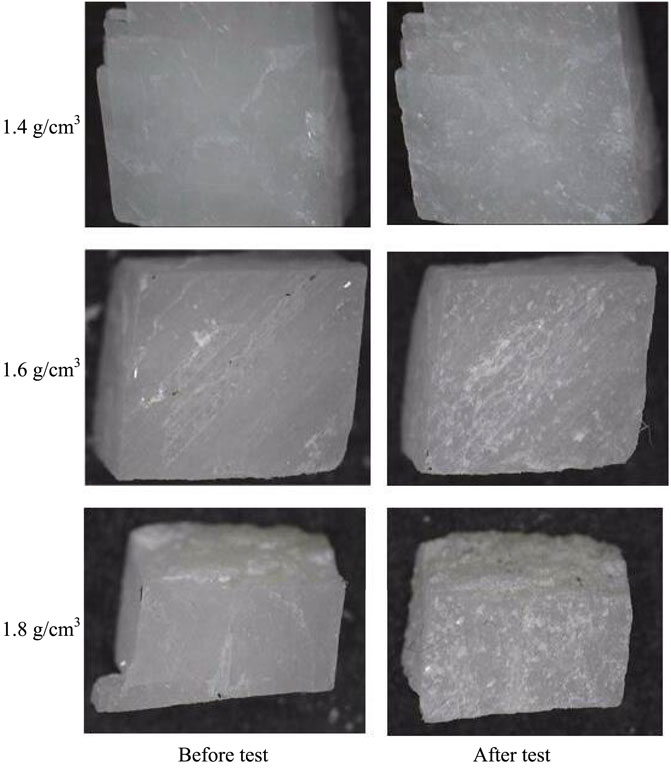
FIGURE 13. Morphological changes of calcite particles before and after testing for different densities.
The degree of particle breakage can be defined by the breakage index. Several methods have been proposed to quantify the amount of particle breakage. These methods are empirical in nature. Some are based on a single particle size, while others are based on aggregate changes in the overall grain size distribution. The most widely accurate particle breakage indices were developed by Einav (2007), who modified the definition of Hardin’s breakage index. The improved relative breakage index Br proposed by Einav overcomes the disadvantage of the breakage index proposed by Hardin, which requires the artificial setting of an arbitrary cut-off value.
The Hardin’s breakage index is defined as
where Br is the breakage index, Bt is total breakage, and Bp is breakage potential.
The improved relative breakage index is defined as
where Br is the breakage index. F0, Ft, and Fu are the cumulative areas of particle size distributions before testing, after testing under current confining pressure, and after testing under ultimate confining pressure, respectively.
The improved relative breakage index Br has a range of 0–1. Br=0 means that particle crushing does not occur, and Br=1 means that the particles are completely crushed. In this paper, the improved relative breakage index Br was used to quantify the particle crushing of tailings under high pressure. Figure 14 presents the relationship between the particle breakage index and confining pressure.
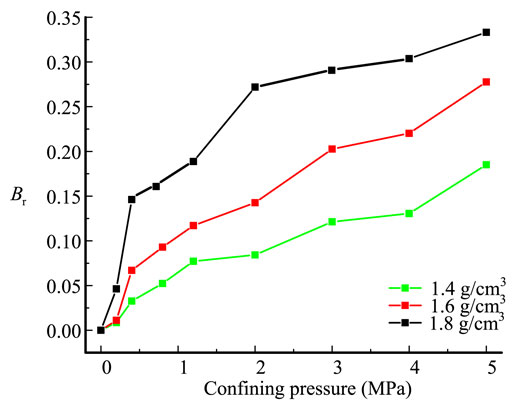
FIGURE 14. Relationship between the particle breakage index and confining pressure.
The value of Br increases with increasing confining pressure, and the growth rate decreases with increasing confining pressure. The particle crushing of tailings occurs not only under high pressure but also under low pressure. For different-density specimens, the larger the density of the tailing specimen, the greater the particle crushing. This indicates that when the height of the tailings dam is large, the mechanical properties of the tailings will continue to deteriorate under high pressure, which is detrimental to the stability of the high dam.
To explain the finding of the non-linear mechanics of shear strength under high confining pressure, the relationship between the particle breakage index and shear strength was drawn, as shown in Figure 15. The blue dashed lines represent the fitting trend lines. For tailings with three different densities, the value of Br increases linearly with increasing shear strength. The fitting trend lines are roughly parallel, which indicates that the non-linear mechanics of shear strength is affected by particle breakage. The degree of particle breakage can be explained by non-linear mechanical behavior.
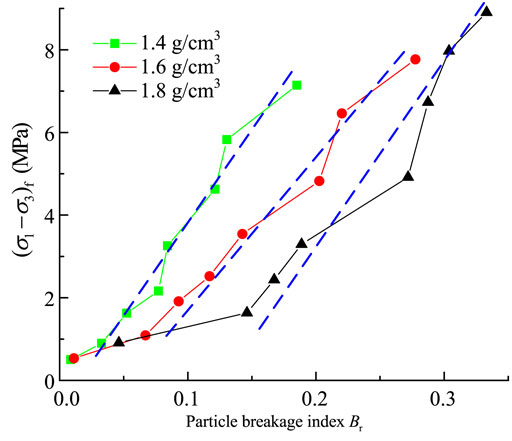
FIGURE 15. Relationship between the particle breakage index and shear strength.
For the high stress caused by large high-dam tailings ponds, consolidated drained tests of tailings under high stress were carried out. Isotropic consolidation compression and stress–strain curves of tailings specimens were obtained for three different densities under high stress, and particle crushing was studied. The main conclusions are as follows.
(1) The compression index Cc decreases with increasing specimen density under isotropic consolidation. All stress–strain curves of the specimens exhibit strain hardening under high pressure. The dense specimens are prone to softening behavior under low pressure. The volumetric strain of the sample is greatly affected by density under low pressure, and the volumetric strain of the sample is independent of its density under high pressure.
(2) The strength and initial modulus of the tailing specimen increase with increasing confining pressure. The shear strength of the tailings is significantly non-linear. The internal friction angle under low pressure can be obtained by the linear Mohr–Coulomb criterion, and the internal friction angle under high pressure can be obtained by the power function Mohr strength criterion.
(3) The marked particle method was used to qualitatively study particle crushing during tailings shearing. The number of indentations at the marked particles increases with the density of the specimen. Particle crushing is more prone to occur with dense samples.
(4) The value of Br increases with increasing confining pressure, and the growth rate decreases with increasing confining pressure. The value of Br increases linearly with increasing shear strength. The non-linear mechanics of shear strength is affected by particle breakage. The degree of particle breakage can be explained by non-linear mechanical behavior.
The original contributions presented in the study are included in the article/Supplementary Material; further inquiries can be directed to the corresponding author.
Conceptualization, CQ and LZ; methodology, ZC; validation, CQ; supervision, CQ; writing—original draft preparation, ZD, ZX and LZ; writing—review and editing, ZD, LZ, ZX and WX.
The research was supported by the National Natural Science Foundation of China (No. 52104085).
The authors declare that the research was conducted in the absence of any commercial or financial relationships that could be construed as a potential conflict of interest.
All claims expressed in this article are solely those of the authors and do not necessarily represent those of their affiliated organizations, or those of the publisher, the editors, and the reviewers. Any product that may be evaluated in this article, or claim that may be made by its manufacturer, is not guaranteed or endorsed by the publisher.
Charles, J. A., and Watts, K. S. (1980). The influence of confining pressure on the shear strength of compacted rockfill. J. Géotech. 30 (4), 353–367. doi:10.1680/geot.1980.30.4.353
Chen, Q. L., Li, Z. G., Dai, Z. Y., Wang, X. J., and Zhang, C. (2022). Mechanical properties of tailings with dipping interlayers under high confining pressure. J. Geomech. Eng. 31 (6), 557–571. doi:10.12989/gae.2022.31.6.000
Chen, M., Jing, X., Xie, D., Li, X., Zhang, Y., and Liu, X. (2023). Prediction modelinvestigations of the reinforced finegrained tailings dam overtopping failure. Front. Earth Sci. 1-9. doi:10.3389/feart.2022.1075588
Einav, I. (2007). Breakage mechanics—part I: Theory. J. J. Mech. Phys. Solids 55 (6), 1274–1297. doi:10.1016/j.jmps.2006.11.003
Guo, Z. S., and Wu, Y. Q. (2009). Soil and water loss prediction and treatment of tailings dam. J. J. Soil Water Conserv. 23 (4), 59–63.
Guo, Z. S. (2010). The stability analysis of high tailings dam and the research on key consolidation technique. Xi'an University of Technology.
Henkel, D. J., and Gilbert, G. D. (1952). The effect measured of the rubber membrane on the triaxial compression strength of clay samples. J. Géotech. 3 (1), 20–29. doi:10.1680/geot.1952.3.1.20
Hyodo, M., Hyde, A. F., Aramaki, N., and Nakata, Y. (2002). Undrained monotonic and cyclic shear behaviour of sand under low and high confining stresses. J. Soils Found. 42 (3), 63–76. doi:10.3208/sandf.42.3_63
Lade, P. V., and Bopp, P. A. (2005). Relative density effects on drained sand behavior at high pressures. J. J. Jpn. Geotech. Soc. soils Found. 45 (1), 1–13. doi:10.3208/sandf.45.1_1
Liu, H. M., Yang, C. H., Zhang, C., Mao, H. J., and Cao, J. (2012). Study of characteristics of power function Mohr strength criterion for tailings material under high pressures. J. Rock Soil Mech. 33 (7), 1986–1992. doi:10.16285/j.rsm.2012.07.037
Nakata, A. F. L., Hyde, H., Hyodo, M., and Murata, (1999). A probabilistic approach to sand particle crushing in the triaxial test. J. Geotech. 49 (5), 567–583. doi:10.1680/geot.1999.49.5.567
Ren, J. (2018). The mechanical properties of Fujian standard sand in high pressure triaxial test. Northeast Electric Power University.
Rico, M., Benito, G., Salgueiro, A. R., Dí, , ez-Herrero, A., and Pereira, H. G. (2008). Reported tailings dam failures: A review of the European incidents in the worldwide context. J. J. Hazard. Mater. 152 (2), 846–852. doi:10.1016/j.jhazmat.2007.07.050
Wang, G. J., Hu, B., Tian, S., Ai, M., Liu, W. L., and Kong, X. Y. (2021). Seepage field characteristic and stability analysis of tailings dam under action of chemical solution. J. Sci. Rep. 11 (1), 4073–4111. doi:10.1038/s41598-021-83671-6
Wang, G. J., Zhao, B., Wu, B. S., Zhang, C., and Liu, W. L. (2023). Intelligent prediction of slope stability based on visual exploratory data analysis of 77 in situ cases. J. Int. J. Min. Sci. Technol. 33 (1), 47–59. doi:10.1016/j.ijmst.2022.07.002
Wang, G. G., Tian, S., Hu, B., Kong, X. Y., and Chen, J. (2020). An experimental study on tailings deposition characteristics and variation of tailings dam saturation line. J. Geomech. Eng. 23 (1), 85–92. doi:10.16058/j.issn.1005-0930.2020.01.014
Wang, J. X., Chen, S. L., and Dong, J. H. (2020). Elastic-plastic constitutive model and program implementation based on the generalized Doubleτ2 strength theory. J. J. Basic Sci. Eng. 28 (01), 160–173. doi:10.16265/j.cnki.issn1003-3033.2020.04.025
Wang, Y. W. (2014). Application of enhanced blind drain in Wan Nian Gou tailing pond. J. Eng. Constr. 46 (05), 31–33+43.
Wood, F. M., Yamamuro, J. A., and Lade, P. V. (2008). Effect of depositional method on the undrained response of silty sand. J. Can. Geotech. J. 45 (11), 1525–1537. doi:10.1139/t08-079
Wu, S., Yang, C., Zhang, C., Zhang, X., and Wang, G. (2017). The effects of silt content on the mechanical properties of tailings. J. Chin. J. Rock Mech. Eng. 36 (8), 2007–2017. doi:10.13722/j.cnki.jrme.2016.1456
Wu, L. G., Xiao, L. X., Liu, X. F., Yao, C., Jiang, Q. H., and Zhou, C. B. (2020). Influence of particle size on overtopping dam break of tailings dam. J. China Saf. Sci. J. 30 (4), 160–165.
Yin, J. Y., Lai, A. N., and Jiang, P. (1980). Strength and deformation characteristics of tailings under high pressure. J. Chin. J. Geotech. Eng. 2 (2), 1–10.
Zhang, Y. X., He, J. G., and Guo, Z. S. (2010). Study on tailing accumulation characteristics of high tailings dam. J. Chin. Molybdenum Ind. 34 (5), 8–12. doi:10.13384/j.cnki.cmi.1006-2602.2010.05.001
Zhang, C., Chen, Q. L., Pan, Z. K., and Ma, C. K. (2020). Mechanical behavior and particle breakage of tailings under high confining pressure. J. Eng. Geol. 265, 105419–105511. doi:10.1016/j.enggeo.2019.105419
Zhang, J. L. (1995). Dynamic characteristics of tailing ore under periodic load. J. Northwest Water Resour. Water Proj. 6 (1), 66–72.
Zhou, X. Y., Liu, Y. H., Wang, Z. Y., Xiong, W. Y., Yu, X. M., Zhao, K., et al. (2020). Genetic diversity of bacteria in bioremediation system of iron mine tailing by Robinia pseudoacacia-Ryegrass-Trifolium repens. IOP Conf. Ser. Earth Environ. Sci. 467 (1), 012145. doi:10.1088/1755-1315/467/1/012145
Keywords: tailings, high pressure, non-linear mechanics, particle crushing, breakage index
Citation: Chen Q, Li Z, Zhang C, Dai Z, Wang X and Zhang X (2023) Non-linear mechanical characteristics of tailings in large-scale high tailings dams. Front. Earth Sci. 11:1154791. doi: 10.3389/feart.2023.1154791
Received: 31 January 2023; Accepted: 03 March 2023;
Published: 20 March 2023.
Edited by:
Lijie Guo, Beijing Mining and Metallurgy Technology Group Co., Ltd., ChinaReviewed by:
Guangjin Wang, Kunming University of Science and Technology, ChinaCopyright © 2023 Chen, Li, Zhang, Dai, Wang and Zhang. This is an open-access article distributed under the terms of the Creative Commons Attribution License (CC BY). The use, distribution or reproduction in other forums is permitted, provided the original author(s) and the copyright owner(s) are credited and that the original publication in this journal is cited, in accordance with accepted academic practice. No use, distribution or reproduction is permitted which does not comply with these terms.
*Correspondence: Chao Zhang, MjAxNzIwMDEwMDRAY3F1LmVkdS5jbg==
Disclaimer: All claims expressed in this article are solely those of the authors and do not necessarily represent those of their affiliated organizations, or those of the publisher, the editors and the reviewers. Any product that may be evaluated in this article or claim that may be made by its manufacturer is not guaranteed or endorsed by the publisher.
Research integrity at Frontiers
Learn more about the work of our research integrity team to safeguard the quality of each article we publish.