
94% of researchers rate our articles as excellent or good
Learn more about the work of our research integrity team to safeguard the quality of each article we publish.
Find out more
ORIGINAL RESEARCH article
Front. Earth Sci., 24 August 2023
Sec. Volcanology
Volume 11 - 2023 | https://doi.org/10.3389/feart.2023.1153288
This article is part of the Research TopicLinking Subaqueous, Subglacial, and Subaerial Volcanism: How Water Influences Eruption Dynamics and Creation of Volcanic ProductsView all 10 articles
 J. Schmith1*
 D. A. Swanson2
Explosive eruptions at basaltic volcanoes remain poorly understood. Kīlauea Volcano is a type locality for basaltic eruptions and is well-known for effusive activity. However, more than 7 m of phreatomagmatic Keanakākoʻi Tephra unit D deposits from explosive eruptions crown the southern rim of the summit caldera and provide a stark reminder of Kīlauea’s explosive past and future potential. We used detailed field observations as well as granulometric and morphological analysis of 100 samples from two proximal sections to assess the eruption style and fragmentation mechanism. The deposits can be divided into four subunits, six different lithofacies, and contain three juvenile tephra components. Each juvenile component shows distinct shape variability resulting from molten fuel-coolant interaction (MFCI) explosions of magma of variable vesicularity. Fragmentation of dense glass generates olive-green ash, fragmentation of low to moderately vesicular magma generates a dark gray ash-lapilli component, and fragmentation of highly vesicular magma generates light-yellow pumice. Our work shows that magma structure impacts MFCI explosion efficiency. Small-scale planar bedding throughout most of the deposit points to a general eruption style of small, frequent explosions generating low plumes. Thicker beds of accretionary lapilli of fine-extremely fine ash are related to very efficient magma-water mixing. Pyroclastic density current (PDC) deposits in the upper part of the stratigraphy contain at least three flows but show no significant dune or cross-bedding structures. We suggest that this is a function of the vent being situated in a caldera that was then ∼600 m deep, where the caldera wall acted as a barrier and changed the flow dynamics to very dilute overspills and co-PDC plume falls over the wall. Deconvolution modeling of the polymodal grain size distributions is used to assess grain size changes of each juvenile component for this deposit, which greatly improves interpretation of lithofacies generation and eruption dynamics. Size-correlated shape parameters show that shape data across a wide size range are needed to accurately track grain shapes. This study demonstrates how careful examination of grain size and shape of juvenile tephra clasts can help volcanologists understand how effusive basaltic volcanoes can become violently explosive.
Hazards from volcanic eruptions are largely dependent on eruption style (Brown et al., 2017) and the distinction between effusive and explosive eruptions is particularly important (Cassidy et al., 2018). Lava flows typically provide a local hazard (Blong, 1984), whereas explosive eruptions can impact large areas and cause severe disruption and death (Cassidy et al., 2018). Thus, one of the most important questions is to understand how, why, and when volcanic eruptions become explosive rather than effusive.
Kīlauea Volcano in Hawai`i is the type locality for low-hazard Hawaiian fountains (Houghton and Gonnermann, 2008) and is famous for its effusive lava flows, but several meters of tephra deposits at the summit points to a more violent past of explosive activity (Swanson et al., 2014). It is therefore an ideal place to study processes that turn effusive volcanoes explosive. One such process is interaction of erupting magma with external water. In this paper we develop evidence that such phreatomagmatic interaction was crucial for driving some of Kīlauea’s past explosions.
Kīlauea is an ocean island basalt shield volcano rising 1,247 m above sea level in the middle of the Pacific Ocean. Eruptive activity is concentrated in the 3–5 km wide summit collapse caldera and the East and Southwest Rift Zones (Figure 1). Geochemical studies show predominance of tholeiitic basalts (Garcia et al., 2018) and point to a two-tiered summit reservoir system together with geophysical evidence (Poland et al., 2014).Recent studies have recognized a cyclic eruptive behavior at Kīlauea with alternating explosive and effusive eruptive periods lasting several centuries (Swanson et al., 2014). The explosive periods are characterized by lower erupted volumes than those of the effusive periods, and the source area of the largest explosive eruptions is constrained to the summit caldera area. The explosive periods are preceded by large-volume effusive activity and large-scale summit caldera collapse event(s) (Powers, 1948; Swanson et al., 2014; Lynn and Swanson, 2022), but the mechanism responsible for the shift in the dominating eruptive style is still unknown.
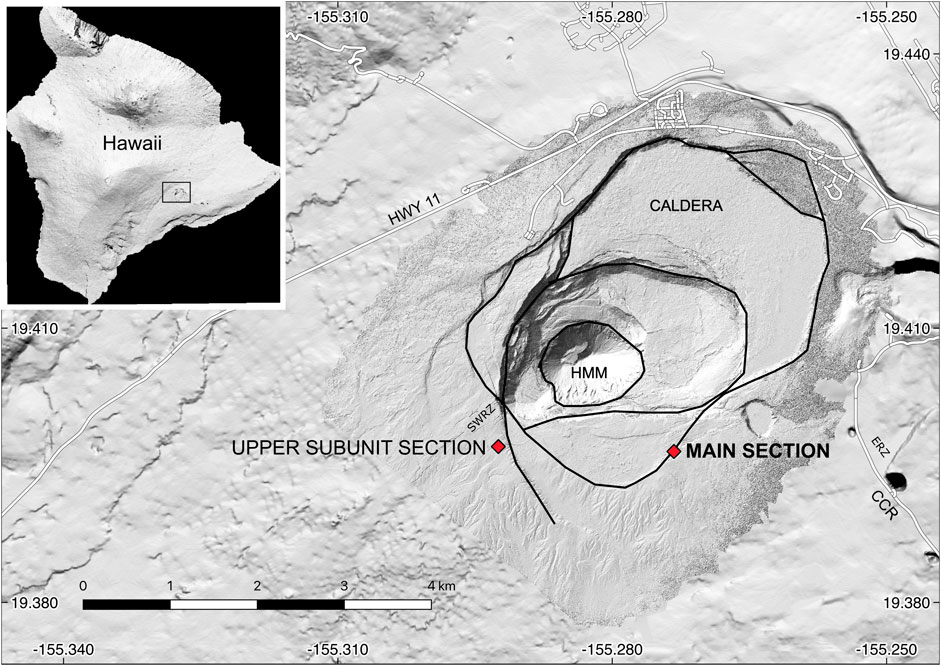
FIGURE 1. Map of Kīlauea summit with insert of map of the Island of Hawaiʻi with rectangle showing main map area. The summit caldera of Kīlauea (CALDERA) and Halema’uma’u Crater (HMM) are outlined with solid black lines. The Southwest Rift Zone (SWRZ) and East Rift Zone (ERZ) are indicated by labels. Red diamonds mark the field sections in the south caldera area that were used in this study. At the main section 723 cm of unit D was described and sampled (samples 1–93). At the upper subunit section 19 cm of the uppermost part of unit D was described and sampled (samples 94–100). CCR: Chain of craters road.
When part of the caldera collapsed in 2018 (Neal et al., 2019), there was speculation about the nature of the next eruption at Kīlauea summit (Nadeau et al., 2020). In July 2019 a water lake formed in Halema’uma’u Crater within the caldera and became the first documented presence of a lake at Kīlauea summit. Immediately, the lake’s presence raised concerns about explosive magma-water interaction if magma were to erupt though the lake (Nadeau et al., 2020), and it became timely to better understand the past phreatomagmatic activity at the summit.
The Keanakākoʻi Tephra (Keanakākoʻi) is the youngest and best exposed tephra package of Kīlauea (e.g., Powers, 1948; McPhie et al., 1990; Swanson and Houghton, 2018). It consists of up to 11 m of tephra (units A-L, Swanson and Houghton, 2018) with deposits from diverse eruption styles such as high Hawaiian lava fountains (units B, K1, and K2, May et al., 2015; Biass et al., 2019; Swanson and Houghton, 2018), subPlinian plumes (unit E, Swanson and Houghton, 2018), and phreatic plumes and pyroclastic density currents (PDCs) (units I, J1 and J2, Swanson et al., 2015).
Unit D of the Keanakākoʻi has long been interpreted as a phreatomagmatic deposit based on field appearance (Decker and Christiansen, 1984; McPhie et al., 1990; Swanson and Houghton, 2018) with some evidence of elevated glass volatile content associated with premature water-induced magma quenching (Mastin, 1997; Mastin et al., 2004). The deposits consist primarily of planar beds of juvenile clasts, which compose around 95% of the 1–2 mm size fraction according to componentry analysis (Swanson and Houghton, 2018). Most beds contain a small amount of wall-rock material, and some beds contain pumice lapilli up to 3–5 cm in diameter. The predominantly juvenile nature of the unit D deposits makes them ideal for granulometric and morphological study to evaluate the hypothesis that phreatomagmatism was responsible for the explosions.
The stratigraphy of Keanakākoʻi deposits has been redefined several times (Powers, 1948; Decker and Christiansen, 1984; McPhie et al., 1990). Here, we follow the stratigraphic nomenclature of Swanson and Houghton (2018): units A to L in order of decreasing age and deposit characteristics published therein. This latest revision of the Keanakākoʻi stratigraphy was informed by extensive field observations and 14C ages obtained throughout the entire summit region (Swanson et al., 2012). Unit D can be correlated with subunits 2A (IIA) and 2B (IIB) from Decker and Christiansen. (1984) adapted by, e.g., Mastin. (1997) and Mastin et al. (2004) but is difficult to correlate directly with other stratigraphies.
Most of the Keanakākoʻi in the southern part of the summit area is made of unit D. The thickest exposure, about 7 m, is in the southern caldera wall. Exposures on the northern side of the caldera are less than 2 m thick, probably reflecting both a southern source area and deposition by the prevailing northeast trade wind (McPhie et al., 1990). An isopach map of unit D shows that the deposit abruptly thins in eastern and western directions from the summit caldera (Swanson and Houghton, 2018). The prevalence of trade wind deposition suggests that the plume(s) did not reach the jet stream at ca. 5 km above sea level. A smaller northern lobe probably indicates influence by the southerly winds, which blow at the summit 10%–15% of the time. The deposit also thins abruptly even in the downwind southwest direction consistent with low plume heights as well as poor preservation conditions.
Unit D was erupted after the caldera collapse ca. 1500 CE and ended before the mid 17th century as indicated by 14C ages and stratigraphic relations to units B and E (Swanson et al., 2012). Unit D overlies small pockets of unit B reticulite on the southwest side of the caldera and thick unit C (a local block fall deposit) on the northeast side. Swanson and Houghton. (2018) suggested that unit D is capped by 1 cm of lithic-rich ash with accretionary lapilli in the southern caldera. However, our field data show that erosion cutting into strata took place between deposition of units D and E and that this 1 cm deposit was not part of unit D. Furthermore, the field data show that unit D had two different source areas in the caldera, such that the vent moved geographically in the later stage of the activity.
Here we present a detailed study of unit D deposits and focus on characterizing proximal deposits using systematic sampling of selected sections. We use new field observations of deposit components, lithofacies, and stratigraphy as well as granulometric and 2D shape parameter modeling to assess eruption style and fragmentation mechanism of this phreatomagmatic activity. This enables us to determine the style of the explosions that created the tephra and to evaluate the role of external water in the explosive processes at Kīlauea.
Lithofacies within unit D have been defined according to the classification scheme and grain size definitions following White and Houghton. (2006). Stratigraphic subdivisions in the form of subunits are based on lithofacies associations as well as regional unconformities.
The aim of the sampling was to get a high-resolution stratigraphic profile of the unit D deposits that would allow interpretation of temporal and process-related changes in eruptive activity. Two sections were sampled in detail (Figure 1) to characterize the deposit. Most of unit D was sampled in the southern part of the caldera wall at our main section (Figure 1), but the uppermost part was sampled at the upper subunit section (Figure 1) in a gully just southwest of the caldera. We sampled the thickest accessible exposure of each subunit, assuming this represents the proximal section with the highest temporal stratigraphic resolution. Induration of ash-dominated layers is common in the lower part of the section, and samples were scraped off as gently as possible with a toothless butterknife. All other samples were taken from loose deposits and were scooped out with spatulas and toothless knives. We collected a total of 100 samples for this study.
We used dynamic image analyzers CAMSIZER P4 and CAMSIZER X2 (hereafter P4 and X2) to obtain sample grain size distributions (GSDs) as well as quantitative shape parameters for all 100 samples. Both CAMSIZER instruments have a two-camera setup of a basal wide-angle camera and a high-resolution zoom camera to cover as wide a grain size range as possible with a frame rate of 300 frames per second. Both instruments disperse the sample from a vibrating feeder to ensure random orientation of the grains. The P4 instrument covers the size range 30,000–20 microns for reliable grain size data and analyses grains as they fall from the feeder in front of the cameras. However, a large size range within a single sample can be problematic, as larger grains create turbulent fall conditions for the finer particles, and the fine ash can aggregate into larger clumps that will skew the GSD. Therefore, we sieved the samples at 1 mm and split them between the two instruments. The X2 covers the size range 4,000–0.8 microns for grain size data and offers higher resolution for the ash size range than the P4. We chose an X2 instrument setup with an X-jet module using pressurized air to ensure laminar grain transport with good grain dispersal and to avoid fine ash aggregation.
Samples were dried at 65°C for at least 24 h, and indurated samples were mechanically disaggregated by hand. Loose lapilli-bearing samples were sieved at 1 mm, the splits were weighed, and grains larger than 1 mm were measured on the P4 whereas ash of less than 1 mm was measured on the X2. Samples of pure ash were analyzed only on the X2. Grain size distributions obtained from the P4 and X2 were merged using the split-weight proportions. In this study we use the minimum maximum chord Xcmin as the size parameter for all samples, because this parameter is compatible with traditional sieve sizes (CAMSIZER manual, 2020, version 0002). GSD statistics were obtained using GRADISTAT software (Blott and Pye, 2001).
For our quantitative 2D particle shape analysis we used means of shape data for half phi grain sizes for each sample (X2 ˂1 mm and P4 ˃1 mm) and whole sample means of X2 and P4 shape data weighted by sample weight fractions measured on each instrument. The resolution of the P4 was 67.3 microns per pixel for the basal camera and 11.8 microns per pixel for the zoom camera. The resolution was 9.9 microns per pixel for the basal camera and 0.84 microns per pixel for the zoom camera on the X2. This translates to a resolution of 173.4–624,255.3 pixels/particle for the P4 basal camera and 5,638–20,306,186.4 pixels/particle for the zoom camera for the 1 mm–3 cm grain size range. Particle resolutions of the X2 were 31.30–32,053.8 pixels/particle for the basal camera and 4,348–4,424,778,4 pixels/particle for the zoom camera for the modeled grains of 62.5 microns–1 mm. Zoom camera data are favored by the CAMSIZER software algorithm for fine fractions, and all shape parameters are well within the CAMSIZER resolution requirements. The number of particles analyzed per sample is in the range of several thousands, thus exceeding minimum recommendations from Schmith et al. (2017) of at least 1,500 analyzed grains per bulk sample.
We use the CAMSIZER parameters of sphericity, aspect ratio, compactness, and Krumbein roundness. Sphericity is defined as SPHT =
All parameters are dimensionless, ranging between 1 and 0, and were chosen so that grain size would not directly influence the shape modeling. Sphericity compares the area of the grain to the perimeter in a mathematical relation, so a perfect sphere (i.e., 2D circle) will have the value of 1, and it is a widely used measure of the overall regularity of the grain (e.g., Dürig et al., 2021; Edwards et al., 2021). Irregularities in grain morphology from either grain elongation (form), complex grain shapes (morphological roughness), surface perturbations (textural roughness) or a combination of all will result in relatively longer perimeters compared to the area increase and yield lower sphericity values. However, perimeter is also sensitive to resolution with higher resolutions resulting in longer perimeters (Schmith et al., 2017), but the CAMSIZERS use an image processing algorithm to minimize this effect. Aspect ratio compares width and length of the grain showing grain elongation (form) with values of 1 representing equant grains. Compactness compares the similar area circle diameter of the grain to the maximum caliper dimension (Femax), so a perfect sphere (i.e., 2D circle) will have the value of 1 and it is a measure of form/morphological roughness. Krumbein roundness is a mathematical adaption of the Krumbein roundness classification scheme (Krumbein, 1941) and is a measure for surface roughness of the grain.
Unit D contains three different juvenile components: olive-green ash, dark gray ash and lapilli, and light yellow pumice lapilli. Photos of typical component assemblages are shown in Figure 2. Deposits also contain a minor lithic component making up a few percent of the deposit (Mastin et al., 2004; Swanson and Houghton, 2018), which is often difficult to distinguish from the dark gray ash and lapilli (see grain in Figure 2). Deposits are generally loose, though high concentrations of fine-extremely fine ash form consolidated beds that stand out in eroded field sections.
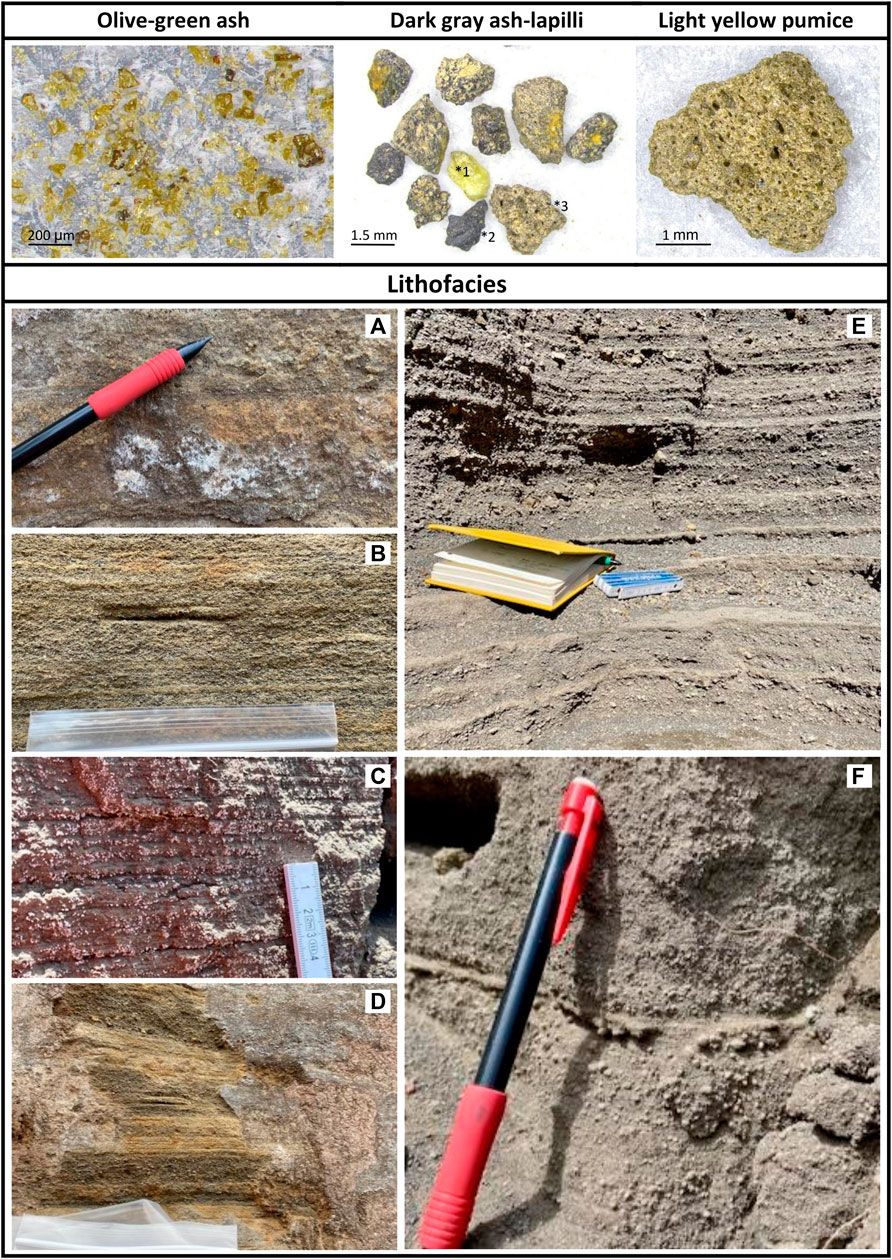
FIGURE 2. Top row: microscope photos in transmitted light of typical grains/grain assemblages representing the three juvenile components in the unit D deposits. See text for detailed descriptions. Free olivine (*1), lithic grain (*2), and pumice grain (*3) are included in the dark gray ash assemblage to represent the complete componentry of this size range. Notice how the olive-green ash fills vesicles on dark gray ash. Below: Representative photos of unit D lithofacies: (A) fine homogeneous ash–here shown with preserved accretionary lapilli features, (B) coarse homogeneous ash with noticeable content of olive-green ash and 15 cm wide sample bag, (C) laminated ash, (D) ash-lapilli beds with light yellow pumice lapilli showing after cleaning secondary outcrop coating with 15 cm wide sample bag, (E) couplets of ash-lapilli and ash beds with distributed clasts of pumice lapilli, (F) poorly sorted ash shown here with the most well-defined bedding exposed in the section. Notice clast-supported accretionary lapilli and grain size contrast of distributed clasts above and below fine ash trace.
The olive-green ash is a juvenile ash made of angular, dense, equant, blocky to platy sideromelane shards (see photo in Figure 2). It occurs throughout unit D. Grain size ranges from medium ash to extremely fine ash.
The dark gray ash and lapilli component consists of juvenile medium ash to medium lapilli of angular–subangular, dense to scoriaceous grains with vesicularities of ca. 0%–50% (visual estimate), mostly 10%–30% (see photo in Figure 2). Grains are commonly micro-vesicular, and larger vesicles are typically less than 100 microns in diameter. Most vesicles are spherical, though some are slightly ellipsoidal, and most are filled with fine olive-green ash (see photo in Figure 2). Grain shapes are blocky, typically with straight faces and edges. Phenocrysts of olivine or free olivine crystals are generally associated with the dark gray ash, which is commonly partly coated by olive-green ash.
Pumice clasts are light yellow, but some have orange palagonite patches. Clasts range between coarse ash and large lapilli in size. Vesicles are spherical to ellipsoidal and typically less than 100 microns in diameter. Medium–coarse fragments of pumice lapilli are typically angular-subangular. Some have millimeter-thick glassy rinds, interpreted as products of fast quenching, on one side of the grain. Many clasts are broken in situ in the deposit. Coarse pumice ash and fine lapilli are typically subangular to well-rounded with no quench rinds and can be extracted whole from the deposit (see photo Figure 2).
Unit D contains six different lithofacies (Figures 2A–F): fine homogeneous ash, coarse homogeneous ash, laminated ash, poorly sorted ash, ash-lapilli, and ash-lapilli couplets.
Fine homogeneous ash (F hom, Figure 2A) appears as millimeter-to centimeter-thick planar beds of well-sorted, olive-green, medium–extremely fine ash. A hard secondary silicic surface shell on parts of the outcrop face makes it difficult to assess the presence of accretionary lapilli in a consistent manner. However, layers of framework-supported, moderately sorted, structured accretionary lapilli, typically with a dark gray coarse ash core, characterize some of the fine homogeneous ash layers.
Coarse homogeneous ash (C hom, Figure 2B) forms millimeter-to centimeter-thick planar beds of moderately sorted dark gray coarse ash. Close inspections shows that most coarse ash beds contain unstructured fine olive-green ash, which gives the beds a flecked appearance.
Laminated ash (PL, Figure 2C) is a collection of planar-bedded, millimeter-thick laminae of dark gray coarse ash and olive-green fine ash forming packages centimeters to decimeters thick. In a few places low-angle cross-bedding or very low amplitude (mm scale) pinch and swells are observed. The length scale of the pinching and swelling structures is difficult to assess but is probably on a decimeter scale. These structures are defined only by a few of the millimeter-thin laminae and are easily overlooked.
Poorly sorted ash (PS, Figure 2F) consists of decimeters to meters of fine to very fine olive-green ash with distributed, isolated coarse ash clasts of dark gray ash and rounded pumice grains covered in fine ash. A diffuse bedding is defined by slight color changes in the deposit as well as by millimeter-thin extremely fine ash traces of a light gray color, but it is difficult to discern actual bedding. Low-angle cross-bedding and low degree pinching- and swelling patterns are observed but uncommon, and it was not possible to measure the length or amplitude. No dune structures have been identified in this lithofacies.
Ash-lapilli (AL, Figure 2D) appears as centimeter thick planar beds of poorly sorted, dark gray coarse ash to medium lapilli containing a few percent free olivine crystals and lithic clasts as well as 10%–15% pumice lapilli.
Couplet deposits (CL, Figure 2E) are defined by planar-bedded couplets of very poorly sorted dark gray coarse ash to medium lapilli beds and moderately to well sorted fine olive-green ash beds. The dark gray ash-lapilli beds are typically 1–12 cm thick, whereas the olive-green ash beds are 0.2–2 cm. However, seemingly thick dark gray ash-lapilli beds commonly contain one or more millimeter-thin layers or traces of the olive-green ash. A few ash-lapilli beds show inverse size grading, but most are not graded. The dark gray beds contain a few percent free olivine crystals and lithic clasts, and both bed-types contain pumice clasts. Olivine crystals are typically 0.5–1 mm long and euhedral, though some crystals are broken. Lithic fragments are mainly of ash size and consist of dull, gray, angular basalt, some of which is oxidized. Pumice occurs in the coarse ash to large lapilli size range and dominates in the larger size ranges with average maximum length of ca. 0.5–1 cm. The medium-large pumice lapilli fragments are distributed as isolated clasts in the ash-lapilli beds but are commonly distributed along the olive-green ash traces within or at the interface between an ash-lapilli and an olive-green ash bed. The pumice clasts form 5%–70% of individual couplet beds based on visual field assessment.
Our study confirms that the unit D deposits are phreatomagmatic, in line with previous work (Decker and Christiansen, 1984; McPhie et al., 1990; Mastin, 1997; Mastin et al., 2004; Swanson and Houghton, 2018). More specifically, the dense, juvenile, blocky, and platy sideromelane olive-green shards that make up the fine–extremely fine ash fractions throughout the deposit (Figure 2) are prime examples of grains typical of phreatomagmatic interaction (e.g., Heiken, 1974; Wohletz, 1983a; Büttner et al., 2002; Murtagh and White, 2013; White and Valentine, 2016; Schmith et al., 2017; Verolino et al., 2022). The same can be said for the blocky and equant juvenile dark gray ash–lapilli grains with spherical/elliptical isolated microvesicles and variable but low vesicularities (e.g., Walker and Croasdale, 1972; Mastin et al., 2004; Verolino et al., 2022), and previous studies have already demonstrated the association of the less characteristic pumice component with phreatomagmatic eruption(s) (Mastin, 1997; Mastin et al., 2004).
Phreatomagmatic activity generating wet eruption plumes is also supported by observations of coating of the observed dark gray ash with olive-green ash (e.g., Nemeth and Kosik, 2020) and the prevalent poor sorting of the deposit, including the large intra-bed grain size range, and fine to extremely fine ash presence across the entire deposit (Walker and Croasdale, 1972; Sheridan and Wohletz, 1983; Wohletz, 1986; Nemeth and Kosik, 2020). Clast-supported accretionary lapilli beds with structured aggregates that have well-defined finer ash rinds point to a wet plume environment with high fine ash content and liquid water droplets nucleating on coarse ash grains (Van Eaton et al., 2012), which is typically observed in association with phreatomagmatic activity (Brown et al., 2012; Durant and Brown, 2016).
Based on the planar bedding, we interpret the lithofacies of fine homogeneous ash, coarse homogeneous ash, laminated ash, ash-lapilli beds, and all couplets as fall deposits. The regional distribution pattern indicates that they were deposited by small plumes or jets. The laminated deposits show a nice separation between coarser and finer ash, which suggests short-lived bursts with enough time for material to settle gravitationally between explosions, but not enough time for the winds on the southern side of the caldera to rework these deposits. This suggests fast accumulation rates of this lithofacies.
The homogeneous lithofacies suggests continuous settling of material related to sustained tephra generation at the vent. The relatively fine grain sizes could either result from a low plume height or indicate intense fragmentation. The coarser grain size of the ash-lapilli beds suggests higher plumes or less intense fragmentation at the vent.
The couplets are the most complex fall deposits. Their well-defined layering indicates either swift waxing and waning of the plume or discrete explosive episodes. The thin fine ash layers within the thicker ash-lapilli beds suggest that these lithofacies result from discrete explosive episodes of variable size and duration. The distribution of the pumice along traces of olive-green ash indicates some density-driven fractionation from the tephra plume; however, the generally poorly sorted nature and distribution of pumice throughout the beds also point to a proximal source and a densely tephra-laden plume.
The poorly sorted ash lithofacies with cross-bedding, pinching-swelling patterns, and matrix-supported distributed coarse ash grains covered in fine ash suggest dilute PDC deposits with poorly structured matrix-supported accretionary lapilli. The poorly defined bedding makes it difficult to subdivide the lithofacies into individual flows or flow and fall units. Interestingly, the deposit does not show prominent dunes, and the pinching-swelling structures are small enough in amplitude to be easily overlooked. This is atypical for near-vent surge deposits and will be explored further in the discussion.
A stratigraphic column of unit D is presented in Figure 3. We divide unit D into four subunits based on the stratigraphic distribution of the lithofacies as well as the observation of several unconformities. The base of unit D rests on the pāhoehoe lava flows (age ca. 1350 CE, Neal and Lockwood, 2003; Swanson et al., 2012) and local erosional remnants of unit B across the southern caldera. The basal unit D subunit is dominated by ash lithofacies of coarse and fine homogeneous ash and planar bedded laminated ash, but also contains three ash-lapilli beds and is as thick as 265 cm in the caldera wall. We call it the lower ash-dominated subunit (LAS, Figure 3). It is conformably overlain by up to 176 cm of continuous couplets of dark gray ash and lapilli and olive-green ash, which we call the lower lapilli-bearing subunit (LLS, Figure 3). The top of the LLS represents a disconformity with an undulating top on small and large lateral scales cutting into the planar bedded strata in exposures across the south caldera area with the uppermost deposit stripped of fine ash, suggesting widespread regional erosion. The level of erosion varies randomly based on location, and in places several decimeters of the stratigraphy identified at the main section is missing. Therefore, the 176 cm of LLS exposed at the main section is likely less than the maximum original thickness of the subunit. An ash-dominated lithofacies overlies this erosional unconformity, with up to 282 cm of poorly sorted ash and planar bedded laminated ash lacking obvious signs of erosion at the top of the subunit at the main section. This is the upper ash-dominated subunit (UAS, Figure 3). All three subunits are thickest in the south caldera wall in the main section (Figure 1) and thin away from this area. The uppermost subunit of D, the upper lapilli-bearing subunit (ULS, Figure 3) consisting of another set of continuous couplets, deviates from this distribution pattern. Its thickest exposure is about 2 km farther west in a gully just west of the caldera wall (see upper subunit section, Figure 1). The deposit is as thick as 19 cm and conformably overlies the UAS in several places. This subunit is conformably overlain by a 1-cm-thick ash layer, which was interpreted by Swanson and Houghton (2018) as capping unit D with units E and F above. However, the lithology and color of the 1-cm ash layer is different from the ash-dominated subunits of unit D, and it was erupted after another erosion event that removed the ULS completely in some places. Therefore, we do not consider it part of unit D.
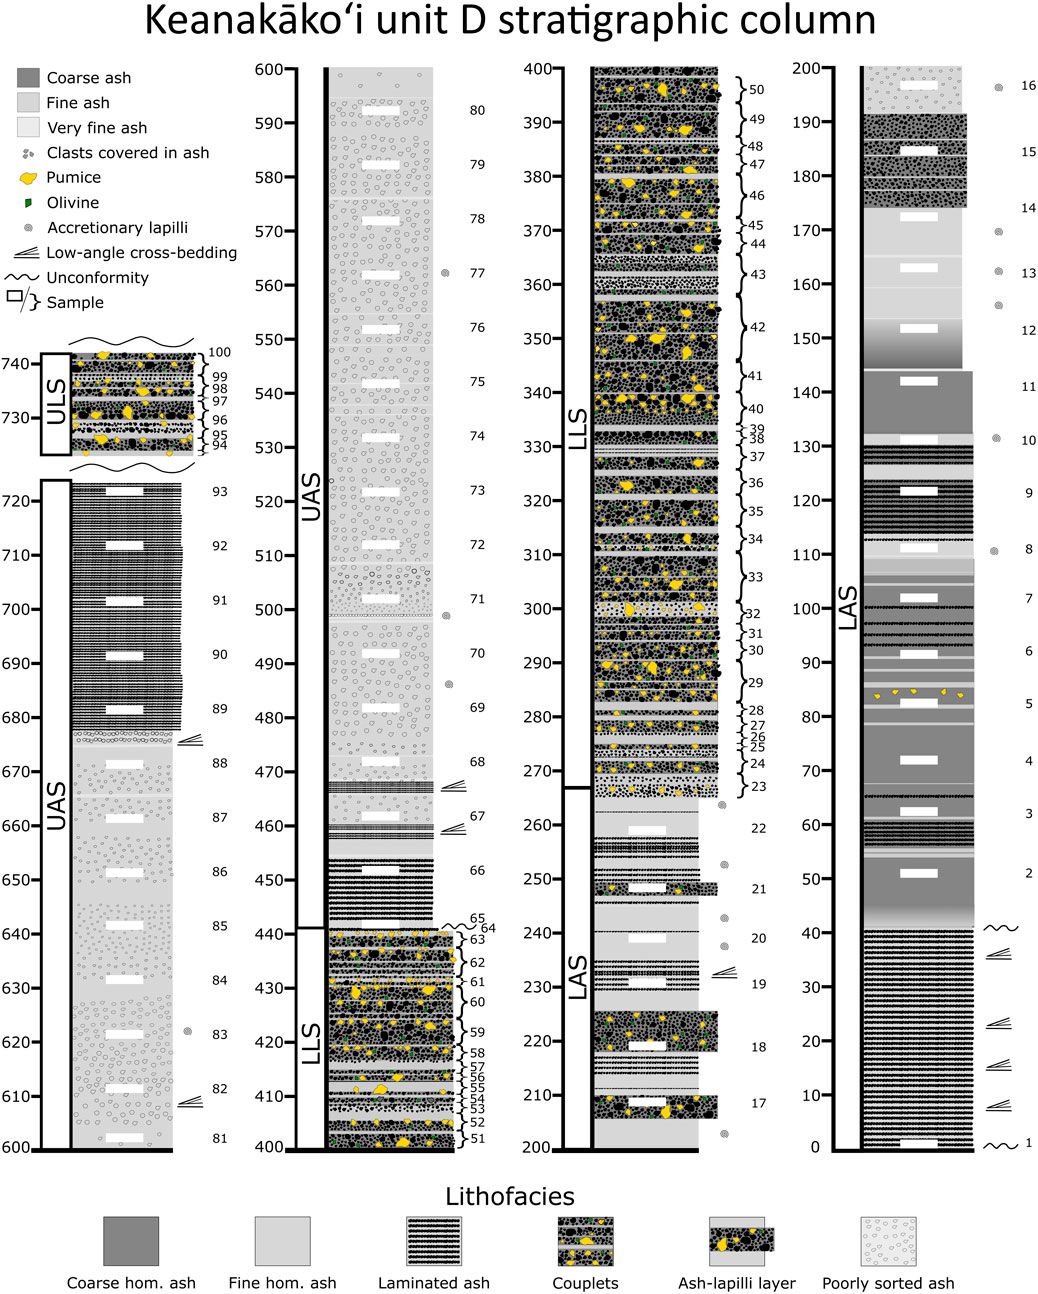
FIGURE 3. Composite stratigraphic column of unit D in Kīlauea south caldera with scale in centimeters. Gray-scale colors of column indicate matrix grain size as outlined in legend, whereas individual clasts from coarse ash to medium lapilli are drawn as individual grains to depict main features of the deposit. Relative amount of pumice and olivine are scaled to field observation on individual layers, though the olivines are oversized here for visibility purposes. Horizontal width of column indicates approximate grain size of lithofacies. LAS: lower ash-dominated subunit, LLS: lower lapilli-bearing subunit, UAS: upper ash-dominated subunit, ULS: upper lapilli-bearing subunit. The LAS, LLS, and UAS were all measured at the main section (Figure 1), whereas the ULS was measured and sampled at the upper subunit location (Figure 1). Samples are marked with white rectangles for the ash-dominated subunits (LAS and UAS) and by curly brackets for the lapilli-bearing subunits (LLS and ULS) with all sample numbers noted to the right of each column. Please zoom in on electronic version to see details if needed and refer to Figure 2 and text for description of lithofacies. See text for detailed descriptions of stratigraphy.
The stratigraphic position of the 100 samples from the composite section is shown in Figure 3. The ash-dominated subunits were sampled every 10 cm from top to bottom, and each sample is 2–3 cm thick. The lapilli-bearing subunits were sampled as couplets from top to bottom based on thicker olive-green ash layers. It was not possible to separate the olive-green ash layers from the loose ash-lapilli layers and often both layers contained traces of the other, so we decided the couplet sampling was the best approach in practice. Samples typically consist of an olive-green ash bed above an ash and lapilli bed, although the ash and lapilli beds often contain one or more millimeter traces of olive-green ash. The couplet samples range significantly in total thickness as well as relative thickness of olive-green ash beds and ash and lapilli beds. Samples 1–22 represent the LAS, samples 23–63 the LLS, samples 64–93 the UAS, and samples 94–100 the ULS couplets.
We classified the 100 samples according to their lithofacies. The classification is summarized in table 1. We noted 11 samples taken from planar bedded laminated deposits (PL) and 23 samples from the poorly sorted, diffusely bedded ash deposits (PS). There are 15 samples of homogeneous ash including nine samples of coarse homogeneous ash (C hom) and 6 of fine homogeneous ash (F hom). Samples from the ash-lapilli and olive-green ash couplets comprise two categories, couplet samples (CL) dominated by dark gray ash and lapilli and fine couplet samples (Fine CL) largely dominated by the olive-green ash beds. We also distinguish between couplets from the LLS and ULS, as they were extracted from different sections. In the LLS, there are 29 couplet samples (CL) and 12 fine-dominated couplet samples (Fine CL). The seven ULS couplet samples consist of five lapilli-bearing couplets (CL ULS) and two fine ash beds (CL fine ULS). Finally, three individual ash-lapilli beds come from the LAS (AL). All lithofacies are well represented by several samples.
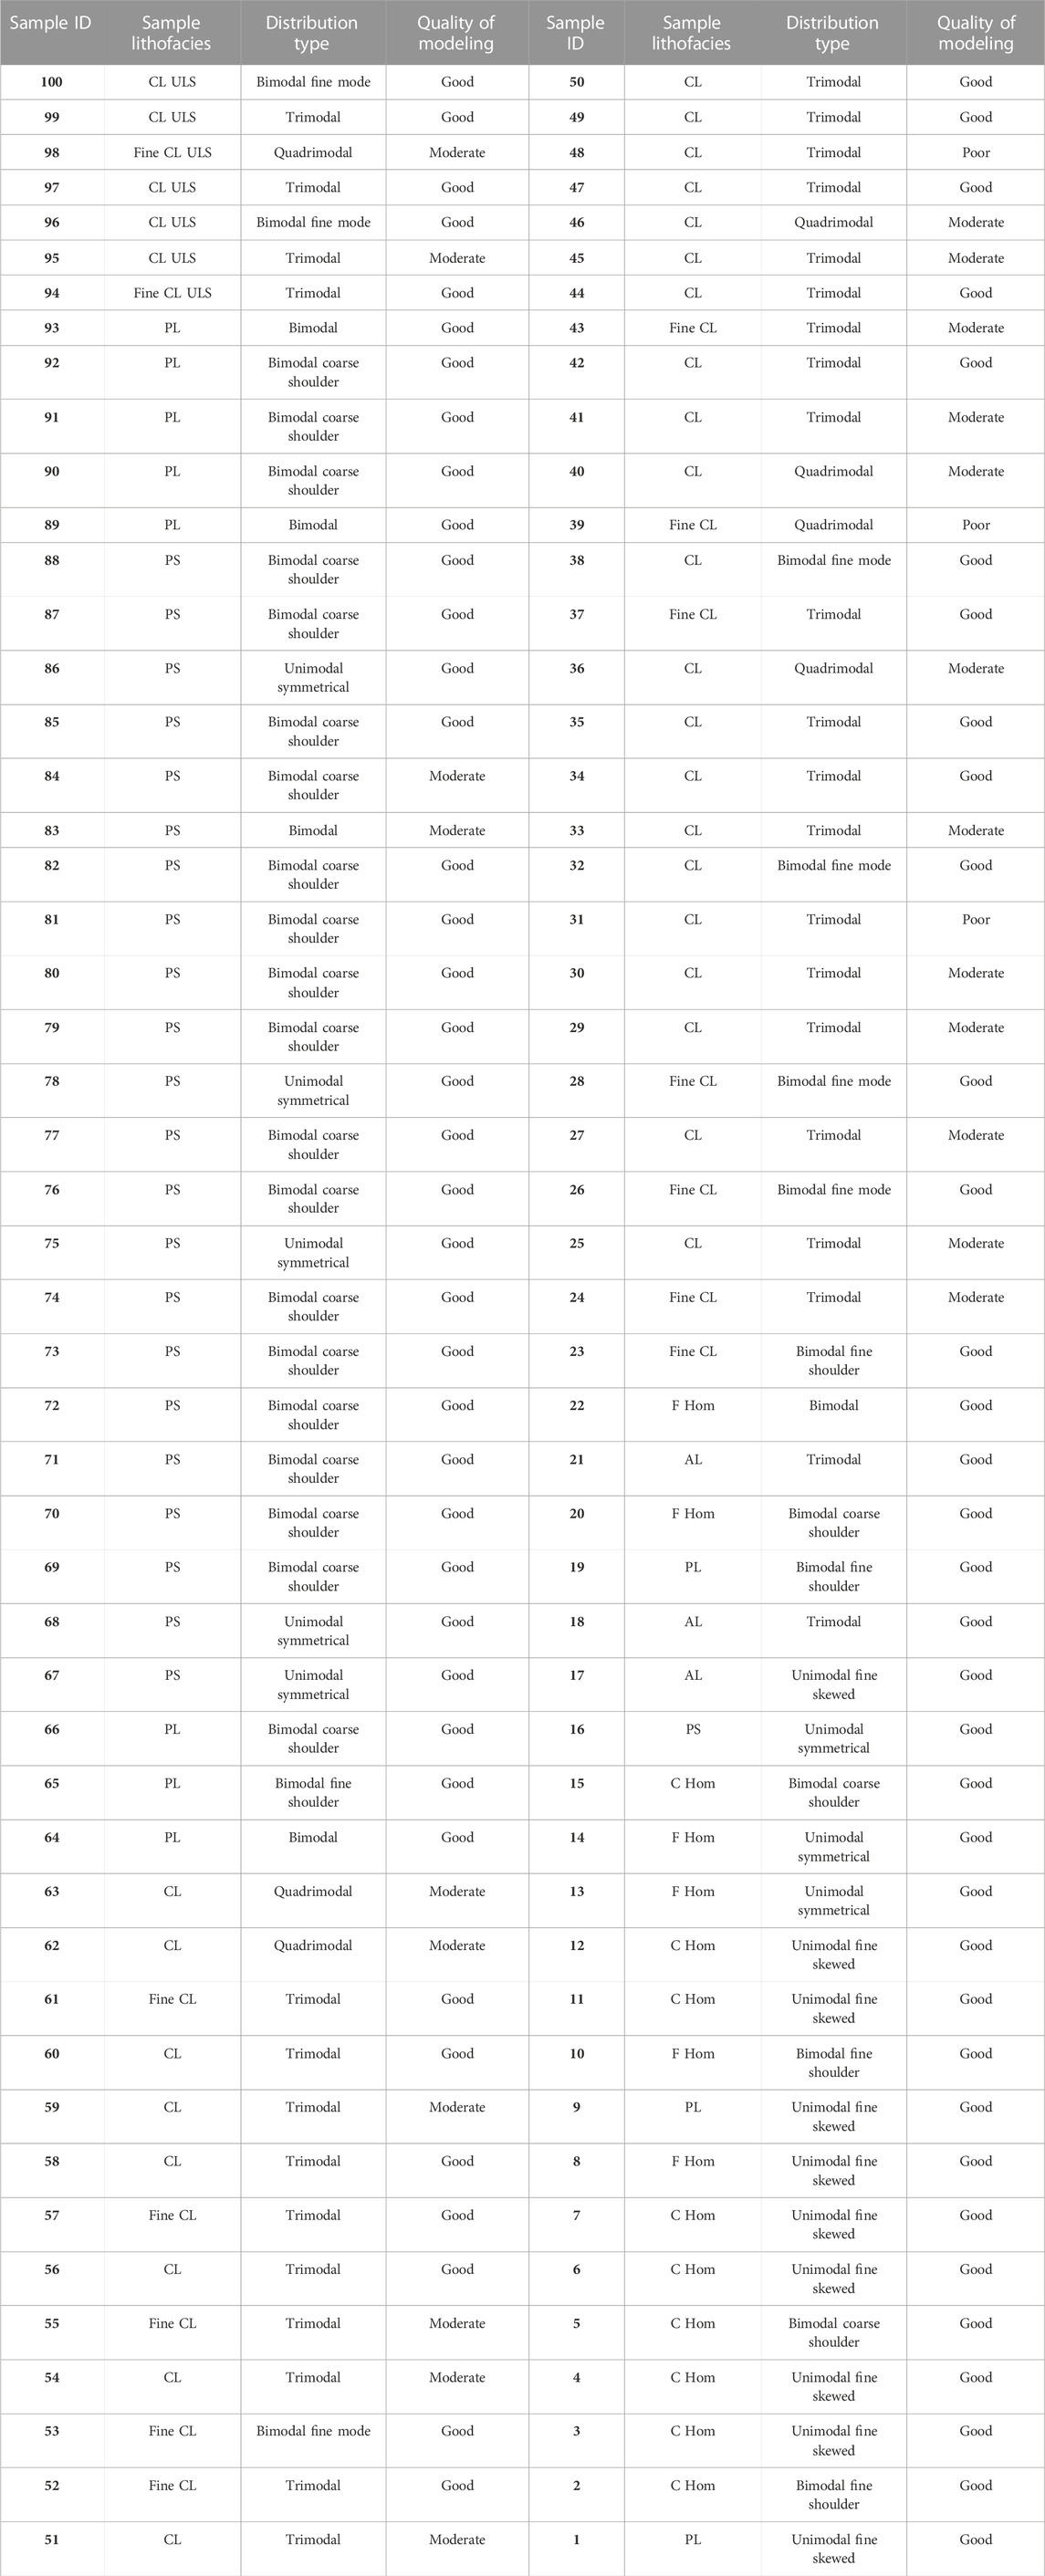
TABLE 1. Table shows sample lithofacies, grain size distribution type, and deconvolution model output quality for every unit D sample. Samples are marked by their consecutive stratigraphic numbers (in bold in table) as shown in Figure 3. Distribution type categories are shown in Figure 5 and model output evaluation is described in Section 3.5.3 Deconvolution modeling. See text for more details.
Traditionally, grain size data are often presented in terms of the global GSD statistics of central tendency and width (sorting) of the distribution (Inman, 1952; Blott and Pye, 2001). We used the classic diagram of median grain size versus Inman sorting to assess the distributions of the lithofacies (Figure 4). All lithofacies fall in distinct fields of median grain size- and Inman sorting ranges except for the fine-dominated couplet layers (Fine CL) and the planar bedded deposits (PL), which suggests that the lithofacies are related to the genesis of the deposits.
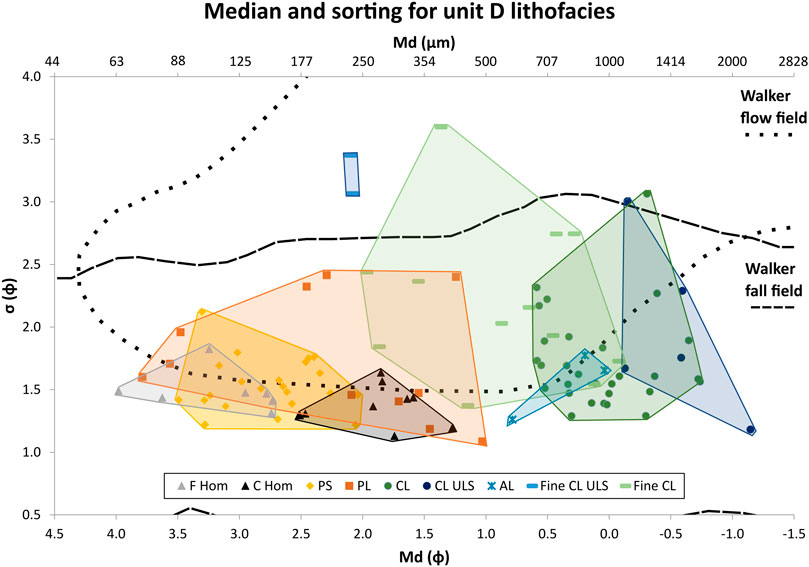
FIGURE 4. Grain size distribution median and sorting values in phi units for all 100 unit D samples. Samples are grouped according to lithofacies: fine homogeneous ash (F hom), coarse homogeneous ash (C hom), poorly sorted ash (PS), laminated ash (PL), couplets from main section (CL), couplets from upper subunit section (CL ULS), ash-lapilli layer (AL), fine-dominated couplet sample from main section (Fine CL), fine-dominated couplet sample from upper subunit section (Fine CL ULS). The median generally reflects the field observations, whereas the sorting is more similar across all lithofacies than estimated in the field. Fall and flow fields from Walker (1971) are outlined on plot, but as explained in the text they are not suitable for deposit interpretation. See text for further details.
The fine and coarse homogeneous ash (F hom and C hom, Figure 4) deposits define fields separated in median grain size range, with the F hom samples ranging from 2.74 to 3.98 φ (fine–very fine ash) and the C hom samples spanning 1.28–2.51 φ (medium–fine ash). These measurements quantitatively confirm the field-based observations of size differences, and also support the field observation of a significant amount of finer olive-green ash in the coarse ash lithofacies. The lithofacies show similar poor sorting ranges at the low-value end of the unit D sorting spectrum. The coarse ash samples are shifted to slightly better sorting (lower values) of 1.13–1.64 φ compared to 1.31–1.82 φ for the fine ash, which might be linked to the observation of a population of coarse to very coarse ash cores and/or extremely fine ash rinds of the accretionary lapilli of the fine homogeneous ash deposits. Generally, these sorting values show that the homogeneous ash deposits are not as well-sorted as they appear in outcrop.
The poorly sorted lithofacies (PS, Figure 4) samples overlap with both homogeneous ash fields and span only a slightly wider sorting range despite their poorly sorted appearance. Their medians are 2.06–3.49 φ (fine to very fine ash) and sorting is 1.22–2.12 φ (poorly sorted). The poorest sorting value beyond the homogeneous ash fields is for a single sample from a layer with low-angle cross-bedding.
The ash-lapilli beds (AL, Figure 4) of the LAS have Mdφ-values of −0.99–0.79 φ (coarse to very coarse ash) and sorting of 1.26–1.65 φ (poorly sorted), values reflecting the field observations of coarser beds in this lithofacies. The sorting values are in the same range as those of the ash-dominated deposits of the homogeneous and poorly sorted ash; thus sorting is not correlated with the overall grain size of the deposit.
The couplets (CL, CL ULS, Figure 4) from both subunits show overlapping fields with a relatively narrow median grain size but a wide range of sorting with values of Mdφ(CL) −0.74–0.59 φ (coarse to very coarse ash) and σφ(CL) 1.29–3.06 φ (poorly to very poorly sorted) and of Mdφ(CL ULS) −1.15–(-0.13) φ (very coarse ash to fine lapilli) and σφ (CL ULS) 1.18–3.01 φ (poorly to very poorly sorted), respectively. The wide sorting range is most likely related to the sampling of couplets of coarse- and fine-grained beds, but the narrow median-size range reveals that the overall distribution and ratio of different grain sizes remains relatively stable for these deposits. Most samples have sorting similar to that of the homogeneous and poorly sorted ash-deposits, an indication that overall grain size of the deposit is not correlated with sorting.
The fine-dominated couplet samples (Fine CL, fine CL ULS, Figure 4) have intermediate Mdφ-values of −0.08–1.96 φ (very coarse ash-medium ash), which fall between the couplet and the homogeneous and poorly sorted ash medians. The two fine-dominated samples from the ULS have finer medians of 2.08–2.1 φ (fine ash), consistent with field observations that these samples are dominated by a single olive-green ash bed. The fine-dominated couplets have the widest sorting range and show the poorest sorting of all sample types, with sorting values ranging from 1.37 to 3.6 φ (poorly to very poorly sorted). The ULS samples fall within the upper part of this sorting range, with values of 3.07–3.27 φ (very poorly sorted).
Finally, the laminated deposits (PL, Figure 4) have the widest range of Mdφ-values of all the lithofacies spanning 1.03 to 3.79 φ (medium to very fine ash) with sorting values of 1.09–2.42 φ (poorly sorted). The range of median and sorting values most likely reflects thickness variations in the coarse and fine laminae where each sample was taken and suggests considerable small-scale variability despite the rhythmic appearance in the field.
Walker (1971) used a median-sorting diagram to classify tephra deposits as fall or flow in origin. However, the Walker classification fields were based on sieved samples with a different resolution of the fine distribution than our modern dataset, which may influence values significantly. Furthermore, flows such as dilute PDCs are poorly classified by these fields, and we only show them here for reference.
To obtain detailed grain size information about the lithofacies, we analyzed the grain size frequency distributions for all 100 samples according to their visual modality and shape. We created separate categories for common distribution shapes that are easily identified. Distribution plots for all samples are provided in supplementary data collection S1. We found distributions are uni-, bi-, tri-, or quadrimodal. The unimodal and bimodal samples show two to four distinct distribution shapes, whereas the trimodal and quadrimodal distributions are variable in shape. We group the frequency distribution shapes into eight categories (Figure 5): Unimodal symmetrical, unimodal fine skewed, bimodal fine shoulder, bimodal coarse shoulder, bimodal with a fine mode, bimodal (unique), trimodal, and quadrimodal distributions.
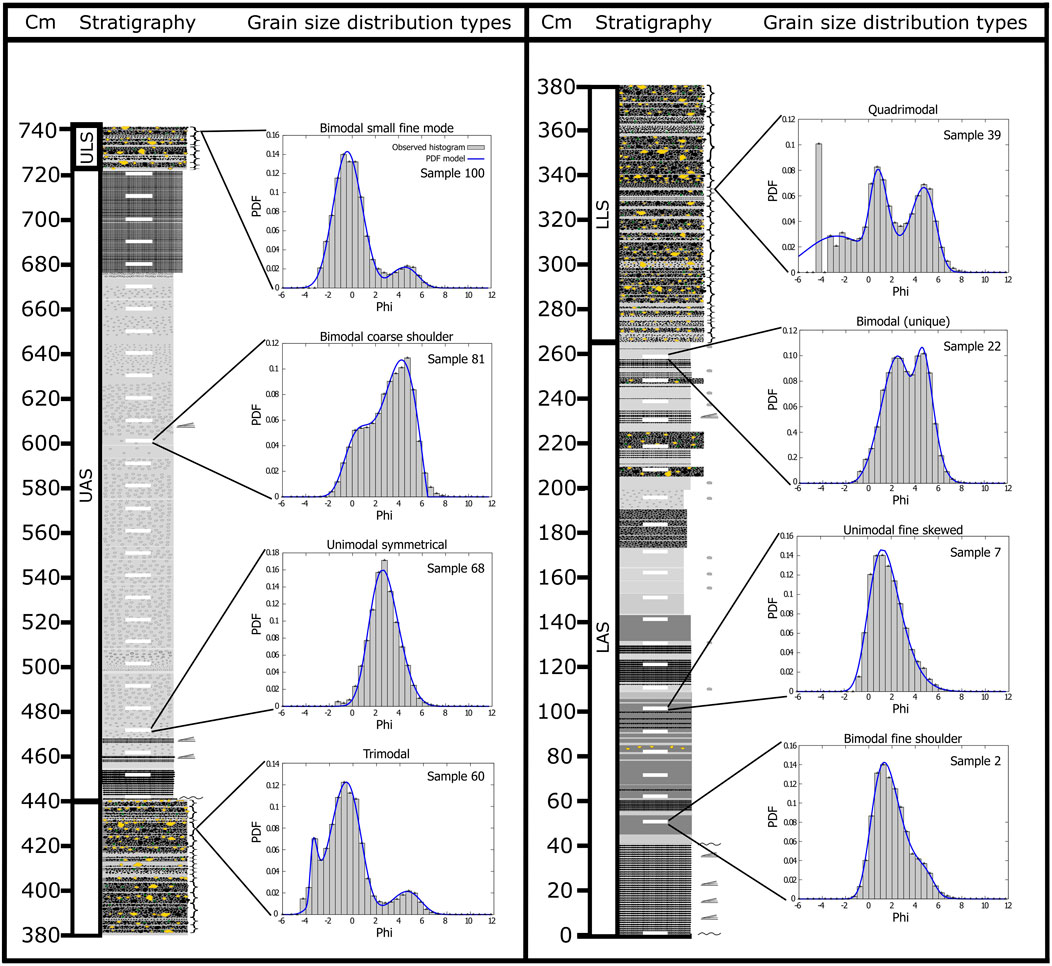
FIGURE 5. The eight grain size distribution types. Grain size distribution histograms are plotted as ½ phi retained (label is lower end of size interval) size bins. Frequency is in fraction values. Blue lines on grain size plots show the modeled deconvolution curve for the selected samples. The distributions shown in this figure are representative examples, but sample distributions vary within each category. Individual GSDs and distribution models for all samples can be found in supplementary data collection S1 and classifications of sample GSDs are outlined in table 1.
Only 18 samples show unimodal distributions of which 10 are symmetrical and 8 fine skewed. The other 82 distributions are multimodal, with 40 classified as bimodal, 35 as trimodal and 7 as quadrimodal. The bimodal samples are subdivided into 23 samples with coarse shoulder, 5 with fine shoulder, 12 had a separate second mode of which 7 samples have a smaller secondary fine mode and 5 are unique bimodal distributions (table 1).
Figure 6 shows the distribution types for each lithofacies. Even though seven of the nine sample lithofacies classes show a dominant distribution type, no lithofacies is uniquely defined by its GSD, and the GSD does not add significant detail about eruptive processes to the field observations in and of itself.
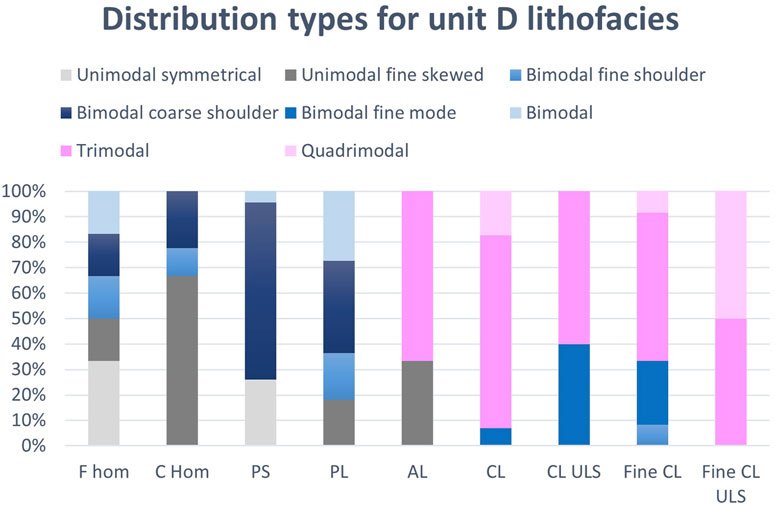
FIGURE 6. Grain size distribution types of samples from each lithofacies shown as percentage columns. Lithofacies key is similar to Figure 4 and distribution type categories are shown in Figure 5. C hom, PS, AL, CL, CL ULS, and CL fine lithofacies show dominant distribution types of unimodal fine skewed (C hom), bimodal coarse shoulder (PS), and trimodal (AL, CL, CL ULS, CL fine) distributions. F hom, PL, and Fine CL ULS lithofacies have no dominant distribution type.
With more than 80 percent of our GSDs being polymodal, conventional statistical parameters beyond central measures (e.g., mean and median) are mostly unreliable for our samples. Therefore, we used the DECOLOG software (Borselli and Sarocchi, 2022) for deconvolution modeling to obtain statistical information on each size sub-population. This method has provided useful information for interpreting multimodal grain size data from phreatomagmatic eruptions (Schmith et al., 2018). For fitting data and distribution graphs for all 100 samples, see supplementary data collection S1. The deconvolution modeling results are not unique solutions. Best fits are selected from a qualitative comparison between the distribution shape and the output modes. We estimate the quality of the deconvolution distribution as either good, moderate, or poor by visually comparing the original and model distributions. Distribution fit coefficients are consistently high for a wide range of model outputs. A good fit captures the visual modes well and shows a good visual overlap between frequency and cumulative distribution curves. A moderate fit captures the modes but may under- or overestimate their size/shape leading to a discrepancy between the cumulative curves–typically at either the fine or coarse extremes. Discrepancies between the number of visual modes and modeled modes automatically categorize the output as moderate or poor (see Table 1). Poorly modeled distributions either miss or misplace modes entirely. It was not possible to obtain a good fit for the quadrimodal samples, so they are all modeled with three modes only. Seventy-five samples have good modeling results, 22 have moderate fits, and three samples have poor fits (see Table 1).
We compare mode and sorting of modeled subpopulation within each lithofacies to assess if the lithofacies show specific and/or stable size modes, which could be related to the eruptive activity. Figure 7 shows how mode- and sorting values are distributed for the modeled sub-populations of each lithofacies. Modes are numbered according to their influence on the distribution, so the mode that constitutes the largest fraction of the distribution is the first mode.
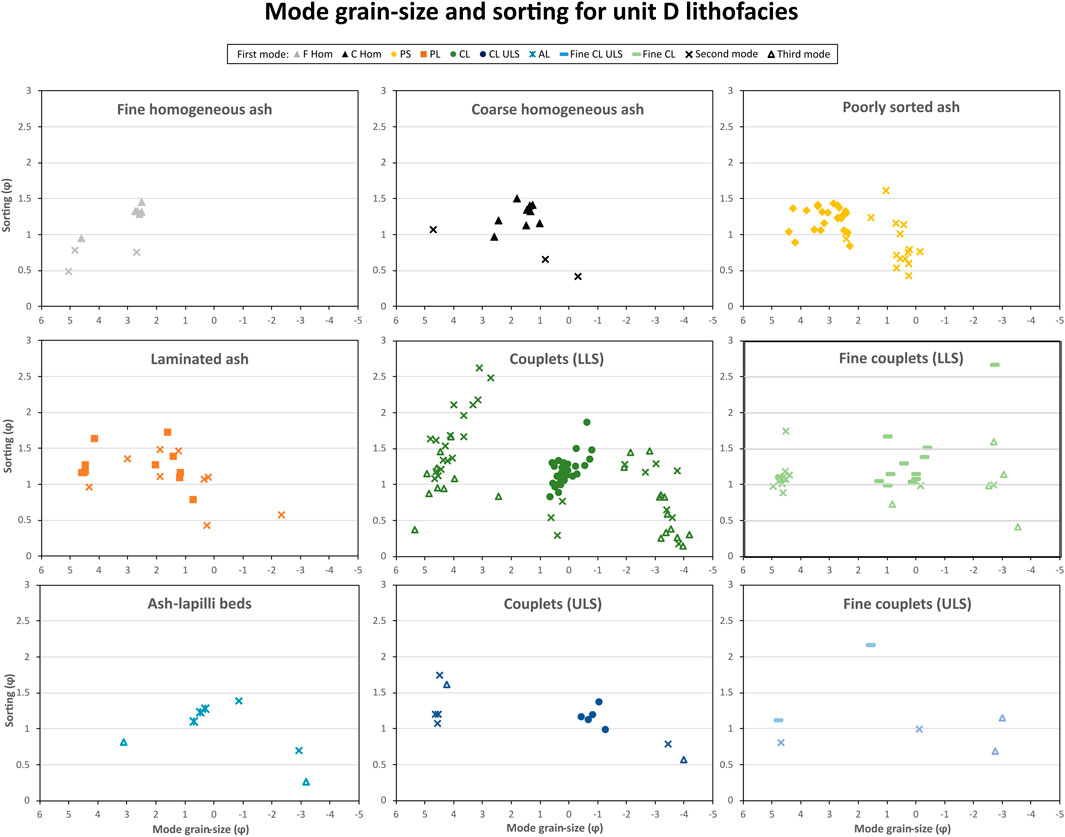
FIGURE 7. Modeled mode and sorting plots of grain size distribution subpopulations for each lithofacies. Both mode and sorting are shown in phi units. Data for this figure come from the deconvolution model output and modes are numbered according to their fraction of the distribution such that mode 1 is the largest mode of the distribution. The plots show that the lithofacies have well-defined mode size intervals, though the fraction of the distribution that is defined by this size mode may vary significantly.
The fine homogeneous lithofacies (F hom, Figures 6, 7) has good model outputs and shows either symmetrical unimodal or one of the bimodal distribution types, though none of them has a separate secondary fine mode (Figure 6). Their dominant mode grain sizes are uniform and fall between 2.52 and 2.72 φ (fine ash) with a single outlier (sample 20) at 4.61 φ (Figure 7). However, the first mode of sample 20 falls within the narrow secondary mode interval 4.42–4.61 φ (extremely fine ash) and has a second mode within the primary mode interval (Figure 7). The narrow size ranges and an extremely fine ash second mode in some samples suggest that the overall poor sorting of this lithofacies is related to the extremely fine ash rinds observed on the accretionary lapilli. The finer modes are generally better sorted, with moderately–moderately well sorted values, whereas the coarser modes are still classified as poorly sorted–possibly in part due to the presence of the coarse ash accretionary lapilli cores.
The coarse homogeneous ash lithofacies (C hom, Figures 6, 7) samples all model well and show primarily poorly sorted, fine-skewed unimodal distributions with modes of 1.01–2.58 φ (coarse to fine ash) (Figure 6). Thus, the poor sorting noted in the statistical analysis is confirmed by the modeling. It is most likely caused by the substantial content of the finer olive-green ash as noted in the field observations, though sample 2 is the only sample with an actual modeled secondary mode of extremely fine ash (4.72 φ), in accordance with the observation of more olive-green ash in this deposit (Figure 7). Samples 5 and 15 have a secondary coarse mode corresponding to the observed clast populations of very coarse ash-size pumice and dark gray coarse ash, respectively (Figure 7).
The poorly sorted lithofacies (PS, Figures 6, 7) shows good model outputs except for samples 83 and 84, and distributions are primarily bimodal with a coarse shoulder (Figure 5). The dominant mode shows a considerable size range of 2.37–4.26 φ (fine to extremely fine ash) with a narrow secondary mode of −0.15–1.03 φ (very coarse to coarse ash) reflecting the field observation of a fine ash matrix and coarse distributed clasts (Figure 7). The rest of the poorly sorted deposits have symmetrical unimodal GSD with modes of 2.44–3.41 φ (fine to very fine ash), suggesting that the coarse ash clasts play a minor role in these samples. The modeling of sample 83 fails to capture a minor secondary mode in the lapilli size range, whereas the secondary mode of sample 84 poorly captures the actual size distribution and results in the only outlier between the primary and secondary mode size ranges (Figure 7).
The laminar ash lithofacies (PL, Figures 6, 7) models well and shows uni- or bimodal distributions with no clear primary distribution type (Figure 6). Their primary modes fall in two overall groups between 0.72 and 2.02 φ (coarse to medium ash) and 4.15 and 4.58 φ (extremely fine ash), respectively (Figure 7), reflecting the laminated nature of the deposit. The secondary modes are all in about the same size ranges except for samples 19 and 64. Sample 19 has the coarsest primary mode and a secondary mode between the two size fields, suggesting that grain sizes are in general shifted to higher values for this deposit. Sample 64 has a medium lapilli secondary mode, which most likely reflects a small population of pumice.
The LLS couplet lithofacies samples (CL, Figures 6, 7) are more difficult to model accurately, with 12 good model outputs versus 15 moderate and 2 poor. Almost all distributions are trimodal or quadrimodal with a few bimodal samples with a secondary fine mode (Figure 6), and models show a dominant size mode of −0.80–0.65 φ (coarse to very coarse ash) with most secondary modes of 2.72–4.93 φ (fine to extremely fine ash) and a third mode of −4.19–(−1.92) φ (fine to coarse lapilli) (Figure 7). This correlates with the observed lithofacies components of the dominant coarse-very coarse matrix ash with very fine olive-green ash beds and the fraction of pumice lapilli. Most of the moderate model outputs fail to capture a minor coarse mode that makes up the third or fourth mode or misplaces/misshapes the extreme modes slightly. This results in mode grain sizes migrating toward the dominant mode grain size and sorting values increasing for these samples (Figure 7).
The ULS couplets and all the fine-dominated couplets (CL ULS, fine CL, fine CL ULS, Figures 6, 7) show better model fits, with five moderate fits and 14 good, and distributions show similar systematics and size ranges to the LLS couplets. The ULS couplet dominant size mode is coarser and ranges between −0.44 and −1.28 φ (very coarse ash to fine lapilli) (Figure 7).
The three samples from the ash-lapilli beds (AL, Figures 6, 7) are well modeled. Two samples have trimodal distribution, whereas one has a fine skewed bimodal distribution (Figure 6). Primary modes range between −1.27 and 0.48 φ and coarse modes fall at −3.12–(−2.94) φ, which overlaps with the couplet modes, but only sample 21 shows a very fine ash mode at 3.10 φ (Figure 7). This fits the general similarity with the ash-lapilli beds of the LLS and ULS couplet lithofacies and supports the interpretation that the fine ash modes in these deposits are indeed correlated with the observed olive-green ash beds and traces.
In general, the grain size modeling and field data for the lithofacies correlate very well, and the deconvolution modeling resolves the grain sizes and size variations of the lithofacies better than is possible with field estimates or general GSD statistics. The deconvolution subpopulations show relatively stable size modes for the lithofacies in spite of the variable distribution types, and variability can be linked to field observations. This indicates that processes controlling the size of the grains were stable for each lithofacies, but processes controlling the amount of each size fraction varied throughout the eruptive activity. From the size- and field data alone it is not possible to distinguish how fragmentation, transport, and depositional processes are responsible for the lithofacies grain size characteristics and internal variability. Therefore, we also looked at the grain shapes of the juvenile components to obtain more information.
We use the mean CAMSIZER 2D shape parameter data of sphericity, aspect ratio, Krumbein roundness, and compactness for each sample to assess the particle morphology of the juvenile unit D tephra. Aspect ratio shows the elongation of the grain and Krumbein roundness tracks features in the perimeter of the grain such as pointy corners or vesicle indentations. Compactness tracks changes in the area-based irregularity of the grain, such as elongation or shape distortion. Sphericity is affected both by area and perimeter changes of the grain and is one of the most widely used parameters in tephra shape parameter studies (e.g., Schmith et al., 2017; Dürig et al., 2021). Smooth, compact, equant grains will show high shape parameter values, and the value of the parameters will decrease with increasing irregularity of the grain shape.
To provide context to the scale of shape variability of unit D samples, we also measured a sample of lithic ash from the 1924 eruption of Kīlauea as well as a sample from the pumice deposit K1 and reticulite from deposit B1 of Keanakākoʻi Tephra from a similar size range and compared them to the most extreme samples of unit D for each parameter. Results are shown in Figure 8. The most equant and blocky sample of unit D plots closely with the lithic phreatic deposit of the 1924 eruption, whereas the sample with the most irregular shapes shows lower shape values in all plots and falls between the 1924 sample and the K1 pumice sample. The reticulite B1 sample shows even lower shape values in all plots. This indicates that the unit D samples are clearly distinguishable from dry magmatic fountain deposits even though they display significant variation in shape parameter values.
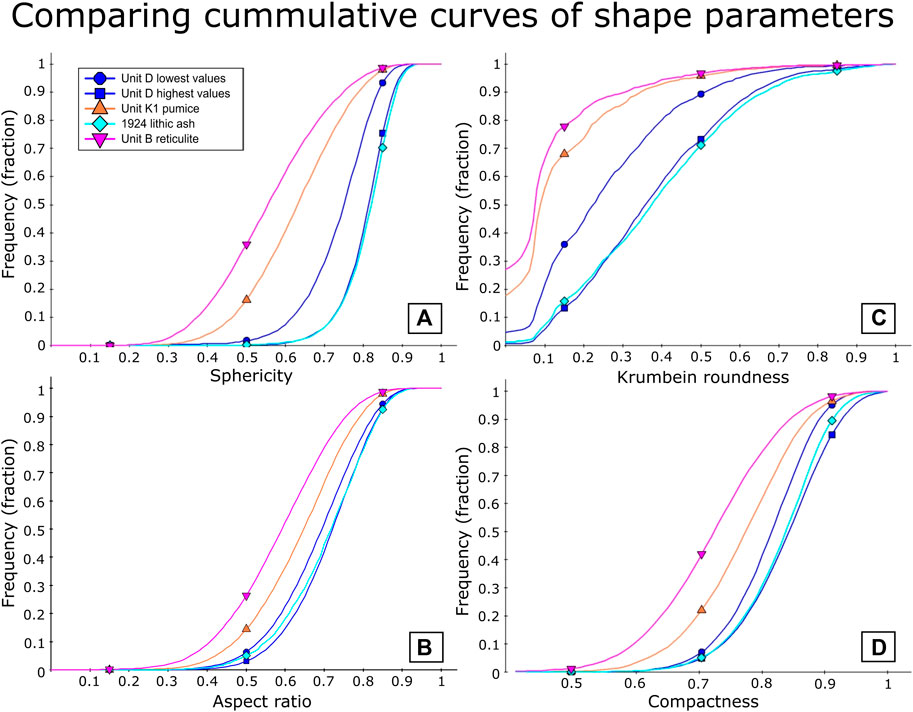
FIGURE 8. Cumulative shape parameter curves for the 0-5 phi size range for CAMSIZER shape parameters (A) sphericity, (B) aspect ration (C) Krumbein roundness, and (D) compactness. Unit D is shown as blue lines of the two most extreme samples for each parameter. Samples of the lithic 1924 deposit (light blue), the pumiceous K1 Keanakākoʻi deposit (orange) and the Keanakākoʻi unit B reticulite (pink) are shown for comparison. All shape parameters are dimensionless (see methods or CAMSIZER manual for definitions) and show increasingly equant and smooth shapes with increasing values. The samples span (A) sphericity values between 0.2 and 0.8, (B) aspect ratio values between 0.2 and 0.8, (C) Krumbein roundness values between 0.07 and 0.9, and (D) compactness values between 0.5 and 0.95. This suggests that the natural variation in parameter values is highest for Krumbein roundness, then sphericity and aspect ratio, and lowest for compactness. All plots show that Keanakākoʻi unit B has the most irregular grains followed by unit K1, whereas 1924 has the most equant and smooth grains. Unit D samples shows a wide range of shapes that overlap with 1924 for the sample with the most regular grains and falls between 1924 and unit K1 for the sample with the most irregular grains. Although each shape parameter shows a unique numerical value range for the entire set of samples, unit D samples spans similar fractions of this entire range for all parameters. Thus, the numerical changes in unit D shape parameter values are in line with the overall changes between deposit types. See text for more details.
We look at the mean grain shape variation with grain size to see if the unit D shape variation is related to a specific grain size range. Shape variation with size might also add information about the fragmentation mechanism of the lithofacies grain size subpopulations, because the grains are predominantly juvenile. If rounding is seen for a range of grain sizes, it could also point to grain transportation processes associated with grain abrasion.
To check if sphericity values are influenced significantly by resolution, we plotted sphericity and aspect ratio (typically not sensitive to resolution) data from 1,000 random grains for the 0.5–2 mm size range (coarse–very coarse ash) from both the P4 basic, P4 zoom, and X2 basic cameras (supplementary materials S2). Grain resolution at 1 mm is approximately 173, 5,638, and 32,054 pixels/particle for the P4 basic, P4 zoom, and X2 basic camera, respectively. The plots show no significant difference in shape parameter values between cameras and show that resolution does not control our sphericity data.
Figure 9 shows the plots of mean shape parameter values for half phi size bins for each sample in the very fine ash to medium lapilli size ranges. Not all samples contained all grain size bins, so the number of samples plotted for each grain size varies. The grain-size ranges show three different distribution patterns for fine to very fine ash, medium ash to fine lapilli, and medium lapilli.
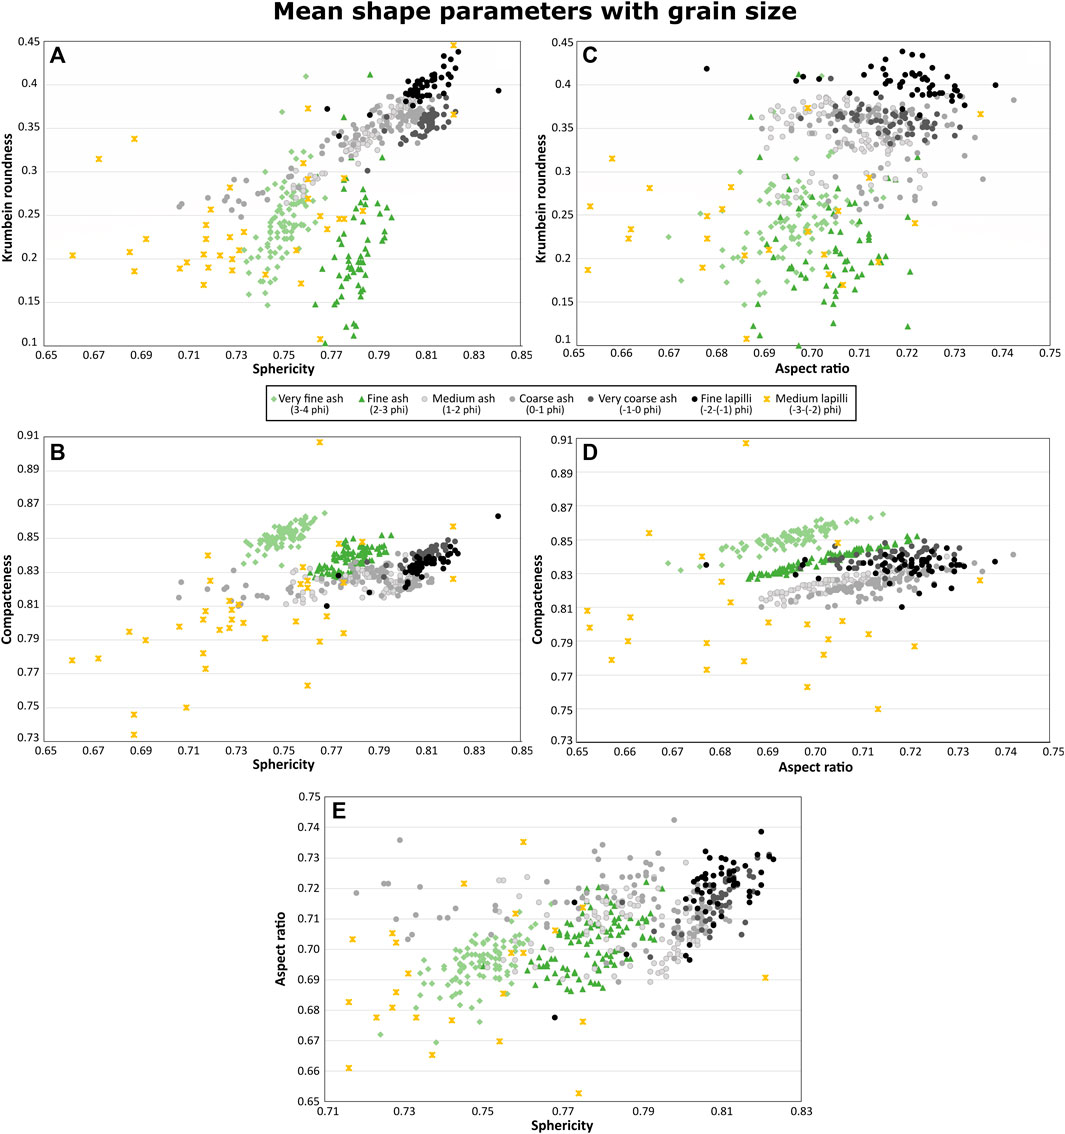
FIGURE 9. Plots of mean shape parameter of each sample for retained ½ phi size bins at very fine ash (4 φ), fine ash (3 φ) medium ash (2 φ), coarse ash (1 φ), very coarse ash (0 φ), fine lapilli (−1 φ), and medium lapilli (−2 φ). Plots contain (A) sphericity and Krumbein roundness, (B) sphericity and compactness, (C) aspect ratio and Krumbein roundness, (D) aspect ratio and compactness, and (E) sphericity and aspect ratio. Individual shape parameters are shown at the same scale across all plots except for sphericity in plot E, which is zoomed in to better show details of distributions. All shape parameters are dimensionless and grains are more regular, equant, and smooth with increasing values. Colors of sizes reflect interpreted unit D juvenile components with green colors representing olive-green ash, gray-scale colors representing the dark gray ash-lapilli, and the yellow color representing the pumice lapilli. Please note that not all samples contain all grain sizes and thus the number of samples (plotted points) may vary with grain size. Please refer to text for details.
The very fine to fine ash ranges show distinct narrow sphericity values between 0.73–0.77 and 0.76–0.79, respectively, with a notable vertical spread in Krumbein roundness values of 0.15–0.35 and 0.10–0.30 for the bulk of the samples (Figure 9A) with fine ash shifted toward slightly lower Krumbein roundness values. Compactness values are between 0.83 and 0.86 for the very fine ash and 0.83–0.85 for the fine ash (Figure 9B) and aspect ratio values overlap between 0.67 and 0.72 (Figure 9C), though the fine ash is shifted to slightly higher values. Both size ranges show distinct distributions with vertical trends between sphericity and Krumbein roundness (Figure 9A), a slightly positive correlation between sphericity and compactness values (Figure 9B), and clear positive correlation with narrow distributions between aspect ratio and compactness (Figure 9D). There is no clear correlation between aspect ratio and Krumbein roundness or aspect ratio and sphericity (Figures 9C, E).
In Figure 9A, medium ash to fine lapilli size ranges all show a positive correlation between sphericity and Krumbein roundness values. Medium and coarse ash ranges fall along this trend with sphericity values of 0.75–0.81 and 0.71–0.81 and Krumbein roundness values of 0.26–0.39 and 0.25–0.39, respectively. The trend shifts to relatively higher sphericity values for the high Krumbein roundness end of the range. Very coarse ash follows the same general trend but is more concentrated at higher values of sphericity at 0.79–0.82 and Krumbein roundness at 0.30–0.39. The fine lapilli size forms the high value extreme of this trend with sphericity values of 0.77–0.84 and Krumbein roundness values of 0.34–0.82. In Figure 9B medium ash to fine lapilli show two distinct trends. Medium and coarse ash show lower overall compactness values than the fine ash ranges and a lateral spread of points with narrow compactness intervals of 0.81–0.84 and 0.81–0.84, respectively. Very coarse ash and fine lapilli sizes show a similar sphericity-compactness correlation as the fine ash sizes in similar compactness values of 0.83–0.85 and 0.81–0.86, respectively. Figure 9C shows no correlation between Krumbein roundness and aspect ratio for medium ash to fine lapilli with lateral point distributions of aspect ratio ranges for the bulk of samples from 0.69 to 0.72 for medium ash, 0.70–0.73 for coarse and very coarse ash, and 0.71–0.73 for fine lapilli. There is a slight positive correlation between compactness and aspect ratio for medium to very coarse ash, but no clear correlation for fine lapilli (Figure 9D). Figure 9E shows no distinct correlation between sphericity and aspect ratio for the medium ash to fine lapilli.
The medium lapilli size range shows the largest shape diversity of all size ranges in all plots in Figure 9 with no clear parameter correlations. At least half of the values are lower for all parameters compared to the other size ranges. In Figure 9A, most sphericity values are 0.66–0.78, with Krumbein roundness values between 0.11 and 0.37. In Figure 9B compactness values are between 0.69 and 0.86. Aspect ratio values are 0.57–0.78, but plots in Figures 9C–E have been zoomed in to better see distributions of other size ranges.
The distribution of fine to very fine ash in Figure 9A shows shape diversity mainly due to differences in perimeter pointiness. These differences do not cause relative elongation of the perimeter with respect to grain area/perimeter ratio, indicating morphological roughness diversity. This is supported by the lack of correlation between Krumbein roundness or sphericity with aspect ratio (Figures 9C, E) showing that grain elongation is not a defining factor. The positive correlation between compactness and sphericity (Figure 9B) also indicates that shape diversity is related to morphological roughness changes rather than surface indentations from vesicles, for example, and the correlation between compactness and aspect ratio supports that (Figure 9D). The higher sphericity values of the fine ash relative to the very fine ash suggest that shape complexity of the grains increases with decreasing grain size. The narrow ranges in sphericity values associated with these sizes indicates that sphericity values are mainly controlled by the size-related decrease in projected area relative to perimeter between the two grain sizes.
The correlation trend between sphericity and Krumbein roundness for the medium ash to fine lapilli size ranges suggests that shape changes are related to differences in surface roughness that cause increase of the grain perimeter relative to area, such as vesicle indentations. The lateral trend in plot 9b for medium to coarse ash suggest that longer grain perimeters are not associated with grain elongation for this size range, which is in line with Figure 9C showing that surface roughness does not change significantly with aspect ratio. Interestingly, Figure 9D shows a correlation between compactness and aspect ratio suggesting that vesicles are big enough to cause some morphological roughness changes. This suggest that shapes in the medium to coarse ash range is controlled mainly by vesicle indentations and are thus a function of vesicularity. However, for grains in the very coarse ash to fine lapilli range, differences in grain shapes seem related to both grain elongation and surface perturbations, as suggested by the positive parameter correlations in Figures 9A, B, E. Neither surface roughness nor compactness change significantly with elongation (Figures 9C, D) suggesting that vesicles are now too small to impact overall grain shape. The shift to higher shape values with larger grain sizes indicates that grain shapes become more equant, smooth and less complex with increasing size.
There are no obvious distribution trends for the medium lapilli, but the low values for all shape parameters indicate that the grains have the roughest surfaces and morphological roughness of all the grain sizes. This is typical for highly vesicular grains.
Shape data plotted in terms of whole sample means of lithofacies show that lithofacies are well-defined in terms of shape data. Sample shape parameter means are correlated with the shape of the dominant grain size mode, and figures can be found in supplementary data S3. Rounding of grains across a range of grain sizes or for the interpreted PDC-related poorly sorted lithofacies are not observed. This shows that secondary abrasion is not a significant process modifying grain shapes.
The size ranges of the three distinctive shape distribution patterns correlate with the dominant grain size ranges of the three unit D components. Olive-green ash dominates the fine-extremely fine size range, the dark gray ash and lapilli dominate the coarse ash-fine lapilli sizes, and pumice dominates the medium lapilli size range. Thus, the shape distributions of Figure 9 allow us to assess fragmentation processes associated with each component.
Experimental work on phreatomagmatic fragmentation shows that molten fuel-coolant interaction (MFCI) is the preferred model for explosive magma-water interaction (e.g., Zimanowski et al., 1997; Büttner et al., 1999; Büttner et al., 2002; Dürig et al., 2012a; Zimanowski et al., 2015; Sonder et al., 2018; Dürig et al., 2020).Though alternative models such as turbulent shredding have been suggested for Kīlauea (Mastin, 2007), we find it unlikely to be a dominating process considering the high amount of fine ash in the unit D deposits. According to the MFCI model, explosive interaction needs an initial crude mixing of the magma and water on the scale of 1–10 cm length dimension of water domains (Zimanowski et al., 2015), where a vapor film forms a stable boundary layer between the magma and the water. The film can become unstable from an external pressure pulse (e.g., an earthquake) or local over-expansion and collapse across the mixing volume, leading to thermal coupling and high instantaneous heat transfer between water and magma (Wohletz et al., 2013). The high heat transfer leads to superheated and rapidly expanding water, which cannot be accommodated by the cooling magma that forms brittle stress cracks. The water intrudes into the cracks, causing further superheating, expansion, pressurization, and crack propagation in a positive feedback loop that finally produces a thermal detonation. The explosive energy is released as a thermohydraulic shock wave. The efficiency of this process is partly determined by the efficiency of the initial magma-water mixing as well as the elastic properties of the magma during the brittle stress wave propagation (Dürig et al., 2012b; Dürig and Zimanowski, 2012; Zimanowski et al., 2015). The maximum size of premix is limited by the speed of sound within the premix (Zimanowski et al., 2015).
The olive-green sideromelane ash morphology shows no influence from small surface perturbation such as vesicles or microlites, but grains are more pointed and equant than those of the dark gray ash, likely yielding a higher surface area. Thus, the fragmentation process generating the olive-green ash is related to the breakage of dense glass, where shape complexity increases with decreasing size, suggesting higher energy fragmentation was available to generate finer grains.
The dark gray ash-lapilli shape parameters generally reflect those of typical blocky and equant shapes of phreatomagmatic deposits and have less pointed grains than the other components. The most extreme shapes, overlapping or even surpassing the olive-green ash shapes in irregularity, are related to the large and medium ash fractions. Mele and Dioguardi. (2018) showed that, for vesicular grains, sphericity changes parabolically with grain size and is the lowest at a grain size slightly coarser than the coarsest vesicle diameter, which means that each vesicle indentation defines a significant percentage of the overall grain shape. Conversely, the coarser grain size ranges have higher sphericity values as grains become increasingly blocky and equant, with grain shapes less impacted by the vesicle indentations. Findings using 3D tomography to correlate grain shape with vesicularity, vesicle size, and solid structure thickness show a correlation between increasing particle irregularity and increasing vesicularity and decreasing solid structure thickness (Mele et al., 2018). Mastin et al. (2004) showed that the volume-fraction of bubbles was higher for medium and coarse unit D ash than for very coarse ash, though bubble number densities were lower, consistent with medium and coarse ash being more impacted by larger vesicle indentations than, very coarse ash. Our samples were generated by multiple explosive events, and part of the shape variation within each grain size bin is likely due to differences in melt vesicularity. Thus, the shape variation for the dark gray ash and lapilli is a function of grain size and vesicularity.
The pumice component has the most irregular grains as defined by the lowest shape parameter values, not surprising given that vesicular grains have more complex and irregular morphologies than blocky or dense grains (e.g., Heiken, 1974; Wohletz, 1983b; Schmith et al., 2017; Dürig et al., 2018; Comida et al., 2021; Ross et al., 2022). Interestingly, these grains are also the coarsest but do not follow the trend of increasingly blocky and equant shape with increased grain size shown by the dark gray component. This is consistent with measured high gas volume-fraction for this size range (Mastin et al., 2004) and indicates that the highly vesicular magma that fragmented to produce the pumice did not fragment the same way that the moderately vesicular magma did.
Previous studies show that the lapilli-bearing subunits are more vesicular than the ash-dominated subunits for a given grain size (Mastin, 1997; Mastin et al., 2004). Furthermore, the pumice component is almost exclusively associated with the lapilli-bearing subunits. Mastin. (1997) also found an intra-subunit increase in vesicularity with grain size. The increasing size of the grains with increasing vesicularity suggest less efficient fragmentation with increasing vesicularity. This in turn suggests that magmatic degassing decreased the intensity of the fragmentation, pointing to a dampening of the efficiency of the molten fuel-coolant interaction. Indeed, the presence of vesicles could influence the elastic response of the magma by allowing less energy build-up prior to the brittle failure of the magmatic foam. Furthermore, it is possible that elastic dampening of the pressure wave propagation also played a role, as foams are more compressible than a dense magma. The initial magma-water mixing could also be influenced by melt structure. Higher vesicularity is known to lower the magma viscosity (Giordano et al., 2008), which might facilitate initial magma-water mixing on smaller scale.
The breakage faces, blocky morphologies, and generally high average shape parameter values of grain assemblages of the unit D deposits indicate that they were generated by brittle fragmentation (Zimanowski, 1998; Büttner et al., 2002; Dürig et al., 2020; Thivet et al., 2022). Numerical modeling shows that, for typical conditions, Kīlauea magmas reach neither a brittle fragmentation nor an inertial or fluid-dynamic fragmentation criterion while in the conduit (La Spina et al., 2021). The modeling also shows a strong coupling between gas and melt phase for Kīlauea ascending magmas, with a maximum gas-slip velocity (i.e., gas movement relative to melt phase) of 3 m/s. This indicates that a somewhat vesicular magma was coherently ascending when the magma-water interaction occurred. This scenario is supported by the predominantly spherical micro-vesicles with little coalescence or elongation and by elevated SO2 content in pumice lapilli from the LLS and ULS interpreted as premature quenching prior to full magmatic outgassing (Mastin et al., 2004).
The modeling of La Spina et al. (2021) showed that magmatic temperature is one of the most important controls on eruptive style for basaltic magmas, as it is positively correlated with ascent rate and magma exit velocity at the vent. The highest ascent rates are associated with Hawaiian lava fountains (>50 m high), whereas effusive and explosive eruptions producing Plinian and sub-Plinian eruptions both have lower ascent rates. Studies of unit D major element geochemistry and olivine compositions show high MgO glass content (∼7.5–11 wt percent), which corresponds to glass quench temperatures around 1,175°C (8 wt percent MgO) and up to 1,235°C (11 wt percent MgO), suggesting high temperature magmas for this period (Helz et al., 2014; Garcia et al., 2018; Lynn and Swanson, 2022). These temperatures are even higher than those used in the numerical modeling by La Spina et al. (2021) (1,160°C–1,060°C) and indicate that ascent rates and magma exit velocity at the vent could be higher throughout the unit D eruptions than for modern eruptions observed at Kīlauea. We hypothesize that the combination of high ascent rate and melt exit velocity, and the vesicular structure of the magma are the main controls for the efficiency of magma-water mixing and subsequent fragmentation.
Two layers within unit D have been studied in terms of olivine populations and melt inclusions to constrain outgassing and ascent history of the magma (Lynn et al., 2017; Garcia et al., 2018; Lerner et al., 2021). Samples were collected close to our main section, and we used stratigraphic height and the presence of pumice to correlate them roughly with our stratigraphy (Garcia et al., 2018; Lerner personal com.). Olivine from the middle of the LLS has high forsterite cores (Fo90–88), suggesting a deep origin from primitive mantle melts and melt inclusions show entrapment depths of 1–8 km except for two CO2-rich inclusions from about 15 km depth (Lynn et al., 2017; Lerner et al., 2021). Most olivine from the upper portion of the LAS also has a high forsterite content, but a smaller olivine population has cores that crystallized in hybrid magma resulting from mixing of primitive melts with stored and fractionated melts at shallow depth (Lynn et al., 2017). Melt inclusion entrapment depths are about 1–7 km (Lerner et al., 2021). All olivine crystals, regardless of core Fo number, have diffusion rims indicating storage during ascent from the mantle, but the rims record poor mixing of the melts. This is in line with variable glass MgO within each layer (Garcia et al., 2018). Derived storage times before eruption are typically below 3 months, with 1–3 weeks for the lowest storage times (Lynn et al., 2017).
These interpretations constrain the rapid magma ascent to occur from a shallow magma reservoir and show overall similar gas content of the unit D magmas regardless of subunit and lithofacies. However, the LLS magmas may have vesiculated more before the magma-water interaction happened. This is consistent with measured H2O concentrations (Mastin et al., 2004). We suggest that the poor mixing and variable storage times might lead to magma pockets of slightly heterogeneous volatile-content and temperature, which might explain the variability in pre-fragmentation vesicularity of the unit D magma.
Equilibrium H2O saturation quench pressures indicate a fragmentation depth range of 10–100 m (lithostatic pressure) or 250 m (hydrostatic pressure) (Mastin et al., 2004). The sparsity of lithic wall-rock fragments in the deposit suggests that fragmentation did not happen far below ground, which would favor a hydrostatic model involving a standing water body at the surface. Depth to the water table at Kīlauea summit has been directly measured since 1973 at approximately 610 m above sea level ± 10 m (Keller et al., 1979; Hsieh and Ingebritsen, 2019). Resistivity studies have found a low-resistivity surface at the same level as well as at 800 m elevation below the central part of the caldera (Kauahikaua, 1993). Swanson et al. (2012) suggested that a 600 m deep (400 m above sea level) caldera formed shortly before or around ca. 1500 CE, where a standing water body in the caldera would be possible. The recent partial caldera collapse in 2018 reached a depth in Halema’uma’u Crater of about 500 m above sea level (Anderson et al., 2019; Neal et al., 2019) and after about 1 year a water lake appeared at the bottom of the crater (Nadeau et al., 2020). This water lake reached a depth of 50 m in about 17 months, with lake level increases of 5–15 cm/day and was interpreted as groundwater seepage from the recovering water table after collapse (Patrick et al., 2021). The recent observations support the idea of similar events on a larger scale following the large 1500 CE caldera collapse. Hawaiian oral traditions give no clear indication of a lake in the caldera, but they do hint at the presence of water as the caldera collapse ended.
We have not observed any fluidal grains such as Pele’s tears or hair, which are commonly found in both proximal and distal deposits from explosive basaltic eruptions regardless of primary fragmentation mechanism (e.g., Büttner et al., 2002; Houghton et al., 2015). Thus, we infer that there was no dry magmatic fountaining activity concurrent with this eruptive activity. Furthermore, the absence of fluidal grains suggests either very efficient magma-water mixing that did not allow for ductile deformation, or that eruption dynamics preferentially segregated these grains during transport. We find transport segregation unlikely as we do not detect such effect on other components of the deposits. Thus, we think the absence of fluidal grains is a primary feature of the unit D fragmentation that suggests efficient MFCI fragmentation.
The idea of explosive activity at Kīlauea involving external water originated from observations and interpretation of the 1924 explosive eruption from the summit crater of Halemaʻumaʻu. Most models envision water accessing the Halema’uma’u Crater and coming into contact with hot wall rock after a long standing lava lake drained and the walls of the crater started collapsing (e.g., Jaggar and Finch, 1924; Stearns, 1925; Finch, 1947; Houghton et al., 2015; Nemeth and Kosik, 2020), though this hypothesis has been questioned by recent modeling efforts (Hsieh and Ingebritson, 2019). Most interpretations of the Keanakākoʻi deposits were heavily influenced by the models of the 1924 eruption (Wentworth, 1938; Powers, 1948; Decker and Christiansen, 1984; McPhie et al., 1990; Swanson et al., 2012). Later work on unit D suggested the deposits originated from eruptions through a standing water lake based on pumice textures, vesiculation data, and glass volatile content to show premature quenching of the deposits compared to dry magmatic deposits of Keanakākoʻi units B and K1 and 1959 Kīlauea Iki (Mastin, 1997; Mastin et al., 2004). Our work clearly demonstrates that the 1924 eruption is not a good model for the unit D explosive activity or for the mechanism of phreatomagmatic eruptions at Kīlauea in general.
Figure 10 shows a plot of the median grain size, modeled deconvolution modes, sphericity, Krumbein roundness, and compactness means as a function of stratigraphic height. We use this stratigraphic presentation of the data to outline the evolution of activity over time.
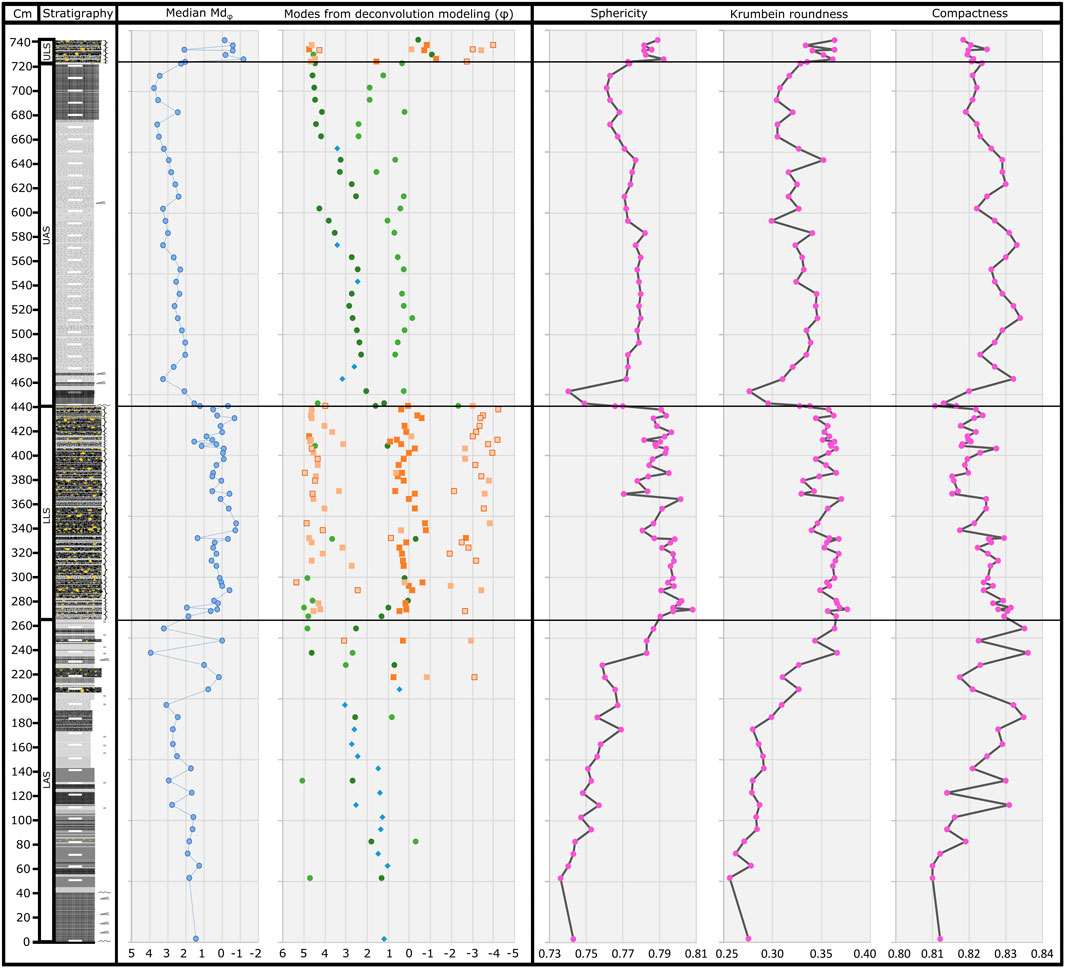
FIGURE 10. Median grain size (in phi), mode grainsizes (in phi), and the sample mean of the three dimensionless shape parameters of sphericity, Krumbein roundness, and compactness shown as a function of sample stratigraphic height and correlated with the stratigraphic column. Horizontal solid black lines show subunit borders as outlined in Figure 3. Refer to text for discussion of data.
The eruption(s) initiate as hot basaltic magma rises to the surface from a magma chamber a few kilometers under the summit of Kīlauea. Degassing during ascent means that a moderately vesicular magma reaches the base of the water lake as indicated by the low value range of shape parameters of the early ash. The initial magma-water interaction results in frequent, small volume explosions generating low jets or plumes depositing laminated ash of mostly medium ash size. This activity might be similar to the intermittent jetting activity observed at Surtsey (Thorarinsson et al., 1964).
As about 2 m of deposit settles at our main section site, explosion frequency waxes and wanes and generates alternating homogeneous and laminated deposits (Figures 3, 10). The shape parameters all increase, showing increasing amounts of blocky and equant grains in the deposits, whereas grain size generally decreases as fragmentation becomes more efficient. The amount of fine ash increases, though the dominant medium ash size does not change until about 140 cm up in the deposit (Figure 10, median and modes). Just above 110 cm the first significant accretionary lapilli bed appears along with a drop in median and mode grain size to fine ash and a change in shard morphology indicated by the sharp increase in compactness (Figure 10). The accretionary lapilli bed also signifies a wetter plume phase. We suggest this represents more continuous magma-water mixing at the vent, which results in highly efficient fragmentation and larger entrainment of water in the plume. This might be similar to the continuous uprush described for Surtsey (Thorarinsson et al., 1964).
At the stratigraphic height of 205 cm, the first lapilli-bearing bed carrying pumice signifies that more vesicular magma has reached the surface. The ash-lapilli beds are interlayered with the finest and thickest homogeneous accretionary lapilli ash beds of the whole deposit (Figure 10, median and modes), showing very high fragmentation efficiency and wet plumes indicating high water availability. The grain size changes are clearly reflected in the variation of compactness values. Sphericity and Krumbein roundness generally increase at the top of the LAS showing the change from shard-dominated morphologies to the blocky, coarse dark gray ash and lapilli with higher parameter values.
The LAS contains two transitional phases (110–140 cm and 205–265 cm) that precede significant changes to the eruption style. The first change seems to be associated with the mode of magma-water interaction, whereas the second is associated with changes to a more vesicular magma.
At the stratigraphic height of 265 cm, the deposit changes to continuous couplets of ash-lapilli beds and layers of fine ash. The grain size modes are remarkably consistent throughout this eruptive phase, which is dominated by the blocky, coarse dark gray ash-lapilli, though relative amounts of each component may vary as indicated by variable layer thickness. Shape parameters change locally with these relative amounts of components in each sample but are also remarkably high and stable throughout the subunit, indicating a continuous and steady-state fragmentation of the more vesicular magma. The thickness differences likely reflect the volume of the magma-water premix at the vent for each explosion.
How this eruptive phase ends is unknown, as the top of the deposits is missing. Activity paused for long enough that both wind and local water erosion modified the top of the deposit. However, observed modern deposits have been substantially eroded within a few days at the summit of Kīlauea by heavy rainstorms. On the other hand, unit D was deposited between units B and C (∼1500 CE) and unit E (∼1650 CE) (Swanson et al., 2012), so decade-long pauses in activity are possible. Interestingly, when activity resumes it closely resembles the beginning of the eruption(s) in terms of lithofacies, grain size and shape parameters. We hypothesize that this indicates a fresh batch of magma rising from the shallow magma chamber, which supports the idea of a longer pause.
Poorly sorted lithofacies starting at the stratigraphic height of 460 cm marks a change in eruptive style to PDC deposition. The next 2.25 m of deposit show generally fining median grain size with repeated patterns of gradually decreasing Mdφ grain sizes in ∼0.2 φ increments with stratigraphic height from 490 to 525 cm, 550–605 cm and 610–670 cm, suggesting three packages of normally graded deposits. The packages are subtly visible from a distance and are defined by surface erosion patterns. We interpret this as three PDC events, where the surges become better developed with time as indicated by the package thickness and systematic grain size decrease. Shape parameters indicate steady state intense fragmentation of a poorly vesiculated magma. However, as previously stated, these are atypical proximal PDC deposits showing only subtle signs of flow deposition. With the vent being situated in a 600 m deep caldera, we suggest that the surges initially hit the caldera wall. Therefore, we interpret the PDC deposits as overspills and/or co-PDC plume deposits resulting from the caldera wall acting as a barrier.
After the PDC deposition, the eruption returns to the intermittent explosive style at the stratigraphic height of 675 cm. However, this time the deposits are dominated by a much finer grain size compared to the early stages of the eruption, suggesting more intense fragmentation.
After another break marked by erosion or nondeposition, the eruptive activity resumes farther north in the caldera and produces the ULS that defines the top of unit D west of the caldera. The ULS thins eastward and was not deposited at our main section location. As the PDC deposit remains regionally confined around the area of the main section, it remains to be seen if any overlap of these eruptive phases can be traced in the field. For now, there is no clear evidence of other activity at the northern vent than the couplets produced by more vesiculated magma interacting with water. The slight increase in median grain size suggests a slightly more vesiculated and hence unstable magma, which is supported by previous work on clast vesicularity (Mastin et al., 2004).
Thus, the unit D deposit is a result of complex phreatomagmatic processes resulting from variability in magma vesicularity, magma ascent rate, water mixing conditions, and water availability. Further field mapping and sampling could lead to a better understanding of the regional extent and thus hazard potential of PDCs and tephra fall. It would also be useful to obtain eruption source parameters for those parts of the deposit that can be mapped regionally; such parameters could be used for eruption scenario forecasts if water again returns to the surface at the summit of Kīlauea.
The repeated interaction of external water and rising magma found in this study can be expected in other basaltic calderas, and our work shows it clearly for a volcano typically characterized by volcanologists as effusive. Explosive deposits are relatively ephemeral, however, and over centuries or millennia can be eroded away, perhaps giving the false impression that the host volcano is docile. We are fortunate at Kīlauea that the Keanakākoʻi Tephra, and specifically Unit D, are well preserved so that a detailed deposit analysis such as we have done can lead to improved understanding of the potentially explosive nature of shield volcanoes.
Our study demonstrates that unit D of the Keanakākoʻi Tephra represents a complex phreatomagmatic deposit, which can be divided into four subunits, six different lithofacies, and three juvenile tephra components. The juvenile deposit components consist of:
• A fine-extremely fine olive-green ash of dense sideromelane grains,
• A medium ash to fine dark gray lapilli of moderately vesicular grains,
• A medium lapilli light yellow pumice of moderate vesicularity.
The stratigraphy contains:
• a lower ash-dominated subunit (LAS) of fall deposits with laminated, coarse, and fine ash lithofacies as well as coarser ash-lapilli lithofacies,
• a lower lapilli-bearing subunit (LLS) of fall deposits in the coupled ash-lapilli lithofacies,
• a break in activity suggested by a period of erosion or non-deposition,
• an upper ash-dominated subunit (UAS) of fall deposits of laminated, and fine ash, but primarily poorly sorted ash lithofacies reflecting dilute PDC deposits,
• another period of erosion or non-deposition, suggesting a longer halt of activity or a shift in vent location,
• an upper lapilli-bearing subunit (ULS) of coupled ash-lapilli lithofacies, which has a different vent area than the other three units.
The small-scale planar bedding throughout most of the deposit points to a general eruption style of small, frequent explosions generating low plumes. Variations in the time between explosions can explain the difference between laminated and coarse ash lithofacies, which are otherwise very similar in terms of grain size and shape metrics. Thicker beds of fine ash with accretionary lapilli are related to very efficient magma-water mixing as indicated by grain size and shape data, not by changes in plume dynamics. The coupled lithofacies show complex fragmentation dynamics, where a more vesicular magma interacts with the external water. We suggest that this change in vesicularity might be related to pockets of increased magma outgassing.
The poorly sorted lithofacies of PDC deposits contain at least three flows that are unconventional as they lack significant dune or cross-bedding structures. We suggest that this is a function of the vent location in a ∼600-m deep caldera, where the caldera wall acted as a barrier and changed the flow dynamics to very dilute overspills and co-PDC plume falls over the top of the wall.
Grain-size modeling shows that most lithofacies are well-defined in terms of median and sorting metrics but have polymodal distributions and that global distribution statistics are inappropriate for quantitative modeling. Instead, deconvolution modeling can be used to assess the different subpopulations, and we found that it worked well for most of the distributions except for two very complex ones. We were able to track grain size changes of each juvenile component for this deposit, which greatly improved interpretation of lithofacies generation and eruption dynamics.
The 2D shape modeling of different grain size bins shows distinct shape values for the three grain size ranges of fine-very fine ash, medium ash-fine lapilli, and medium lapilli, which correspond to the olive-green ash, dark gray ash-lapilli, and pumice lapilli, respectively. The distinct shape profiles in turn reflect different fragmentation mechanisms for the three tephra components, though all were in the brittle fragmentation regime.
The pattern of size-correlated shape parameters shows that it is important to obtain shape data across a wide size range to accurately track grain shapes across the whole deposit. Our dataset was obtained from dynamic image analyzers CAMSIZER P4 and X2 with sample runs of ∼2–5 min per sample per instrument. This method allowed for fast generation of a large internally consistent dataset, which has proven valuable to define and interpret complex phreatomagmatic processes.
Future work includes extensive mapping of the subunits of the unit D deposit in the summit and flank region of Kīlauea as well as generating eruption source parameters for hazard modeling.
A better understanding of explosions at basaltic volcanoes is vital for hazard analysis and risk mitigation. We have demonstrated how repeated interactions of external water and magma can lead to explosions, ranging from mild to strong and including pyroclastic density currents at a typical shield volcano. Our findings for Unit D of Kīlauea’s Keanakākoʻi Tephra may apply to other shield volcanoes, and at calderas where explosive deposits are poorly preserved, similar detailed textural analysis of tephra clasts may afford clues as to past water-magma interactions. We hope that our study helps researchers elsewhere as they deal with such important topics.
The datasets presented in this study can be found in online repositories. The names of the repository/repositories and accession number(s) can be found below: ScienceBase: doi: 10.5066/P97WS3WS.
DS concieved the idea for the study, which was later developed further by JS. JS collected field observations and samples and DS provided critical guidance and feedback. JS carried out lab-analysis, data processing and modeling, and wrote the manuscript draft. DS provided critical revisions, intellectual discussions, and feedback. All authors contributed to the article and approved the submitted version.
This research was supported by the Carlsberg Foundation Internationalisation Postdoc Fellowship for JS. This work was also supported by the Additional Supplemental Appropriations for Disaster Relief Act of 2019 (P.L. 116-20) following the eruption of Kilauea Volcano in 2018 financing analytical instrumentation used in this study.
We are thankful for the social responsibility shown by the Carlsberg Foundation during the global pandemic by awarding JS additional funding allowing her to make up lost field- and laboratory time from the extensive COVID-19 shutdowns. We gratefully acknowledge Microtrac experts Gert Beckmann and Kai Düffels for assistance with finetuning the CAMSIZER instrument setup, and for their knowledgeable advice on data collection. We greatly appreciate scientific discussions with Kendra Lynn, Allan Lerner, Drew Downs, and Julie Chang as we progressed through fieldwork and data interpretations. We are grateful to Kristi Wallace for her helpful review of the manuscript during the internal USGS review process, and thank Pierfrancesco Dellino, reviewer, Pierre-Simon Ross, and editor Tobias Dürig for constructive journal reviews.
Any use of trade, firm, or product names is for descriptive purposes only and does not imply endorsement by the U.S. Government. Sample information, grain size, and 2D grain shape data from this work is available through a USGS data release and can be found here: doi:10.5066/P97WS3WS.
The authors declare that the research was conducted in the absence of any commercial or financial relationships that could be construed as a potential conflict of interest.
All claims expressed in this article are solely those of the authors and do not necessarily represent those of their affiliated organizations, or those of the publisher, the editors and the reviewers. Any product that may be evaluated in this article, or claim that may be made by its manufacturer, is not guaranteed or endorsed by the publisher.
The Supplementary Material for this article can be found online at: https://www.frontiersin.org/articles/10.3389/feart.2023.1153288/full#supplementary-material
Anderson, K. R., Johanson, I. A., Patrick, M. R., Gu, M., Segall, P., Poland, M. P., et al. (2019). Magma reservoir failure and the onset of caldera collapse at Kīlauea Volcano in 2018. Science 366 (6470), eaaz1822. doi:10.1126/science.aaz1822
Biass, S., Swanson, D. A., and Houghton, B. F. (2019). “New perspective on the nineteenth-century golden pumice deposit of Kīlauea Volcano,” in Field Volcanology: A tribute to the distinguished career of don Swanson. Editors M. P. Poland, M. O. Garcia, V. E. Camp, and A. Grunder (USA: Geological Society of America), 227–246.
Blong, R. J. (1984). Volcanic hazards: A source book on the effects of eruptions. Orlando Florida, US: Academic Press Inc.
Blott, S. J., and Pye, K. (2001). Gradistat: A grain size distribution and statistics package for the analysis of unconsolidated sediments. Earth Surf. Process. Landforms 26, 1237–1248. doi:10.1002/esp.261
Borselli, L., and Sarocchi, D. (2022). DECOLOG 6.0.1 (computer software). Avaliable at: https://www.lorenzo-borselli.eu/decolog/.
Brown, R. J., Bonadonna, C., and Durant, A. J. (2012). A review of volcanic ash aggregation. Phys. Chem. Earth 45 (46), 65–78. doi:10.1016/j.pce.2011.11.001
Brown, S. K., Jenkins, S. F., Sparks, R. S. J., Odbert, H., and Auker, M. R. (2017). Volcanic fatalities database: Analysis of volcanic threat with distance and victim classification. J. Appl. Volcanol. 6, 15. doi:10.1186/s13617-017-0067-4
Buttner, R., Dellino, P., La Volpe, L., Lorenz, V., and Zimanowski, B. (2002). Thermohydraulic ex-plosions in phreatomagmatic eruptions as evidenced by the comparison between pyroclasts and products from molten fuel coolant interaction experiments: Thermohydraulic explosions. J. Geophys. Res. Solid Earth 107, ECV 5-1–ECV 5-14. doi:10.1029/2001jb000511
Buttner, R., Dellino, P., and Zimanowski, B. (1999). Identifying magma-water interaction from the surface features of ash particles. Nature 401, 688–690. doi:10.1038/44364
CAMSIZER manual (2020). Manual evaluation software CAMSIZER P4, version 0002. Haan, Germany: Microtrac Retch GMbH.
Cassidy, M., Manga, M., Cashman, K., and Bachmann, O. (2018). Controls on explosive-effusive volcanic eruption styles. Nat. Commun. 9, 2839. doi:10.1038/s41467-018-05293-3
Comida, P. P., Ross, P. S., Durig, T., White, J. D. L., and Lefebvre, N. (2021). Standardized analysis of juvenile pyroclasts in comparative studies of primary magma fragmentation; 2. Choice of size fractions and method optimization. Bull. Volc 84, 5. doi:10.1007/s00445-021-01517-5
Decker, R. W., and Christiansen, R. L. (1984). Explosive eruptions of Kilauea Volcano, Hawaii: Explosive volcanism: Inception, evolution, and hazards. Washington, D.C.: National Research Council, National Academy Press, 122–132.
Durig, T., Bowman, M., White, J., Murch, A., Mele, D., Verolino, A., et al. (2018). PARTIcle shape ANalyzer PARTISAN – An open source tool for multi-standard two-dimensional particle morphometry analysis. Ann. Geophys 61. doi:10.4401/ag-7865
Durig, T., Mele, D., Dellino, P., and Zimanowski, B. (2012a). Comparative analyses of glass fragments from brittle fracture experiments and volcanic ash particles. Bull. Volcanol. 74, 691–704. doi:10.1007/s00445-011-0562-0
Durig, T., Ross, P. S., Dellino, P., White, J. D. L., Mele, D., and Comida, P. P. (2021). A review of statistical tools for morphometric analysis of juvenile pyroclasts. Bull. Volc 83, 79. doi:10.1007/s00445-021-01500-0
Durig, T., White, J. D. L., Murch, A. P., Zimanowski, B., Buttner, R., Mele, D., et al. (2020). Deep-sea eruptions boosted by induced fuel–coolant explosions. Nat. Geosci. 13, 498–503. doi:10.1038/s41561-020-0603-4
Durant, A. J., and Brown, R. J. (2016). “Ash aggregation in volcanic clouds,” in Volcanic ash (Elsevier), 53–65. doi:10.1016/B978-008-100405-0.00006-9
Durig, T., Sonder, I., Zimanowski, B., Beyrichen, H., and Büttner, R. (2012b). Generation of volcanic ash by basaltic volcanism. J. Geophys. Res. 117, B01204. doi:10.1029/2011JB008628
Dürig, T., and Zimanowski, B. (2012). “Breaking news” on the formation of volcanic ash: Fracture dynamics in silicate glass. Earth Planet. Sci. Lett. 335-336, 1–8. doi:10.1016/j.epsl.2012.05.001
Edwards, M. J., Eychenne, J., and Pioli, L. (2021). Formation and dispersal of ash at open conduit basaltic volcanoes: Lessons from etna. Front. Earth Sci. 9, 709657. doi:10.3389/feart.2021.709657
Garcia, M. O., Mucek, A. E., Lynn, K. J., Swanson, D. A., and Norman, M. D. (2018). “Geochemical evolution of Keanakako‘i tephra, Kīlauea volcano, Hawai‘i,” in Field Volcanology: A tribute to the distinguished career of don Swanson, 538. Editors M. P. Poland, M. O. Garica, V. E. Camp, and A. Grunder (Boulder, Colorado, US: The Geological Society of America), 203–225.
Giordano, D., Russell, J. K., and Dingwell, D. B. (2008). Viscosity of magmatic liquids: A model. Earth Planet Sci. Lett. 271, 123–134. doi:10.1016/j.epsl.2008.03.038
Helz, R. T., Clague, D. A., Mastin, L. G., and Rose, T. R. (2014). Electron micro-probe analyses of glasses from Kilauea tephra units, Kilauea Volcano. Hawaii: U.S. Geological Survey Open-File Report 2014-1090, 24. doi:10.3133/ofr20141090
Houghton, B. F., and Gonnermann, H. M. (2008). Basaltic explosive volcanism: Constraints from deposits and models. Chem. Erde 68, 117–140. doi:10.1016/j.chemer.2008.04.002
Houghton, B., White, J. D. L., and Van Eaton, A. R. (2015). “Phreatomagmatic and related eruption styles,” in Encyclopedia of volcanoes. Editor H. Sigurdsson (London: Academic Press), 537–552. doi:10.1016/B978-0-12-385938-9.00030-4
Hsieh, P. A., and Ingebritsen, S. E. (2019). Groundwater inflow toward a preheated volcanic conduit: Application to the 2018 eruption at Kīlauea Volcano, Hawai‘i. J. Geophys. Res. Solid Earth 124 (2), 1498–1506. doi:10.1029/2018JB017133
Inman, D. L. (1952). Measures for describing the size distribution of sediments. J. Sediment. Res. 22 (3), 125–145. doi:10.1306/D42694DB-2B26-11D7-8648000102C1865D
Jaggar, T. A., and Finch, R. H. (1924). The explosive eruption of Kilauea in Hawaii, 1924, Am. J. Sci. 5 (47), 353–374. doi:10.2475/ajs.s5-8.47.353
Kauahikaua, J. (1993). Geophysical characteristics of the hydrothermal systems of Kilauea Volcano, Hawai'i. Geothermics 22, 271–299. doi:10.1016/0375-6505(93)90004-7
Keller, G. V., Grose, L. T., Murray, J. C., and Skokan, C. K. (1979). Results of an experimental drill hole at the summit of Kilauea Volcano, Hawai'i. J. Volcanol. Geotherm. Res. 5, 345–385. doi:10.1016/0377-0273(79)90024-6
Krumbein, W. C. (1941). Measurement and geological significance of shape and roundness of sedimentary particles. J. Sediment. Pet. 11, 64–72.
La Spina, G., Arzilli, F., Llewellin, E. W., Burton, M. R., Clarke, A. B., de' Michieli Vitturi, M., et al. (2021). Explosivity of basaltic lava fountains is controlled by magma rheology, ascent rate and outgassing. Earth Planet. Sci. Lett. 553, 116658. doi:10.1016/j.epsl.2020.116658
Lerner, A. H., Sublett, D. M., Cauley, C., Wallace, P. J., and Bodnar, R. J. (2021). Magma storage depths and excess CO2 fluids from the explosive Keanakākoʻi tephra (Kīlauea Volcano, Hawaiʻi) based on measurements of melt and fluid inclusions. Hawai: Abstract AGU Fall Meeting.
Lynn, K., Garcia, M. O., Shea, T., Costa, F., and Swanson, D. A. (2017). Time-scales of mixing and storage for Keanakako‘i Tephra magmas (1500– 1820 C.E), Kilauea Volcano, Hawai‘i. Contributions Mineralogy Petrology 172, 76. doi:10.1007/s00410-017-1395-4
Lynn, K., and Swanson, D. A. (2022). Olivine and glass chemistry record cycles of plumbing system recovery after summit collapse events at Kīlauea Volcano, Hawai‘i. J. Volcanol. Geotherm. Res. 426, 107540. doi:10.1016/j.jvolgeores.2022.107540
Mastin, L. G., Christiansen, R. L., Thornber, C., Lowenstern, J., and Beeson, M. (2004). What makes hydromagmatic eruptions violent? Some insights from the Keanakako‘i ash. Kilauea Volcano, Hawai‘i J. Volcanol. Geotherm. Res. 137, 15–31. doi:10.1016/j.jvolgeores.2004.05.015
Mastin, L. G. (1997). Evidence for water influx from a caldera lake during the explosive hydromagmatic eruption of 1790 Kīlauea Volcano, Hawaii. J. Geophys. Res. 102, 20093–20109.
Mastin, L. G. (2007). Generation of fine hydromagmatic ash by growth and disintegration of glassy rinds. J. Geophys. Res. 112, B02203. doi:10.1029/2005JB003883
May, M., Carey, R. J., Swanson, D. A., and Houghton, B. F. (2015). “Reticulite-producing fountains from ring fractures in Kilauea Caldera ca. 1500 CE,” in Hawaiian volcanoes: From source to surface. Editors R. Carey, V. Cayol, M. Poland, and D. Weis (Washington, DC: AGU, American Geophysical Union, Hoboken, New Jersey: John Wiley & Sons), 351–367. doi:10.1002/9781118872079.ch16
McPhie, J., Walker, G. P. L., and Christiansen, R. L. (1990). Phreatomagmatic and phreatic fall and surge deposits from explosions at Kilauea Volcano, Hawaii, 1790 A.D.: Keanakakoi ash member. Bull. Volcanol. 52, 334–354. doi:10.1007/BF00302047
Mele, D., Dioguardi, F., and Dellino, P. (2018). A study on the influence of internal structures on the shape of pyroclastic particles by X-ray microtomography investigations. Ann. Geophys. 61, AC27. doi:10.4401/ag-7868
Mele, D., and Dioguardi, F. (2018). The grain size dependency of vesicular particle shapes strongly affects the drag of particles. First results from microtomography investigations of Campi Flegrei fallout deposits. J. Volcanol. Geotherm. Res. 353, 18–24. doi:10.1016/j.jvolgeores.2018.01.023
Murtagh, R. M., and White, J. D. L. (2013). Pyroclast characteristics of a subaqueous to emergent Surtseyan eruption, Black Point volcano, California. J. Volcanol. Geotherm. Res. 267, 75–91. doi:10.1016/j.jvolgeores.2013.08.015
Nadeau, P. A., Diefenbach, A. K., Hurwitz, S., and Swanson, D. A. (2020). From lava to water: A new era at Kīlauea. Eos 101, 557. doi:10.1029/2020EO149557
Neal, C. A., Brantley, S. R., Antolik, L., Babb, J. L., Burgess, M., Calles, K., et al. (2019). The 2018 rift eruption and summit collapse of Kīlauea Volcano. Science 363 (6425), 367–374. doi:10.1126/science.aav7046
Neal, C. A., and Lockwood, J. P. (2003). Geologic map of the summit region of Kilauea Volcano, Hawaii: U.S. Geological survey geologic investigations series map I-2759.
Nemeth, K., and Kosik, S. (2020). Review of explosive hydrovolcanism. Rev. Explos. hydrovolcanism Geosciences 10, 44. doi:10.3390/geosciences10020044
Patrick, M. R., Swanson, D. A., Zoeller, M. H., Mulliken, K. M., Parcheta, C. E., Lynn, K. J., et al. (2021). Water-level data for the crater lake at the summit of Kīlauea Volcano, Island of Hawaiʻi, 2019–2020. Hawai: U.S. Geological Survey data release. doi:10.5066/P9262JDH
Poland, M. P., Miklius, A., and Montgomery-Brown, E. K., 2014, Magma supply, storage, and transport at shield-stage Hawaiian volcanoes, 178–235. In: M. P. Poland, T. J. Takahashi, and C. M. Landowski (Editors), Characteristics of Hawaiian volcanoes, U.S. Geological Survey 1801, 429. doi:10.3133/pp1801
Ross, P. S., Dürig, T., Comida, P. P., Lefebvre, N., White, J. D., Andronico, D., et al. (2022). Standardized analysis of juvenile pyroclasts in comparative studies of primary magma fragmentation; 1. Overview and workflow. Bull. Volcanol. 84, 13–29. doi:10.1007/s00445-021-01516-6
Schmith, J., Hoskuldsson, Á., and Holm, P. M. (2017). Grain shape of basaltic ash populations: Implications for fragmentation. Bull. Volc 79, 14. doi:10.1007/s00445-016-1093-5
Schmith, J., Hoskuldsson, Á., Holm, P. M., and Larsen, G. (2018). Large explosive basaltic eruptions at Katla volcano, Iceland: Fragmentation, grain size and eruption dynamics. J. Volcanol. Geotherm. Res. 354, 140–152. doi:10.1016/j.jvolgeores.2018.01.024
Sheridan, M. F., and Wohletz, K. H. (1983). Hydrovolcanism: Basic considerations and review. J. Volcanol. Geotherm. Res. 17 (1-4), 1–29. doi:10.1016/0377-0273(83)90060-4
Sonder, I., Harp, A., Graettinger, A. H., Moitra, P., Valentine, G. A., Büttner, R., et al. (2018). Meter-scale experiments on magma-water interaction. J. Geophys. Res. Solid Earth 123 (10), 615. doi:10.1029/2018JB015682
Stearns, H. T. (1925). The explosive phase of Kilauea Volcano, Hawaii, in 1924. Bull. Volcanol. 2 (2), 193–208. doi:10.1007/BF02719505
Swanson, D. A., and Houghton, B. F. (2018). “Products, processes, and implications of Keanakāko‘i volcanism, Kīlauea Volcano, Hawai‘i,” in Field Volcanology: A tribute to the distinguished career of don Swanson. Editors M. P. Poland, M. O. Garcia, V. E. Camp, and A. Grunder (Boulder, Colorado, US: The Geological Society of America), 159–190. doi:10.1130/2018.2538(07
Swanson, D. A., Rose, T. R., Fiske, R. S., and McGeehin, J. P. (2012). Keanakākoʻi Tephra produced by 300years of explosive eruptions following collapse of Kīlauea's caldera in about 1500CE. J. Volcanol. Geotherm. Res. 215–216, 8–25. doi:10.1016/j.jvolgeores.2011.11.009
Swanson, D. A., Rose, T. R., Mucek, A. E., Garcia, M. O., Fiske, R. S., and Mastin, L. G. (2014). Cycles of explosive and effusive eruptions at Kīlauea Volcano, Hawai‘i. Hawai‘i Geol. 42, 631–634. doi:10.1130/g35701.1
Swanson, D. A., Weaver, S. J., and Houghton, B. F. (2015). Reconstructing the deadly eruptive events of 1790 CE at K lauea Volcano, Hawai'i. Geol. Soc. Am. Bull. 127, 503–515. doi:10.1130/B31116.1
Thivet, S., Carlier, J., Gurioli, L., Di Muro, A., Besson, P., Smietana, M., et al. (2022). Magmatic and phreatomagmatic contributions on the ash-dominated basaltic eruptions: Insights from the april and november–december 2005 paroxysmal events at karthala volcano, Comoros. J. Volcanol. Geotherm. Res. 424, 107500. doi:10.1016/j.jvolgeores.2022.107500
Thorarinsson, S., Einarsson, T., Sigvaldason, G., and Elisson, G. (1964). The submarine eruption off the vestmann islands 1963–64: A preliminary report. Bull. Volcanol. 27, 435–445. doi:10.1007/bf02597544
Van Eaton, A. R., Muirhead, J. D., Wilson, C. J. N., and Cimarelli, C. (2012). Growth of volcanic ash aggregates in the presence of liquid water and ice: An experimental approach. Bull. Volcanol. 74, 1963–1984. doi:10.1007/s00445-012-0634-9
Verolino, A., White, J. D. L., Baxter, R. J. M., Schipper, C. I., and Thordarson, T. (2022). Characteristics of sub-aerially emplaced pyroclasts in the Surtsey eruption deposits: Implications for diverse surtseyan eruptive styles. Geosciences 12, 79. doi:10.3390/geosciences12020079
Walker, G. P. L., and Croasdale, R. (1972). Characteristics of some basaltic pyroclastics. Bull. Volcanol. 35 (2), 303–317. doi:10.1007/bf02596957
Walker, G. P. L. (1971). Grain-size characteristics of pyroclastic deposits. J. Geol. 79, 696–714. doi:10.1086/627699
Wentworth, C. K. (1938). Ash formations of the island of Hawaii. Honolulu: Hawaiian Volcano Research Association, 183.
White, J. D. L., and Houghton, B. F. (2006). Primary volcaniclastic rocks. Geology 34, 677. doi:10.1130/g22346.1
White, J. D. L., and Valentine, G. A. (2016). Magmatic versus phreatomagmatic fragmentation: Absence of evidence is not evidence of absence. Geosphere 12, 1478–1488. doi:10.1130/ges01337.1
Wohletz, K. H. (1983a). Mechanisms of hydrovolcanic pyroclast formation: Grain-size, scanning electron microscopy, and experimental studies. J. Volcanol. Geotherm. Res. 17, 31–63. doi:10.1016/0377-0273(83)90061-6
Wohletz, K. H. (1983b). Chemical and textural features of pyroclasts from hydrovolcanic eruption sequences. report LA-UR-83–250. Los Alamos, New Mexico, US: Los Alamos National Laboratory.
Wohletz, K. H. (1986). Explosive magma-water interactions: Thermodynamics, explosion mechanisms, and field studies. Bull. Volcanol. 48, 245–264. doi:10.1007/bf01081754
Wohletz, K., Zimanowski, B., and Büttner, R. (2013). Modeling volcanic processes. New York: Cambridge University Press, 230–257.
Zimanowski, B. (1998). in Phreatomagmatic explosions,” in from magma to tephra, developments in Volcanology 4. Editors A. Freundt, and M. Rosi (Amsterdam: Elsevier), 25–54.
Zimanowski, B., Buttner, R., Lorenz, V., and Hafele, H. G. (1997). Fragmentation of basaltic melt in the course of explosive volcanism. J. Geophys Res. 102, 803–814. doi:10.1029/96jb02935
Keywords: phreatomagmatic, explosive, stratigraphy, grain size, grain shape, Kīlauea, Keanakākoʻi, basaltic
Citation: Schmith J and Swanson DA (2023) Complex styles of phreatomagmatic explosions at Kīlauea Volcano, Hawaii, controlled by magma structure. Front. Earth Sci. 11:1153288. doi: 10.3389/feart.2023.1153288
Received: 29 January 2023; Accepted: 02 August 2023;
Published: 24 August 2023.
Edited by:
Tobias Dürig, University of Iceland, IcelandReviewed by:
Pierfrancesco Dellino, University of Bari Aldo Moro, ItalyCopyright © 2023 Schmith and Swanson. This is an open-access article distributed under the terms of the Creative Commons Attribution License (CC BY). The use, distribution or reproduction in other forums is permitted, provided the original author(s) and the copyright owner(s) are credited and that the original publication in this journal is cited, in accordance with accepted academic practice. No use, distribution or reproduction is permitted which does not comply with these terms.
*Correspondence: J. Schmith, am9oYW5uZXNjaG1pdGhAZ21haWwuY29t
Disclaimer: All claims expressed in this article are solely those of the authors and do not necessarily represent those of their affiliated organizations, or those of the publisher, the editors and the reviewers. Any product that may be evaluated in this article or claim that may be made by its manufacturer is not guaranteed or endorsed by the publisher.
Research integrity at Frontiers
Learn more about the work of our research integrity team to safeguard the quality of each article we publish.