- 1Department of Earth Science, Interdisciplinary Faculty of Science and Engineering, Shimane University, Matsue, Japan
- 2Department of Geology, Faculty of Science, Niigata University, Niigata, Japan
Introduction: Metadolerite dykes in the Western Dharwar Craton represent the oldest generation of mafic dyke swarms in the craton. The emplacement of these dykes after a period of crust building activity and komatiite volcanism, helps to understand the evolution of Subcontinental Lithospheric Mantle (SCLM) and Archean dynamics.
Methods: We report whole rock major, trace element geochemistry and Sr-Nd isotope characteristics for this weakly metamorphosed suite of dykes. Remnant igneous textures and mineralogy are well preserved.
Results: The trace and rare earth element concentrations and an overall flat pattern suggests depleted mantle source for these dykes. Three groups are primarily identified: Group one with initial 87Sr/86Sr ratios varying between 0.70041 and 0.70102, Group two dykes and Group three dykes with initial ratios 0.70045–0.70154, and 0.70041–0.70153 respectively. Group one dykes show a good Rb-Sr isochron relationship and an errorchron age of ca. 3,003 ± 102 Ma is obtained. The initial 143Nd/144Nd ratios varies from 0.508,245 to 0.509,172. The epsilon Nd values are mostly negative, ranging between −12 and +5. Group one and two show an epsilon Nd value ranging between −1 and +5 and 0.1 to +5 respectively and group three varies between −0.5 and −12.
Discussion: The geochemical characteristics suggest that the group one dykes are derived from a homogenous depleted SCLM source, group two formed by a lower degree of partial melting of a source mantle with enriched components. Group three may have formed from a progressively enriched group one source. All these dykes can be considered as exposed remnants of feeders for the greenstone volcanism in the Western Dharwar Craton.
1 Introduction
The geotectonic framework of the early earth is considerably different from present day owing to the high mantle temperatures, early crust-mantle differentiation, large mantle convection and crustal recycling processes (Hoffman and Ranalli, 1988; Armstrong, 1991; Bowring and Housh, 1995; Brown et al., 1995). The formation of continental crust in the Archean and recycling back into the mantle drastically changed the nature and composition of subcontinental lithospheric mantle (SCLM) in the Archean itself (Hawkesworth et al., 2010; Dhuime et al., 2012; Johnson et al., 2019). While these early formed crusts are limited in their distribution as present-day Archean cratonic nuclei, they preserve excellent records of the Archean dynamics including continental growth, episodic mafic magmatism, continental rifting, and breakup of protocontinents with associated production of Large Igneous Provinces (LIPs) (Bleeker, 2003; Ernst et al., 2005; Ernst and Bleeker., 2010). One of the key features of such Archean cratons is the regional scale mafic dyke swarms which are principal constituents of several ancient supercontinents or supercratons (Ernst and Buchan, 2001; Bleeker, 2003; Bleeker and Ernst, 2006; French and Heaman, 2010 and the references therein). Such episodes are often correlated with major Large Igneous Provinces (LIPs), the magmatic events during which large volumes of mantle generated materials are emplaced within a short period of time. The giant mafic dyke swarms in the Archean cratons are thought to be the exposed remnants of deeply eroded LIPs (Coffin and Eldholm, 1991; Coffin and Eldholm, 1994; Ernst, 2014) and they provide crucial information regarding the nature and composition of the subcontinental lithospheric mantle during its formation.
Precambrian mafic dyke swarms are common within Archean cratons and the Dharwar Craton of southern India is one such craton where dyke swarms of varying generations and dimensions are present (Figure 1). These dykes intrude basement gneisses and supracrustal rocks and are especially prominent in the Eastern Dharwar Craton (∼2.37 to ∼1.79 Ga) (Chatterjee and Bhattacharji, 2001; French and Heaman, 2010; Srivastava et al., 2014; Srivastava et al., 2015; Rai et al., 2019; Pandey and Paul, 2022, and the references therein). The Western Dharwar Craton on the other hand is characterized by the abundance of greenstone belts and ultramafic volcanics including komatiites (Jayananda et al., 2008; Patra et al., 2021; Ravindran et al., 2021 and the references therein) and coexisting mafic dykes. Such widespread volcanic activity succeeding large scale crust building activity has led to the development of heterogeneous depleted mantle reservoirs beneath the Western Dharwar craton in the Mesoarchean (Jayananda et al., 2008; Jayananda et al., 2018; Jayananda et al., 2022). The formation and evolution of subcontinental lithospheric mantle during the Archean is complicated by the subduction of early formed oceanic crust and plume activities (Rudnick et al., 1998; Stern, 2005; Cawood et al., 2013; Jayananda et al., 2015; Bédard, 2018; Jayananda et al., 2018; Hawkesworth and Jaupart, 2021). The fact that the mantle temperatures were high during the Archean (Choukroune et al., 1995; Monteux et al., 2020), makes it much more difficult to understand the behavior of SCLM during Archean. The mafic dyke swarms in the Western Dharwar craton are also peculiar in that they occur as elongate hills with the surrounding rocks deeply eroded. Unmetamorphosed dolerite dykes (Rb-Sr errorchron age ∼2.7 Ga; Silpa et al., 2021) have been reported from the Western Dharwar Craton along with older metamorphosed dykes showing remnants of igneous textures and mineralogy (Silpa and Satish-Kumar, 2018; Rai et al., 2019). Considering the dykes are typically the remnants of large-scale volcanism (Halls et al., 2000; Ernst and Buchan, 2001; Halls et al., 2007) the metamorphosed dykes are thought to be the feeders of the widespread greenstone volcanism in Western Dharwar Craton (WDC). These older dykes restricted to WDC, termed as metadolerite dykes (Silpa and Satish-Kumar, 2018) are considered in the present study. We report their Sm-Nd isotopic compositions along with major, trace and rare earth element geochemistry to understand the mantle source characteristics and early evolution of Archean subcontinental lithospheric mantle (SCLM).
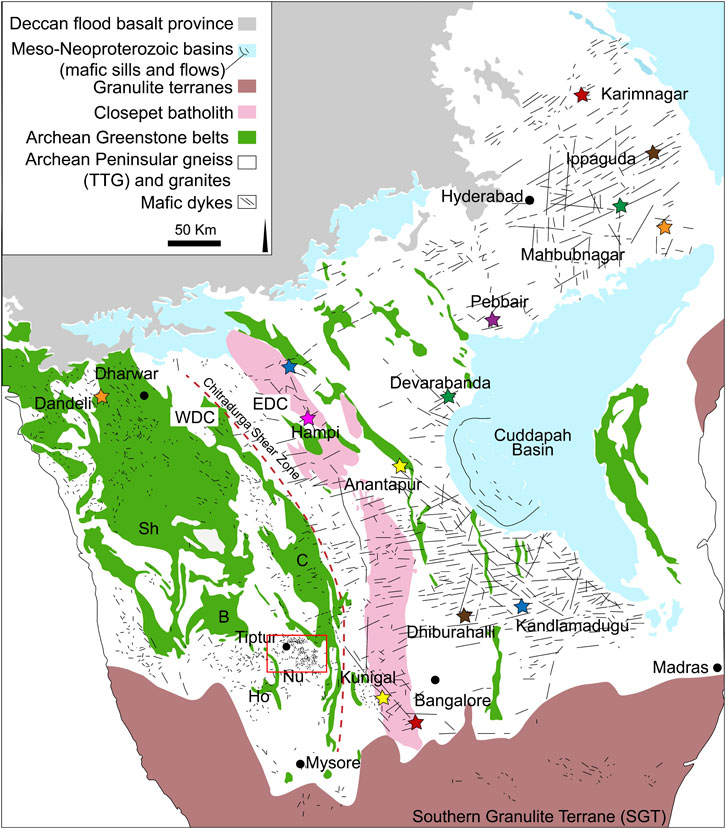
FIGURE 1. Simplified geological map of Dharwar craton showing the distribution of mafic dykes (modified after French and Heaman, 2010). Traditional classification of Dharwar craton is marked as WDC and EDC, Greenstone belts are: Sh- Shimoga; C- Chitradurga; B-Bababudan; Nu- Nuggihalli; Ho- Holenarsipur. Areal extent of recognized mafic dyke swarms after Söderlund et al. (2019) are marked with the same-colored stars. Tiptur swarm is the major dyke swarm in the Western Dharwar Craton, and area of the current study is marked as the red box.
2 Geological background
The Dharwar craton (DC) of southern India is one of the oldest and well-preserved cratonic blocks in India and is traditionally divided into two major units based on the crustal thickness, age, and lithological characteristics as Western Dharwar Craton (WDC) and Eastern Dharwar Craton (EDC) (Jayananda et al., 2000; Gupta et al., 2003; Ramakrishnan and Vaidyanathan, 2008). The shear zone to the east of Chitradurga Greenstone belt is considered the boundary between these two blocks (Jayananda et al., 2006). Recent studies divide the craton into three blocks (Western, Central and Eastern blocks) based on the age, thermal and accretionary histories, separated by major shear zones (Peucat et al., 2013; Jayananda et al., 2018; Jayananda et al., 2020). Similar to other Archean cratons of the world, Dharwar craton is predominantly composed of tonalite-trondhjemite-granodiorite (TTG) type gneisses, volcano-sedimentary greenstone belts and calc-alkaline to potassic granitoid rocks (Peucat et al., 2013; Jayananda et al., 2018; Swami Nath and Ramakrishnan, 1981 and the references therein). The western block is regarded as the oldest part of the craton and consists of TTG type gneisses known as Peninsular gneiss (c. 3.4–3.2 Ga), two generations of greenstone belts: older c. 3.35–3.10 Ga Sargur Group and younger c. 2.9–2.6 Ga Dharwar Supergroup and high potassic plutons (Swami Nath and Ramakrishnan, 1981; Jayananda et al., 2008; Ramakrishnan and Vaidyanathan, 2008; Mukherjee et al., 2012; Jayananda et al., 2015). The central block consists of older TTGs (c. 3.23–2.96 Ga) along with younger transitional TTGs (c. 2.7–2.6 Ga), linear greenstone belts and calc-alkaline granitoids. In contrast to these two blocks, the eastern block is composed of younger transitional TTGs (c. 2.7–2.5 Ga) and thin belts of greenstone sequences along with calc-alkaline plutons (Jayananda et al., 2000; Dey et al., 2012; Jayananda et al., 2018).
The entire craton is profusely intruded by Archean to early Proterozoic mafic dyke swarms (Figure 1). Distinct mafic magmatic events between ∼2.37 and ∼1.79 Ga are recognized especially in the Eastern Dharwar Craton and are well defined by several researchers and are related to the presence of ancient LIPs. They include the most widespread ∼2.37 Ga giant radiating Bangalore dyke swarm, globally correlated 2.22 Ga dyke swarm, 450 km long N-S trending 2.21 Ga Andhra-Karnataka Long Dyke (AKLD), and the 1.79 Ga Pebbair swarm (Chatterjee and Bhattacharji, 2001; Halls et al., 2007; French et al., 2008; French and Heaman, 2010; Kumar et al., 2012a; Kumar et al., 2012b; Belica et al., 2014; Srivastava et al., 2014; Srivastava et al., 2015; Nagaraju et al., 2018a; Nagaraju et al., 2018b; Rai et al., 2019; Söderlund et al., 2019; Pandey and Paul, 2022, and the references therein). Only limited data are available for the mafic dyke swarms in the Western Dharwar Craton. Previous researchers recognized three main dyke swarms in the WDC, concentrated towards the southern part of the craton (Murthy et al., 1987; Radhakrishna and Joseph, 1993; Meert and Pandit, 2015). However, recent studies on the mafic dyke swarms of WDC reported dykes that are exclusive to the Western Dharwar Craton along with younger generations of dykes that are geochemically coherent to the ∼2.37 Ga dykes of the EDC (Silpa and Satish-Kumar, 2018; Rai et al., 2019; Yadav et al., 2020; Silpa et al., 2021; Silpa et al., 2021; Pandey and Paul., 2022). Unmetamorphosed dykes that preserve pristine igneous textures and mineralogy including ∼2.7 Ga (Rb-Sr errorchron age) olivine dolerite dykes (Silpa et al., 2021a; Silpa et al., 2021b.) and older metamorphosed dykes with remnants of igneous textures and mineralogy are recognized in the Western Dharwar Craton (Silpa and Satish-Kumar, 2018; Rai et al., 2019).
Mafic dykes are abundantly distributed in the southern part of the Western Dharwar Craton in the major swarm called Tiptur swarm. The dykes can be generally classified as younger dolerite dykes that are mostly trending in NW-SE direction and the older NE-SW trending metadolerite dykes (Silpa and Satish-Kumar, 2018). This study focuses on the metadolerite dykes (Figure 2A) that are predominantly NE-SW in orientation. They normally occur as boulders or continuous hillocks (Figure 2B) extending a few meters to hundreds of meters in length. They rarely preserve any chilled margin and cross cutting relationship with the surrounding rocks owing to its prolonged exposure. In hand specimen the dykes are slightly greenish in color, lack visible plagioclase laths. In contrast the younger dolerite dykes have observable laths and are dark black in color and in places preserve contact relations with country rocks.
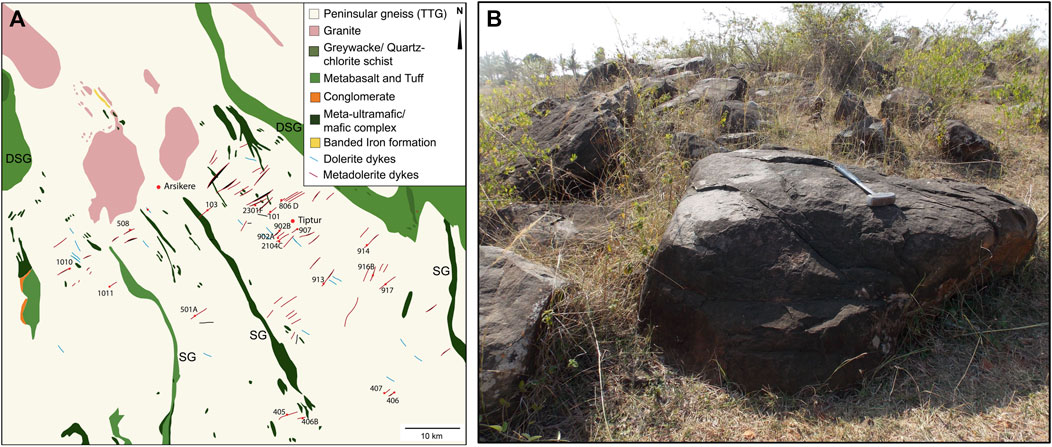
FIGURE 2. (A) Simplified geologic map of Tiptur area showing the distribution of dykes (modified from Geological Survey of India quadrangle map, 1994) and sampling locations (B) typical field occurrence of a NE-SW trending metadolerite dykes as extended hill. SG, Sargur group; DSG, Dharwar supergroup.
3 Materials and methods
Multiple samples were collected from 21 representative metadolerite dyke locations and petrographic thin sections were prepared. For geochemical analysis, thin slabs were cut, cleaned, and pulverized in an agate ball mill. The major elements and selected trace element concentrations were measured by using the X-ray Fluorescence Spectrometer (XRF) facility (Rigaku RIX 3000). Trace and rare earth elements were analyzed using the Inductively Coupled Plasma Mass Spectrometer (Agilent 7500a) facility housed at the Department of Geology, Faculty of Science, Niigata University.
Glass beads were prepared from the powdered samples for whole rock geochemical analysis using XRF. The powdered samples were dried in a muffle furnace for 6 hours at > 900°C to calculate the Loss on Ignition (LOI) of the samples. The dried sample powders were then mixed with anhydrous lithium tetraborate (LiB4O7) and lithium metaborate (LiBO2) flux (2:1 ratio). The mixture was fused into a glass bead in a platinum crucible. The geochemical compositions were measured using the prepared glass beads with JB-1b (basalt) as the standard. The detailed analytical procedure is given in Takahashi and Shuto (1997). For ICP-MS analysis, sample preparation used the acid digestion method of Yokoyama et al., 1999. Sample powder weighing 0.1 g was taken in a Teflon vial and completely dissolved by adding hydrofluoric acid (HF), nitric acid (HNO3), and perchloric acid (HClO4) in step with heating and evaporating in a fume hood. The sample was then diluted with HNO3, and trace and rare earth element concentrations measured by ICP-MS following the analytical procedure of Senda et al. (2014). Internal standards were 115In, 185Re and 209Bi, the USGS standards BHVO2 and W-2a were used for drift correction and calibration and the external standard used was JB-2 (basalt).
The Rb-Sr and Sm-Nd isotope measurements employed cation exchange chromatography with a two-step column separation technique (Hamamoto et al., 2000; Takahashi et al., 2009). The sample preparation procedure was carried out in a clean room facility (class 100 laminar flow hood and class 10,000 clean room) at the Faculty of Science, Niigata University to prevent any contamination. Initial sample digestion was done by adding hydrofluoric acid (HF), nitric acid (HNO3), and hydrochloric acid (HCl). Sr and the REE were separated using AG50W-X8 resin during the first column separation. The separation and purification of Sr and Nd were done using a second column. In the second column separation for Sr, Sr spec. resin was used, and Nd separated from the other REE by ion-exchange chromatographic technique, using α-hydroxy isobutyric acid (HIBA) as the eluent. Purified Sr was loaded on a degassed rhenium filament with Ta activator on either side of Sr. The isotope ratios were measured using Thermal Ionization Mass Spectrometer (TIMS) MAT 262. Subsequently, the purified Nd was loaded onto the filament and measured by TIMS. NIIST 987 was used as the standard for Sr measurements and the mean ratio was 0.710,221 ± 0.00002 (SD, n = 11). The standard used for Nd was JNdi-1 which gave a mean ratio of 0.512,046 ± 0.000025 (SD, n = 8).
4 Results
4.1 Petrography
The dykes in the current study are chiefly composed of plagioclase, clinopyroxene and amphibole along with opaque phases. Even though the medium to fine-grained plagioclase shows varying degrees of alteration, lath shapes are distinguishable (Figures 3A–D) and show remnant ophitic textures. Clinopyroxene is mostly subhedral to anhedral, medium to coarse-grained and locally altered along the grain boundaries (Figures 3A, B). Amphibole exhibit a light green color under plane polarized light and long slender needles of hornblende are commonly observed (Figure 3A). Minor biotite and chlorite were observed in a few thin sections. The opaque minerals are mostly pyrrhotite, pyrite and chalcopyrite (Silpa and Satish-Kumar, 2022). Despite low-temperature metamorphism, remnants of the original mineralogy and original igneous textures (eg., ophitic texture; Figures 3C, D) are well preserved and hence we termed these rocks metadolerites.
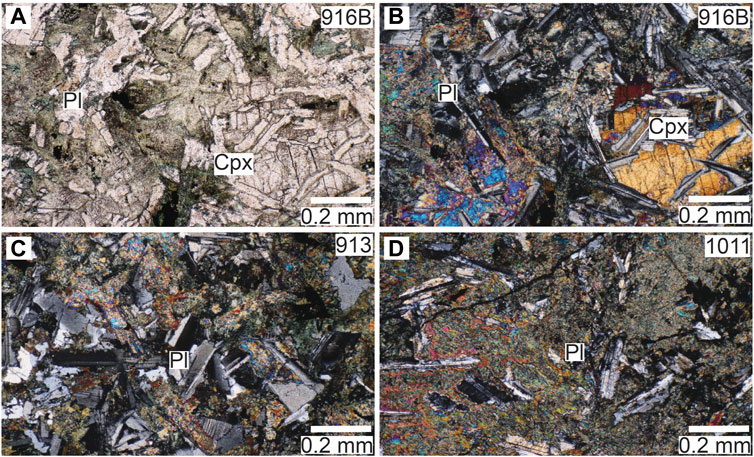
FIGURE 3. Photomicrographs of metadolerite dykes showing (A) remnant igneous textures, chief minerals (B) clinopyroxene (C) plagioclase and (D) amphibole. Detailed descriptions are given in the text.
4.2 Geochemistry
The whole rock geochemical compositions (see Table 1) of metadolerite dykes from the Tiptur area show an SiO2 content varying between 49.8 and 54.57 wt%, indicating their general mafic nature. In the Total Alkali versus Silica (TAS) diagram (Figure 4A; Le Maitre, 2002) most samples fall in sub-alkaline field. They range in composition from basalt to basaltic andesite and are mostly tholeiitic (Figure 4B; Irvine and Baragar, 1971). Major, trace, and rare earth element distributions of the studied dykes indicate the presence of three different groups, hereafter referred as group 1, 2, and 3.

TABLE 1. The whole rock major oxides, trace and rare-earth element geochemical compositions of the studied metadolerite dykes from the Tiptur area, Western Dharwar Craton, southern India.
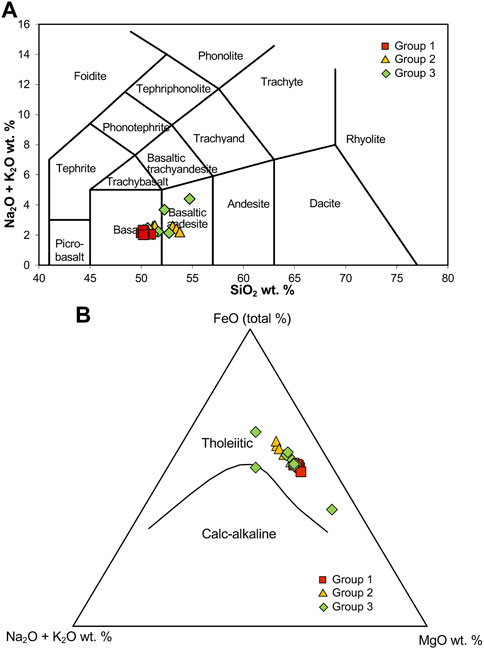
FIGURE 4. (A) Total Alkali versus Silica (TAS) diagram (after Le Maitre, 2002) showing the general classification of dykes as basalt to basaltic andesite in composition and (B) tholeiitic in the AFM (alkali, Fe, and Mg oxides) ternary diagram (after Irvine and Baragar, 1971).
The SiO2 content ranges from 49.8 to 50.77 wt%, for group one dykes, 50.98 to 53.6 wt% for group two dykes and 50.06 to 54.57 wt% for group three dykes. The Mg# (MgO/(MgO+FeO)*100) are low and varies from 22 to 42 except for one sample showing a value of 57. Major oxides like Al2O3 have a concentration varying between 10.77 and 15.9 wt%. MgO content for group one varies from 7.51 to 8.32 wt%, group two from 5.81 to 6.77 wt% and group three from 4.41 to 15.02 wt%. FeO varies between 10.77 and 15.27 wt%, K2O and Na2O varies from 0.11 to 1.1 wt% and 0.18 to 0.23 wt% respectively. In the basic Harker-type discrimination diagrams, Group one samples are mostly clustered in their distribution (See Figures 5A–F). The SiO2 versus the major oxides for group 2 samples show a slight negative correlation for MgO (Figure 5C) and groups 2 and 3 exhibit a positive correlation for K2O (Figure 5F). Other major oxides like and TiO2 (Figure 5A), Al2O3 (Figure 5B) and FeO (Figure 5D) doesn’t show much variation in their distributions; group 1 is mostly clustered and group 2 and 3 show a linear trend.
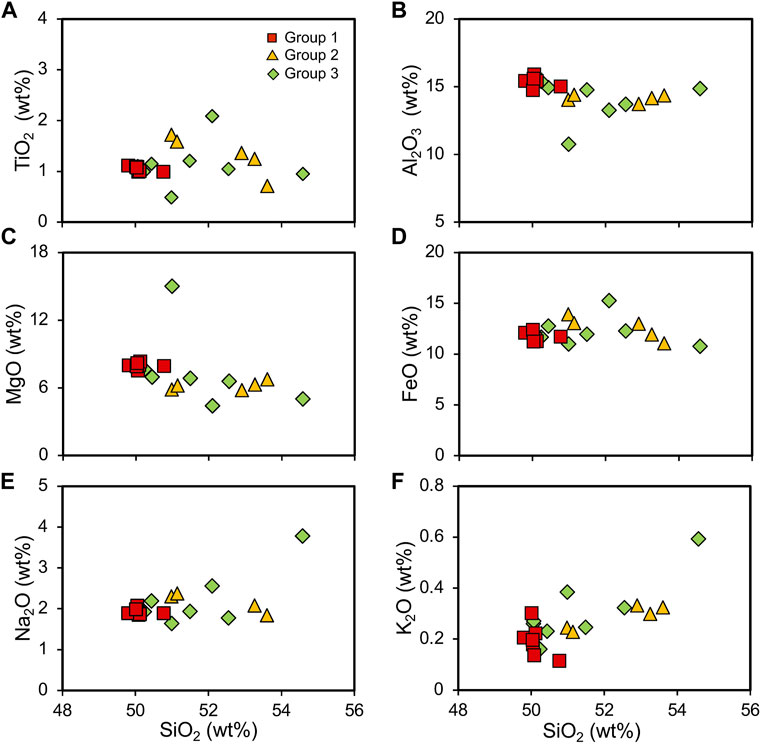
FIGURE 5. The Harker variation diagrams of SiO2 versus the major oxides, (A) TiO2, (B) Al2O3, (C) MgO, (D) FeO, (E) Na2O and (F) K2O for the metadolerite dykes. Group 1 is mostly clustered whereas groups 2 and 3 are showing variations in their distribution.
Geochemical composition of key trace and rare earth elements are also presented in Table 1. Concentrations of compatible elements like Ni varies from 58 ppm to 191 ppm and Cr varies from 30 to 348 ppm. Large Ion Lithophile Elements (LILE) like Rb and Sr ranges between 3.8 and 11.3 and 84.7, and 198.5 ppm respectively. High Field Strength Elements (HFSE) Zr and Nb are showing concentrations from 20.2 to 105.7 ppm and 2.5 to 6.6 ppm respectively. La ranges from 2.78 to 11.91 ppm, Sm and Nd ranges from 2 to 4.2 ppm and 6.01–14.63 ppm respectively. Other key elements like Th, Y, and Lu show concentrations ranging from 19 to 67.78 ppm, 0.19–1.22 ppm and 0.22–0.49 ppm respectively.
Harker variation diagrams for SiO2 versus trace elements appear in Figures 6A–F. A generally clustered pattern is observed for group 1 dykes except for Ni. Group 2 shows a slight positive correlation for Sr (Figure 6B), a negative correlation for Ni and Cr (Figures 6C, D) and the highest concentrations for Zr (Figure 6E). A slight positive trend can be identified for Ni and Cr for group 3 dykes, and they show a high Y. Binary plot of Mg# versus compatible and incompatible elements are shown in Figures 7A–D. Distinctly different patterns are observed for the three groups of dykes.
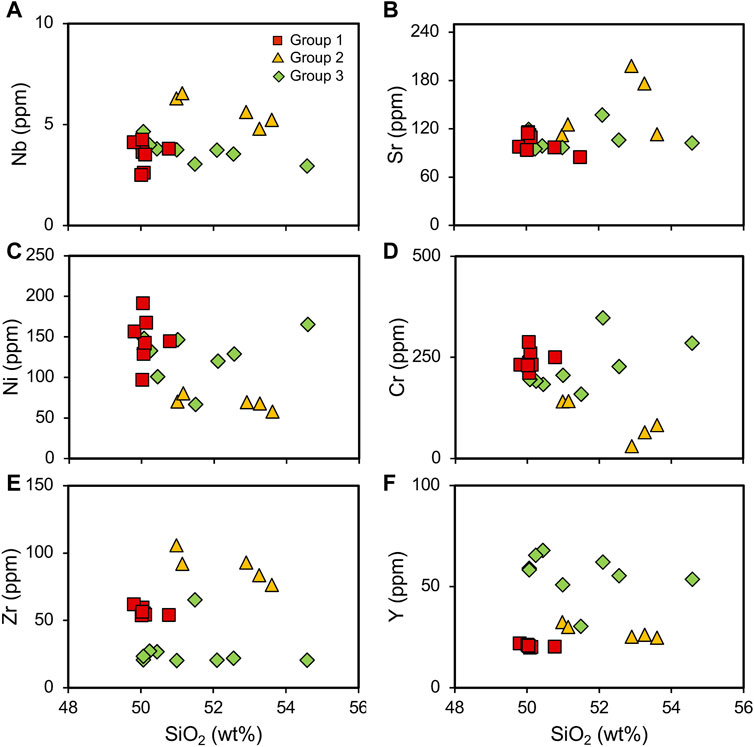
FIGURE 6. Binary geochemical variation diagrams of SiO2 versus (A) Nb, (B) Sr, (C) Ni, (D) Cr, (E) Zr, and (F) Y. The three groups are showing distinct trends.
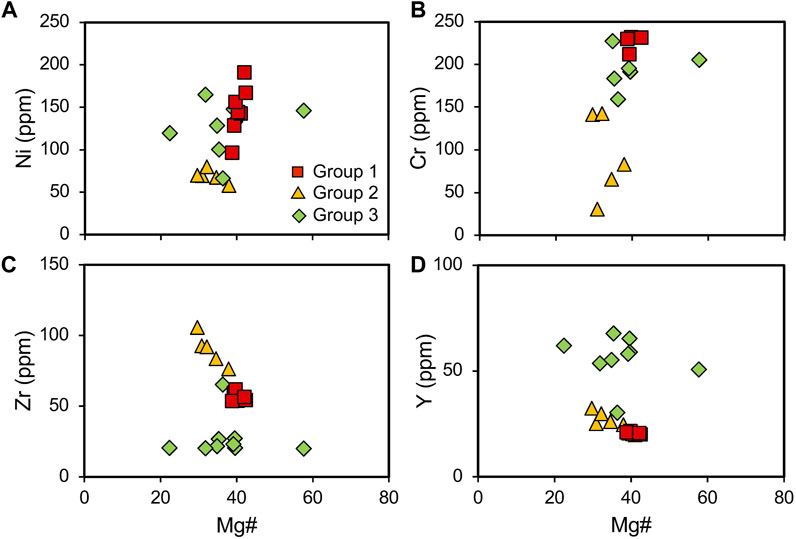
FIGURE 7. Bivariate plots of Mg# versus main trace elements (A) Ni, (B) Cr, (C) Zr and (D) Y. Similar to Figure 6, the three genetic groups can be identified.
Primitive mantle and chondrite normalized (Sun and McDonough, 1989) multi-element spidergrams were constructed using the obtained rare earth element concentrations. A general depleted pattern with a very nominal LILE enrichment was observed in the primitive mantle normalized multi-element spider Gram (Figure 8A). Group one and two show a slight positive anomaly for K whereas a strong positive anomaly is observed for group three. Group two exhibits Sr and Ti negative anomalies and slight negative anomaly for Nb. Group three shows a negative anomaly for Zr and Hf and slight Sr negative anomaly. In the chondrite normalized REE diagram (Figure 8B) a general flat pattern is observed for all the dykes. Group two dykes show a slight enrichment of LREE whereas a flat LREE and a slight negative Eu anomaly is shown by group 3 dykes.
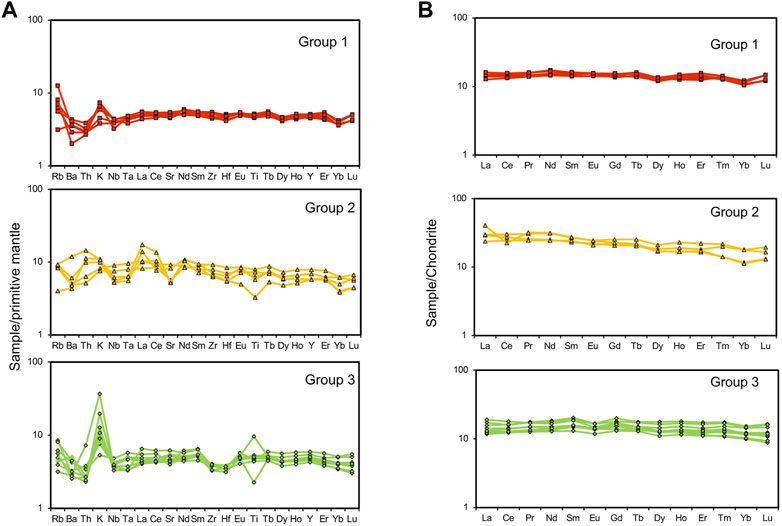
FIGURE 8. (A) The primitive mantle-normalized multi-element diagram of the metadolerite dykes. Group 1 dykes show a general depleted pattern with a very nominal LILE enrichment, a Sr and Ti negative anomalies and slight Nb negative anomaly are observed for group two dykes and group three exhibits a negative anomaly for Zr and Hf and slight Sr negative anomaly. (B) Chondrite-normalized rare earth element spidergram of three groups of metadolerite dykes showing distinct patterns. Normalizing values are from Sun and McDonough (1989).
4.3 Sr-Nd isotope geochemistry
Sr and Nd isotopic ratios are plotted in Figures 9A, B with data in Table 2. The measured 87Sr/86Sr isotope ratio varies from 0.70251 to 0.71080. For further calculations, the 87Rb/86Sr value of CHUR is taken as 0.0839 and the present 87Sr/86Sr ratio of the reservoir is taken as 0.7045 (DePaolo and Wasserburg, 1976) and the age is tentatively fixed as 2,900 Ma. The initial 87Sr/86Sr ratios calculated for 2,900 Ma varies between 0.70041 and 0.70102, for group one dykes, 0.70045 to 0.70154 for group two dykes, and 0.70041 to 0.70153 for group three dykes. Group one dykes show a good Rb-Sr isochron relationship and an errorchron age of ca. 3,003 ± 102 Ma. Measured 143Nd/144Nd ratios vary from 0.51148 to 0.512,719. The 147Sm/144Nd of CHUR is taken as 0.1967 and 143Nd/144Nd of CHUR at present is taken as 0.51238 (DePaolo and Wasserburg, 1976) and the initial 143Nd/144Nd ratio varies from 0.508,245 to 0.509,172 for the age of 2,900 Ma. The epsilon Nd values are mostly negative, ranging between −12 and +5. Group one and two shows an epsilon Nd value ranging between −1 and +5 and 0.1 to +5 respectively and group three varies between −0.5 and −12.
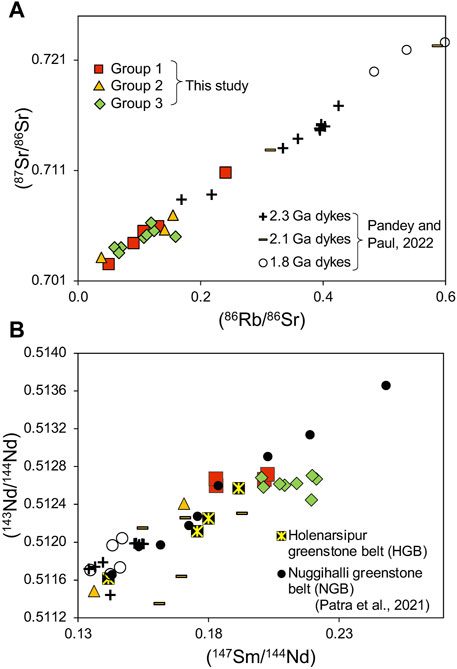
FIGURE 9. (A) Rb-Sr isotope evolution and (B) Sm-Nd isotope evolution diagrams for the studied metadolerites. The samples from the present study are compared with younger dykes (sample details are in Pandey and Paul. (2022)) and ca. 2.9 Ga intrusive mafic-ultramafic rocks from Nuggihalli greenstone belt (NGB) and Holenarsipur greenstone belt (HGB) (Patra et al., 2021) of Western Dharwar craton.
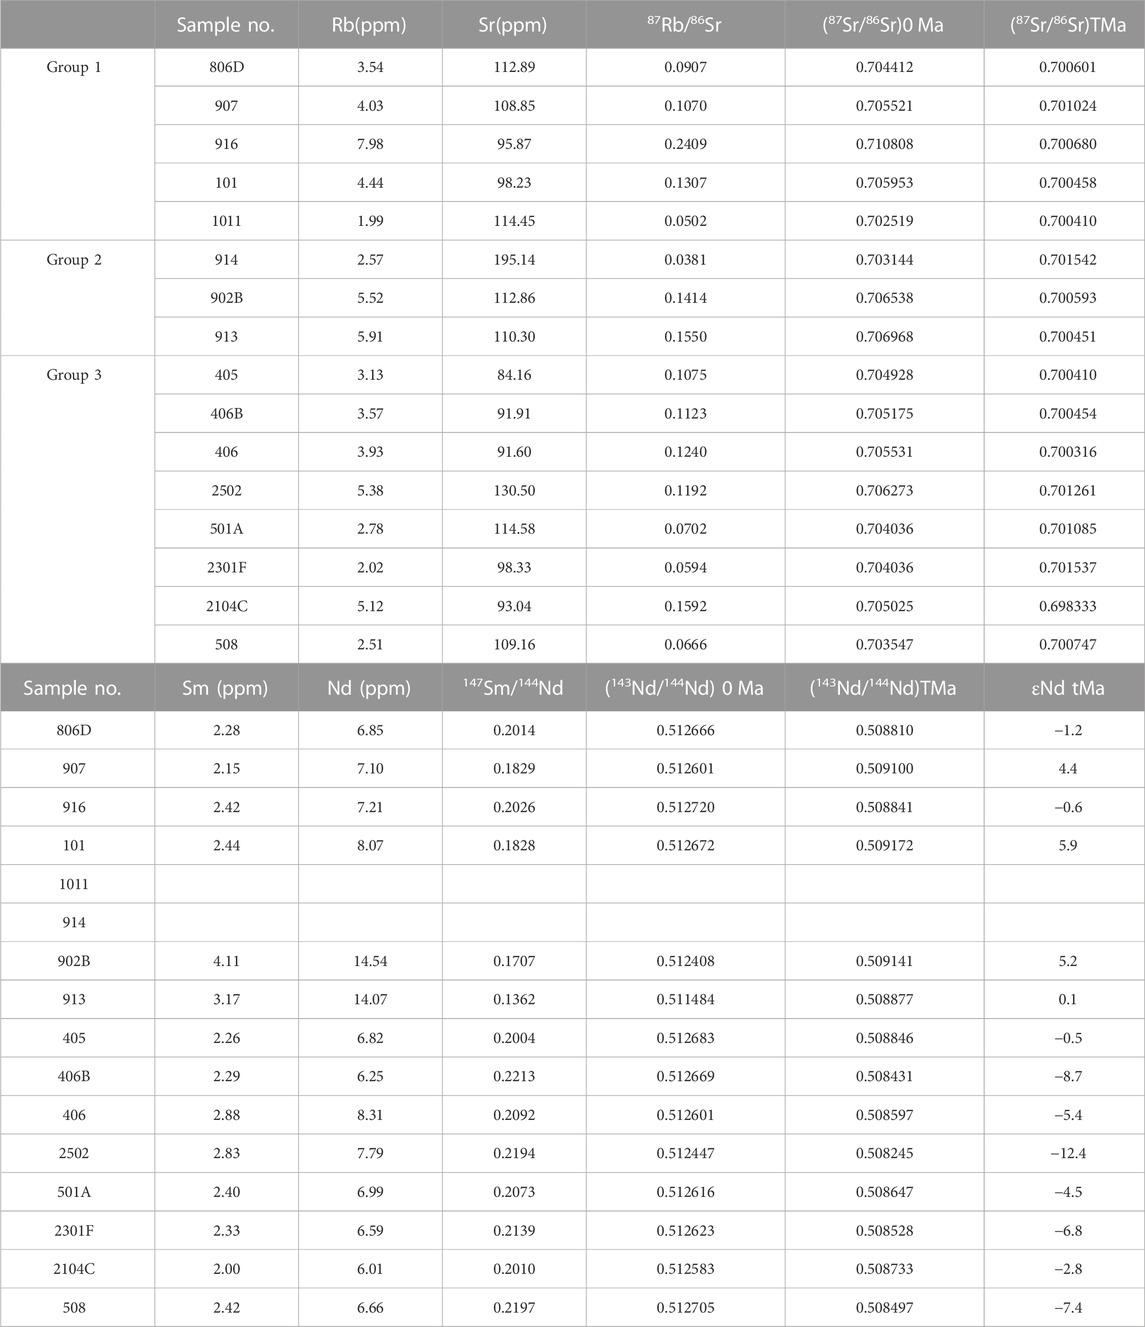
TABLE 2. Rb-Sr and Sm-Nd isotopic data of metadolerite dykes from the Tiptur area, Western Dharwar craton.
5 Discussion
The dykes are weakly metamorphosed due to the overprinting of regional metamorphism at around 2.5 Ga in the Dharwar craton. However, low loss on ignition (LOI) values around 1wt% and preservation of primary igneous minerals and textures support minimal post magmatic alteration. Group 1 dykes are tholeiitic basalts whereas group two and three are basaltic to basaltic andesite in nature (Figure 4A). The petrography as well as the geochemical characteristics indicate that the three groups are not co-genetic and thus probably derived from different mantle sources.
5.1 Petrogenesis
The major oxides in the Harker variation diagram (Figure 5) do not show any significant variations for group one indicating the derivation from the same source. Groups two and three exhibit wide distribution for SiO2. Indicating progressive partial melting of the source. This combined with trace element concentrations (Figures 6, 7) suggest the derivation of the three groups of dykes from distinct source mantle characteristics. The rare earth element concentrations with respect to primitive mantle for group one and threr suggest the derivation from a depleted source (Figure 8). On the other hand, group two has negative anomalies for Nb, Ta, Sr, and Ti and an enrichment of LREE in the chondrite normalized pattern suggesting the derivation from a slightly enriched source. In the case of group three, the trace and rare earth element concentrations indicate a depleted source and the negative anomalies for Zr, Hf indicative of a higher degree of melting of the source mantle. The positive K anomaly on the other hand is probably due to crustal contamination or the source modification by recycling of subducted crust. Th and Nb are useful in understanding crustal contamination and/or assimilation the presence of crustal input by subduction. Th and Nb are also immobile during lower grade metamorphism (Pearce, 2008) and are ideal proxies for the weakly metamorphosed dykes in the current study. Ti-Yb on the other hand is a proxy for melting depth (Pearce, 2008). Incompatible element (Th/Yb vs. Nb/Yb) ratio diagram is constructed (Figure 10A) on which crustal input proxy (Th/Nb) follows a diagonal trend as marked (Pearce et al., 2021). Most of the studied dykes falls in MORB-OPB-OIB array. Group one is mostly concentrated between MORB and OPB, probably indicating a primary mantle source. Groups two and three plot close to MORB and extend towards IAB array. A few of the samples that plot between OPB and CAB suggest the modification of mantle derived source due to interaction with crustal components. This could be evidence of crustal contamination or a signature of a subducted crustal input in the source. However, in the Zr/Yb-Nb/Yb ratio diagram group two dykes translate to an enriched source and fall within the intra-oceanic arc and subduction zone enrichment area (Figure 10B). Group three on the other hand shows a wide distribution for Zr and minimal variation for Nb. According to Pearce and Peate (1995), when Zr and Nb are added to a homogenous mantle source from a subducting slab, such a vertical trend is observed. It is possible to assume that the trace element concentrations reflect the source mantle modification due to subduction rather than crustal contamination. Geochemical compositions are also affected by the depth and degree of melting of the source mantle. The tectonomagmatic discrimination diagram based on Ti-Yb and Nb-Yb (Pearce, 2008) are useful in understanding the magma genesis and evolution. In Figure 10C, all of the samples in groups one and three plot within the main OPB array between MORB and OPB compositions. They show shallow melting (low pressure) or high degree of melting of the source. The difference in trace element characteristics of groups one and three seen in Figures 10A, B could result from of different evolution histories of the similar mantle sources. Group two dykes on the other hand are derived from an enriched mantle source with varying degrees of melting.
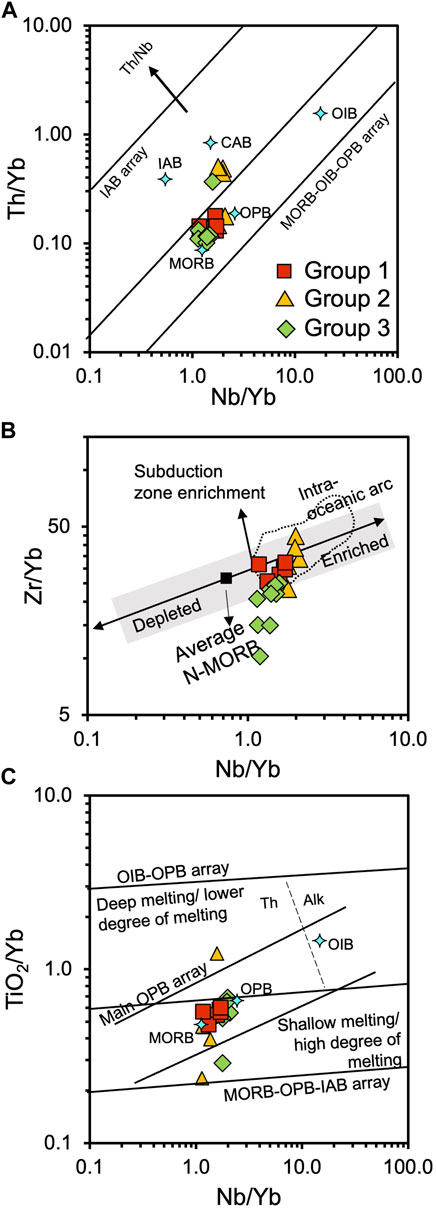
FIGURE 10. (A) Immobile incompatible element ratio diagram of Th/Yb vs. Nb/Yb (after Pearce et al., 2021), discrimination diagrams based on (B) TiO2-Yb and Nb-Yb (Pearce, 2008), and (C) Zr- Yb and Nb-Yb (modified after Pearce et al., 2021).
A petrogenetic modelling based on the trace elements Ni and Zr after Rajamani et al. (1985) is attempted to understand the extent of melting and fractionation (Figure 11A). A mantle source with Ni concentration of 2,000 ppm and Zr of 7.8 ppm, batch melting curves 1 and 2 at 1,850°C, 50 kb and 1,575°C, 25 kb, respectively is considered. Curves 3 and 4 are olivine fractionation trends at 1 atm with an increment of 5% at each mark. The dykes from the current study fall near the batch melting curve with a moderately high percentage of olivine fractionation. According to this model, group one dykes are derived from a melt generated by around 20% batch melting of a depleted mantle and ∼25% olivine fractionation. Group three might have originated from a similar source with a higher degree of melting. Group two on the other hand is derived from a completely different source generated by around 15% batch melting of a depleted mantle source and a higher percentage of olivine fractionation. This result is further confirmed with a petrogenetic model by Condie et al. (1987). If a lherzolite mantle with 2,000 ppm of Ni and 11 ppm of Zr is considered as the source, a batch melting curve 1 at 1,500°C and 1 atm can be defined in which olivine fractionation curves are at 2, 3, and 4 (Figure 11B). It is evident that the group one dykes are derived from a 20% batch melting of a depleted lherzolite mantle source whereas a similar source with more than 25% melting is responsible for the group three dykes. Group two, however, is formed from a source with a lower degree of melting and a higher degree of olivine fractionation. In order to clarify the nature of the source magma, tectonic discrimination diagram based on Zr and Y (Pearce and Norry, 1979) is considered. In Figure 11C, most of the dykes are plotted in the IAB-MORB transition area, except for some group three samples that fall within the IAB field. Even though this can be interpreted as the arc tectonic setting (Srivastava et al., 2014), absence of significant negative anomalies for Nb-Ta suggest the derivation from a source modified by metasomatized mantle.
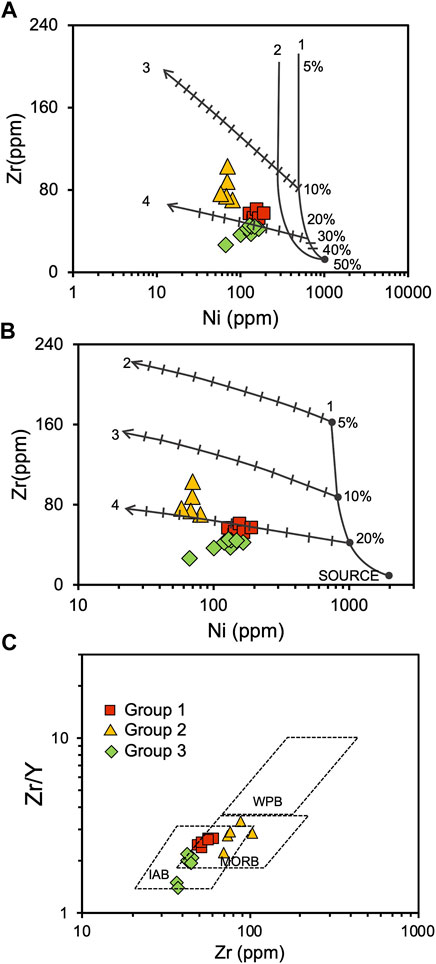
FIGURE 11. Petrogenetic models based on Zr and Ni abundances (A) after Rajamani et al. (1985). Curves 1 and 2 are calculated batch melting curves at 1850°C, 50 kb and 1,575°C, 25 kb respectively, and percentages of melting are marked. Curves 3 and 4 are olivine fractionation trends at 1 atm with an increment of 5% at each mark. (B) Modified after Condie et al. (1987). A lherzolite mantle with the compositions of Ni=2,000 ppm and Zr=11 ppm is considered as the source and a batch melting curve 1 at 1,500°C, and 1 atm is calculated with olivine fractionation curves at 2, 3, and 4. (C) Discrimination diagram of Zr versus Zr/Y to distinguish the tectonic environment of formation (after Pearce and Norry, 1979).
The Mg# of the studied dykes are lower (Figure 7) and suggestive of distinct fractionation histories for the three groups of dykes. Mg# does not show much variation for group one, probably indicating a quick emplacement after the extraction of the parent melt or a lack of significant fractional crystallization. The SiO2 and Zr trends also (Figure 6) suggest the same. Groups two and three exhibit either significant fractionation or a higher degree of melting of the source. The calculated atomic Mg# ((Mg/(Mg+0.9Fet) atomic)) for the samples are <0.4 indicating a highly differentiated source. The enrichment of light rare earth element (LREE) and fractional crystallization trends are examined by Ni vs. chondrite normalized La/Lu ratio diagram (Figure 12A). Groups one and three exhibit normal fractional crystallization trends of primary magma. Group two dykes plot between average N-MORB value (Gale et al., 2013) and BCC (Rudnick et al., 2003) and has a varying LREE indicating a source enrichment. The source mantle is further characterized by Nb/Y vs. SiO2 plot (Figure 12B) and is compared with other continent flood basalts cross-cutting Archean and Proterozoic lithospheric units (Greenough and McDivitt, 2018). All the dykes show a low pressure or a shallow derivation of the source, and higher degree of melting. Group one dykes plot close to primitive basalt line. SiO2 increases for Group two and three however, there is no variation in Nb/Y. Such a signature coincides with the previous interpretation of compositional difference within the original mantle source. This modification of the source due to subduction or degree of melting is further correlated by the relationship between Th/Nb and TiO2/Yb (Pearce et al., 2021). In Figure 12C, group one and three dykes exhibit a composition between MORB and OPB. Group three also shows enriched components, probably due to the increasing degrees of melting. Group two trends towards subduction-modified lithospheric mantle (SZLM) array which supports the recycling of subducted crust in its source mantle. The metadolerite dykes are compared with the younger (2.7 Ga and younger) dolerite dykes from WDC, all of which follow SZLM array. The petrogenesis of younger dolerite dykes suggest that they are derived from a depleted MORB like mantle source (DMM) which is modified by the addition of subducted oceanic crustal components (Silpa et al., 2021). This also leads us to conclude that the group two dykes have ancient, subducted components in its source.
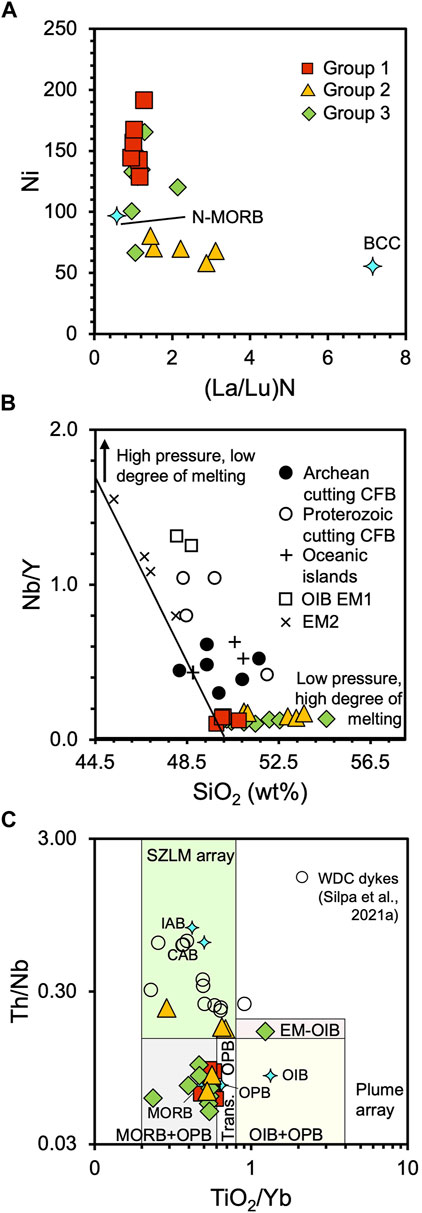
FIGURE 12. (A) Concentration of compatible trace element Ni (ppm) against Chondrite normalized (Sun and McDonough, 1989) La/Lu ratio. N-MORB value is from Gale et al. (2013) and bulk continental crust (BCC) is from Rudnick and Gao (2003). (B) SiO2 (wt%) vs. Nb/Y ratios for understanding the depth and degree of melting. Diagonal line indicates primitive basalts. Comparison with continental flood basalts (CFB) cutting Archean and Proterozoic lithosphere, oceanic islands with tholeiitic compositions such as Hawaii and Iceland and normal oceanic island basalts (OIB) with enriched mantle component (EM1) and enriched mantle 2 (EM2) (after Greenough and McDivitt, 2018). (C) Variation diagram of TiO2/Yb and Th/Nb for understanding crustal input and melting processes (after Pearce et al., 2021). MORB, OIB and OPB (oceanic plateau basalts) values are from Pearce (2008) and IAB (island arc basalts) and CAB (continental arc basalts) values are from Pearce and Peate (1995). SZLM-subduction modified mantle.
The geochemical evolution of mantle beneath Western Dharwar craton during the Archean can be tracked by reliable isotopic systems like Rb-Sr and Sm-Nd isotopes (Figures 9A, B). The group one dykes in the current study gives a Rb-Sr errorchron age of ca. 3,003 ± 102 Ma (Figure 13A). The dykes in the current study are compared with the spatially associated greenstone belts of the Western Dharwar craton with similar ages since they are considered to be the conduits for the continental volcanism. Drury et al. (1983) has reported Sm-Nd whole rock age of 3,020± 230 Ma for the metavolcanics in the Dharwar supergroup. Similarly, an age of 2,934± 88 Ma is reported for the Holenarasipur and Nugihalli mafic volcanics in the Sargur supra crustals (Patra et al., 2021) that are proximal to the current study area. The initial 143Nd/144Nd ratios calculated range from 0.50879 to 0.50887, which is very close to the initial ratios of 0.508,245–0.509,172 obtained for the samples in the current study. Jayananda et al. (2022) reported similar imprecise age of 3,043 ± 428 Ma and an initial 143Nd/144Nd ratio of 0.50876 ± 0.00037 for the greenstone volcanics from the eastern block of Holenarsipur belt. The published ages around 3,000 Ma have significant overlap between oldest lithologic units of Dharwar Supergroup and the youngest units of Sargur group of metavolcanics (Patra et al., 2021). The similarities between these mafic volcanics and the studied metadolerites are due to the fact that the Archean to early Proterozoic mafic rocks are derived from depleted mantle sources (DePaolo and Wasserburg, 1981; Jahn et al., 1987). The εNd values (Figure 13B) of group one and two dykes are close to zero to +5 indicating heterogeneous depleted SCLM reservoirs beneath the Dharwar craton. εNd values shown by group three range from −12 to −0.4 and the initial Sr isotope ratios of 0.70041–0.70153. The large variation in Nd and minimal scatter in Sr ratios suggest that the Rb-Sr and Sm-Nd systems were in isotopic equilibrium and rule out the possibilities of any external factors affecting the mantle source. This along with the lower Th/Nb ratios and LREE concentrations are suggestive of a mantle source enriched by subducted crustal components and little effect of crustal contamination. Based on the whole rock geochemical characteristics including the isotopic ratios, is it evident that the metadolerite dykes in the current study are derived from varying degrees of melting of a depleted sub-continental lithospheric mantle beneath Archean Dharwar craton. The group two dykes, however, has an enriched component possibly derived from the subduction of oceanic slab in the original source mantle.
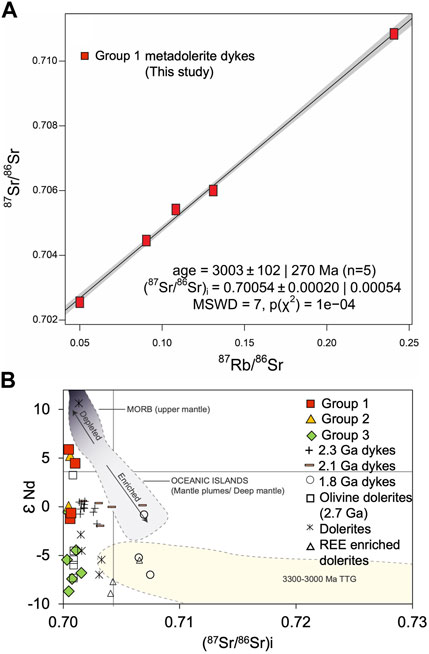
FIGURE 13. (A) Rb-Sr isochron diagram for the group one metadolerites constructed using IsoplotR. An errorchron age ca. 3,003 ± 102 Ma (MSWD =7) and initial 87Sr/86Sr ratio of 0.70054 was obtained. (B) εNd vs. 87Sr/86Sr (initial) ratio diagram to understand the source characteristics of the studied dykes. The dykes from the present study are compared with younger dykes from Western Dharwar Craton. Olivine dolerites, dolerites and REE enriched dolerites from Silpa et al. (2021) and 2.3, 2.1, and 1.8 Ga dykes’ data are from Pandey and Paul. (2022) and TTG field is from Jayananda et al. (2018).
5.2 Geodynamic implications
Archean geodynamics are poorly constrained and highly debated due to the large volumes of crustal extraction, the drastic changes in the temperature and composition of the mantle, the formation of continental crust and episodic large-scale volcanic activity (Ernst and Buchan, 2001; Smithies et al., 2003; Ernst et al., 2013; Dhiume et al., 2015, and the references therein). The Archean crust was mafic in nature before 3,200–3,000 Ma (Tang et al., 2016). The extraction of komatiites and komatiite-basalts has led to the removal of MgO from the mantle and resulted in the decrease in MgO and Ni around 3000 Ma (Condie, 1993; Herzberg et al., 2010; Keller and Schoene, 2012; Keller and Schoene, 2018). This compositional change is also attributed to the decrease in mantle potential temperatures (Windley et al., 2021). The formation of extensive oceanic crust from Paleoarchean to komatiites and microcontinents made of TTGs, towards the end of 3000 Ma has significantly depleted the SCLM. Oceanic subduction and related metasomatization of the mantle by recycled crust was predominant during that time (Halla et al., 2009; Dhiume et al., 2015; Halla et al., 2017). However, during the Mesoarchean to Neoarchean the melting source changed from hydrated oceanic lithosphere to variously enriched mantle wedge. This resulted in abundance of melts and fluids derived from heterogeneously enriched mantle (Halla et al., 2009; Windley et al., 2021). This transition in the mantle composition is also evident from the greenstone volcanics and associated mafic dykes. The differences in the source or the melting conditions of the studied dykes are analyzed using rare earth element concentrations (Figure 14A). Group one dykes do not show much variation in degree of melting or fractional crystallization. This leads us to conclude that rapid emplacement of a depleted mantle source resulted in the formation of Group one dykes. The formation of group two dykes can be explained by either of the following two scenarios: 1) Source variation or 2) a dynamic melting with no influence of fractional crystallization. The melting of a source over a range of depths (pressures) is defined as dynamic melting (Elliot et al., 1991; Pearce and Peate, 1995) and usually regarded as a process between batch melting and fractional crystallization. Dynamic melting process usually has high MgO, high Fe, Na, and low K (Pearce and Peate, 1995). The pressure and depth of melting proxy SiO2 vs. the degree of melting proxy Nb/Y diagram (Figure 12B; modified after Greenough and McDivitt, 2018) support shallow depth of melting for all the dykes. Given the mantle temperature and composition of SCLM during Mesoarchean to Neoarchean, source variation is the most plausible explanation. Group three on the other hand is showing a slight trend towards source variation which might have been derived from higher degree of melting. This, combined with the results from the petrogenetic modelling (Figures 11A, B) leads to the conclusion that they might have derived from a mantle source similar to group one dykes with a higher percentage of melting that lead to progressive enrichment of the source. The greenstone belts in the Western Dharwar craton are comparable to the neighboring metadolerites due to the similarity in the geochemical characteristics, especially Sr and Nd isotope compositions. To further examine the geochemical coherence and the mantle source constraints, trace element ratios Nb/Y, Zr/Y, Zr/Nb and Nb/Th (Figures 14B, C) are constructed. Similar to the greenstone belts from the previous studies (Patra et al., 2021; Jayananda et al., 2022), metadolerite dykes from the current study indicate primitive mantle to MORB source reservoirs in the trace element ratio diagram Zr/Y versus Nb/Y (Figure 14B). In the Nb/Th versus Zr/Nb plot, most of the dykes plots in the oceanic plateau basalts, Group one dykes are plotting close to primitive mantle whereas Group two and three are following an arc trend (Figure 14C). The greenstone volcanics are showing oceanic plateau and arc to oceanic plateau signatures and are thought to be represent oceanic crust related to subduction accretion processes (Patra et al., 2021). Such processes are argued to be common during the Archean and preservation of subduction signatures in Archean greenstone belts has been reported by earlier studies (Smithies et al., 2003; Jayananda et al., 2008; Patra et al., 2021 and the references there in). The metadolerites reported here also represent an SZLM with subducted crustal signatures as well as depleted SCLM that was present beneath the Archean Dharwar craton.
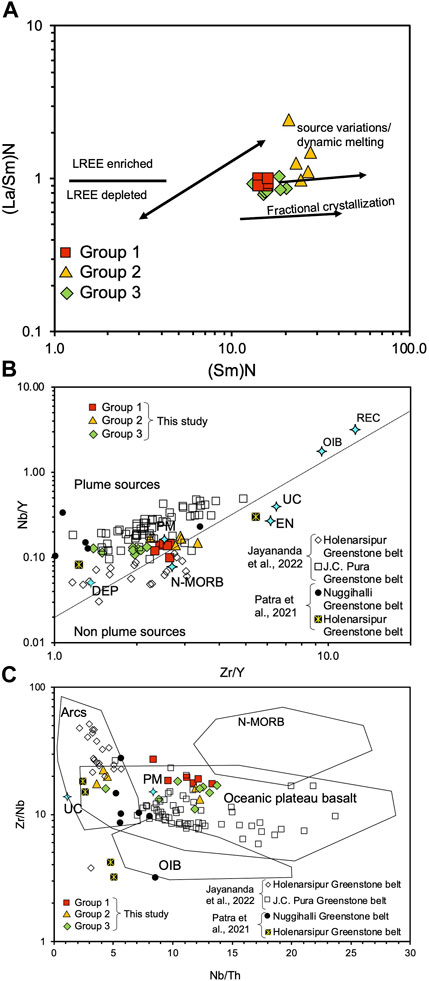
FIGURE 14. (A) Variation trends of chondrite normalized La/Sm vs. Sm, showing the role of source variation and fractional crystallization in the magmatic evolution of studied dykes. Diagrams showing mantle compositional components and various tectonic settings: (B) Nb/Y versus Zr/Y (after Condie, 2005) plot indicating primitive mantle to depleted mantle sources for the studied dykes. Compared with the greenstone belts from Western Dharwar Craton (Patra et al., 2021; Jayananda et al., 2022). (C) Zr/Nb versus Nb/Th plot (after Condie, 2005) showing oceanic plateau for group one and three, arc to oceanic plateau for group two dykes. PM, primitive mantle; DM, depleted mantle; ARC, arc related volcanics; N-MORB, normal ocean ridge basalt; OIB, oceanic island basalt; DEP, deep depleted mantle; EN, enriched component; REC, recycled components.
6 Conclusion
The metadolerite dykes in the current study are derived from a depleted SCLM source during the Mesoarchean to Neoarchean after komatiitic magma extraction. Compositionally three groups are identified. Group one is thought to be derived from a depleted mantle source, emplaced at ca. 3,003 ± 102 Ma. Group two dykes are compositionally distinct and are progressively enriched, possibly by the addition of subducted oceanic crustal components. Group three dykes are geochemically similar to group one dykes; however, they show a gradual evolution of the source owing to increasing degree of melting. The dykes in the current study have geochemical similarities with the neighboring greenstone belts and it is possible to infer that were the conduits of the widespread greenstone volcanism in the Western Dharwar Craton.
Data availability statement
The original contributions presented in the study are included in the article/supplementary material, further inquiries can be directed to the corresponding author.
Author contributions
ASS conducted the field work and geochemical analysis. MS-K supported the entire research, during field work, analysis, and discussion of the results. TT supported the geochemical analysis of samples. AK contributed to the interpretation of the results. All authors contributed to the article and approved the submitted version.
Funding
This study was supported by the Grant-in-Aid for Scientific Research on Innovative Areas. MS-K acknowledges KAKENHI research grants from the Ministry of Education, Culture, Sports, Science and Technology, Japan (Nos. JP15H05831 and 20KK0081) and partial support through JSPS KAKENHI grant numbers JP23340155 and JP25302008. For field work support the authors acknowledge JSPS grant for Japan-India Science Cooperative Programs (lead by TT 2019-20).
Acknowledgments
The authors thank the guest editor for an efficient editorial handling of the manuscript and the reviewers for their valuable comments which helped in improving the manuscript to a large extent. ASS acknowledges Japanese Government (Monbukagakusho) scholarship for PhD program at Niigata University. We also express our sincere thanks Ms. Rikako Nohara for the help rendered during the geochemical analysis of dykes at Niigata University. Prof. Sajeev, Dr. Thanooja, and S. Kiran are thanked for the help rendered during field studies in Dharwar craton.
Conflict of interest
The authors declare that the research was conducted in the absence of any commercial or financial relationships that could be construed as a potential conflict of interest.
Publisher’s note
All claims expressed in this article are solely those of the authors and do not necessarily represent those of their affiliated organizations, or those of the publisher, the editors and the reviewers. Any product that may be evaluated in this article, or claim that may be made by its manufacturer, is not guaranteed or endorsed by the publisher.
References
Armstrong, R. L. (1991). The persistent myth of crustal growth. Aust. J. Earth Sci. 38 (5), 613–630. doi:10.1080/08120099108727995
Bédard, J. H. (2018). Stagnant lids and mantle overturns: Implications for Archaean tectonics, magma Genesis, crustal growth, mantle evolution, and the start of plate tectonics. Geosci. Front. 9 (1), 19–49. doi:10.1016/j.gsf.2017.01.005
Belica, M. E., Piispa, E. J., Meert, J. G., Pesonen, L. J., Plado, J., Pandit, M. K., et al. (2014). Paleoproterozoic mafic dyke swarms from the Dharwar craton; paleomagnetic poles for India from 2.37 to 1.88 Ga and rethinking the Columbia supercontinent. Precambrian Res. 244, 100–122. doi:10.1016/j.precamres.2013.12.005
Bleeker, W., and Ernst, R. E. (2006). “Short-lived mantle generated magmatic events and their dyke swarms: The key unlocking earth’s paleogeographic record back to 2.6 Ga,” in Dyke swarms – time markers of crustal evolution. Editors E. Hanski, S. Mertanen, T. Rämö, and J. Vuollo (London: Taylor and Francis), 3–26.
Bleeker, W. (2003) The late archean record: A puzzle in ca. 35 pieces Lithos 71 (2-4), 99–134. doi:10.1016/j.lithos.2003.07.003
Bowring, S. A., and Housh, T. (1995). The Earth's early evolution. Science 269 (5230), 1535–1540. doi:10.1126/science.7667634
Brown, M., Rushmer, T., and Sawyer, E. W. (1995). Introduction to special section: Mechanisms and consequences of melt segregation from crustal protoliths. J. Geophys. Res. Solid Earth 100 (B8), 15551–15563. doi:10.1029/95jb01253
Cawood, P. A., Hawkesworth, C. J., and Dhuime, B. (2013). The continental record and the generation of continental crust. Bulletin 125 (1-2), 14–32. doi:10.1130/b30722.1
Chatterjee, N., and Bhattacharji, S. (2001). Petrology, geochemistry and tectonic settings of the mafic dikes and sills associated with the evolution of the Proterozoic Cuddapah Basin of south India. J. Earth Syst. Sci. 110 (4), 433–453. doi:10.1007/bf02702905
Choukroune, P., Bouhallier, H., and Arndt, N. T. (1995). Soft lithosphere during periods of Archaean crustal growth or crustal reworking. Geol. Soc. Lond. Spec. Publ. 95 (1), 67–86. doi:10.1144/gsl.sp.1995.095.01.05
Coffin, M. F., and Eldholm, O. (1994). Large igneous provinces: Crustal structure, dimensions, and external consequences. Rev. Geophys. 32 (1), 1–36. doi:10.1029/93rg02508
Coffin, M. F., and Eldholm, O. (1991). Large igneous provinces: JOI/USSAC workshop report. Austin TX, USA: Institute of Geophysics, University of Texas, 79.
Condie, K. C., Bobrow, D. J., and Card, K. D. (1987). Geochemistry of precambrian mafic dykes from the southern superior province of the Canadian shield. Geol. Assoc. Can. 34, 95–108. Special Paper.
Condie, K. C. (1993). Chemical composition and evolution of the upper continental crust: Contrasting results from surface samples and shales. Chem. Geol. 104 (1-4), 1–37. doi:10.1016/0009-2541(93)90140-e
Condie, K. C. (2005). High field strength element ratios in archean basalts: A window to evolving sources of mantle plumes? Lithos 79 (3-4), 491–504. doi:10.1016/j.lithos.2004.09.014
DePaolo, D. J., and Wasserburg, G. J. (1976). Nd isotopic variations and petrogenetic models. Geophys. Res. Lett. 3 (5), 249–252. doi:10.1029/gl003i005p00249
Dey, S., Pandey, U. K., Rai, A. K., and Chaki, A. (2012). Geochemical and Nd isotope constraints on petrogenesis of granitoids from NW part of the eastern dharwar craton: Possible implications for late archaean crustal accretion. J. Asian Earth Sci. 45, 40–56. doi:10.1016/j.jseaes.2011.09.013
Dhuime, B., Hawkesworth, C. J., Cawood, P. A., and Storey, C. D. (2012). A change in the geodynamics of continental growth 3 billion years ago. Science 335 (6074), 1334–1336. doi:10.1126/science.1216066
Dhuime, B., Wuestefeld, A., and Hawkesworth, C. J. (2015). Emergence of modern continental crust about 3 billion years ago. Nat. Geosci. 8 (7), 552–555. doi:10.1038/ngeo2466
Drury, S. A., Holt, R. W., Van Clasteren, P. C., and Beckinsale, R. D. (1983). Sm-Nd and Rb-Sr ages for Archaean rocks in Western Karnataka, south India. J. Geol. Soc. India 24 (9), 454–459.
Elliott, T. R., Hawkesworth, C. J., and Grönvold, K. (1991). Dynamic melting of the Iceland plume. Nature 351 (6323), 201–206. doi:10.1038/351201a0
Ernst, R., and Bleeker, W. (2010). Large igneous provinces (LIPs), giant dyke swarms, and mantle plumes: Significance for breakup events within Canada and adjacent regions from 2.5 Ga to the Present. This article is one of a selection of papers published in this special issue on the the theme lithoprobe—parameters, processes, and the evolution of a continent.Lithoprobe contribution 1482. Geological Survey of Canada contribution 20100072. Can. J. Earth Sci. 47 (5), 695–739. doi:10.1139/e10-025
Ernst, R. E., Bleeker, W., Söderlund, U., and Kerr, A. C. (2013). Large Igneous Provinces and supercontinents: Toward completing the plate tectonic revolution. Lithos 174, 1–14. doi:10.1016/j.lithos.2013.02.017
Ernst, R. E., and Buchan, K. L. (Editors) (2001). Mantle plumes: Their identification through time (United States: Geological Society of America).
Ernst, R. E., Buchan, K. L., and Campbell, I. H. (2005). Frontiers in large igneous province research. Lithos 79 (3-4), 271–297. doi:10.1016/j.lithos.2004.09.004
French, J. E., Heaman, L. M., Chacko, T., and Srivastava, R. K. (2008). 1891–1883 Ma southern bastar–cuddapah mafic igneous events, India: A newly recognized large igneous province. Precambrian Res. 160 (3-4), 308–322. doi:10.1016/j.precamres.2007.08.005
French, J. E., and Heaman, L. M. (2010). Precise U–Pb dating of paleoproterozoic mafic dyke swarms of the dharwar craton, India: Implications for the existence of the neoarchean supercraton sclavia. Precambrian Res. 183 (3), 416–441. doi:10.1016/j.precamres.2010.05.003
Gale, A., Dalton, C. A., Langmuir, C. H., Su, Y., and Schilling, J. G. (2013). The mean composition of ocean ridge basalts. Geochem. Geophys. Geosystems 14 (3), 489–518. doi:10.1002/ggge.20038
Greenough, J. D., and McDivitt, J. A. (2018). Earth’s evolving subcontinental lithospheric mantle: Inferences from LIP continental flood basalt geochemistry. Int. J. Earth Sci. 107, 787–810. doi:10.1007/s00531-017-1493-6
Gupta, S., Rai, S. S., Prakasam, K. S., Srinagesh, D., Bansal, B. K., Chadha, R. K., et al. (2003). The nature of the crust in southern India: Implications for precambrian crustal evolution. Geophys. Res. Lett. 30 (8). doi:10.1029/2002gl016770
Halla, J., van Hunen, J., Heilimo, E., and Hölttä, P. (2009). Geochemical and numerical constraints on Neoarchean plate tectonics. Precambrian Res. 174 (1-2), 155–162. doi:10.1016/j.precamres.2009.07.008
Halla, J., Whitehouse, M. J., Ahmad, T., and Bagai, Z. (2017). Archaean granitoids: An overview and significance from a tectonic perspective. Geol. Soc. Lond. Spec. Publ. 449 (1), 1–18. doi:10.1144/sp449.10
Halls, H. C., Kumar, A., Srinivasan, R., and Hamilton, M. A. (2007). Paleomagnetism and U–Pb geochronology of easterly trending dykes in the dharwar craton, India: Feldspar clouding, radiating dyke swarms and the position of India at 2.37 Ga. Precambrian Res. 155 (1-2), 47–68. doi:10.1016/j.precamres.2007.01.007
Halls, H. C., Li, J., Davis, D., Hou, G., Zhang, B., and Qian, X. (2000). A precisely dated Proterozoic palaeomagnetic pole from the North China craton, and its relevance to palaeocontinental reconstruction. Geophys. J. Int. 143 (1), 185–203. doi:10.1046/j.1365-246x.2000.00231.x
Hamamoto, T., Yuhara, M., Miyazaki, M., Fukase, H., Kondo, T., Ikawa, J., et al. (2000). Rb, Sr, Sm and Nd separation from rocks, minerals and natural water using ion-exchange resin. Niigata: Science Report Niigata University, Search E. Geology, 49–58.15
Hawkesworth, C., and Jaupart, C. (2021). Heat flow constraints on the mafic character of Archean continental crust. Earth Planet. Sci. Lett. 571, 117091. doi:10.1016/j.epsl.2021.117091
Hawkesworth, C. J., Dhuime, B., Pietranik, A. B., Cawood, P. A., Kemp, A. I., and Storey, C. D. (2010). The generation and evolution of the continental crust. J. Geol. Soc. 167 (2), 229–248. doi:10.1144/0016-76492009-072
Herzberg, C., Condie, K., and Korenaga, J. (2010). Thermal history of the Earth and its petrological expression. Earth Planet. Sci. Lett. 292 (1-2), 79–88. doi:10.1016/j.epsl.2010.01.022
Hoffman, P. F., and Ranalli, G. (1988). Archean oceanic flake tectonics. Geophys. Res. Lett. 15 (10), 1077–1080. doi:10.1029/gl015i010p01077
Irvine, T. N., and Baragar, W. R. A. (1971). A guide to the chemical classification of the common volcanic rocks. Can. J. earth Sci. 8 (5), 523–548. doi:10.1139/e71-055
Jayananda, M., Aadhiseshan, K. R., Kusiak, M. A., Wilde, S. A., Sekhamo, K. U., Guitreau, M., et al. (2020). Multi-stage crustal growth and neoarchean geodynamics in the eastern dharwar craton, southern India. Gondwana Res. 78, 228–260. doi:10.1016/j.gr.2019.09.005
Jayananda, M., Chardon, D., Peucat, J. J., and Capdevila, R. (2006). 2.61 Ga potassic granites and crustal reworking in the Western dharwar craton, southern India: Tectonic, geochronologic and geochemical constraints. Precambrian Res. 150 (1-2), 1–26. doi:10.1016/j.precamres.2006.05.004
Jayananda, M., Chardon, D., Peucat, J. J., and Fanning, C. M. (2015). Paleo-to mesoarchean TTG accretion and continental growth in the Western dharwar craton, southern India: Constraints from SHRIMP U–Pb zircon geochronology, whole-rock geochemistry and Nd–Sr isotopes. Precambrian Res. 268, 295–322. doi:10.1016/j.precamres.2015.07.015
Jayananda, M., Guitreau, M., Aadhiseshan, K. R., Miyazaki, T., and Chung, S. L. (2022). Origin of the oldest (3600–3200 Ma) cratonic core in the western dharwar craton, southern India: Implications for evolving tectonics of the archean earth. Earth-Science Rev. 236, 104278. doi:10.1016/j.earscirev.2022.104278
Jayananda, M., Kano, T., Peucat, J. J., and Channabasappa, S. (2008). 3.35 Ga komatiite volcanism in the Western dharwar craton, southern India: Constraints from Nd isotopes and whole-rock geochemistry. Precambrian Res. 162 (1-2), 160–179. doi:10.1016/j.precamres.2007.07.010
Jayananda, M., Moyen, J. F., Martin, H., Peucat, J. J., Auvray, B., and Mahabaleswar, B. (2000). Late archaean (2550–2520 Ma) juvenile magmatism in the eastern dharwar craton, southern India: Constraints from geochronology, Nd–Sr isotopes and whole rock geochemistry. Precambrian Res. 99 (3-4), 225–254. doi:10.1016/s0301-9268(99)00063-7
Jayananda, M., Santosh, M., and Aadhiseshan, K. R. (2018). formation of archean (3600–2500 Ma) continental crust in the dharwar craton, southern India. Earth-Science Rev. 181, 12–42. doi:10.1016/j.earscirev.2018.03.013
Johnson, T. E., Kirkland, C. L., Gardiner, N. J., Brown, M., Smithies, R. H., and Santosh, M. (2019). Secular change in TTG compositions: Implications for the evolution of Archaean geodynamics. Earth Planet. Sci. Lett. 505, 65–75. doi:10.1016/j.epsl.2018.10.022
Keller, B., and Schoene, B. (2018). Plate tectonics and continental basaltic geochemistry throughout Earth history. Earth Planet. Sci. Lett. 481, 290–304. doi:10.1016/j.epsl.2017.10.031
Keller, C. B., and Schoene, B. (2012). Statistical geochemistry reveals disruption in secular lithospheric evolution about 2.5 Gyr ago. Nature 485 (7399), 490–493. doi:10.1038/nature11024
Kumar, A., Hamilton, M. A., and Halls, H. C. (2012a). A Paleoproterozoic giant radiating dyke swarm in the Dharwar Craton, southern India. Geochem. Geophys. Geosystems 13 (2). doi:10.1029/2011gc003926
Kumar, A., Nagaraju, E., Besse, J., and Rao, Y. B. (2012b). New age, geochemical and paleomagnetic data on a 2.21 Ga dyke swarm from south India: Constraints on Paleoproterozoic reconstruction. Precambrian Res. 220, 123–138. doi:10.1016/j.precamres.2012.08.001
Le Maitre, R. W. (Editor) (2002). Igneous rocks: A classification and glossary of terms (United Kingdom: Cambridge University Press), 236.
Meert, J. G., and Pandit, M. K. (2015). The archaean and proterozoic history of peninsular India: Tectonic framework for precambrian sedimentary basins in India, 43. London: Geological Society, 29–54.1
Monteux, J., Andrault, D., Guitreau, M., Samuel, H., and Demouchy, S. (2020). A mushy Earth's mantle for more than 500 Myr after the magma ocean solidification. Geophys. J. Int. 221 (2), 1165–1181. doi:10.1093/gji/ggaa064
Mukherjee, R., Mondal, S. K., Frei, R., Rosing, M. T., Waight, T. E., Zhong, H., et al. (2012). The 3.1 Ga Nuggihalli chromite deposits, Western Dharwar craton (India): Geochemical and isotopic constraints on mantle sources, crustal evolution and implications for supercontinent formation and ore mineralization. Lithos 155, 392–409. doi:10.1016/j.lithos.2012.10.001
Murthy, Y. G. K., Babu Rao, V., Guptasarma, D., Rao, J. M., Rao, M. N., and Bhattacharji, S. (1987). Tectonic, petrochemical and geophysical studies of mafic dyke swarms around the Proterozoic Cuddapah basin, South India. Mafic dyke swarms 34, 303–316.
Nagaraju, E., Parashuramulu, V., Babu, N. R., and Narayana, A. C. (2018b). A 2207 Ma radiating mafic dyke swarm from eastern Dharwar craton, Southern India: Drift history through Paleoproterozoic. Precambrian Res. 317, 89–100. doi:10.1016/j.precamres.2018.08.009
Nagaraju, E., Parashuramulu, V., Kumar, A., and Sarma, D. S. (2018a). Paleomagnetism and geochronological studies on a 450 km long 2216 Ma dyke from the Dharwar craton, southern India. Phys. Earth Planet. Interiors 274, 222–231. doi:10.1016/j.pepi.2017.11.006
Pandey, O. P., and Paul, D. (2022). Secular evolution of the subcontinental lithospheric mantle beneath Indian cratons: Insights from geochemistry and geochronology of the Precambrian mafic dykes. Lithos 422, 106729. doi:10.1016/j.lithos.2022.106729
Patra, K., Giri, A., Anand, R., Balakrishnan, S., and Dash, J. K. (2021). Dharwar stratigraphy revisited: New age constraints on the ‘oldest’ supracrustal rocks of Western dharwar craton, southern India. Int. Geol. Rev. 63 (12), 1450–1470. doi:10.1080/00206814.2020.1775138
Pearce, J. A., Ernst, R. E., Peate, D. W., and Rogers, C. (2021). LIP printing: Use of immobile element proxies to characterize Large Igneous Provinces in the geologic record. Lithos 392, 106068. doi:10.1016/j.lithos.2021.106068
Pearce, J. A. (2008). Geochemical fingerprinting of oceanic basalts with applications to ophiolite classification and the search for Archean oceanic crust. Lithos 100 (1-4), 14–48. doi:10.1016/j.lithos.2007.06.016
Pearce, J. A., and Norry, M. J. (1979). Petrogenetic implications of Ti, Zr, Y, and Nb variations in volcanic rocks. Contributions mineralogy petrology 69 (1), 33–47. doi:10.1007/bf00375192
Pearce, J. A., and Peate, D. W. (1995). Tectonic implications of the composition of volcanic arc magmas. Annu. Rev. Earth Planet. Sci. 23 (1), 251–285. doi:10.1146/annurev.ea.23.050195.001343
Peucat, J. J., Jayananda, M., Chardon, D., Capdevila, R., Fanning, C. M., and Paquette, J. L. (2013). The lower crust of the dharwar craton, southern India: Patchwork of archean granulitic domains. Precambrian Res. 227, 4–28. doi:10.1016/j.precamres.2012.06.009
Radhakrishna, T., and Joseph, M. (1993). Proterozoic paleomagnetism of the south Indian shield and tectonic constraints. Geol. Soc. India Memoirs 26, 321–336.
Rai, A. K., Srivastava, R. K., Samal, A. K., and Sesha Sai, V. V. (2019). Geochemistry, petrogenesis, and geodynamic implications of NE–SW to ENE–WSW trending P alaeoproterozoic mafic dyke swarms from southern region of the Western Dharwar Craton. Geol. J. 54 (5), 3493–2869. doi:10.1002/gj.3493
Rajamani, V., Shivkumar, K., Hanson, G. N., and Shirey, A. S. (1985). Geochemistry and petrogenesis of amphibolites, kolar schist belt, south India: Evidence for komatiitic magma derived by low percentages of melting of the mantle. J. Petrology 26 (1), 92–123. doi:10.1093/petrology/26.1.92
Ramakrishnan, M., and Vaidyanathan, R. (2008). Geology of India. Bangalore: Geological Society of India, 556.
Ravindran, A., Mezger, K., Balakrishnan, S., and Berndt, J. (2021). Hf-Nd isotopes from ultramafic and mafic rocks in the Western Dharwar Craton, India, record early Archean mantle heterogeneity. Lithos 404, 106491. doi:10.1016/j.lithos.2021.106491
Rudnick, R. L., Gao, S., Holland, H. D., and Turekian, K. K. (2003). Composition of the continental crust. crust 3, 1–64.
Rudnick, R. L., McDonough, W. F., and O'Connell, R. J. (1998). Thermal structure, thickness and composition of continental lithosphere. Chem. Geol. 145 (3-4), 395–411. doi:10.1016/s0009-2541(97)00151-4
Senda, R., Kimura, J. I., and Chang, Q. (2014). Evaluation of a rapid, effective sample digestion method for trace element analysis of granitoid samples containing acid-resistant minerals: Alkali fusion after acid digestion. Geochem. J. 48 (1), 99–103. doi:10.2343/geochemj.2.0280
Silpa, A. S., and Satish-Kumar, M. (2018). Dyke swarms in the dharwar craton: A key to understanding the late archean to early proterozoic cratonic correlations. J. Indian Inst. Sci. 98 (4), 365–378. doi:10.1007/s41745-018-0090-4
Silpa, A. S., and Satish-Kumar, M. (2022). Multiple sulfur isotope geochemistry of the Precambrian mafic dykes and komatiites in the Dharwar Craton, Southern India: Evidence for crustal recycling and enrichment in the subcontinental lithospheric mantle. Lithosphere 2022, 4679300. doi:10.2113/2022/4679300
Silpa, A. S., Satish-Kumar, M., and Takahashi, T. (2021a). Sr-Nd isotopic study of dolerite dykes in the Western Dharwar craton, southern India: Implications for the evolution of the subcontinental lithospheric mantle in late Archean. Lithos 388, 106023. doi:10.1016/j.lithos.2021.106023
Silpa, S. A., Satish-Kumar, M., Takazawa, E., and Sajeev, K. (2021b). Trace and rare Earth element geochemistry of clinopyroxene in mafic dykes from Western Dharwar craton, southern India. J. Mineralogical Petrological Sci. 116 (2), 108–112. doi:10.2465/jmps.201130c
Smithies, R. H., Champion, D. C., and Cassidy, K. F. (2003). Formation of Earth’s early Archaean continental crust. Precambrian Res. 127 (1-3), 89–101. doi:10.1016/s0301-9268(03)00182-7
Söderlund, U., Bleeker, W., Demirer, K., Srivastava, R. K., Hamilton, M., Nilsson, M., et al. (2019). Emplacement ages of paleoproterozoic mafic dyke swarms in eastern dharwar craton, India: Implications for paleoreconstructions and support for a∼ 30° change in dyke trends from south to north. Precambrian Res. 329, 26–43. doi:10.1016/j.precamres.2018.12.017
Srivastava, R. K., Jayananda, M., Gautam, G. C., Gireesh, V., and Samal, A. K. (2014). Geochemistry of an ENE–WSW to NE–SW trending∼ 2.37 Ga mafic dyke swarm of the eastern Dharwar craton, India: Does it represent a single magmatic event? Geochemistry 74 (2), 251–265. doi:10.1016/j.chemer.2013.07.007
Srivastava, R. K., Samal, A. K., and Gautam, G. C. (2015). Geochemical characteristics and petrogenesis of four Palaeoproterozoic mafic dike swarms and associated large igneous provinces from the eastern Dharwar craton, India. Int. Geol. Rev. 57 (11-12), 1462–1484. doi:10.1080/00206814.2014.938366
Stern, R. J. (2005). Evidence from ophiolites, blueschists, and ultrahigh-pressure metamorphic terranes that the modern episode of subduction tectonics began in Neoproterozoic time. Geology 33 (7), 557–560. doi:10.1130/g21365.1
Sun, S. S., and McDonough, W. F. (1989). Chemical and isotopic systematics of oceanic basalts: Implications for mantle composition and processes. Geol. Soc. Lond. Spec. Publ. 42 (1), 313–345. doi:10.1144/gsl.sp.1989.042.01.19
Swami Nath, J., and Ramakrishnan, M. (1981). Early Precambrian supracrustals of southern Karnataka. Memoirs Geol. Surv. India 112, 350.
Takahashi, T., Hirahara, Y., Miyazaki, T., Vaglarov, B. S., Chang, Q., Kimura, J. I., et al. (2009). Precise determination of Sr isotope ratios in igneous rock samples and application to micro-analysis of plagioclase phenocrysts. JAMSTEC Rep. Res. Dev. 2009, 59–64.
Takahashi, T., Shuto, K., and Iho, S. (1997). Differentiation of myeloid cells and 1,25-dihydroxyvitamin D3. Rigaku J. 28, 25–33. doi:10.3109/10428199709068268
Tang, M., Chen, K., and Rudnick, R. L. (2016). Archean upper crust transition from mafic to felsic marks the onset of plate tectonics. Science 351 (6271), 372–375. doi:10.1126/science.aad5513
Windley, B. F., Kusky, T., and Polat, A. (2021). Onset of plate tectonics by the Eoarchean. Precambrian Res. 352, 105980. doi:10.1016/j.precamres.2020.105980
Yadav, P., Sarma, D. S., and Parashuramulu, V. (2020). Pb-Pb baddeleyite ages of mafic dykes from the Western dharwar craton, southern India: A window into 2.21–2.18 Ga global mafic magmatism. J. Asian Earth Sci. 191, 104221. doi:10.1016/j.jseaes.2019.104221
Keywords: Metadolerite dykes, mafic dyke swarms, Western Dharwar Craton (India), Archean subcontinental lithospheric mantle, Sr-Nd isotope systematics
Citation: Silpa AS, Satish-Kumar M, Takahashi T and Kamei A (2023) Sm-Nd isotopic constraints on the metadolerite dykes from Western Dharwar Craton, Southern India: implications on the evolution of Archean subcontinental lithospheric mantle. Front. Earth Sci. 11:1153003. doi: 10.3389/feart.2023.1153003
Received: 28 January 2023; Accepted: 28 April 2023;
Published: 09 May 2023.
Edited by:
J. Gregory Shellnutt, National Taiwan Normal University, TaiwanReviewed by:
John Greenough, University of British Columbia, CanadaBoris Belyatsky, A.P. Karpinsky Russian Geological Research Institute, Russia
Copyright © 2023 Silpa, Satish-Kumar, Takahashi and Kamei. This is an open-access article distributed under the terms of the Creative Commons Attribution License (CC BY). The use, distribution or reproduction in other forums is permitted, provided the original author(s) and the copyright owner(s) are credited and that the original publication in this journal is cited, in accordance with accepted academic practice. No use, distribution or reproduction is permitted which does not comply with these terms.
*Correspondence: A. S. Silpa, c2lscGFAcmlrby5zaGltYW5lLXUuYWMuanA=
 A. S. Silpa
 M. Satish-Kumar2
 A. Kamei