 Guofu Luo
 Fenghe Ding
 Yingcai Xu
 Hengzhi Luo
95% of researchers rate our articles as excellent or good
Learn more about the work of our research integrity team to safeguard the quality of each article we publish.
Find out more
ORIGINAL RESEARCH article
Front. Earth Sci. , 30 May 2023
Sec. Solid Earth Geophysics
Volume 11 - 2023 | https://doi.org/10.3389/feart.2023.1152348
This article is part of the Research Topic Advances and Applications of Passive Seismic Source Characterization View all 12 articles
In predicting earthquakes, it is a major challenge to capture the time factor and spatial isoline anomalies, and understand their physical processes, of the seismic strain field before a strong earthquake. In this study, the seismic strain field was used as representative of seismic activity. The natural orthogonal function expansion method was used to calculate the seismic strain field before the Menyuan Ms 6.4 earthquakes in 1986 and 2016, and the Ms 6.9 earthquake in 2022. Time factor and spatial isoline anomaly of the strain field before each earthquake was extracted. We also compared the evolution of the strain field with numerical simulation results under the tectonic stress system at the source. The results showed that the time factor before the earthquakes had high or low value anomalies, exceeding the mean square error of the stable background. The anomalies were concentrated in the first four typical fields of the strain field, which has multiple components. The abnormal contribution rate of the first typical field is the largest (accounting for 42%–49% of the total field). The long- and medium-term anomalies appear 3-4, and 1-2 years before the earthquake, respectively. There were no short or immediate-term anomalies within 3 months of the earthquake. In addition, during the evolution of the strain field, the abnormal area of the spatial isoline changed with the change in time. Usually, the intersection area of the two isoseismic lines of strain accumulation and strain release becomes a potential location for strong earthquakes. Finally, we found that the high strain field values of the 1986 and 2016 Ms 6.4 earthquakes were equivalent to the numerical simulation results, while the high strain field values of the 2022 Menyuan Ms 6.9 earthquakes were slightly different, but within the accepted error range. These results indicate that the two methods are consistent. We have shown that the natural orgthagonal method can be used to obtain the spatiotemporal anomaly information of strain field preceding strong earthquakes.
The Menyuan region is located in the middle of the eastern region of the Qilian Mountains block on the northeastern boundary of the Tibetan Plateau in China. This orogenic belt has strong tectonic deformation, relatively large topographic gradient variations, and strong movements (Gaudemer et al., 1995; Jiang et al., 2017; Li et al., 2021). The area has long been pushed by the Indian plate, leading to the northeastern expansion of the Tibetan Plateau and the resisting force of the Alxa block (Pan et al., 2022; Yuan et al., 2023). The region has a complex internal geological structure, and the active Lenglongling and Tuolaishan fault zones that developed mainly during the Holocene belong to the strongly active Qilian-Haiyuan fault zone branch (Zheng et al., 2013). Historically, the following earthquake events were located in areas known for strong earthquake activity (Yuan et al., 2023; Zuo et al., 2023): the 1927 Gansu Gulang Ms 8 (Zheng et al., 2004; Liu et al., 2007; Guo et al., 2020), 1986 Menyuan Ms 6.4 (Yan et al., 1987; Dang et al., 1988; He et al., 2019), 2016 Menyuan Ms 6.4 (Hu et al., 2016; Xu et al., 2016; Guo et al., 2017; Liang et al., 2017; Liu et al., 2019; Zhao et al., 2019; Qu et al., 2021), and 2022 Menyuan Ms 6.9 (Fan et al., 2022; Sun et al., 2022; Xu et al., 2022). Recently, several detailed studies have investigated the activity pattern, seismogenic environment and earthquake triggering capacity of the Lenglongling fault zone (Guo et al., 2017; Liu et al., 2018; Zhao et al., 2019). Three Ms >6.0 earthquakes in Menyuan are believed to have been associated, predominantly, with the Lenglongling fault, although the 2022 Menyuan Ms 6.9 earthquake resulted from the combined activity of the Tuolaishan and Lenglongling faults (Fan et al., 2022; Zhao et al., 2022; Yuan et al., 2023), with ruptures occurring on both sides (Xu, 2022). The 2022 Menyuan Ms 6.9 earthquake significantly affected the Jinqianghe and Laohushan faults situated at the eastern side of the Lenglongling fault, increasing the seismic stress and, the probability of strong earthquakes in future (Pan et al., 2022; Yuan et al., 2023).
In recent years, strong seismic activity in the Menyuan area has elicited abundant research, with detailed local and international studies being conducted on the cause, velocity structure, coseismic deformation, and surface rupture of strong earthquakes in the area. Zuo and Chen (2018) and Wang et al. (2022) investigated the three-dimensional body wave velocity structure and seismic relocation of the crust in the Menyuan region, contending that the heterogeneity of the velocity structure showed strong congruity with the two Menyuan Ms 6.4 earthquakes. Zhang et al. (2020) found that the 2016 Menyuan Ms 6.4 earthquake resulted from the delayed rupture deep in the focus of the 1986 earthquake. Gai et al. (2022), Han et al. (2022), Liang et al. (2022), Li Z et al. (2022), and Pan et al. (2022) studied the distribution of the surface rupture and seismogenic structures of the 2022 Menyuan Ms 6.9 earthquake. Yang et al. (2022), Huang et al. (2022), Li Y et al. (2022), and Bao et al. (2022), employing Interferometric Synthetic Aperture Radar (InSAR) data, determined the coseismic deformation of the Menyuan Ms 6.9 earthquake. These authors conducted slip inversion of the earthquake, demonstrating that the surface rupture process was a consequence of the combined actions of the Lenglongling and Tuolaishan faults.
The application of field theory to study anomalies before strong earthquakes is relatively new. In China, the orthogonal function expansion method is used to calculate the energy field (Yang and Zhao, 2004), frequency field (Luo et al., 2023) and strain field (Yang et al., 2017; Luo et al., 2018; Luo et al., 2019) before strong earthquakes. This method analyze the relationship to between spatiotemporal anomalies and strong earthquakes. In Japan, India, Europe and the United States, the empirical orthogonal function method is used to calculate deformation fields before and after strong earthquakes (Chang and Chao, 2011; Chao and Liau, 2019; Neha and Pasari, 2022). This method analyzes the co-seismic deformation and gives the motion direction of 3-dimensional deformation.
In this study, we used the natural orthogonal function expansion method to analyze the strain field before 3 Ms >6.0 earthquakes in the Menyuan region. We aimed to understand the spatial and temporal anomalies that occur before strong earthquakes, analyze the evolution characteristics of spatial anomalies of the strain field over time, and give the physical interpretation of spatial anomalies and strong earthquake locations. In addition, this is the first time the results of numerical simulation under the tectonic stress system and strain field evolution have been compared.
Seismic strain was considered a random variable and was broken into temporal and spatial functions using the natural orthogonal function expansion method, also known as the seismic strain field S (Yang et al., 2017; Luo et al., 2018). Using the grid method, the strain field was constructed for a particular study region according to the level of seismic activity in the region. A time interval
The seismic energy release was represented by
The Menyuan region has similar seismic blocks, and seismic focal-related parameter c is approximately constant. The field function
The orthogonality and normalization conditions were satisfied, as follows:
The characteristic equation of the corresponding covariance matrix
The eigenvectors
The eigenvectors
where
The natural orthogonal function expansion method was employed to extract the strain fields corresponding to the largest eigenvalues, which is equivalent to encapsulating the main information of the strain fields in the region. The focus was on the anomalies of the highest strain fields and any strain fields without anomalies or that had a small correlation with strong earthquakes were excluded.
The earthquake data used in this study was derived from the official national earthquake catalog of the China Earthquake Networks Center (CENC). A b-value test was performed on the seismic data in the study region from January 1975 to December 2022, with the lower limit of the smallest complete magnitude of the earthquake being set to ML 2.7. The probability of moderate and strong earthquakes occurring in the study region is quite small, and the release of strain energy has a significant effect on this region. Therefore, earthquakes with intensities greater than moderate were not considered to belong to the normal seismic activity in our study region, and the upper magnitude limit was set to Ms 5.0. We employed the K-K theory (Luo et al., 2019) to remove the aftershocks of Ms >5.0 earthquakes. A grid of 0.5° × 0.5°(Yang et al., 2017) was used for the study region, and the time-sliding algorithm was adopted, with a time interval of 12 months, sliding span of 1 month, and the data were discretized. Seismic strain release matrix S was constructed in accordance with Eq. 1, and natural orthogonal function expansion analysis was conducted. Covariance matrix R was solved to obtain the eigenvalues of the field and the main strain fields corresponding to these eigenvalues. The temporal factors corresponding to the eigenvalues of the main fields were obtained, along with the spatial isolines of different study regions.
The study region is located at (100.5°–103.5° E, 35.5°–38.5° N) in the Qilian Mountain block area on the northeastern boundary of the Tibetan Plateau, where a series of approximately parallel faults has developed, that is, inclined toward the NWW, as shown in Figure 1. These parallel faults include the Xunhua Nanshan, Dabanshan, Tuolaishan, Lenglongling, Jinqianghe, Qilian Mountain northern boundary, and Changma–Ebo faults. Moreover, several other NNW-trending faults are present, such as the Wuwei–Tianzhu, Zhuanglanghe, and Riyueshan faults, along with numerous secondary faults. Accordingly, this fault system is an important and active system on the northeastern edge of the Tibetan Plateau (Figure 1A). Over the past 40 years, three consecutive Ms >6.0 earthquakes have occurred in the Menyuan region (Figure 1B), with the Lenglongling fault being the seismogenic origin of the 1986 and 2016 Ms 6.4 thrust earthquakes (He et al., 2019; Qu et al., 2021). The seismogenic origin of the 2022 strike-slip Ms 6.9 earthquake in Menyuan was a combination of the Tuolaishan and Lenglongling faults (Pan et al., 2022; Yuan et al., 2023). The seismic activity of Ms >6.0 earthquakes in the Menyuan region could indicate that the earthquakes have accumulated a relatively high strain field capable of triggering strong earthquakes whenever the main active faults slide and rupture (Zuo et al., 2023).
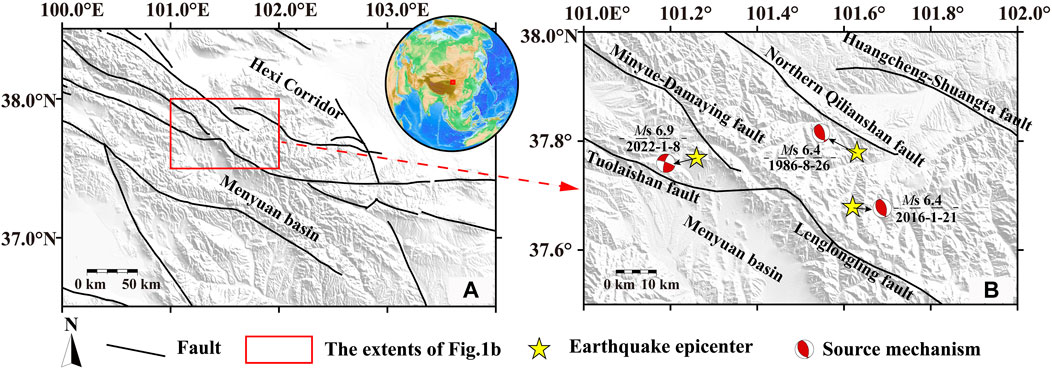
FIGURE 1. (A) Study area of the northeastern margin of the Tibetan Plateau. Black lines show major faults. The red rectangle represents the location of the study area. (B) The northeast direction of the red rectangle is the Hexi Corridor, and the south is the Menyuan basin. Regional seismic setting of the 1986, 2016, and 2022 Menyuan earthquakes. The epicenters of the earthquakes are indicated by stars in accordance with data derived from the China Earthquake Networks Center (CENC). The focal mechanism of the 1986 Menyuan Ms 6.4 earthquake derives from the United States Geological Survey (USGS), that of the 2016 Menyuan Ms 6.4 earthquake is from Yin et al. (2018), and that of the 2022 Menyuan Ms 6.9 earthquake is from Xu et al. (2022).
We used the natural orthogonal function expansion method to study the spatiotemporal characteristics of the seismic strain fields in the Menyuan region in the 10 years prior to the occurrence of the 1986 and 2016 Ms 6.4 earthquakes and the2022 Ms 6.9 earthquake. The results are shown in Table 1.
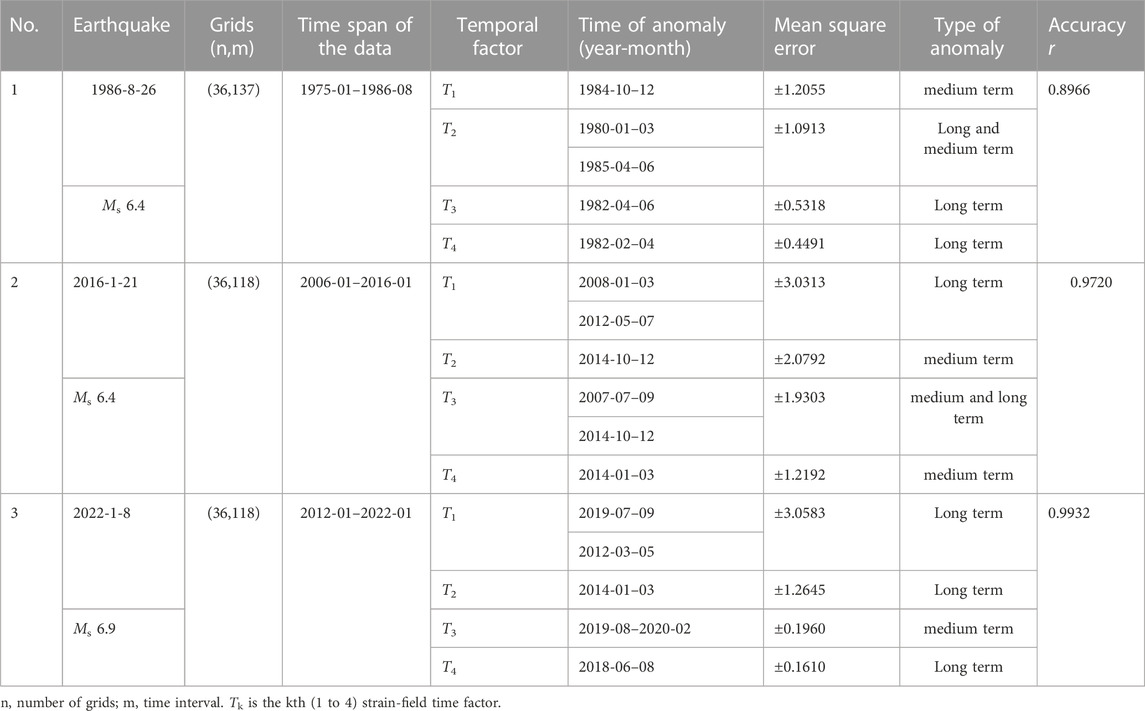
TABLE 1. Strain field temporal factors.
The parameters included the calculation grid and time-period, temporal factors, and time of anomaly of the first four strain fields as well as anomaly types, mean square error, and accuracy of the previous four strain fields. The accuracy of the first four strain fields was above 89%, whereas that of the 2022 Ms 6.9 earthquake was above 99 Figure 2 shows the characteristics of strain field changes over time, before the three Ms >6.0 earthquakes. In our study, the analyzed the temporal factor of the strain field that exceeded the mean square error as the criterion for anomalies. The anomalies (Luo et al., 2023) were classified based on timing before the earthquake as: long-term (10 years), medium-term (1-2 years), short-term (3 months), and imminent (tens of days).
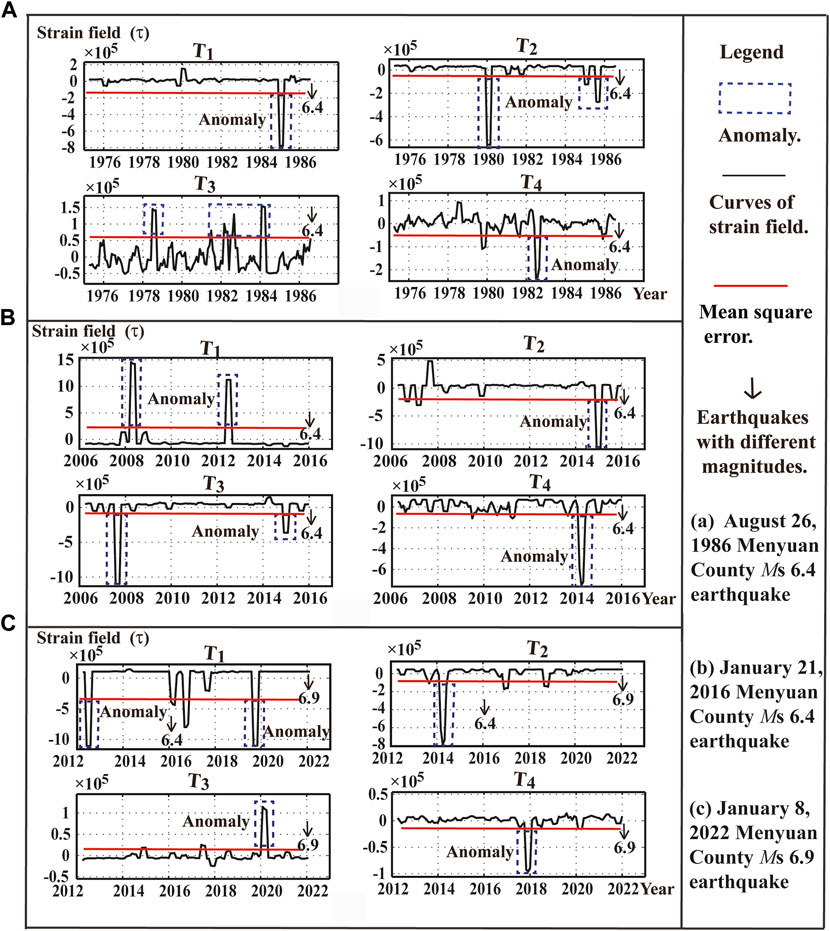
FIGURE 2. Temporal factors of the first four strain fields of three Ms ≥6.0 earthquakes. (A) August 26, 1986 Menyuan County Ms 6.4 earthquake; (B) January 21, 2016 Menyuan County Ms 6.4 earthquake; (C) January 8, 2022 Menyuan County Ms 6.9 earthquake. The blue dotted line represents the anomaly, the red line is the mean square error, and the black arrow represents the magnitude of the Ms ≥6.0 earthquake.
One or several anomalies of the four strain field factors appeared every time before a strong earthquake. Whether the magnitude of the anomaly exceeded the absolute value of the mean square error was used as the criterion for determining whether there was an anomaly. More than two medium-term anomalies appeared before the 1986 and 2016 earthquakes, and one medium-term anomaly appeared before the 2022 earthquake. Two long-term anomalies and no short-term anomalies were detected (Table 1), and the first two temporal anomalies were related to the 2016 earthquake. Generally, the overall changes in the four strain field temporal factor curves were stable before the three Ms >6.0 earthquakes. Relatively few anomalies exceeded the threshold (the mean square error, indicated by the red line in Figure 2).
In our study of the seismic strain field spatial isoline evolution patterns in the study region before and after strong earthquakes, the environs of the isoline values (or absolute values) greater than 0.05 × 10⁵ were usually defined as danger zones (Luo et al., 2018). The positive values of the isolines represented seismic strain field release and the negative values represented seismic strain field accumulation. The danger zone in the intersection between strain field release and accumulation usually corresponded to the location of the main shock. Combined with the geological structure in the region, the strain field accumulation and release regions of the active faults could be considered the seismogenic location of future strong earthquakes (Yang et al., 2017; Luo et al., 2019). Figure 3 shows the spatial distribution of the strain fields in the region before and after the August 1986 earthquake. From January to March 1986, two types of large area seismic danger zones—Strain field accumulation and release—Occurred in the middle of the eastern region of the Qilian Mountain. From April to June 1986, the number of anomalies in the seismic danger zone increased, and these were divided into multiple anomalies. From July to September 1986, the area of the two anomalous zones increased, and the earthquake occurred around the two danger zones of the Lenglongling fault. From October to December 1986, the danger zones of the strain field isolines gradually increased in size, before finally slowly disintegrating.
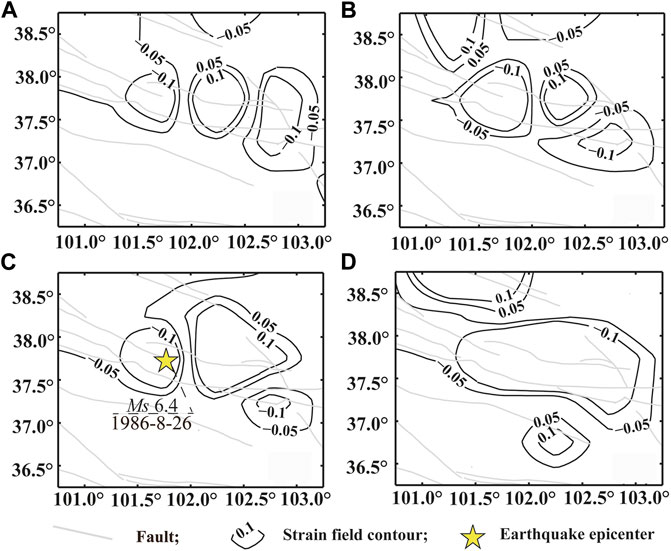
FIGURE 3. Spatial distribution of the strain field before and after the 1986 earthquake. Strain field from (A) January to March 1986; (B) April to June 1986; (C) July to September 1986; (D) October to December 1986. The gray and black lines are the fault and strain field contour, respectively. A negative value indicates accumulated strain, and a positive value indicates released strain. Isoline value 0.1 represents 0.1 × 10⁵. The yellow stars represents the epicenter of the Menyuan Ms 6.4 earthquake on 26 August 1986.
Figure 4 shows the spatial distribution of the strain fields in the region before and after the earthquake in January 2016. A strain-field accumulation danger zone appeared in the middle of the eastern area of the Qilian Mountain from July to September 2015. The area of the strain-field danger zone remained unchanged from October to December 2015, although a strain field release danger zone appeared in the northeast of the study region. From January to March 2016, the two large areas of strain field accumulation and release seismic danger zone anomalies appeared to converge and split into multiple anomalies. Here, at the same time, the earthquake occurred in the center of the anomalous zone. However, no main shock occurred at the intersection of the danger zone. From April to June 2016, the strain-field isoline danger zone gradually enlarged and, ultimately, slowly disintegrated.
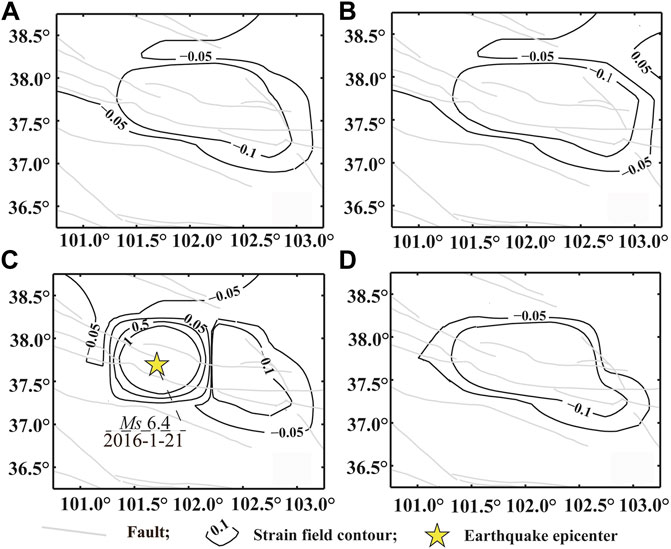
FIGURE 4. Spatial distribution of the strain field before and after the 2016 earthquake. Strain field from (A) July to September 2015; (B) October to December 2015; (C) January to March 2016; (D) April to June 2016. The gray and black lines are the fault and strain field contour, respectively. A negative value indicates accumulated strain, and a positive value indicates released strain. Isoline value 0.1 represents 0.1 × 10⁵. The yellow stars represents the epicenter of the Menyuan Ms 6.4 earthquake on 21 January 2016.
Figure 5 shows the spatial distribution of the strain fields in the region before and after earthquake in January 2022, where a strain field accumulation danger zone surfaced in the middle eastern Qilian Mountain from July to September 2021. From October to December 2015, the strain-field danger zone area decreased, and a strain-field release danger zone simultaneously appeared in the north- and southwest of the danger zone, forming an anomalous intersection of these strain field accumulation and release danger zone areas. From January to March 2016, strain field accumulation and release anomalous danger zones formed along the intersection of the Tuolai Mountain fault and the Lenglongling fault zone and, at the same time, the earthquake occurred at the intersection of the danger zone. From April to June 2022, the strain-field isoline danger zones gradually increased before finally slowly disintegrating.
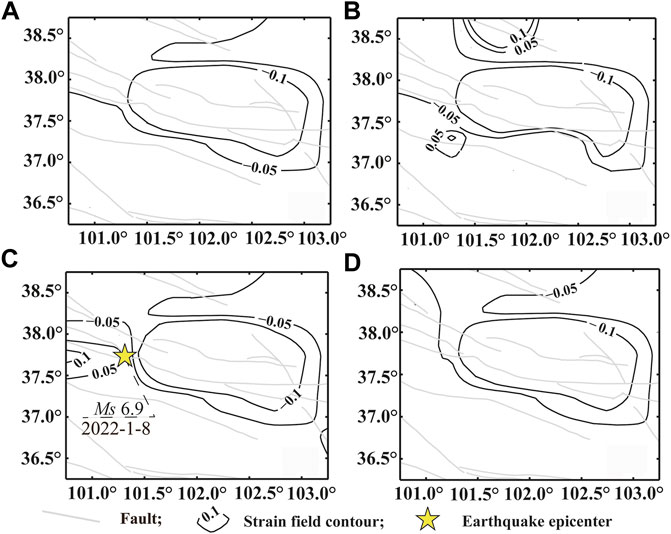
FIGURE 5. Spatial distribution of the strain field before and after 2022 earthquake. Strain field from (A) July to September 2021; (B) October to December 2021; (C) January to March 2022; (D) April to June 2022. The gray and black lines are the fault and strain field contour, respectively. A negative value indicates accumulated strain, and a positive value indicates released strain. Isoline value 0.1 represents 0.1 × 10⁵. The yellow stars represents the epicenter of the Menyuan Ms 6.9 earthquake on 8 January 2022.
A comparison of Figures 3–5 indicated differences in the strain field isoline anomaly evolution patterns before and after the earthquakes. There were also similarities in that the anomalies in strain accumulation and release first appeared in the study region, followed by several anomalous areas appearing. Additionally, the danger zone increased in size before slowly disappearing after the main earthquake. These findings explained the inference (Zhang et al., 2020) that the 2016 Menyuan Ms 6.4 earthquake was the result of delayed rupture deep in the focus of the 1986 Menyuan Ms 6.4 earthquake. Moreover, our findings were consistent with those of He et al. (2019) that the 2016 Menyuan Ms 6.4 earthquake was a repeating earthquake of the 1986 Menyuan Ms 6.4 event.
The study region has long been subjected to the northeasterly pushing of the Tibetan Plateau and resistance from the Alxa block, which has led to the gradual deformation of the Haiyuan-Qilian Mountain fault zone, as well as accumulation of considerable seismic strain that has formed a locked seismogenic unit. The high concentration of stress and strain in the environs of the locked zone has led to earthquakes or fault branches in the Haiyuan-Qilianshan fault zone. Such events have triggered changes in the accumulation of stress and strain, which, in turn, has altered the spatial distribution of the seismic strain field. Accordingly, seismogenic information on the 1986 Menyuan Ms 6.4, 2016 Menyuan Ms 6.4, and 2022 Menyuan Ms 6.9 earthquakes was included in this study of the seismic strain field in the Menyuan region, where the dynamic processes of strong earthquakes are reflected.
Figure 6A shows the spatial distribution of the seismic strain field from 1 February 2016 to 7 January 2022. The seismic strain anomalies were concentrated mainly in the Lenglongling and Sunan–Qilian faults in a hexagonal distribution and a northeast direction. The center of the anomalies was located on the Lenglongling fault, with a value of approximately 4.3 × 10⁵; however, 2022 earthquake occurred on the boundary of the strain field anomaly with a value of approximately 2.5 × 10⁵. Figure 6B shows that the seismic strain field anomalies from 1 January 2006 to 20 January 2016 were concentrated around the Lenglongling fault and followed a hexagonal distribution in a northeast direction, with a larger area of anomalies. The 2016 earthquake occurred near the high anomalous value area (4.5 × 10⁵). Figure 6B shows that the seismic strain field anomalous area was larger from 1 January 1975 to 25 August 1986, was moving in an easterly direction, and was concentrated mainly around the Gulang and Huangcheng-Shuangta faults. The 1986 earthquake occurred at the boundary of the anomaly, with a value of approximately 2.8 × 10⁵. Figure 6C shows two high-value areas that appeared in the seismic strain field anomalies from 1 January 1975 to 31 December 2022. The high-value northeastward-trending hexagonal anomalous area was centered on the Lenglongling fault and corresponded to all three earthquakes. Another high strain field anomalous value in Tianzhu County, Gansu Province could indicate a seismogenic unit of future strong earthquakes. A comparison between Figures 6A–C showed that the seismic strain field high anomalous values were concentrated predominantly around the Lenglongling fault, with the environs of the high anomalous value area corresponding mainly to the three Menyuan Ms >6.0 earthquakes east of the Lenglongling fault. The vicinity of the Tianzhu fault could be a seismogenic unit of future strong earthquakes. These areas predicted as sites for potential future strong earthquakes were consistent with the strong earthquake danger zones proposed by Xu et al. (2022), Fan et al. (2022), and Yuan et al. (2023).
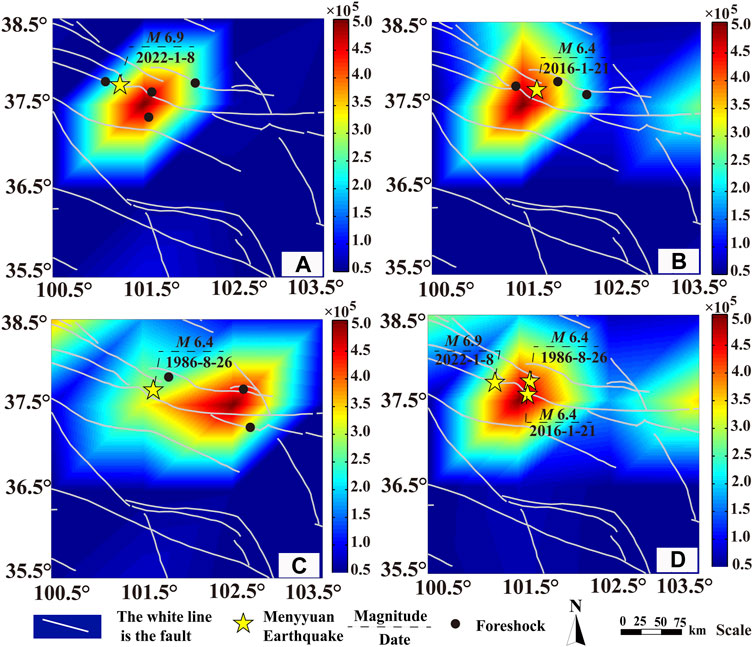
FIGURE 6. Spatial distribution of the seismic strain in the study area from 1975 to 2022. Spatial distribution of the seismic strain field from (A) 1 February 2016 to 7 January 2022; (B) 1 January 2006 to 20 January 2016; (C) 1 January 1975 to 25 August 1986; (D) 1 January 1975 to 31 December 2022. The white line is the fault, the yellow stars represents the epicenter of the Ms ≥6.0 earthquake and the black point is the epicenter of Ms 3–5 foreshocks. The area enclosed by sky blue, yellow, and red is the abnormal area of the seismic strain field.
This study aimed to understand the strain field factors that contributed to three earthquakes in the Menyuan region in 1986, 2016 and 2022. These factors determined the outcome of the relative shear stress produced by the two focal mechanism solution nodal planes of the 2022 Menyuan Ms 6.9, 2016 Menyuan Ms 6.4, and 1986 Menyuan Ms 6.4 earthquakes (Figure 7). The outcomes of the focal mechanism solutions of the three earthquakes were consistent with the results shown in Figure 1. Figure 7 shows that the relative shear stress generated by the stress tensor on the 2022 Menyuan Ms 6.9 earthquake focal mechanism solution (Xu et al., 2022) nodal plane I (strike 290°, dip angle 81°) was 0.64, and the relative shear stress generated on nodal plane II (strike 197°, dip angle 74°) was 0.52. The relative shear stress generated by the stress tensor on the 2016 Menyuan Ms 6.4 earthquake focal mechanism (Yin et al., 2018) nodal plane I (strike 143°, dip angle 40°) was 0.99; whereas the relative stress generated on nodal plane II (strike 347°, dip angle 53°) was 0.83. The relative shear stress generated by the stress tensor on the 1986 Ms 6.4 earthquake focal mechanism [United States Geological Survey (USGS)] nodal plane I (strike 125°, dip angle 37°) was 0.98, and the relative shear stress generated on nodal plane II (strike 346°, dip angle 60°) was 0.81. These values indicated that the relative shear stress of the two Menyuan Ms 6.4 earthquakes in 2016 and 1986 reached a maximum (the maximum shear stress was 1), i.e., the accumulated stress was released completely, with a relatively significant effect on the environs of the earthquake focus. The relative shear stress of the 2022 Menyuan Ms 6.9 earthquake only exceeded the average value, and the complete release of the accumulated stress in the tectonic area had negligible effect on the environs of the earthquake focus. The strain field results were consistent with the numerical simulation results under the tectonic stress system for the 1986 and 2016 earthquakes. The results for the 2022 earthquake were slightly different, but still within the acceptable error range.
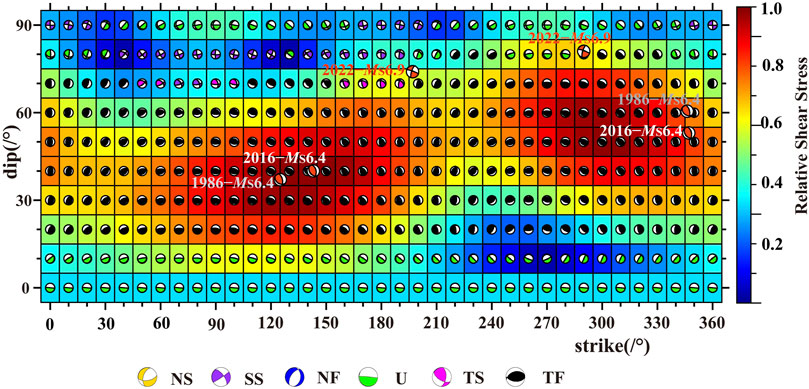
FIGURE 7. Simulated focal mechanisms and relative shear stress of the stress system in the Menyuan region. The abscissa is the strike of the focal mechanism, and the ordinate is the dip angle. NS represents the positive fault-and-strike slip type, SS represents the strike-slip type, NF represents the positive fault-and-strike slip type, TS represents the reverse fault-and-strike slip type, TF represents the reverse fault-and-strike type, and U represents uncertain focal mechanism solutions. Theoretical simulation results are compared with the source mechanism solutions of three actual source Menyuan earthquakes, with magnitudes 6 or above (using the source mechanism solution results in Figure 1). The red characters represent the Ms 6.9 Menyuan earthquake in 2022, white characters represent the Ms 6.4 Menyuan earthquake in 2016, and the gray characters represent the Ms 6.4 Menyuan earthquake in 1986. Grid squares represent shear stress from low (blue) to high (red).
We found that the main factors affecting the temporal and spatial anomalies of the seismic strain field are the occurrence of magnitude-4-5 foreshocks or clusters and the intensity and frequency of foreshock activity (Table 2). The largest foreshocks or clusters were usually located in the center of a spatial anomaly and the first time factor anomaly. The activity level of foreshocks increased significantly before the three earthquakes, which was mainly characterized by high intensity and high frequency foreshocks. In 1986 and 2016, there were several foreshocks of magnitude 4-5 in the region 4 years prior to the earthquakes. Additionally, a Ms 4.9 earthquake cluster occurred in the region 3 years prior to the 2022 earthquake. The strongest foreshock or cluster is usually located in the center of spatial anomaly and distributed in the first time factor anomaly of the strain field.
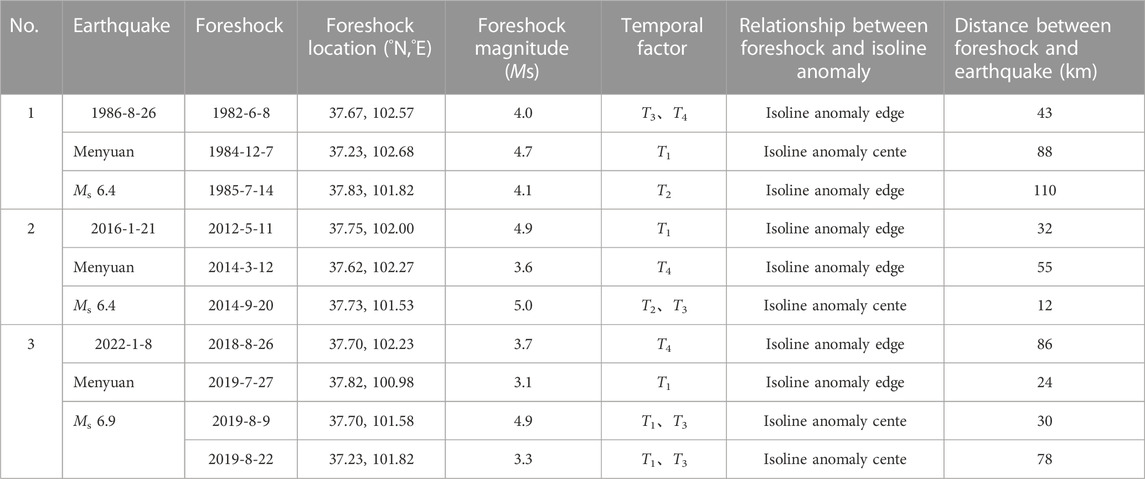
TABLE 2. Relationship between temporal and spatial anomalies of the strain field and foreshock activity.
By comparing the difference between the seismic strain field method and the seismic frequency field method (Luo et al., 2023), the method chosen to study the temporal and spatial anomaly characteristics around strong earthquakes mainly determines the level of foreshock activity around the source. If the frequency of foreshocks around the source increases significantly, and the intensity of the earthquake is magnitude 3-4, the seismic frequency field method is preferred. If the foreshock frequency around the source increases, it is mainly caused by earthquakes of magnitude 4-5, the seismic strain field method is more suitable. If the foreshock activity around the source is of high frequency and high intensity, either method may be used. Usually, a comparative study of both methods is more reliable conclusions.
Many groups consider the spatiotemporal empirical orthogonal function method to be a state-of-the-art toolkit in the study of prediction, evaluation, and detection of small-scale and, short-term and long-term variation in data sets (Dawson, 2016; Chao and Liau, 2019; Neha and Pasari, 2022). Therefore, in this study, the natural orthogonal function method was used to extract the temporal and spatial anomalies of the seismic strain field, analyze the relationship between the anomalies and strong earthquakes, and predict the likelihood of an earthquake occurring. Prediction of earthquakes has always been a controversial scientific issue, but has been carried out systematically in China. In recent years, significant progress has been made in short-and medium-term prediction techniques based on seismicity (Huang et al., 2017). These are generally divided into a physical process-based model and smooth seismic activity model (Tiampo and Sihchernakov, 2012) with 7 new methods in the former and 10 in the latter. The natural orthogonal function expansion method used in this study is the 11th method of the smooth seismic activity model, and the latest development in the field of statistical seismology. It provides more spatiotemporal information for earthquake prediction than other methods.
This study investigated the spatiotemporal anomalies of the seismic strain field before and after three Ms >6.0 earthquakes in the Menyuan region. We found that there were long- and medium-term anomalies before the earthquakes in the first four strain fields. Additionally, the more abnormal the anomalies were, the higher their predictive ability became. We found that the intersection region of strain accumulation and strain release became the potential location for strong earthquakes and the danger region gradually disappeared −3–6 months after the event. Seismic strain field results were consistent with numerical simulation results for the 1986 and 2016 earthquakes but less reliable for the 2022 earthquake.
Due to the relatively short time that the seismic catalog has been available, longer seismic observation data will be needed in the future to evaluate and revise the feasibility and effectiveness of the method used in this study.
The raw data supporting the conclusion of this article will be made available by the authors, without undue reservation.
All authors contributed to the conception and design of this study. GL, HL, and WL prepared the material, collected the data, and performed the analysis. The first draft of the manuscript was written by GL and YX, and all authors provided their feedback. All authors contributed to the article and approved the submitted version.
This work was supported by the Ningxia Natural Science Foundation Project (2021AAC03483) and Technology Spark Plan Project (XH18052).
We are very thankful to the reviewers for their valuable revision suggestions, and especially to the responsible editors for their patient answers and help. Some of the figure were prepared using MATLAB and GMT.
The authors declare that the research was conducted in the absence of any commercial or financial relationships that could be construed as a potential conflict of interest.
All claims expressed in this article are solely those of the authors and do not necessarily represent those of their affiliated organizations, or those of the publisher, the editors and the reviewers. Any product that may be evaluated in this article, or claim that may be made by its manufacturer, is not guaranteed or endorsed by the publisher.
Bao, X., Zhang, R., Wang, T., Shama, A., Zhan, R., Lv, J. C., et al. (2022). The source mechanism and fault movement characterization of the 2022 Mw 6.7 Menyuan earthquake revealed by the joint inversion with InSAR and teleseismic observations. Front. Environ. Sci. 10, 917042. doi:10.3389/fenvs.2022.917042
Chang, E. T. Y., and Chao, B. F. (2011). Co-seismic surface deformation of the 2011 off the Pacific coast of Tohoku earthquake: Spatiotemporal EOF analysis of GPS data. Earth, Planets Space. 63, 649–654. doi:10.5047/eps.2011.07.002
Chao, B. F., and Liau, J. R. (2019). Gravity changes due to large earthquakes detected in GRACE satellite data via empirical orthogonal function analysis. J. Geophys. Res. Solid Earth. 124, 3024–3035. doi:10.1029/2018JB016862
Dang, G. M., Tu, D. L., Ye, J. Q., Zhang, R. B., and Jia, Y. H. (1988). Seismic damage and intensity distribution of the Menyuan earthquake Ms 6.4 in 1986. Northwest. Seismol. J. 10 (3), 5–97. (in Chinese).
Dawson, A. (2016). Eofs: A library for eof analysis of meteorological, oceanographic, and climate data. J. Open Res. Softw. 4, 256. doi:10.5334/jors.122
Fan, L. P., Li, B. R., Liao, S. R., Jiang, C., and Fang, L. H. (2022). Precise earthquake sequence relocation of the january 8 2022, Qinghai menyuan ms 6.9 earthquake. Earthq. Sci. 35, Q20220008. doi:10.1016/j.eqs.2022.01.021
Gai, H. L., Li, Z. M., Yao, S. H., and Li, X. (2022). Preliminary investigation and research on surface rupture characteristics of the 2022 Qinghai Menyuan Ms 6.9 earthquake. Seismol. Geol. (in Chin. 44, 238–255. doi:10.3969/j.issn.0253-4967.2022.01.015
Gaudemer, Y., Tapponnier, P., Meyer, B., Peltzer, G., Shunmin, G., Zhitai, C., et al. (1995). Partitioning of crustal slip between linked, active faults in the eastern Qilian Shan, and evidence for a major seismic gap, the ‘Tianzhu gap’, on the Western Haiyuan Fault, Gansu (China). Geophys. J. Int. 120, 599–645. doi:10.1111/j.1365-246X.1995.tb01842.x
Guo, P., Han, Z. J., An, Y. F., Jiang, W. L., Mao, Z. B., and Feng, W. (2017). Activity of the lenglongling fault system and seismotectonics of the 2016 Ms 6.4 Menyuan earthquake. Chin. Sci. Earth Sci. 60 (5), 929–942. doi:10.1007/s11430-016-9007-2
Guo, P., Han, Z., Gao, F., Zhu, C., and Gai, H. (2020). A new tectonic model for the 1927 M 8.0 Gulang earthquake on the NE Tibetan plateau. Tectonics 39. doi:10.1029/2020TC006064
Han, S., Wu, Z. H., Gao, Y., and Lu, H. F. (2022). Surface rupture investigation of the 2022 Menyuan Ms 6.9 earthquake, Qinghai, China: Implications for the fault behavior of the Lenglongling fault and regional intense earthquake risk. J. Geomech. (in Chin. 28, 155–168. doi:10.12090/j.issn.1006-6616.2022013
He, X. H., Zhang, Y. P., Shen, X. Z., Zheng, W. J., and Zhang, D. L. (2019). Examination of the repeatability of two Ms 6.4 Menyuan earthquake in Qinlian-Haiyuan fault zone (NE Tibetan Plateau) based on source parameters. Phys. Earth Planet. Inter. doi:10.1016/j.pepi.2019.106408
Hu, C. Z., Yang, P. X., Li, Z. M., Huang, S. T., Zhao, Y., Chen, D., et al. (2016). Seismogenic mechanism of the 21 january 2016 menyuan, Qinghai ms 6.4 earthquake. Chin. J. Geophys. (in Chin. 59 (3), 1637–1646. doi:10.6038/cjg20160509
Huang, F. Q., Li, M., Ma, Y. C., Han, Y. Y., Tian, L., Yan, W., et al. (2017). Studies on earthquake precursors in China: A review for recent 50 years. Geod. Geodyn. 8, 1–12. doi:10.1016/j.geog.2016.12.002
Huang, C. C., Zhang, G. H., Zhao, D. Z., Shan, X. J., Xie, C. D., Tu, H. W., et al. (2022). Rupture process of the 2022 Mw 6.6 Menyuan, China, earthquake from joint inversion of acceleration data and InSAR measurements. Remte Sens. 14, 5104. doi:10.3390/rs14205104
Jiang, W., Han, Z., Guo, P., Zhang, J., Jiao, Q., and Kang, S. (2017). Slip rate and recurrence intervals of the east Lenglongling fault constrained by morphotectonics: Tectonic implications for the northeastern Tibetan Plateau. Lithosphere 9 (3), 417–430. doi:10.1130/L597.1
Li, H. B., Pan, J. W., Sun, Z. M., Si, J. L., Pei, J. L., Liu, D. L., et al. (2021). Continental tectonic deformation and seismic activity: A case study the Tibetan plateau. Acta Geol. Sin. (in Chin. 95, 194–213. doi:10.19762/j.cnki.dizhixuebao.2021051
Li Y, Y., Jiang, W., Li, Y., Shen, W., He, Z., Li, B., et al. (2022). Coseismic rupture model and tectonic implication of the January 7 2022, Menyuan Mw 6.6 earthquake constraints from InSAR observations and field investigation. Remote Sens. 14, 2111. doi:10.3390/rs14092111
Li Z, Z. M., Gai, H. L., Li, X., Yuan, D. Y., Xie, H., Jiang, W. L., et al. (2022). Seismogenic fault and coseismic surface deformation of the Menyuan Ms 6.9 earthquake in Qinghai, China. Acta Geol. Sin. (in Chin. 96 (1), 330–335. doi:10.19762/j.cnki.dizhixuebao.2022124
Liang, S. S., Lei, J. S., Xu, Z. G., Zou, L. Y., and Liu, J. G. (2017). Relocation of the aftershock sequence and focal mechansim solutions of the 21 January 2016 Menyuan, Qinghai, Ms 6.4 earthquake. Chin. J. Geophys. 60 (6), 2091–2103. (in Chinese). doi:10.6038/cjg20170606
Liang, K., He, Z. T., Jiang, W. L., Li, Y. S., and Liu, Z. M. (2022). Surface rupture characteristics of the menyuan ms 6.9 earthquake on january 8, 2022, Qinghai Province. Seismol. Geol. (in Chin. 44, 256–278. doi:10.3969/j.issn.0253-4967.2022.01.016
Liu, J., Klinger, Y., Xu, X. W., Lasserre, C., Chen, G., Chen, W., et al. (2007). Milennial recurrence of large earthquakes on the Haiyuan fault near Songshan, Gansu Province, China. Bull. Seismol. Soc. Am. 97, 14–34. doi:10.1785/0120050118
Liu, Y. G., Zhang, Y., Zhang, Y. F., and Shan, X. J. (2018). Source parameters of the 2016 Menyuan earthquake in the northeastern Tibetan Plateau determined from regional seismic waveforms and InSAR measurements. J. Asian Earth Sci. 158, 103–111. doi:10.1016/j.jseaes.2018.02.009
Liu, M., Li, H., Peng, Z., Ouyang, L., Ma, Y., Ma, J., et al. (2019). Spatial-temporal distribution of early aftershocks following the 2016 Ms 6.4 Menyuan, Qinghai, China Earthquake. Tectonophysics 766, 469–479. doi:10.1016/j.tecto.2019.06.022
Luo, G. F., Liu, Z. W., Ding, F. H., Ma, H. Q., and Yang, M. Z. (2018). Research on the seismic strain field prior to the 2017 Jiuzhaigou, Sichuan Ms 7.0 earthquake. China Earthq. Eng. J. 40, 1322–1330. doi:10.3969/j.issn.1000-0844.2018.06.1322
Luo, G. F., Liu, Z. W., Luo, H. Z., and Ding, F. H. (2019). Effect of the strain field of Wenchuan 8 earthquake on the strong earthquake around the epicenter. Prog. Geophys. 34, 0908–0918. (in Chinese). doi:10.6038/pg2019CC0454
Luo, G., Ding, F., Ma, H., and Yang, M. (2023). Pre-quake frequency characteristics of Ms ≥7.0 earthquake in mainland China. Front. Earth Sci. 10, 10–992858. doi:10.3389/feart.2022.992858
Neha, , and Pasari, S. (2022). A review of empirical orthogonal function (EOF) with an emphasis on the co-seismic crustal deformation analysis. Nat. Hazards. 110, 29–56. doi:10.1007/s11069-021-04967-4
Pan, J. W., Li, H. B., Marie-Luce, C., Liu, D. L., Li, C., Liu, F. C., et al. (2022). Coseismic surface rupture and seismic structure of the 2022 Ms 6.9 Menyuan earthquake, Qinghai Province,China. Acta Geol. Sin. 96, 215–231. doi:10.19762/j.cnki.dizhixuebao.222125
Qu, W., Liu, B., Zhang, Q., Gao, Y., Chen, H., and Wang, Q. (2021). Sentinel-1 InSAR observations of co- and post-seismic deformation mechanisms of the 2016 Mw 5.9 Menyuan Earthquake, Northwestern China. Adv. Space Res. 68, 1301–1317. doi:10.1016/j.asr.2021.03.016
Sun, A. H., Gao, Y., Zhao, G. F., Ren, C., and Liang, S. S. (2022). Seismic structure and b -value in the focal area of the 8th January 2022 Mengyuan, Qinghai Ms 6.9 earthquake. Chin. J. Geophys. 65, 1175–1183. (in Chinese). doi:10.6038/cjg2022Q0030
Tiampo, K. F., and Shcherbakov, R. (2012). Seismicity-based earthquake forecasting techniques: Ten years of progress. Tectonophysics 522–523, 89–121. doi:10.1016/j.tecto.2011.08.019
Wang, Q., Xiao, Z., WuLi, Y. S. Y., and Gao, Y. (2022). The deep tectonic background of the ms 6.9 menyuan earthquake on january 8, 2022 in Qinghai Province. Acta Seismol. Sin. 44, 211–222. doi:10.11939/jass.20220010
Xu, D. Z., Zhu, C. B., Meng, X. G., Li, Y., Sun, Q., and Zhang, K. (2016). Fault activity characteristics in the northern margin of the Tibetan Plateau before the Menyuan Ms 6.4 earthquake. Geod. Geodyn. 7, 261–267. doi:10.1016/j.geog.2016.07.001
Xu, Y. C., Guo, X. Y., and Feng, L. (2022). Relocation and focal mechanism solutions of the ms 6.9 menyuan earthquake sequence on january 8, 2022 in Qinghai Province. Acta Seismol. Sin. 44, 195–210. doi:10.11939/jass
Yan, Z. D., Zhang, C., and Xiao, L. Z. (1987). The sequence characteristics of Menyuan earthquake on August 26, 1986. Northwest. Seismol. J. 9, 89–93. (in Chinese).
Yang, M. Z., and Zhao, W. M. (2004). Statistical analysis of seismic activity energy field in Ningxia and its adjacent areas. J. E arthritis 26, 516–522. (in Chinese).
Yang, M. Z. M., Luo, H. Q., Xu, G. F., and Xu, X. Q. (2017). Research on the seismic strain field before strong earthquakes above Ms 6.0 in Chinese mainland. Chin. J. Geophys. 60, 3804–3814. doi:10.6038/cjg20171010
Yang, H. F., Wang, D., Guo, R., Xie, M., Zang, Y., Wang, Y., et al. (2022). Rapid report of the 8 january 2022 Ms 6.9 menyuan earthquake, Qinghai, China. Earthq. Res. Adv. 2, 1–14. doi:10.1016/j.eqrea.2022.100113
Yin, X. X., Zhao, L. L., Yang, L. M., Chen, J. F., Zuo, K. Z., and Pu, J. (2018). Research on focal mechanism and south depth of Menyuan, Qinghai Ms 6.4 earthquake. J. Geod. Geodyn. 38, 624–628. (in Chinese). doi:10.14075/j.jgg.2018.06.015
Yuan, D. Y. X., Su, H., Li, R. H., Wen, Z. M., Si, Y. M., Xue, G. J., et al. (2023). Characteristics of co-seismic surface rupture zone of Menyuan Ms 6.9 earthquake in Qinghai Province on January 8, 2022 and seismogenic mechanism. Chin. J. Geophys. (in Chin. 66, 229–244. doi:10.6038/cjg2022Q0093
Zhang, Y., Shan, X. J., Zhang, G. H., Zhong, M. J., Zhao, Y. J., Wen, S. Y., et al. (2020). The 2016 Mw 5.9 menyuan earthquake in the qilian orogen, China: A potentially delayed depth-segmented rupture following from the 1986 Mw 6.0 menyuan earthquake. Seismol. Res. Lett. 91, 758–769. doi:10.1785/0220190168
Zhao, L. Q., Zhan, Y., Sun, X. Y., Hao, M., Zhu, Y. Q., Chen, X. B., et al. (2019). The hidden seismic structure and dynamic environment of the 21 January Menyuan, Qinghai Ms 6.4 earthquake derived from magnetotelluric imaging. Chin. J. Geophys. (in Chin. 62 (6), 2088–2100. doi:10.6038/cjg2019M0204
Zhao, L. Q., Sun, X. Y., Zhan, Y., Yang, H. B., Wang, Q. L., Hao, M., et al. (2022). The seismic model of the Menyuan Ms 6.9 earthquake on January 8, 2022, Qinghai Province and segmented extensional characteristics of the Lenglongling fault. Chin. J. Geophys. 65, 1536–1546. (in Chinese). doi:10.6038/cjg2022Q0051
Zheng, W. J., Yuan, D. Y., Zhang, D. L., He, W. G., and Guo, H. (2004). Rupture property in the Gulang Ms 8.0 earthquake, 1927 and Numerical simulation of rupture mechanism. Earthq. Res. China 20, 353–363. (in Chinese).
Zheng, W. J., Zhang, P. Z., He, W. G., Yuan, D. Y., Shao, Y. X., Zheng, D. W., et al. (2013). Transformation of displacement between strike-slip and crust shortening in the northern of the Tibetan Plateau; Evidence from decadent GPS measurements and late Quaternary slip rates on faults. Tectonophysics 584, 267–280. doi:10.1016/j.tecto.2012.01.006
Zuo, K. Z., and Chen, J. F. (2018). 3D body-wave velocity structure of crust and relocation of earthquake in the Menyuan area. Chin. J. Geophys. 61, 2788–2801. (in Chinese). doi:10.6038/cjg2018L0537
Keywords: Menyuan region China, Ms >6.0 earthquakes, seismic strain field, spatiotemporal anomalies, natural orthogonal function expansion method
Citation: Luo G, Ding F, Xu Y, Luo H and Li W (2023) Strain fields of Ms >6.0 earthquakes in Menyuan, Qinghai, China. Front. Earth Sci. 11:1152348. doi: 10.3389/feart.2023.1152348
Received: 27 January 2023; Accepted: 18 May 2023;
Published: 30 May 2023.
Edited by:
Lei Li, Central South University, ChinaReviewed by:
Giovanni Martinelli, National Institute of Geophysics and Volcanology, Section of Palermo, ItalyCopyright © 2023 Luo, Ding, Xu, Luo and Li. This is an open-access article distributed under the terms of the Creative Commons Attribution License (CC BY). The use, distribution or reproduction in other forums is permitted, provided the original author(s) and the copyright owner(s) are credited and that the original publication in this journal is cited, in accordance with accepted academic practice. No use, distribution or reproduction is permitted which does not comply with these terms.
*Correspondence: Guofu Luo, MTUzOTY4NTY5QHFxLmNvbQ==
Disclaimer: All claims expressed in this article are solely those of the authors and do not necessarily represent those of their affiliated organizations, or those of the publisher, the editors and the reviewers. Any product that may be evaluated in this article or claim that may be made by its manufacturer is not guaranteed or endorsed by the publisher.
Research integrity at Frontiers
Learn more about the work of our research integrity team to safeguard the quality of each article we publish.