 D. O’Hara
 L. Karlstrom
- 1Department of Geography, Vrije Universiteit Brussel, Brussels, Belgium
- 2Department of Earth Sciences, University of Oregon, Eugene, OR, United States
The morphology and distribution of volcanic edifices in volcanic terrains encodes the structure and evolution of underlying magma transport as well as surface processes that shape landforms. How magmatic construction and erosion interact on long timescales to sculpt these landscapes, however, remains poorly resolved. In the Cascades arc, distributed volcanic edifices mirror long-wavelength topography associated with underlying crustal magmatism and define the regional drainage divide. The resulting strong along- and across-arc modern precipitation gradients and extensive glaciation provide a natural laboratory for climate-volcano interactions. Here, we use 1,658 volcanic edifice boundaries to quantify volcano morphology at the arc-scale, and reconstruct primary edifice volumes to create first-order estimations of Cascades erosion throughout the Quaternary. Across-arc asymmetry in eroded volumes, mirroring similarly asymmetric spatial distribution of volcanism, suggests a coupling between magmatism and climate in which construction of topography enhances erosion by orographic precipitation and glaciers on million-year timescales. We demonstrate with a coupled landscape evolution and crustal stress model that mountain building associated with magmatism and subsequent orographically-induced erosion can redistribute surface loads and direct subsequent time-averaged magma ascent. This two-way coupling can thus contribute to Myr-scale spatial migration of volcanism observed in the Cascades and other arcs globally.
1 Introduction
Volcanic topography represents the interface between crustal magma transport and surface environment. Within volcanic arcs, the distributions of volcanoes and their morphological differences characterize the spatial and temporal evolution of both volcanism and erosion (Völker et al., 2011; Karátson et al., 2012). The spatial distribution, composition, and extruded volumes (e.g., Sherrod and Smith, 1990; Pearce and Peate, 1995; Martin et al., 2004; Till et al., 2019) of volcanic vents and associated edifices reflect the structure of the underlying magma plumbing system (e.g., Vogt, 1974; Hieronymus and Bercovici, 2001), while edifice topography records time-variable volcanic landscape construction and erosion (Karátson et al., 2012; Grosse et al., 2020).
Volcanoes present an attractive target for estimating erosion due to their relative consistency as conical constructional landforms. As volcanoes are pervasive on Earth and other planets (Head and Wilson, 2022), these landforms provide a template for isolating the impacts of climate or primary composition on landscape form. Over the scale of a volcanic arc, rates of edifice erosion provide insight into the topographic evolution and weathering of volcanic terrain. Previous work used large, eroded edifices as passive indicators of past climate conditions (e.g., Karátson et al., 2012) or explored the effects of volcanic arc construction and erosion on global climate (e.g., Lee et al., 2015). However, with the exception of feedbacks on shorter timescales (e.g., glacial unloading; Jull and McKenzie, 1996), possible feedbacks between volcanic topography, magma transport, and spatial climate gradients have not been thoroughly explored. Furthermore, although global compilations of edifice geometries exist (Grosse et al., 2014; Grosse and Kervyn, 2018; Karlstrom et al., 2018), few studies have attempted regional completeness in landform catalogs (e.g., Bablon et al., 2020; Grosse et al., 2020; Bertin et al., 2023).
In this study, we analyze the spatial distribution of edifice morphologies from volcanoes that have erupted in the U.S. portion of the Cascades arc over the past 2.6 Ma using 10 m-resolution Digital Elevation Models (DEMs) and volcano topographic boundaries (O’Hara et al., 2020). We then use two simplified reconstruction methods to estimate lower and upper bounds for edifice eroded volumes, which approximate erosion rates along the arc front. Observed erosion patterns imply coupling between Quaternary Cascades erosion, climate, and volcanic edifice construction. Based on these data we propose a long-term volcano-climate feedback in which mountain building associated with magma transport and eruptions drives orographic asymmetry in erosion, which redistributes topographic surface loads that guide volcanic vent locations. The observed relationships between where volcanoes occur and how they erode thus implies a mechanism for enhancing volcanic arc front migration away from the trench in time. We demonstrate the mechanical feasibility of this feedback using a magmatic landscape evolution model under Cascades-like conditions, where deviatoric stresses in the subsurface from evolving topography guide volcanism.
2 The Cascades arc
The U.S. portion of the Cascades arc spans ∼1,000 km from northern California to Washington (40°N–49°N), and is associated with the subduction of the Juan de Fuca plate under the North American plate (Hildreth, 2007). Quaternary volcanism throughout the arc has culminated in ∼3,000 known vents (Ramsey and Siebert, 2017; O’Hara et al., 2020), spatially arranged in clusters around major volcanoes (defining ‘volcanic centers’; Hildreth, 2007; Karlstrom et al., 2015), or in distributed vent fields throughout the arc (e.g., Bacon et al., 1997; Fleck et al., 2014; Germa et al., 2019). These vents are associated with four dominant edifice classifications (Figures 1A,B)–scoria cones (number of vents n = 2030), domes (n = 357), shield volcanoes (n = 242), and composite volcanoes (n = 206, including large ‘stratovolcanoes’ representing the highest regional topography).
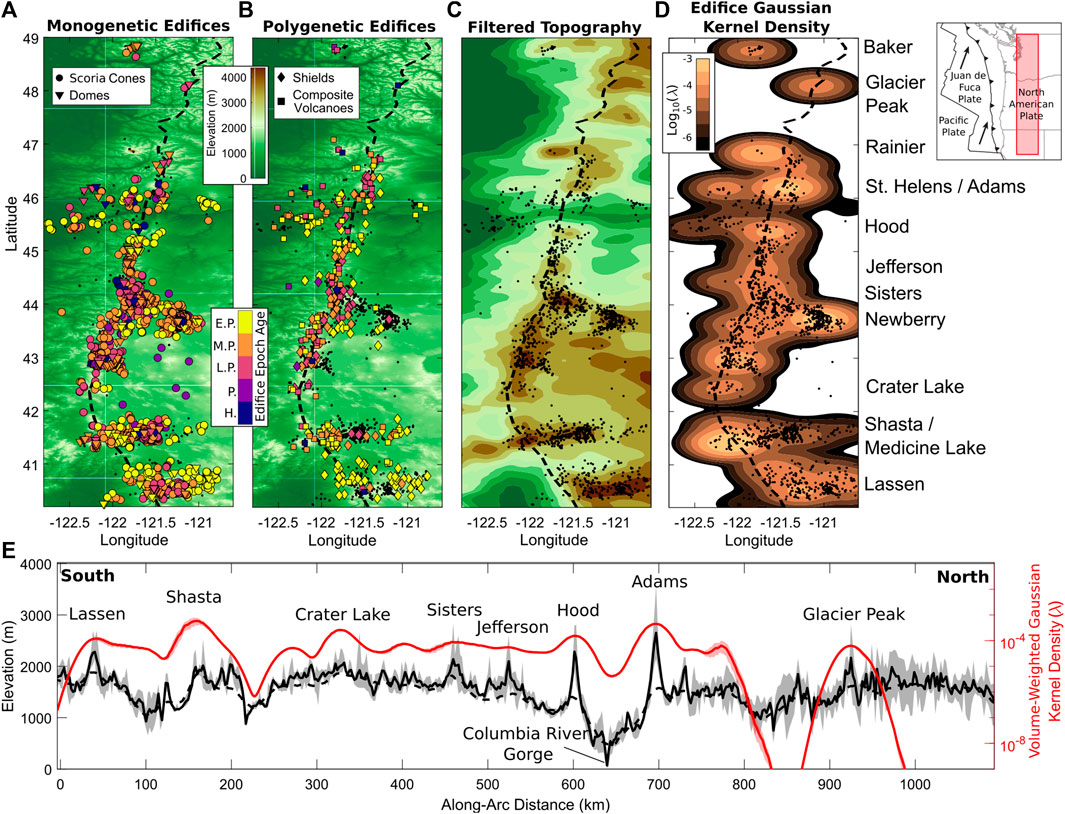
FIGURE 1. (A,B): Cascades arc topography and volcanic edifices. Black dots represent all edifice locations, black-dashed line represents the regional drainage divide, and colored symbols distinguish age of last eruption for (A) scoria cones and domes, and (B) shield and composite volcanoes. Regional divide derived by filtering topography over 10 km wavelength and combining drainage basin divides. Abbreviated epoch ages are H.: Holocene, P.: Pleistocene (general), L.P.: Late Pleistocene, M.P.: Middle Pleistocene, E.P.: Early Pleistocene. (C) Topography filtered over a 24 km wavelength (approximately two times the mean stratovolcano diameter) to remove edifice topography. (D) Edifice volume-weighted Gaussian kernel densities (
Cascades arc topography creates a roughly north-south trending regional drainage divide (Figures 1A–D, black-dashed lines) whose position varies east-west along its length by ∼100 km. As shown through volume-weighted Gaussian kernel densities of edifices (Supplemental text; Connor et al., 2019) within the Cascades (Figure 1D), this divide largely collocates with the arc-front, where the majority of volcanism is focused (Figure 1E). Longer wavelength topography (filtered at 24 km to remove volcanic edifices in Figure 1C) mirrors edifice distributions, as observed at other arcs globally (George et al., 2016). Clockwise tectonic block rotation present in the study area since at least the early Miocene implies extension in the south and compression in the north of the arc, as well as an apparent longitudinal migration of the arc both north and south of the rotation pole (Wells et al., 1998; Wells and McCaffrey, 2013). This kinematic framework is consistent with along-strike segmentation of Quaternary volcanic vents (Guffanti and Weaver, 1988; Wells et al., 1998). Topography mirrors diverse crustal geophysical signals associated with current magmatism in the Cascades arc (e.g., isostatic residual gravity, seismic tomography, heat flux, crustal rotation; Till et al., 2019; O’Hara et al., 2020), so mountain building likely reflects crustal thickening associated with magmatic intrusions that define long wavelength topography (Perkins et al., 2016), as well as background tectonic strain field.
The spatial trend of long wavelength topography and volcano distributions coincides with a significant east-west precipitation gradient (Fick and Hijmans, 2017), with drier conditions and lower erosion rates towards the east (Reiners et al., 2003), as well as a north-south gradient in temperatures and precipitation. Furthermore, repeated cycles of glaciation throughout the Quaternary have been a major component of erosion within the Cascades, especially in the Washington Cascades (Mitchell and Montgomery, 2006). This glacial influence prominently includes Cascades volcanoes, with glaciation being documented along the Cascades arc front as far south as ∼42°N latitude (e.g., Batchelor et al., 2019) and many stratovolcanoes still exhibiting alpine glaciation (Post et al., 1971).
3 Methods
Ramsey and Siebert (2017) compiled several decades of previous field reports to catalog ∼3,000 Quaternary vents in the U.S. Cascades, including the locations, morphologic classification of the associated edifice, bulk composition, and epoch age of last eruption of each vent. O’Hara et al. (2020) utilized this database to delineate 2,105 edifice boundaries from topography using a semi-autonomous algorithm.
3.1 Edifice morphology
Using 10 m-resolution DEMs from the National Elevation Dataset (U.S. Geological Survey, 2013), we isolate edifices by clipping topography around the boundaries previously defined by O’Hara et al. (2020). Afterwards, we collect common metrics associated with bulk edifice morphology (Grosse et al., 2014) for 1,658 edifices (Figure 2A; Supplementary Table S1). These include the planform area (
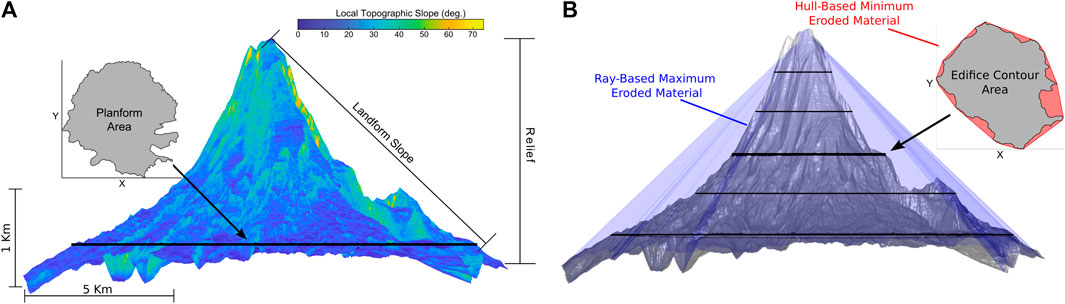
FIGURE 2. Description of morphology metrics collected for each edifice, using Mt. Adams (WA) for example. (A) Edifice relief, basal planform area, and slope of the entire landform; colors correspond to local topographic slope values. (B) Eroded volume estimate methodologies. Red text and inset describe contour-based eroded volume estimate using a convex-hull. Blue text and shading describe the ray-based eroded volume estimate.
3.2 Eroded volumes
Previous studies have reconstructed edifices and estimated eroded volumes by fitting general volcano shapes over intact, non-eroded surfaces (i.e., planèzes) (e.g., Mitchell and Lofi, 2008; Lahitte et al., 2012; Karátson et al., 2016; Dibacto et al., 2020). However, such methods require extensive knowledge of the edifice’s volcanic history, which is not known for every edifice in the Cascades. Furthermore, our analysis incorporates edifices with sizes that span a range of magnitudes over an entire arc, as opposed to volcano-specific scales explored previously. We thus estimate eroded volumes of the edifices using two simplified methods that attempt to correct for edifice incision and flank mass removal (Figure 2B).
The first method reconstructs the non-eroded edifice shape using a convex-hull approach. In this method, the edifice is divided into a series of elevation contours. Along each contour, the footprint of the edifice is expanded by smoothing concave sections of a polygon while keeping the outermost points stationary, resulting in a ‘convex hull’. Afterwards, the reconstructed edifice is generated by interpolating the new polygons for each contour as a surface. This method relies on closed elevation contours. As edifice topographic boundaries are often irregular and span multiple elevations (e.g., Bohnenstiehl et al., 2012), this method expands higher-elevation portions of the boundary vertically-downward to encapsulate lower edifice flanks with a closed contour.
The second method reconstructs the edifice as an approximate cone-like structure. First, the edifice’s volumetric centroid is determined in map view (Lerner et al., 2020). A series of rays are then projected from the centroid to the edifice boundary in 10° azimuthal bins. Along each ray, the location of highest topography is determined and a straight line is generated between the highest topography and boundary. This line is assumed to be the pre-eroded edifice flank. These flank points are then interpolated to derive the reconstructed edifice.
From both reconstruction methods, the eroded volume (
Of the 1,658 edifices analyzed for morphology, we estimate eroded volumes of 1,646 edifices using our automated reconstruction algorithms. The other 12 edifices that could not be adequately processed for eroded volumes had complex topography or planform areas less than 0.08 km2 (Figure 4A) such that grid resolution likely impacted the ability of our algorithms to reconstruct topography.
The methodology presented here and in O’Hara et al. (2020) provides a semi-automated workflow for quantifying erosion on volcanic edifices. This approach is not without drawbacks, as edifice identification algorithms often generate conservative boundaries that exclude lower edifice flanks (van Wees et al., 2021; Bertin et al., 2023). As discussed in the Supplemental text, our edifice reconstruction methods assume a single edifice landform that spans variably protracted construction phases and that erosion dominantly occurs post-edifice construction. These methods cannot reconstruct the evolution of total edifice relief, and do not distinguish post-eruptive erosion (e.g., glacial carving, channel incision) from co-eruptive mass wasting (removal of flank material during an eruption; e.g., 1980 Mt. St. Helens eruption). Figure 2 and Supplementary Figure S1 presents an example of the reconstruction methods and eroded volumes for Mt. Adams (WA). These algorithms generate edifice reconstructions that infill erosive features (i.e., valleys) from the current topography.
4 Results
4.1 Edifice morphology
Scoria cones and domes have the lowest mean planform area (∼0.5 km2 and 1.0 km2, respectively) and relief (∼10 m and 180 m, respectively), as expected for monogenetic landforms (Karlstrom et al., 2018) (Table 1; Figure 3). In comparison, shield and composite volcanoes have mean planform areas of ∼10 km2 and 9 km2, respectively, and relief of ∼390 m and 330 m, respectively. Of all of the edifice classifications, composite volcanoes have largest range of geometries, reflecting the variability of this classification to span from small composite cones to the well-known, major stratovolcanoes (e.g., Mt. St. Helens, Mt. Shasta, Mt. Rainier; Figures 3D,H).
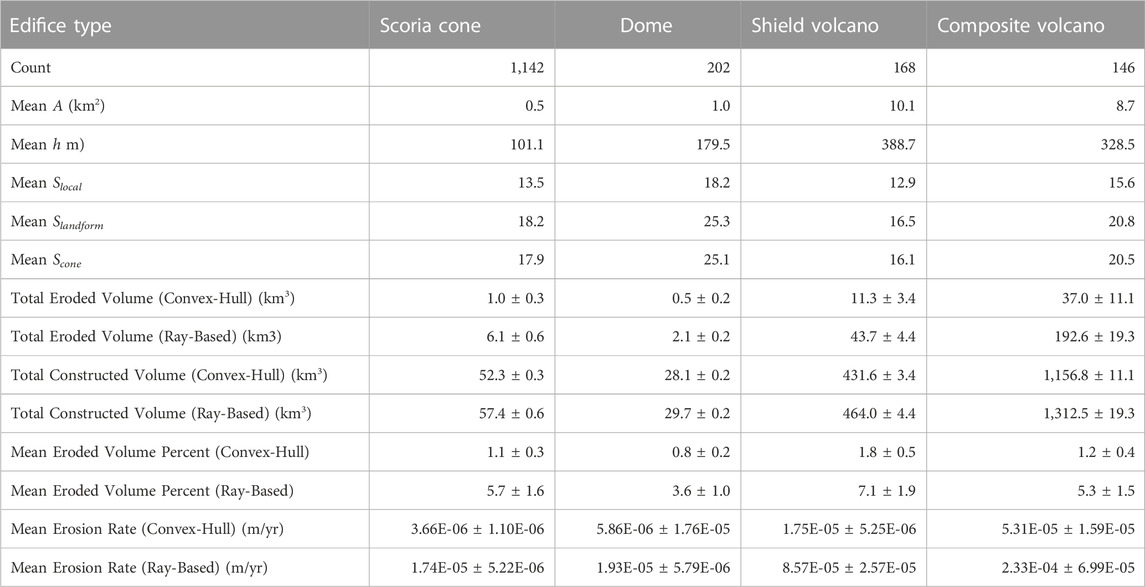
TABLE 1. Edifice morphology metrics and eroded volume estimates, arranged by classification. A is planform area, h is edifice relief, and S signifies slope. Edifice erosion rates are calculated by dividing eroded volumes by edifice planform area and mean age for each epoch designation (Holocene/Late Pleistocene = 0.05 Myr; Middle Pleistocene = 0.95 Myr; Early Pleistocene = 2.2 Myr); rates are then averaged over each morphologic classification.
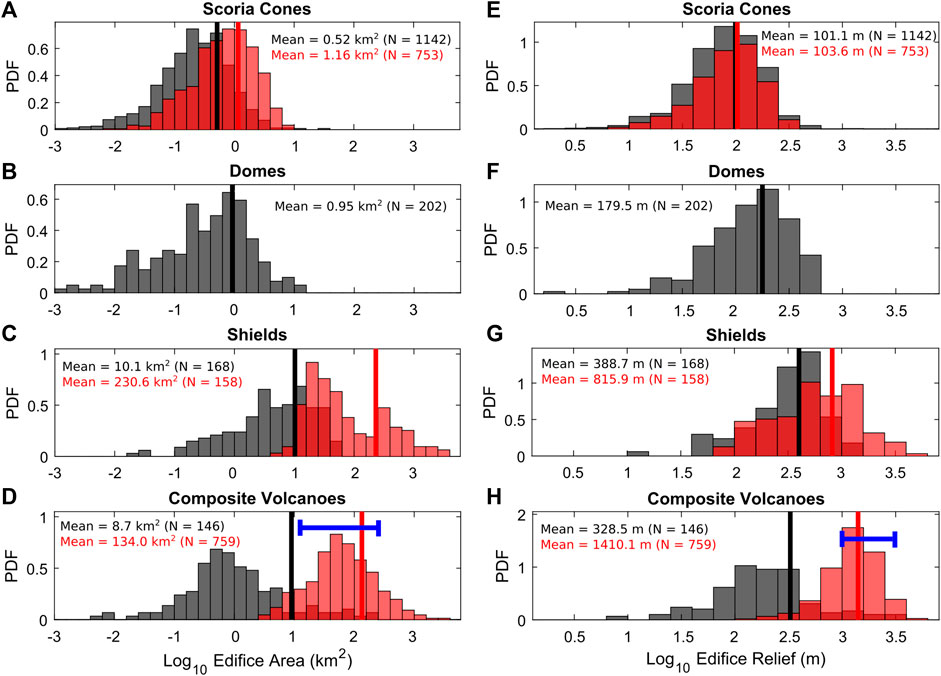
FIGURE 3. Edifice geometry Probability Density Functions (PDF) separated by morphologic type. (A–D): Edifice planform area. (E–H): Edifice relief. Solid lines represent mean geometry values. Gray bars are this study; red colors are previously-reported geometries for scoria cones (Karlstrom et al., 2018), shield volcanoes (Grosse and Kervyn, 2018), and composite volcanoes (Grosse et al., 2014). Blue lines in (D, H) represent edifice area and relief ranges of Cascades stratovolcanoes specifically.
Although mean planform areas differ ∼1–2 orders of magnitude between monogenetic and polygenetic edifices, relief is similar. This leads to differences in the mean slopes for each edifice classification (Table 1). Both landform slope and conical slope values (Supplementary Figure S3) follow expectations for each classification — shield volcanoes have the lowest mean landform slope (∼17°), domes have the highest mean landform slope (∼25°), and scoria cones and composite volcanoes have moderate mean landform slopes (∼18° and 21°, respectively). Differences likely reflect average eruption style and composition of each landform class (noting that intrusions also contribute to edifice form; Cosburn and Roy, 2020). Mean local slopes follow a similar trend, but are 3°–7° lower than the mean landform slopes, likely reflecting shallower gradients near edifice summits (e.g., craters) and lower flanks (Grosse et al., 2014; McGuire et al., 2014).
4.2 Edifice erosion
We find that between 50
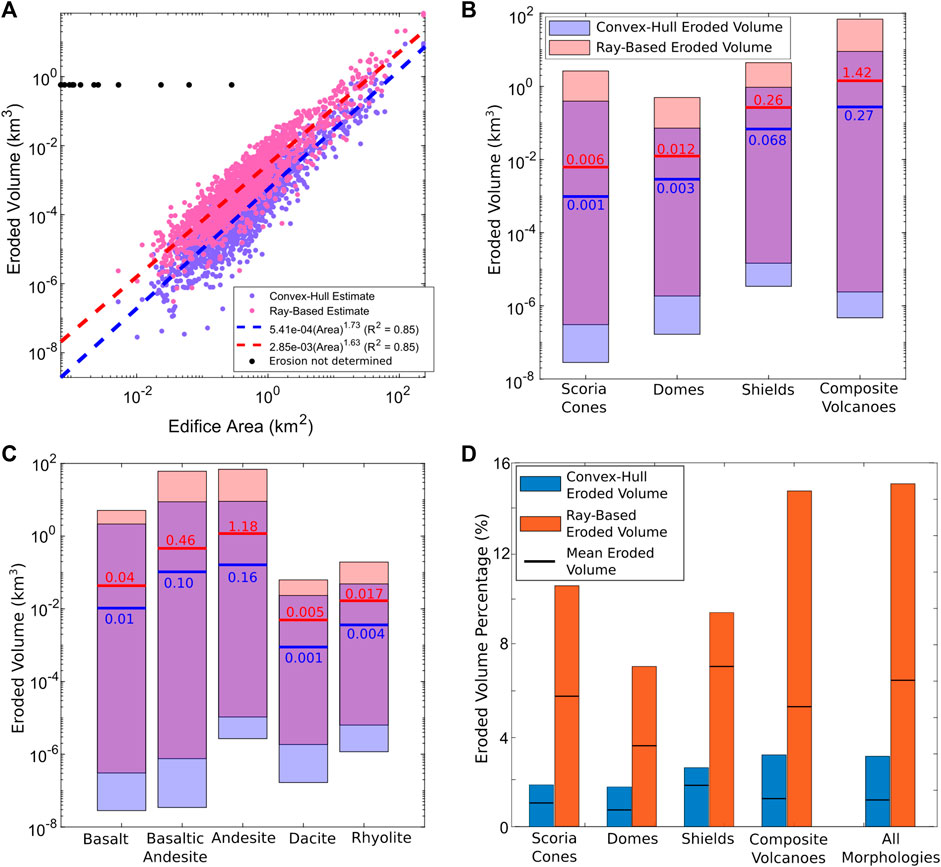
FIGURE 4. Estimated edifice eroded volumes. (A) Relationship between edifice area and eroded volume. Colors correspond to reconstruction method. Colored-dashed lines are power-law relationships. Black dots represent edifice areas that could not be adequately reconstructed. (B,C): Estimated eroded volume ranges (bars) and means (horizontal lines) for each (B) morphologic type and (C) composition. (D) Bar graph showing the cumulative convex-hull (blue bars) and ray-based (red bars) eroded volume estimates as a percentage of reconstructed edifice volume for each morphologic type. Bars represent the total volume budget (sum of all eroded volumes divided by the sum of all reconstructed volumes across the classifications) and lines represent mean erosion percentages (average values of eroded volume divided by reconstructed volume for each edifice).
The apparent increase in eroded volumes between edifice morphologies likely reflects primary edifice volumes rather than erosional efficiency. Figure 4D displays eroded volumes as percentages of reconstructed edifice volumes for each classification to remove possible bias associated with landform volume. Total eroded volume percentages range 2%–4% and 7%–15% for the convex-hull and ray-based reconstruction methods, respectively, with composite volcanoes having the highest total percentage. Mean eroded volume percentages vary between 0.8%–1.2% and 3.6%–7.1%. For both reconstruction methods, domes experience the lowest mean erosion percentages and shield volcanoes have the highest.
4.3 Spatial distribution of edifice erosion
A regional Quaternary landform and edifice erosion catalog allows us to evaluate the spatial distribution of volcanic output and erosion within the Cascades at 0.5° latitudinal bins. Figures 5A,B show the along-arc distributions of estimated eroded volumes and total reconstructed edifice volumes. Figure 5C shows eroded volume as percentages of reconstructed edifice volume.
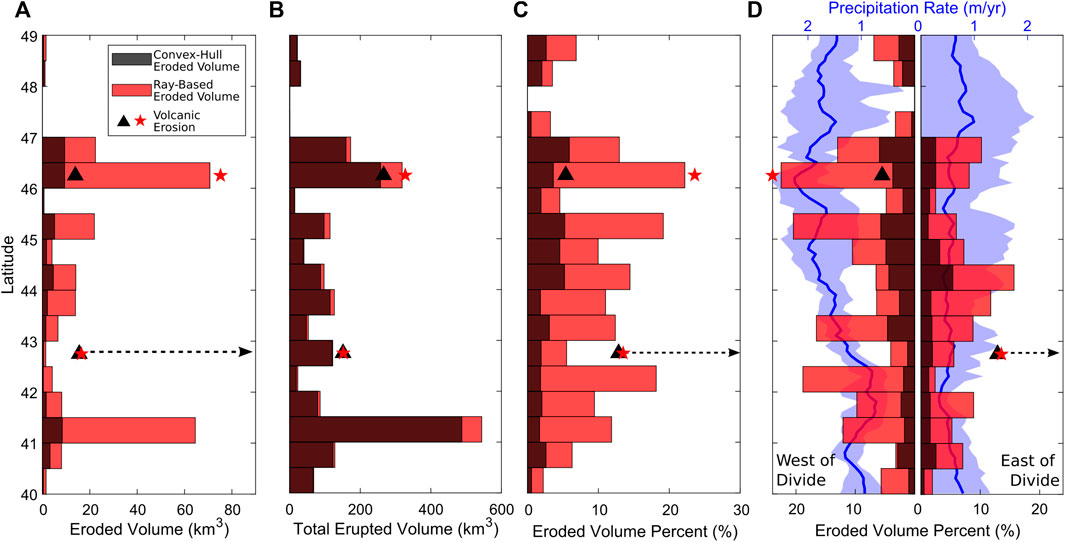
FIGURE 5. Along-arc spatial distribution of edifice eroded and total reconstructed volumes, in 0.5° latitudinal bins. (A) Convex-hull (black bars) and ray-based (red bars) estimated eroded volumes. (B) Total erupted volume based on edifice topography. (C) Edifice eroded volume as a percentage of the total erupted volume. (D) Edifice eroded volume percentages across the regional drainage divide. Black triangles (convex-hull estimations) and red stars (ray-based estimations) represent distribution values with the addition of erosion from eruptive process for Mt. Mazama and Mt. St. Helens, with black-dashed arrow ambiguity related to Mt. Mazama eroded volume (Bacon and Lanphere, 2006) (see Supplemental text). Blue shading in (D) represents along-arc precipitation rate ranges across the divide, blue lines are mean values.
The distribution of volume-normalized edifice erosion (Figure 5C) suggests apparent segmentation along the arc. The most northerly section (48–49°N) encompasses Mt. Baker and Glacier Peak, and has eroded volume percentages ranging 2%–7%. The segment between 46–47.5°N spans from Mt. Rainier southward to the Columbia River Gorge, and contains the highest erosion percentages, up to ∼22%. South of the Columbia River Gorge, erosion percentages exhibit a general southward decrease in values, from ∼19% at 45°N to ∼2% at 40°N. Although erosion percentages vary between bins, a noticeable break in this trend occurs at 42.5°N, the latitude corresponding to the location of Mt. Mazama (i.e., Crater Lake) which has a collapsed caldera and was thus excluded from both the morphology and erosion analysis. The break in erosion percentage at this location thus likely reflects the lack of eroded volume estimates, rather than additional segmentation (Guffanti and Weaver, 1988; Schmidt et al., 2008).
Figure 5D presents the along-arc distributions of eroded volume percentages split across the topographic divide. The same along-arc trends in eroded volume percentages can be observed, but there is a distinct east-west asymmetry, with eroded volume percentages 1.1x–7.9x higher on the western part of the arc than on the eastern.
4.4 Post-eruption edifice erosion rates
Although well-dated eruptive histories exist for only a fraction of Cascades volcanoes (Hildreth, 2007; Schmidt and Grunder, 2009; Wall et al., 2019), the last eruption of each vent in our Quaternary vent database is known at the epoch scale. Combining these data with our estimated eroded volumes allows for a first-order estimation of edifice erosion rates post-dating eruptive activity over the last ∼2.6 Myr (Supplemental text). Complex and perhaps non-monotonic construction-erosion histories of polygenetic edifices means that erosion occurring between active episodes cannot be accounted for. For example, flank instabilities in the form of lahars and dome collapses (Miller, 1980) help shape the morphology of edifices and derived basal contours, altering derived eroded volumes and erosion rate. However, with some exception (Grosse et al., 2022), individual eruptions or episodic flank collapses do not typically fully resurface edifices (Bacon, 2008). We therefore derive time-averaged edifice erosion rates by dividing eroded volume by the edifice’s planform area and mean age of the epoch associated with the most recent eruption (2.2 Myr for the Early Pleistocene, 0.95 Myr for the Middle Pleistocene, and 0.05 Myr for the Late Pleistocene and Holocene). Estimating erosion rates in this manner is an oversimplification, but appropriate given the highly-variable age constraints and the regional, arc-wide scope. Furthermore, we note that, incomplete geologic data notwithstanding, our erosion rates are comparable to more detailed studies in other continental arc settings (10–3–10–1 mm/yr; Karátson et al., 2012; Dibacto et al., 2020).
Supplementary Figures S4A, B shows the range and mean erosion rates for each edifice classification and vent composition. Across all volcanoes, mean erosion rates range in magnitude between 10–3–101 mm/yr. Similar to the eroded volume estimates (Figure 4B), there is an overall increase in mean erosion rates from monogenetic (10–3–10–2 mm/yr) to polygenetic edifices (10–2–10–1 mm/yr), topped by composite volcanoes. Separating erosion rates by composition suggest basaltic and andesitic edifices have higher mean rates (10–3–10–1 mm/yr) compared to dacitic and rhyolitic edifices (10–3–10–2 mm/yr). Being normalized by edifice basal area, the increase in erosion rate between classifications likely reflects thresholds in erosion processes such as drainage area (e.g., Montgomery and Dietrich, 1988); the differences in erosion rate between compositions may reflect variable primary rock reactivity, fracture density, or topographic roughness.
Calculating eroded volumes and time-averaged erosion rates based on the last known eruption of a volcano is most accurate for monogenetic edifices, which often form either through a single (sometimes years-long) event, or through multiple events on 0.1–1 kyr timescales (e.g., Inbar et al., 1994; Báez et al., 2017; Smith and Németh, 2017). Because monogenetic edifices are numerous throughout the arc, this provides an opportunity to quantify erosion through time at slightly higher temporal resolution. First, considering average monogenetic eroded volumes associated with each epoch (Supplementary Figure S4C), we find that eroded volumes follow the expected trend of increasing with time. However, this trend is non-monotonic, with a larger increase in eroded volume between the Holocene/Late Pleistocene and Middle Pleistocene than between the Middle and Late Pleistocene. Mean time-averaged monogenetic edifice erosion rates from each epoch (Supplementary Figure S4D) mirror this trend and show decreasing rates through time, with younger landforms (Holocene and Late Pleistocene) having time-averaged rates of 10–2–10–1 mm/yr and older edifices (Late Pleistocene) having time-averaged rates of 10–4–10–2 mm/yr. These trends match previous studies that suggest volcano erosion follow logarithmic relationships (e.g., McGuire et al., 2014; Bablon et al., 2020).
5 Discussion
5.1 Global- and regional-scale volcano landform distributions
A discrepancy between edifice morphologies occurs when comparing distributions of edifice planform areas and relief from our study to previously-published global datasets (Figure 3). Scoria cone and shield volcano relief distributions are similar to other studies (Grosse and Kervyn, 2018; Karlstrom et al., 2018); however, overall edifice planform area and relief distributions are one to two orders of magnitude smaller than those previously reported for other locations. Two possibilities exist to explain these differences between datasets. The first is that the edifice boundary identification algorithm used by O’Hara et al. (2020) (based on the Modified Basal Outlining Algorithm; Bohnenstiehl et al., 2012) creates more conservative boundaries than those used in the previous studies (e.g., NETVOLC; Euillades et al., 2013), which would thus lower both edifice planform areas and relief. However, a simple comparison between major stratovolcano geometries between this study and those reported by Grosse et al. (2014) shows that although our boundaries create lower morphometry values, they are generally within the same magnitude (Supplementary Table S2).
Rather, we argue that the differences between datasets highlight an important overestimation of global volcanic landform catalogs. Previously-reported global scoria cone morphologies compiled older studies from 7 volcanic fields that spanned a range of settings (Karlstrom et al., 2018), while shield and composite volcano morphology compilations (Grosse et al., 2014; Grosse and Kervyn, 2018) were dominantly derived from the Smithsonian Global Volcanism Program (Global Volcanism Program, 2013). This overestimation is most apparent with shield and composite volcano planform areas, where only the largest edifices of our database overlap with previously-reported data. This suggests these global studies are incomplete at the arc-scale, giving a biased interpretation towards larger edifices.
5.2 Regional climate coupled with volcanic topography
In the Pacific Northwest U.S., a latitudinal gradient in modern (30-year average) precipitation (Fick and Hijmans, 2017), correlated with spatial variations in average winter temperature (Ersek et al., 2012), aligns with the direction of the Cascades (Figure 5D; 6C). Precipitation also varies strongly in an across-arc direction due to the orographic effect, with paleoenvironment and exhumation analyses suggesting these patterns likely existed over 10-Myr timescales (Reiners et al., 2003; Bershaw et al., 2019). These precipitation gradients are reflected in reconstructed edifice volumes and erosional percentages. For example, Figures 6A,B plots convex-hull reconstructed volumes and eroded volume percentages, respectively, relative to precipitation rate as binned averages for each classification (Supplementary Figure S6 provides same figure for ray-based eroded volumes), demonstrating that reconstructed edifice volume and erosion correlate with precipitation (particularly for polygenetic edifices). Relationships between topography, erosion, volcanic vent distributions, and precipitation also occur spatially (Figure 7).
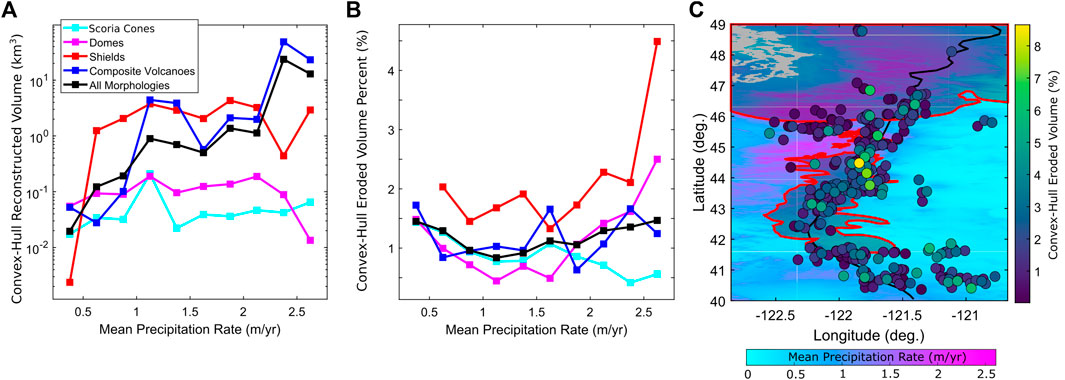
FIGURE 6. Comparison of edifice and climate data. (A,B): Convex-hull based (A) reconstructed volumes and (B) eroded volume percentages as function of mean precipitation rate for each edifice morphologic type, given as averaged bins in mean precipitation intervals of 0.25 m/yr. (C) Relationships between polygenetic volcano convex-hull eroded volume percentages (circles) and mean precipitation rate (background grid) in geographical reference frame with horizontal exaggeration. Black line represents regional drainage divide, light-gray shading and red lines denote estimated glacial extent during the Last Glacial Maximum (Ehlers et al., 2011; Watt et al., 2013; Crandell, 2015; Batchelor et al., 2019) (Supplementary Figure S8).
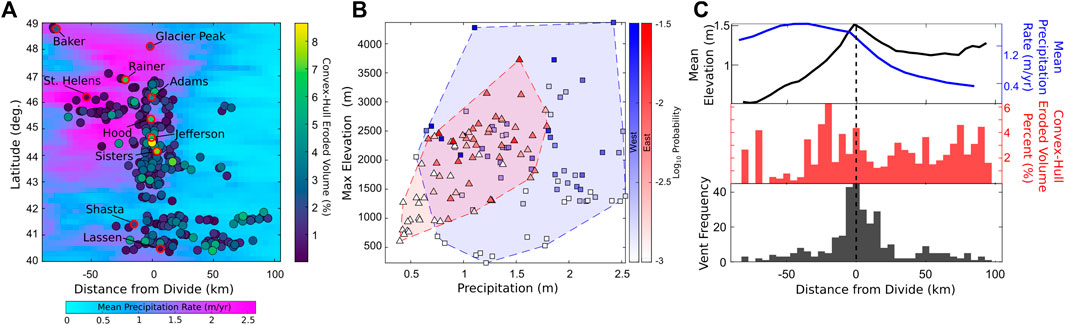
FIGURE 7. (A) Spatial relationships between volcanic edifice, eroded volumes, and climate data, showing polygenetic volcano convex-hull eroded volume percentages (colored circles) and mean precipitation rates (background grid) projected relative to distance from regional drainage divide. Red outlines denote major Cascades stratovolcanoes. (B) Comparison between precipitation, maximum elevation, and volume-weighted Gaussian kernel densities in 20 km bins east (red triangles) and west (blue squares) of the divide. Colored regions denote data extent between east and west. (C) Binned across-arc comparison of (lower panel) polygenetic vent frequency, (middle panel) polygenetic edifice convex-hull eroded volume percentages, and (upper panel) mean elevation (black line) and precipitation rate (blue line), relative to the arc axis (black-dashed line).
Our data show that significant asymmetry in edifice erosion across the divide mirrors a ∼2-fold difference in mean precipitation values (Figure 5D, blue lines) within the southern and central sections of the arc, suggesting a long-term influence of orographic precipitation on edifice morphology. Because the topographic divide collocates with the volcanic arc axis in all but the northern Cascades (Figures 1C,D), across-arc relationships between arc topography, precipitation, and erosion can be analyzed spatially by considering values relative to the divide (Figure 7).
Projecting precipitation rates, polygenetic edifice locations, and convex-hull eroded volume percentages in map-view relative to the divide (Figure 7A) demonstrates that the accumulated mass of volcanic edifices spatially controls precipitation patterns. This relationship is further highlighted by plotting maximum elevations, mean precipitation rates, and edifice volume-weighted Gaussian kernel densities in 20 km bins along both the eastern and western portions of the arc (Figure 7B). Our data suggest that topography, volcanic construction, and precipitation are well-correlated on the eastern part of the divide — higher volcanic vent densities correspond with both higher precipitation and topography. However, these relationships are not as clear in the west, with higher vent densities corresponding to higher elevations, but over a range of precipitation values.
Taking across-arc bins of composite volcano vent and eroded volume distributions, Figure 7C better resolves these relationships by showing that although the majority of Cascades composite volcanoes cluster around the divide (bottom panel, black bars) and correlate with topography (upper panel, black line), the highest average eroded volume percentages along the arc front are spatially offset towards the west of the divide by ∼20 km (middle panel, red bars). This offset also corresponds with the highest mean precipitation rates within the arc (upper panel, blue line), consistent with predictions of orographic precipitation (Smith et al., 2005) based on regional average atmospheric circulation patterns and topography (Supplemental text).
Edifice eroded volume percentages also increase with latitude (Figure 5C; Supplementary Figure S5), correlating with both higher precipitation rates as well as glaciation throughout the Quaternary (e.g., Batchelor et al., 2019) (Figure 5D; 6C). As evidenced by glacially-sculpted modern stratovolcano topography (e.g., Mt. Rainier, Mt. Washington, Sisters Volcano Complex), scattered volcanic landforms reflecting direct ice-magma interactions (e.g., tuyas in the central Oregon Cascades; Schmidt and Grunder, 2009) and moraine deposits (O’Connor et al., 2001), a significant fraction of volcano erosion during the Quaternary is glacial in origin. Last Glacial Maximum (LGM; ∼26.5–19 ka; Watt et al., 2013) ice is well constrained to have extended through the Washington Cascades with up to ∼1 km thickness (Siegert, 2001), but farther south is less certain. Figure 6C shows the cumulative extent of glaciation from previous reconstructions of the LGM (Supplemental text), indicating variably-focused glaciation on the arc axis through southern Oregon.
Similar to other arcs (e.g., George et al., 2016; Perkins et al., 2016), volcanic edifices correlate with long-wavelength topography in the Cascades (Figure 1D). This is expected based on magmatic intrusive-to-extrusive ratios (e.g., White et al., 2006) and implied by modern geophysical anomaly patterns (O’Hara et al., 2020). Given the relationships between edifice spatial distributions and crustal magmatic structure, as well as between eroded volume percentages and climate, we view Cascades edifices as proxy for the regional-scale interaction between erosion patterns and magmatism. Correlations shown in Figures 5D, 7 suggest two important relationships between arc-scale climate and volcanism. First, mountain building associated with magmatism controls across-arc precipitation gradients. Second, this across-arc precipitation gradient creates spatial asymmetry in surface erosion between the windward and leeward sides of the arc. Both of these relationships have been well-documented in other environments, including arcs (England and Molnar, 1990a; Ferrier et al., 2013; Muller et al., 2022), and can feed back mechanically on the shallow magma plumbing system, coupling climate and magmatism on long timescales.
Although it is not clear whether glacial erosion is distributed evenly across the arc axis, this suggests another mechanism for volcano-climate coupling, in which volcanism promotes glaciation that persists through glacial cycles by building high topography that can sustain glaciers. A type of glacier ‘buzz-saw’ effect (Mitchell and Montgomery, 2006), erosion by ice could limit the height of volcanic arc topography and account for increasing erosion rates at higher latitudes.
5.3 Long-term evolution of volcanic arc landscapes
Magmatic emplacement, edifice construction, and volcanic deposition proceed on a spectrum of time and spatial scales that differ from mountain building in purely tectonic settings (e.g., England and Molnar, 1990b). Indeed, volcanic terrains exhibit an inverted relationship between regional uplift and erosion (where intrusion-related uplift can be more localized than erosion; e.g., O’Hara et al., 2019), as well as anomalous river network structures (Sweeney and Roering, 2017) and hydrology (Jefferson et al., 2006; 2010), compared with other active landscapes.
Although current geomorphic transport laws cannot fully encapsulate all of the processes that occur within volcanic environments (e.g., Karátson et al., 2010), strong correlations observed in the Cascades between arc topography, precipitation, and edifice erosion suggest climate-driven long-term feedbacks that could help frame arc landscape evolution. Such feedbacks have been suggested in other orographic settings (e.g., Beaumont et al., 2001; Roe et al., 2003; Pelletier et al., 2010; Stalder et al., 2020; Val and Willenbring, 2022), but have not been explored where landscape evolution is largely driven by magmatic and volcanic processes. Paleoelevation data and the record of ancestral eruptions indicate high volcanic topography in the Cascades since 20–30 Ma (Bershaw et al., 2019), such that feedbacks may be generalizable to similarly long timescales.
5.3.1 Climate feedbacks on arc volcanism
In convergent settings, topography has been argued to encode the interplay between climate and tectonics (e.g., Beaumont et al., 2001; Willett, 2010; Fox et al., 2014; Schildgen and Hoke, 2018). In arcs, topographic form depends on the rate of magmatism relative to regional climatic and tectonic factors (Whipple and Meade, 2006; Perkins et al., 2016; Stalder et al., 2020). From the spatial distributions of both volcanic edifices and eroded edifice volumes, we hypothesize that long-term climate-volcanism coupling may influence patterns of magmatism. We focus on arc front migration as one possible outcome of this coupling (Karlstrom et al., 2014; Muller et al., 2022).
Volcanic arcs exhibit large-scale spatial migration of volcanic output on ∼10 Myr timescales, a phenomenon that has been attributed to slab dynamics (e.g., Dickinson and Snyder, 1978; Karátson and Timár, 2005; Phipps Morgan et al., 2008; Dibacto et al., 2020), magmatic crustal thickening (e.g., Karlstrom et al., 2014), and overriding plate tectonics (e.g., Wells and McCaffrey, 2013). If arc migration reflects pathways for magma ascent that are modulated by the stress state of the crust, it follows that time-evolving surface loads could influence crustal stresses and thus also play a role in directing arc migration.
Orographic precipitation driven by arc mountain building focuses erosion on the windward side of the arc front, and provides a means for such long-term modulation of surface loads. Models of landscape evolution in response to regional climate gradients suggest that non-uniform precipitation causes regional-scale divide migration towards drier regions (e.g., Roe et al., 2003; Goren et al., 2014; Muller et al., 2022) in orogenic settings. Similarly, topographic loading has been shown to influence underlying shallow crustal stresses and modify dike trajectories that guide volcanic vent locations and their migration towards the load through time (e.g., Kervyn et al., 2009; Rivalta et al., 2019).
We test the influence of evolving, climate-driven topographic loading on magmatic shallow dike propagation using a simplified coupled landscape evolution–crustal stress model. Below, we describe the model setup, results, and interpretation in regard to Cascades edifice erosion data.
5.3.2 Landscape evolution–crustal stress model
We develop a landscape evolution model to show the phenomenology of divide migration driven by magmatism and orographic precipitation. Topographic evolution or magmatic patterns of the Cascades are not addressed specifically, although we do use average characteristics of Cascades topography and modern precipitation in our calculations. Furthermore, we do not attempt to explicitly differentiate between surface growth driven by intrusive magma uplift and mantling by extrusive volcanic deposits, focusing of magma ascent within the crust (e.g., Karlstrom et al., 2009), or the time-variable nature of erodibility and hydrology in volcanic terrains (e.g., Jefferson et al., 2010). Our kinematic approach shows that this coupling between climate-driven topographic evolution and crustal stresses that guide shallow magma ascent is possible for a system resembling the Cascades.
The model (described fully in the Supplemental text) couples a 1D landscape evolution model (O’Hara et al., 2019) to a 2D crustal stress model (Styron and Hetland, 2015), with the mechanical feasibility of individual model components being demonstrated in prior studies (Maccaferri et al., 2010; Goren et al., 2014; Styron and Hetland, 2015; O’Hara et al., 2019). The Cascades are idealized as paired drainage basins separated by a hillslope domain. Model elevations (
where
We use a model domain of 80 km (approximate width of the Cascades arc front) and create an initial model topography as the steady-state solution with uniform precipitation and
5.3.3 Model results
The first phase of our model (Figure 8A; Supplementary Video V1) demonstrates how topography is constructed by a generalized zone of uplift associated with magmatism. These simulations assume parameters defining ‘Regime 3′in O’Hara et al. (2019), in which the uplift perturbation is significant compared to background uplift and the available stream power of the fluvial network. This uplift asymmetrically alters topography to generate steeper slopes (and thus higher erosion rates) windward of the perturbation, thus initiating divide migration towards the locus of magmatism (cf. O’Hara et al., 2019). The second phase (Figure 8B) shows how across-arc gradients in precipitation further drive divide migration. As has been demonstrated by previous studies, the divide migrates away from the wetter portion of the landscape (Bonnet, 2009; Goren et al., 2014; Muller et al., 2022). As localized magmatic uplift is still active in this phase, our model demonstrates that precipitation gradient effects can migrate the divide further eastward than the main locus of volcanic construction.
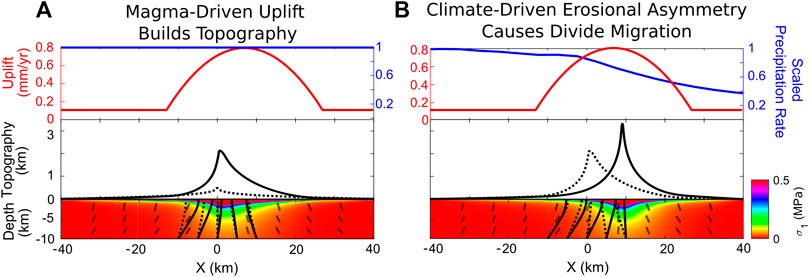
FIGURE 8. Landscape evolution model demonstrating coupling between climate, magmatism, and topographic evolution. Phases are (A) magma-driven uplift builds topography and (B) climate gradient causes erosional asymmetry that generates divide migration, modulating subsurface deviatoric stress trajectories. Upper panels show kinematic forcing functions (uplift and precipitation rates). Middle panels show instantaneous (solid black line) and reference (black-dashed line) topography of each stage. Lower panels show crustal stresses associated with topographic loading (Styron and Hetland, 2015). Colors are magnitude of maximum compression (
In both phases, we see that evolving topography modulates stress orientations and magnitudes in the shallow crust. Stress trajectories perpendicular to the least compressive principle stress axis imply dike propagation pathways (e.g., Anderson, 1951; Muller et al., 2001; Maccaferri et al., 2010; Rivalta et al., 2015) and our model shows that magma ascent is focused towards intrusive uplift (Figure 8A). As climate gradients drive asymmetric erosion and alter the magnitude of divide migration, the effect is mirrored in the subsurface (Figure 8B). This kinematic model demonstrates that climate-driven arc migration over 10s of km can occur on 10s of Myr timescale, similar to rates observed globally under other subduction conditions (Karlstrom et al., 2014). This mechanism may occur over even shorter timescales as well (Muller et al., 2022), likely depending on the relative magnitudes (and spatial distribution) of magmatic uplift and asymmetric orographic erosion.
We note that glaciation has also been proposed to influence magmatism independently, modulating surface loads on Milankovitch timescales to influence magma transport, crustal storage, and mantle melting (Jull and McKenzie, 1996; Jellinek et al., 2004; Hooper et al., 2011). In the Cascades, such inferences are complicated by an incomplete volcanic record (Watt et al., 2013) and low rates of magmatism compared to highly magmatic terrains such as Iceland (Jull and McKenzie, 1996) that exemplify glacio-volcanic coupling. However, because Quaternary glacial cycles in the Cascades are focused at high-elevations along the arc front, time-variable ice loading and erosion should further enhance the relationship between climate-driven asymmetric erosion, crustal loading, and magmatism proposed here.
5.4 How does climate influence volcanic arc migration?
Patterns of volcanic migration in the Cascades are largely consistent with tectonic block rotation of the Pacific Northwest relative to stable North America, which generates an extensional regime in the south and compressional regime in the north of the arc (Wells et al., 1998). Although geologically-inferred displacement vectors generally correspond with modern GPS velocities (McCaffrey et al., 2013), differences have been attributed to variable roll-back of the Juan de Fuca slab under North America and decoupling of upper plate deformation from underlying mantle (Wells and McCaffrey, 2013; Humphreys and Grunder, 2022). Superimposed on this and other geodynamical mechanisms would be contributions from climate to influence crustal magmatism and arc migration, but evidence for such surface influence does exist.
For example, eastward regional drainage divide migration, opposite the direction implied by tectonic rotation, has been suggested in the north Cascades through capture of the formerly eastward-flowing Skagit river by the windward side of the range (Simon-Labric et al., 2014). Muller et al. (2022), based on apparent westward vent migration of recent (<1 Ma) eruptive centers in this region, suggest that magma ascent pathways shift windward (west) in response to leeward (east) drainage divide migration implied by thermochronology. On the other hand, arc-scale Quaternary volcano data compiled here suggest the opposite direction of arc-front migration. Vents are concentrated leeward of the drainage divide on average (Figure 7C, black bars), while edifice erosion is consistently larger on the windward side (Figure 7C, red bars). Because volcanic topography largely defines the drainage divide in the U.S. Cascades (Figure 1), our data imply regional leeward migration of this divide.
On the basis of transcrustal visco-elasto-plastic numerical models of magma ascent, Muller et al. (2022) propose that deep and asymmetric faults flanking the arc are activated through asymmetric surface erosion, which can facilitate magma migration windward as well as leeward. Our model neglects deep structural control and instead approaches magma ascent as through isolated dikes, suggesting that leeward migration of topography alters stresses in the shallow crust to promote migration of magmatism in the same direction (Figure 8). The two approaches are different in significant ways.
Migration of vents is inferred based on asymmetry in visco-elasto-plastic fault patterns (assuming incompressible elasticity) in Muller et al. (2022), which arise from deep crustal deformation forced by asymmetric surface loading. This numerical approach is common to large-scale geodynamic models (e.g.; Keller et al., 2013). In contrast, our model imposes magmatic uplift kinematically, and vent migration is inferred on the basis of (compressible) elastic stress trajectories. This numerical approach is similar to geodetic modeling of active volcanoes (e.g., Anderson et al., 2015). Similarly, Muller et al. (2022) incorporated landscape evolution models that are initialized in a non-steady-state configuration and impose orographic precipitation as a function of surface slope alone. Our landscape evolution approach in contrast isolates parameters kinematically from initial steady-state solutions, which facilitates analysis but is challenging to apply to real landscapes. We see great potential in future studies to understand the impact of these approaches on the emergent feedbacks between magmatism and climate.
Quaternary arc-scale data assembled here seem to favor a leeward vent migration model. For example, despite having relief similar to the northern portion of the Cascades, across-arc precipitation gradients are steeper in the central Cascades. Within a 40-km band centered on the arc axis, precipitation decreases leeward across-arc by a factor of ∼2.5 in the central portion of the Cascades, spatially correlating to the highest amount of arc migration since the Early Miocene (Supplementary Figure S9). In comparison, the northern Cascades have ∼1.5x decrease in across-arc precipitation and lowest distance of arc migration. If modern precipitation rates are proxy for longer-term climate signals, this along-arc relationship between precipitation gradient strength and arc migration distance further supports our proposed feedbacks between climate and magmatism. However, further work may better establish a robust empirical basis for widespread windward migration and asymmetric faulting as proposed by Muller et al. (2022), and seen through the apparent migration of individual eruptive centers on ∼100 s kyr timescales (Hildreth, 2007).
6 Conclusion
Volcanic arcs represent natural laboratories to explore the long-term relationships between magmatism, climate, and topography. Using a database of Quaternary volcanism and satellite-derived modern topography in the Cascades, we analyzed edifice geometry distributions and spatial patterns of erosion throughout the 1000-km U.S. portion of the arc. Relating edifice spatial distributions and first-order eroded volumes to modern precipitation rates and past glacial extents, we find that although Quaternary volcanism aggregately builds topography and cluster around the main arc axis, erosion is highest ∼20 km west of the axis and follows a strong across-arc precipitation gradient.
Expanding on previous studies of divide migration and topographic influence of upper crustal magmatism, we propose a new coupling between climate and magmatism. Our results suggest that arc construction by volcanic activity builds a topographic barrier that generates precipitation gradients and drive divide migration by erosional asymmetry, which can feed back into the magma plumbing system through crustal loading. Numerical landscape evolution–crustal stress modeling demonstrates the feasibility of such feedbacks. Our results thus provide new avenues of exploration and testable hypotheses to better understand the long-term evolution of volcanic arcs in relation to climate factors.
Data availability statement
The original contributions presented in the study are included in the article/Supplementary Material. The code for the landscape evolution—crustal stress model is available on Github (https://github.com/danjohara/Landscape_Evolution_Crustal_Stress). Further inquiries can be directed to the corresponding author.
Author contributions
DO’H conducted the data collection and analyses, generated figures, and wrote the manuscript. LK advised on the project direction, edited the manuscript, and secured funds for the project. All authors contributed to the article and approved the submitted version.
Funding
NSF CAREER Grant 1848554, awarded to LK.
Acknowledgments
The authors wish to acknowledge discussion with J.J. Roering, N. Klema, and manuscript comments from M.A. Jellinek. Reviews by Karoly Nemeth and two reviewers were valuable and helped focus our presentation.
Conflict of interest
The authors declare that the research was conducted in the absence of any commercial or financial relationships that could be construed as a potential conflict of interest.
Publisher’s note
All claims expressed in this article are solely those of the authors and do not necessarily represent those of their affiliated organizations, or those of the publisher, the editors and the reviewers. Any product that may be evaluated in this article, or claim that may be made by its manufacturer, is not guaranteed or endorsed by the publisher.
Supplementary material
The Supplementary Material for this article can be found online at: https://www.frontiersin.org/articles/10.3389/feart.2023.1150760/full#supplementary-material
References
Anderson, K. R., Poland, M. P., Johnson, J. H., and Miklius, A. (2015). Episodic deflation–inflation events at kı lauea volcano and implications for the shallow magma system. Geophys. Monogr. Ser. 208, 229–250. doi:10.1002/9781118872079.ch11
Anderson, E. M. (1951). The dynamics of faulting and dyke formation with applications to Britain. Edinburgh: Hafner Publication Company.
Bablon, M., Quidelleur, X., Samaniego, P., Le Pennec, J. L., Santamaría, S., Liorzou, C., et al. (2020). Volcanic history reconstruction in northern Ecuador: Insights for eruptive and erosion rates on the whole Ecuadorian arc. Bull. Volcanol. 82, 11. doi:10.1007/s00445-019-1346-1
Bacon, C. R., and Lanphere, M. A. (2006). Eruptive history and geochronology of mount Mazama and the Crater Lake region, Oregon. Bull. Geol. Soc. Am. 118, 1331–1359. doi:10.1130/B25906.1
Bacon, C. R., Bruggman, P. E., Christiansen, R. L., Clynne, M. A., Donnelly-Nolan, J. M., and Hildreth, W. (1997). Primitive magmas at five Cascade volcanic fields: Melts from hot, heterogeneous sub-arc mantle. Can. Mineral. 35, 397–423.
Bacon, C. (2008). Geologic map of mount Mazama, Crater Lake, Oregon. US Geological Survey Scientific Investigations Map, 2832.
Báez, W., Carrasco Nuñez, G., Giordano, G., Viramonte, J. G., and Chiodi, A. (2017). Polycyclic scoria cones of the Antofagasta de la Sierra basin, Southern Puna plateau, Argentina. Geol. Soc. Spec. Publ. 446, 311–336. doi:10.1144/SP446.3
Batchelor, C. L., Margold, M., Krapp, M., Murton, D. K., Dalton, A. S., Gibbard, P. L., et al. (2019). The configuration of Northern Hemisphere ice sheets through the Quaternary. Nat. Commun. 10, 3713–3810. doi:10.1038/s41467-019-11601-2
Beaumont, C., Jamieson, R. A., Nguyen, M. H., and Lee, B. (2001). Himalayan tectonics explained by extrusion of a low-viscosity crustal channel coupled to focused surface denudation. Nature 414, 738–742. doi:10.1038/414738a
Bershaw, J., Cassel, E. J., Carlson, T. B., Streig, A. R., and Streck, M. J. (2019). Volcanic glass as a proxy for Cenozoic elevation and climate in the Cascade Mountains, Oregon, USA. J. Volcanol. Geotherm. Res. 381, 157–167. doi:10.1016/j.jvolgeores.2019.05.021
Bertin, D., de Silva, S. L., Lindsay, J. M., Cronin, S. J., Caffe, P. J., Connor, C. B., et al. (2023). Magmatic addition rates differentiate periods of steady-state versus flare-up magmatism in the Central Andean arc. Commun. Earth Environ. 4, 75–10. doi:10.1038/s43247-023-00744-2
Bohnenstiehl, D. W. R., Howell, J. K., White, S. M., and Hey, R. N. (2012). A modified basal outlining algorithm for identifying topographic highs from gridded elevation data, Part 1: Motivation and methods. Comput. Geosci. 49, 308–314. doi:10.1016/j.cageo.2012.04.024
Bonnet, S. (2009). Shrinking and splitting of drainage basins in orogenic landscapes from the migration of themain drainage divide. Nat. Geosci. 2, 766–771. doi:10.1038/ngeo666
Connor, C. B., Connor, L., Germa, A., Richardson, J., Bebbington, M., Gallant, E., et al. (2019). How to use kernel density estimation as a diagnostic and forecasting tool for distributed volcanic vents. Statistics Volcanol. 4, 1–25. doi:10.5038/2163-338x.4.3
Cosburn, K., and Roy, M. (2020). Analysing the topographic form of stratovolcanoes. J. Volcanol. Geotherm. Res. 407, 107123. doi:10.1016/j.jvolgeores.2020.107123
Crandell, D. R. (2015). “The glacial history of western Washington and Oregon,” in The quaternary of the United States. Editors H. E. J. Wright, and D. G. Frey (Princeton: Princeton University Press), 341–353.
Dibacto, S., Lahitte, P., Karátson, D., Hencz, M., Szakács, A., Biró, T., et al. (2020). Growth and erosion rates of the East Carpathians volcanoes constrained by numerical models: Tectonic and climatic implications. Geomorphology 368, 107352. doi:10.1016/j.geomorph.2020.107352
Dickinson, W. R., and Snyder, W. S. (1978). Plate tectonics of the Laramide orogeny. Mem. Geol. Soc. Am. 151, 355–366. doi:10.1130/MEM151-p355
Ehlers, J., Gibbard, P. L., and Hughes, P. D. (2011). Quaternary glaciations-extent and chronology: A closer look. Elsevier.
England, P., and Molnar, P. (1990a). Late cenozoic uplift of mountain ranges and global climate change: Chicken or egg? Nature 346, 29–34. doi:10.1038/346029a0
England, P., and Molnar, P. (1990b). Surface uplift, uplift of rocks, and exhumation of rocks. Geology 18, 1173–1177. doi:10.1130/0091-7613(1990)018<1173:suuora>2.3.co;2
Ersek, V., Clark, P. U., Mix, A. C., Cheng, H., and Lawrence Edwards, R. (2012). Holocene winter climate variability in mid-latitude Western North America. Nat. Commun. 3, 1219. doi:10.1038/ncomms2222
Euillades, L. D., Grosse, P., and Euillades, P. A. (2013). Netvolc: An algorithm for automatic delimitation of volcano edifice boundaries using DEMs. Comput. Geosciences 56, 151–160. doi:10.1016/j.cageo.2013.03.011
Ferrier, K. L., Huppert, K. L., and Perron, J. T. (2013). Climatic control of bedrock river incision. Nature 496, 206–209. doi:10.1038/nature11982
Fick, S. E., and Hijmans, R. J. (2017). Worldclim 2: New 1-km spatial resolution climate surfaces for global land areas. Int. J. Climatol. 37, 4302–4315. doi:10.1002/joc.5086
Fleck, R. J., Hagstrum, J. T., Calvert, A. T., Evarts, R. C., and Conrey, R. M. (2014). 40Ar/39Ar geochronology, paleomagnetism, and evolution of the boring volcanic field, Oregon and Washington, USA. Geosphere 10, 1283–1314. doi:10.1130/GES00985.1
Fox, M., Goren, L., May, D. A., and Willett, S. D. (2014). Inversion of fluvial channels for paleorock uplift rates in Taiwan. J. Geophys. Res. Earth Surf. 119, 1853–1875. doi:10.1002/2014JF003196
George, O. A., Malservisi, R., Govers, R., Connor, C. B., and Connor, L. J. (2016). Is uplift of volcano clusters in the tohoku volcanic arc, Japan, driven by magma accumulation in hot zones? A geodynamic modeling study. J. Geophys. Res. Solid Earth 121, 4780–4796. doi:10.1002/2016JB012833
Germa, A., Perry, C., Quidelleur, X., Calvert, A., Clynne, M., Connor, C. B., et al. (2019). Temporal relationship between the Lassen volcanic center and mafic regional volcanism. Bull. Volcanol. 81, 38. doi:10.1007/s00445-019-1296-7
Global Volcanism Program (2013). Volcanoes of the world. v. 4.10.5. Smithsonian Institution. (27 Jan 2022).
Goren, L., Willett, S. D., Herman, F., and Braun, J. (2014). Coupled numerical-analytical approach to landscape evolution modeling. Earth Surf. Process. Landforms 39, 522–545. doi:10.1002/esp.3514
Grosse, P., and Kervyn, M. (2018). Morphometry of terrestrial shield volcanoes. Geomorphology 304, 1–14. doi:10.1016/j.geomorph.2017.12.017
Grosse, P., Euillades, P. A., Euillades, L. D., and van Wyk de Vries, B. (2014). A global database of composite volcano morphometry. Bull. Volcanol. 76, 784–816. doi:10.1007/s00445-013-0784-4
Grosse, P., Ochi Ramacciotti, M. L., Escalante Fochi, F., Guzmán, S., Orihashi, Y., and Sumino, H. (2020). Geomorphology, morphometry, spatial distribution and ages of mafic monogenetic volcanoes of the Peinado and Incahuasi fields, southernmost Central Volcanic Zone of the Andes. J. Volcanol. Geotherm. Res. 401, 106966. doi:10.1016/j.jvolgeores.2020.106966
Grosse, P., Danišík, M., Apaza, F. D., Guzmán, S. R., Lahitte, P., Quidelleur, X., et al. (2022). Holocene collapse of Socompa volcano and pre- and post-collapse growth rates constrained by multi-system geochronology. Bull. Volcanol. 84, 85. doi:10.1007/s00445-022-01594-0
Guffanti, M., and Weaver, C. S. (1988). Distribution of late Cenozoic volcanic vents in the Cascade Range: Volcanic arc segmentation and regional tectonic considerations. J. Geophys. Res. Solid Earth 93, 6513–6529. doi:10.1029/JB093iB06p06513
Head, J. W., and Wilson, L. (2022). Planetary volcanology: Progress, problems, and opportunities. Bull. Volcanol. 84, 23–10. doi:10.1007/s00445-022-01527-x
Hieronymus, C. F., and Bercovici, D. (2001). A theoretical model of hotspot volcanism: Control on volcanic spacing and patterns via magma dynamics and lithospheric stresses. J. Geophys. Res. Solid Earth 106, 683–702. doi:10.1029/2000jb900355
Hildreth, W. (2007). Quaternary magmatism in the Cascades - geologic perspectives. US Geological Survey Professional Paper, 1–125. doi:10.3133/pp1744
Hooper, A., Ófeigsson, B., Sigmundsson, F., Lund, B., Einarsson, P., Geirsson, H., et al. (2011). Increased capture of magma in the crust promoted by ice-cap retreat in Iceland. Nat. Geosci. 4, 783–786. doi:10.1038/ngeo1269
Humphreys, E. D., and Grunder, A. L. (2022). Tectonic controls on the origin and segmentation of the Cascade Arc, USA. Bull. Volcanol. 84, 102–113. doi:10.1007/s00445-022-01611-2
Inbar, M., Hubp, J. L., and Ruiz, L. V. (1994). The geomorphological evolution of the Paricutin cone and lava flows, Mexico, 1943–1990. Geomorphology 9, 57–76. doi:10.1016/0169-555X(94)90031-0
Jefferson, A., Grant, G., and Rose, T. (2006). Influence of volcanic history on groundwater patterns on the west slope of the Oregon High Cascades. Water Resour. Res. 42, 1–15. doi:10.1029/2005WR004812
Jefferson, A., Grant, G. E., Lewis, S. L., and Lancaster, S. T. (2010). Coevolution of hydrology and topography on a basalt landscape in the Oregon Cascade Range, USA. Earth Surf. Process. Landforms 35, 803–816. doi:10.1002/esp.1976
Jellinek, A. M., Manga, M., and Saar, M. O. (2004). Did melting glaciers cause volcanic eruptions in eastern California? Probing the mechanics of dike formation. J. Geophys. Res. Solid Earth 109, 1–10. doi:10.1029/2004JB002978
Jull, M., and McKenzie, D. (1996). The effect of deglaciation on mantle melting beneath Iceland. J. Geophys. Res. 101, 21815–21828. doi:10.1029/96jb01308
Karátson, D., and Timár, G. (2005). Comparative volumetric calculations of two segments of the Carpathian Neogene/Quaternary volcanic chain using SRTM elevation data: Implications for erosion and magma output rates. Z. fur Geomorphol. Suppl. 140, 19–35.
Karátson, D., Favalli, M., Tarquini, S., Fornaciai, A., and Wörner, G. (2010). The regular shape of stratovolcanoes: A DEM-based morphometrical approach. J. Volcanol. Geotherm. Res. 193, 171–181. doi:10.1016/j.jvolgeores.2010.03.012
Karátson, D., Telbisz, T., and Wörner, G. (2012). Erosion rates and erosion patterns of neogene to quaternary stratovolcanoes in the western cordillera of the central andes: An SRTM DEM based analysis. Geomorphology 139–140, 122–135. doi:10.1016/j.geomorph.2011.10.010
Karátson, D., Yepes, J., Favalli, M., Rodríguez-Peces, M. J., and Fornaciai, A. (2016). Reconstructing eroded paleovolcanoes on Gran Canaria, Canary Islands, using advanced geomorphometry. Geomorphology 253, 123–134. doi:10.1016/j.geomorph.2015.10.004
Karlstrom, L., Dufek, J., and Manga, M. (2009). Organization of volcanic plumbing through magmatic lensing by magma chambers and volcanic loads. J. Geophys. Res. Solid Earth 114, B10204–B10216. doi:10.1029/2009JB006339
Karlstrom, L., Lee, C. T. A., and Manga, M. (2014). The role of magmatically driven lithospheric thickening on arc front migration. Geochem. Geophys. Geosyst. 15, 2655–2675. doi:10.1002/2014GC005355
Karlstrom, L., Wright, H. M., and Bacon, C. R. (2015). The effect of pressurized magma chamber growth on melt migration and pre-caldera vent locations through time at Mount Mazama, Crater Lake, Oregon. Earth Planet. Sci. Lett. 412, 209–219. doi:10.1016/j.epsl.2014.12.001
Karlstrom, L., Richardson, P. W., O’Hara, D., and Ebmeier, S. K. (2018). Magmatic landscape construction. J. Geophys. Res. Earth Surf. 123, 1710–1730. doi:10.1029/2017JF004369
Keller, T., May, D. A., and Kaus, B. J. P. (2013). Numerical modelling of magma dynamics coupled to tectonic deformation of lithosphere and crust. Geophys. J. Int. 195, 1406–1442. doi:10.1093/gji/ggt306
Kervyn, M., Ernst, G. G. J., van Wyk de Vries, B., Mathieu, L., and Jacobs, P. (2009). Volcano load control on dyke propagation and vent distribution: Insights from analogue modeling. J. Geophys. Res. 114, B03401. doi:10.1029/2008jb005653
Lahitte, P., Samper, A., and Quidelleur, X. (2012). DEM-based reconstruction of southern Basse-Terre volcanoes (Guadeloupe archipelago, FWI): Contribution to the Lesser Antilles Arc construction rates and magma production. Geomorphology 136, 148–164. doi:10.1016/j.geomorph.2011.04.008
Lee, C. A., Thurner, S., Paterson, S., and Cao, W. (2015). The rise and fall of continental arcs: Interplays between magmatism, uplift, weathering, and climate. Earth Planet. Sci. Lett. 425, 105–119. doi:10.1016/j.epsl.2015.05.045
Lerner, A. H., O’Hara, D., Karlstrom, L., Ebmeier, S. K., Anderson, K. R., and Hurwitz, S. (2020). The prevalence and significance of offset magma reservoirs at arc volcanoes. Geophys. Res. Lett. 47. doi:10.1029/2020GL087856
Maccaferri, F., Bonafede, M., and Rivalta, E. (2010). A numerical model of dyke propagation in layered elastic media. Geophys. J. Int. 180, 1107–1123. doi:10.1111/j.1365-246X.2009.04495.x
Martin, A. J., Umeda, K., Connor, C. B., Weller, J. N., Zhao, D., and Takahashi, M. (2004). Modeling long-term volcanic hazards through Bayesian inference: An example from the Tohoku volcanic arc, Japan. J. Geophys. Res. Solid Earth 109, 1–20. doi:10.1029/2004JB003201
McCaffrey, R., King, R. W., Payne, S. J., and Lancaster, M. (2013). Active tectonics of northwestern U.S. inferred from GPS-derived surface velocities. J. Geophys. Res. Solid Earth 118, 709–723. doi:10.1029/2012JB009473
McGuire, L. A., Pelletier, J. D., and Roering, J. J. (2014). Development of topographic asymmetry: Insights from dated cinder cones in the Western United States. J. Geophys. Res. Earth Surf. 119, 1725–1750. doi:10.1002/2014JF003081
Miller, C. D. (1980). Potential hazards from future eruptions in the vicinity of Mount Shasta volcano, northern California. U.S. Government Printing Office.
Mitchell, N. C., and Lofi, J. (2008). Submarine and subaerial erosion of volcanic landscapes: Comparing Pacific Ocean seamounts with valencia seamount, exposed during the Messinian salinity crisis. Basin Res. 20, 489–502. doi:10.1111/j.1365-2117.2008.00355.x
Mitchell, S. G., and Montgomery, D. R. (2006). Influence of a glacial buzzsaw on the height and morphology of the Cascade Range in central Washington State, USA. Quat. Res. 65, 96–107. doi:10.1016/j.yqres.2005.08.018
Montgomery, D. R., and Dietrich, W. E. (1988). Where do channels begin? Nature 336, 232–234. doi:10.1038/336232a0
Moon, S., Shelef, E., and Hilley, G. E. (2015). Recent topographic evolution and erosion of the deglaciated Washington Cascades inferred from a stochastic landscape evolution model. J. Geophys. Res. Earth Surf. 120, 856–876. doi:10.1002/2014JF003387
Muller, J. R., Ito, G., and Martel, S. J. (2001). Effects of volcano loading on dike propagation in an elastic half-space. J. Geophys. Res. Solid Earth 106, 11101–11113. doi:10.1029/2000jb900461
Muller, V. A. P., Sternai, P., Sue, C., Simon-Labric, T., and Valla, P. G. (2022). Climatic control on the location of continental volcanic arcs. Sci. Rep. 12, 22167–22213. doi:10.1038/s41598-022-26158-2
O’Connor, J. E., Hardison, J. H., and Costa, J. E. (2001). Debris flows from failures of neoglacial-age moraine dams in the Three Sisters and Mount Jefferson wilderness areas, Oregon. US Geological Survey Professional Paper, 1–93.
O’Hara, D., Karlstrom, L., and Roering, J. J. (2019). Distributed landscape response to localized uplift and the fragility of steady states. Earth Planet. Sci. Lett. 506, 243–254. doi:10.1016/j.epsl.2018.11.006
O’Hara, D., Karlstrom, L., and Ramsey, D. W. (2020). Time-evolving surface and subsurface signatures of Quaternary volcanism in the Cascades arc. Geology 49, 1088–1093. doi:10.1130/g47706.1
Pearce, J. A., and Peate, D. W. (1995). Tectonic implications of the composition of volcanic arc magmas. Annu. Rev. Earth Planet. Sci. 23, 251–285. doi:10.1146/annurev.ea.23.050195.001343
Pelletier, J. D., DeCelles, P. G., and Zandt, G. (2010). Relationships among climate, erosion, topography, and delamination in the andes: A numerical modeling investigation. Geology 38, 259–262. doi:10.1130/G30755.1
Perkins, J. P., Ward, K. M., De Silva, S. L., Zandt, G., Beck, S. L., and Finnegan, N. J. (2016). Surface uplift in the central andes driven by growth of the altiplano puna magma body. Nat. Commun. 7, 13185–13210. doi:10.1038/ncomms13185
Phipps Morgan, J., Ranero, C. R., and Vannucchi, P. (2008). Intra-arc extension in Central America: Links between plate motions, tectonics, volcanism, and geochemistry. Earth Planet. Sci. Lett. 272, 365–371. doi:10.1016/j.epsl.2008.05.004
Post, A., Richardson, D., Tangborn, W. V., and Rosselot, F. L. (1971). Inventory of glaciers in the North Cascades. Washington: Government Printing Office.
Ramsey, D. W., and Siebert, L. (2017). “Spatial and temporal database compilation of Holocene volcanic vents in the western conterminous United States,” in IAVCEI scientific assembly abstracts.
Reiners, P. W., Ehlers, T. A., Mitchell, S. G., and Montgomery, D. R. (2003). Coupled spatial variations in precipitation and long-term erosion rates across the Washington Cascades. Nature 426, 645–647. doi:10.1038/nature02111
Rivalta, E., Taisne, B., Bunger, A. P., and Katz, R. F. (2015). A review of mechanical models of dike propagation: Schools of thought, results and future directions. Tectonophysics 638, 1–42. doi:10.1016/j.tecto.2014.10.003
Rivalta, E., Corbi, F., Passarelli, L., Acocella, V., Davis, T., and Di Vito, M. A. (2019). Stress inversions to forecast magma pathways and eruptive vent location. Sci. Adv. 5, eaau9784–12. doi:10.1126/sciadv.aau9784
Roe, G. H., Montgomery, D. R., and Hallet, B. (2003). Orographic precipitation and the relief of mountain ranges. J. Geophys. Res. Solid Earth 108. doi:10.1029/2001jb001521
Schildgen, T. F., and Hoke, G. D. (2018). The topographic evolution of the central andes. Elements 14, 231–236. doi:10.2138/gselements.14.4.231
Schmidt, M. E., and Grunder, A. L. (2009). The evolution of north sister: a volcano shaped by extension and ice in the central Oregon cascade arc. Bull. Geol. Soc. Am. 121, 643–662. doi:10.1130/B26442.1
Schmidt, M. E., Grunder, A. L., and Rowe, M. C. (2008). Segmentation of the Cascade Arc as indicated by Sr and Nd isotopic variation among diverse primitive basalts. Earth Planet. Sci. Lett. 266, 166–181. doi:10.1016/j.epsl.2007.11.013
Sherrod, D. R., and Smith, J. G. (1990). Quaternary extrusion rates of the Cascade Range, northwestern United States and southern British Columbia. J. Geophys. Res. 95, 19465–20103. doi:10.1029/jb095ib12p19465
Siegert, M. J. (2001). Ice sheets and late quaternary environmental change. John Wiley & Sons, Inc, 248. doi:10.1046/j.1365-2451.2002.03437.x
Simon-Labric, T., Brocard, G. Y., Teyssier, C., van der Beek, P. A., Reiners, P. W., Shuster, D. L., et al. (2014). Low-temperature thermochronologic signature of range-divide migration and breaching in the North Cascades. Lithosphere 6, 473–482. doi:10.1130/L382.1
Smith, I. E. M., and Németh, K. (2017). Source to surface model of monogenetic volcanism: A critical review. Geol. Soc. Spec. Publ. 446, 1–28. doi:10.1144/SP446.14
Smith, R. B., Barstad, I., and Bonneau, L. (2005). Orographic precipitation and Oregon’s climate transition. J. Atmos. Sci. 62, 177–191. doi:10.1175/JAS-3376.1
Stalder, N. F., Herman, F., Fellin, M. G., Coutand, I., Aguilar, G., Reiners, P. W., et al. (2020). The relationships between tectonics, climate and exhumation in the Central Andes (18–36°S): Evidence from low-temperature thermochronology. Earth-Science Rev. 210, 103276. doi:10.1016/j.earscirev.2020.103276
Styron, R. H., and Hetland, E. A. (2015). The weight of the mountains: Constraints on tectonic stress, friction, and fluid pressure in the 2008 Wenchuan earthquake from estimates of topographic loading. J. Geophys. Res. Solid Earth 120, 2697–2716. doi:10.1002/2014JB011338
Sweeney, K. E., and Roering, J. J. (2017). Rapid fluvial incision of a late Holocene lava flow: Insights from LiDAR, alluvial stratigraphy, and numerical modeling. Bull. Geol. Soc. Am. 129, 500–512. doi:10.1130/B31537.1
Till, C. B., Kent, A. J. R., Abers, G. A., Janiszewski, H. A., Gaherty, J. B., and Pitcher, B. W. (2019). The causes of spatiotemporal variations in erupted fluxes and compositions along a volcanic arc. Nat. Commun. 10, 1350. doi:10.1038/s41467-019-09113-0
U.S. Geological Survey (2013). The national elevation dataset. Available at: https://www.sciencebase.gov/catalog/item/505a61cde4b0c8380cd71b8d.
Val, P., and Willenbring, J. K. (2022). Across-strike asymmetry of the Andes orogen linked to the age and geometry of the Nazca plate. Geology 50, 1341–1345. doi:10.1130/G50545.1
van Wees, R. M. J., Tournigand, P.-Y., O’Hara, D., Grosse, P., Kereszturi, G., Campforts, B., et al. (2021). “The role of erosion in the morphometry of composite volcanoes,” in EGU general assembly conference abstracts, EGU21–14500.
Vogt, P. R. (1974). Volcano spacing, fractures, and thickness of the lithosphere. Earth Planet. Sci. Lett. 21, 235–252. doi:10.1016/0012-821X(74)90159-9
Völker, D., Kutterolf, S., and Wehrmann, H. (2011). Comparative mass balance of volcanic edifices at the southern volcanic zone of the Andes between 33°S and 46°S. J. Volcanol. Geotherm. Res. 205, 114–129. doi:10.1016/j.jvolgeores.2011.03.011
Wall, K. T., Grunder, A. L., Miggins, D. P., and Coble, M. A. (2019). “Multistage growth and compositional change at the Goat Rocks volcanic complex, a major Pliocene–Pleistocene andesite center in the southern Washington Cascades,” in Field Volcanology: A tribute to the distinguished career of don swanson, 63–91.
Watt, S. F. L., Pyle, D. M., and Mather, T. A. (2013). The volcanic response to deglaciation: Evidence from glaciated arcs and a reassessment of global eruption records. Earth-Science Rev. 122, 77–102. doi:10.1016/j.earscirev.2013.03.007
Wells, R. E., and McCaffrey, R. (2013). Steady rotation of the Cascade arc. Geology 41, 1027–1030. doi:10.1130/G34514.1
Wells, R. E. R. E., Weaver, C. S., and Blakely, R. J. (1998). Fore-arc migration in Cascadia and its neotectonic significance. Geology 26, 759–762. doi:10.1130/0091-7613(1998)026<0759:FAMICA>2.3.CO;2
Whipple, K. X., and Meade, B. J. (2006). Orogen response to changes in climatic and tectonic forcing. Earth Planet. Sci. Lett. 243, 218–228. doi:10.1016/j.epsl.2005.12.022
Whipple, K. X., and Tucker, G. E. (1999). Dynamics of the stream-power river incision model: Implications for height limits of mountain ranges, landscape response timescales, and research needs. J. Geophys. Res. Solid Earth 104, 17661–17674. doi:10.1029/1999jb900120
White, S. M., Crisp, J. A., and Spera, F. J. (2006). Long-term volumetric eruption rates and magma budgets. Geochem. Geophys. Geosystems 7. doi:10.1029/2005GC001002
Keywords: Cascades arc, divide migration, volcano morphology, landscape erosion, volcano-climate interaction
Citation: O’Hara D and Karlstrom L (2023) The arc-scale spatial distribution of volcano erosion implies coupled magmatism and regional climate in the Cascades arc, United States. Front. Earth Sci. 11:1150760. doi: 10.3389/feart.2023.1150760
Received: 24 January 2023; Accepted: 08 June 2023;
Published: 19 June 2023.
Edited by:
Luis E. Lara, Austral University of Chile, ChileReviewed by:
Daniel Bertin, The University of Auckland, New ZealandAlexandru Szakács, Institute of Geodynamics, Romanian Academy, Romania
Copyright © 2023 O’Hara and Karlstrom. This is an open-access article distributed under the terms of the Creative Commons Attribution License (CC BY). The use, distribution or reproduction in other forums is permitted, provided the original author(s) and the copyright owner(s) are credited and that the original publication in this journal is cited, in accordance with accepted academic practice. No use, distribution or reproduction is permitted which does not comply with these terms.
*Correspondence: D. O’Hara, RGFuaWVsLk9IYXJhQHZ1Yi5iZQ==