 Jin Xu
 Fan Ping
 Jian Yang Li3
95% of researchers rate our articles as excellent or good
Learn more about the work of our research integrity team to safeguard the quality of each article we publish.
Find out more
ORIGINAL RESEARCH article
Front. Earth Sci. , 19 June 2023
Sec. Atmospheric Science
Volume 11 - 2023 | https://doi.org/10.3389/feart.2023.1149856
This article is part of the Research Topic Extreme Precipitation in Arid Regions: Observation, Mechanisms, and Simulations View all 9 articles
A cloud-resolved numerical simulation was carried out for an extreme rainfall case in Yan’an, a city in arid and semi-arid regions in northwest China, on 3–4 September 2021, by using Mesoscale Weather Research and Forecasting Model. The Auto Weather Station and Doppler radar were applied to verify simulated results. The characteristics of mesoscale cloud environment and cloud microphysical processes were analyzed. Then, the quantitative rainwater mass budget and latent heat budget of microphysical conversions about water condensates calculated in Yan’an. The possible mechanism by which cloud microphysics affected the rainstorm was investigated and discussed. It was found that: (1) There was positive feedback between mesoscale cloud environment and cloud microphysical processes, especially diabatic heating processes due to ice phase particles conversions. (2) The process of snow conversions processes was the most important process of this heavy rainfall in Yan’an. It not only promoted the production of rain, but also contributed to the enhancement of updraft through latent heat release and produced positive feedback to other microphysical processes in cloud. (3) Heavy rainfall in arid regions of China is mostly cold-type precipitation, mainly manifested by snow-dominated cloud microphysical processes producing deep convection.
Shaanxi has the most frequent heavy rainfall in the arid and semi-arid regions of northwest China. The characteristics of heavy rainfall are strong intensity, short duration, and localization. Heavy rainfall often triggers serious flooding and mountain disasters, bringing great danger to lives and property (Zhang et al., 2011). However, forecasting heavy rainfall in arid and semi-arid northwest China remains a technical challenge, largely due to the complex surface characteristics of these regions. The sensible latent heat transport caused by precipitation and evaporation differs from that in humid areas (Zhao et al., 2016). Arid and semi-arid regions are sensitive to changes in climate, especially precipitation, which makes forecasting more difficult. In addition, these regions have complex geographical conditions and a low frequency of heavy rainfall occurrences. The mechanisms and mesoscale processes of heavy rainfall in arid and semi-arid regions need to be better understood (Kong et al., 2015).
Numerous studies on rainstorm mechanisms have been performed in arid and dry regions. Li et al. (2022) summarized the occurrence of heavy rainfall results from external forcing factors of weather-scale systems such as vertical wind shear, dry intrusion, instability, water vapor convergence, and frontal generation. Such rainfall also results from self-organization and interactions within storm systems (Schumacher and Johnson R H, 2005; Zheng et al., 2013), such as latent heating of condensation and convection causing perturbed vapor pressure gradients. Zhao et al. (2017b) found that mid- and low-level jets are the largest contributors to water vapor transport and are the main source of power for low-level convergence. Bi et al. (2006) and Zhao et al. (2017a) found that the forced uplift of the windward slopes of the Qinling Mountains and the cloud “seeding-supply” effect of topographic clouds trigger and intensify heavy rainfall in Shaanxi. Fu et al. (2022) found that atmospheric water vapor content far exceeding the climatic state is a necessary condition for the generation of extreme rainstorms. The superimposed influence of localized thermal and dynamic conditions and the localized convergence of water vapor are important reasons for the localized occurrence of heavy rainfall. The mechanisms of rainstorm triggering and development are very complex, and the understanding of rainstorm mechanism is beneficial for forecasting heavy rainfall, which also needs the help of numerical weather models (NWPs).
With the increasing improvement of NWPs, mesoscale models have become the main methods of analyzing rainstorm processes (Huang and Zhang, 2012). The number of parameterization schemes provided by mesoscale models is increasing, and the depiction of the specific physical process is improving, thus better simulating heavy rainfall (Zhao et al., 2016). However, NWPs are still inadequate for predicting the area and intensity of heavy rainfall. Cloud microphysical processes play a significant role in determining the distribution and intensity of rainfall in models. Cloud microphysical processes can affect both the formation process of precipitation and the thermodynamic process of convection systems. Therefore, cloud microphysical processes in NWPs often largely influence the accuracy of model forecasting results (Chen et al., 2021). Gao et al. (2005) and Fan et al. (2007) found that latent heat release from cloud microphysical processes can significantly alter the mesoscale thermodynamic structure of clouds and thus affect the development of convection systems. This feedback effect between cloud microphysical processes and the mesoscale environment is quite complex. There is still room for progress in the description of cloud microphysical processes in the mesoscale model. Moreover, topography also plays a significant role in determining the distribution and intensity of rainfall in models. The forecasting ability of NWPs for precipitation decreases with increased precipitation magnitude, which is closely related to the topography. The forecast for rainfall magnitude in mountainous areas is relatively low, especially for local and convection rainstorms (Wang et al., 2018).
In summary, the distinct cloud microphysical characteristics of heavy rain in arid and monsoon regions in China, influenced by factors such as geography, humidity, and temperature, pose unique challenges to regional forecasting. Heavy rainfall events in arid regions are typically sudden and develop rapidly, often due to the formation of mesoscale convective systems which contain active microphysical processes. Therefore, it is important to enhance understanding of the cloud microphysical characteristics of rainstorms and deepen our understanding of the feedback mechanisms between cloud microphysical processes and mesoscale environments in arid and semi-arid regions. These will help avoid disasters by forecasting extreme heavy rainfall in arid and semi-arid areas. Therefore, a cloud-resolving numerical model is necessary to simulate and reproduce an extreme rainfall event in arid and semi-arid regions. Consequently, we are thus able to highlight the characteristics of thermodynamic and cloud microphysics. In addition, we diagnose the quantitative mass budget of rainwater and the heat budget of hydrometeors. Finally, we compare the cloud microphysical characteristics between rainstorms in arid zones and monsoon zones to reveal notable differences. The possible physical mechanisms of weather situation analysis and the cloud microphysical processes that affect extreme heavy rainfall in arid and semi-arid regions are also discussed and summarized.
The remainder of the paper is organized as follows: Section 2 provides a case overview and the synoptic conditions. Model description is given in Section 3, and the model verification is given in Section 4. Section 5 details the features of the mesoscale environment and the cloud microphysical in heavy rainfall over Yan’an. A discussion on the possible mechanisms by which cloud microphysical processes affect heavy rainfall is given in Section 6. A conclusion is drawn in Section 7.
The city of Yan’an is located in the northern part of Shaanxi Province, China, where the terrain is dominated by loess and gullies (Ding et al., 2018). Yan’an experienced regional heavy rainfall on 3 September 2021 to 4 September 2021. The 24-h cumulative precipitation in Zhidan, a city to the north-central part of Yan’an, reached 113.8 mm. This heavy precipitation broke two records in Yan’an’s 24-h cumulative precipitation history. First, it set a new record for daily rainfall extreme value, with 10.7 mm more than the previous rainfall peak (24-h cumulative precipitation of 103.1 mm on 5 July 1977). Second, it set a new record for September average precipitation—the old record was 69.2 mm.
This section uses ECMWF reanalysis data and sounding observations to analyze weather conditions before the occurrence of heavy rainfall in Yan’an, investigating the heavy precipitation process of synoptic conditions.
Data from ECMWF fifth-generation reanalysis (ERA5) (spatial resolution: 0.25°; temporal resolution: 1 h) were used to analyze the circulation situation before the occurrence of heavy rainfall in Yan’an. As shown in Figure 1, the circulation and upper-level jet at 200 hPa indicated that Yan’an was located behind an upper-level trough, which further indicated cold and dry air invading Yan’an. The intrusion of middle- and upper-level dry and cold air increased the instability of the atmosphere and played an important role in triggering heavy rainfall. The circulation and temperature field at 500 hPa indicated that Yan’an was located behind the ridge and in front of the trough, which was favorable for upward motion. A western Pacific subtropical high extended westward to Sichuan, which carried moisture from the Bay of Bengal to Yan’an. The atmospheric circulation and wind field at 700 hPa indicated that Yan’an was located downstream of the low-level jet that overlaid the warm center—conducive to the convergence of water vapor and heat. The circulation and water vapor fluxes at 850 hPa indicated that Yan’an was located on the eastern side of low pressure accompanied by warm advection. The city was also in the center of a large value area of relative humidity, which indicated that there was water vapor gathering over Yan’an which was conducive to the development of heavy rainfall.
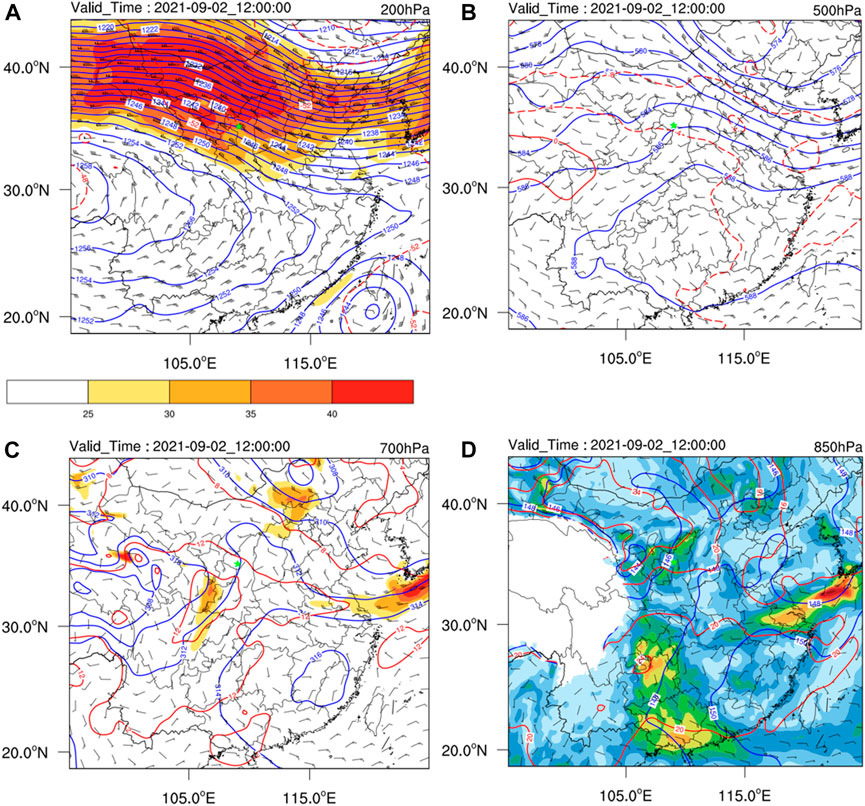
FIGURE 1. Weather situation in the study region based on ERA5 data at 1200 UTC 02 September 2021: (A) 200-hPa geopotential height (blue contours; unit: dagpm), temperature (red contours; unit: °C), and jets (color fill; unit: m s−1); (B) 500-hPa geopotential height (blue contours; unit: dagpm) and temperature (red contours; unit: °C); (C) 700-hPa geopotential height (blue contours; unit: dagpm), temperature (red contours; unit: °C), and jets (color fill; m s−1); (D) 850-hPa geopotential height (blue contours; unit: dagpm), temperature (red contours; unit °C), and relative humidity (color fill; g kg−1); green star is positioned at Yan’an.
In summary, heavy rainfall in Yan’an was dominated by a high-level cold trough, western Pacific subtropical high, a low-level warm and moist jet, and low pressure. There was dry and cold airflow intrusion into upper levels, warm and humid air at lower levels, moisture transport from the Bay of Bengal, and upward movement, resulting in heavy rainfall in Yan’an on 3–4 September 2021.
Figure 2 shows the Skew-T log-P plots in the point (109.45°E, 36.58°N) in Yan’an from ERA5, at a point located in the rainfall zone, to characterize the atmospheric stratification conditions and unstable energy before and during heavy rainfall. At 0212 UTC, the distance between the temperature profile and the dew point temperature profile was closer at 850 hpa, indicating wet layers at this height. This was due to low-level warm, wet jets bringing water vapor to Yan’an. The air at the height of 700 hpa to 500 hpa was dryer due to the intrusion of dry, cold air, leading to the accumulation of unstable energy [Convection Available Potential Energy (CAPE): 2487 J kg−1]. The distance between the temperature profile and the dew-point temperature profile was closer at the height of 500 hpa to 200 hpa. At 0218 UTC, below 850 hPa and at heights of 500 hPa to 200 hPa, the water vapor tended to be saturated. However, there were still strong dry layers at the height of 700 hpa to 500 hpa [Convection Available Potential Energy (CAPE): 2696 J kg−1]. At 0300 UTC, all layers tended to become saturated, thus indicating precipitation.
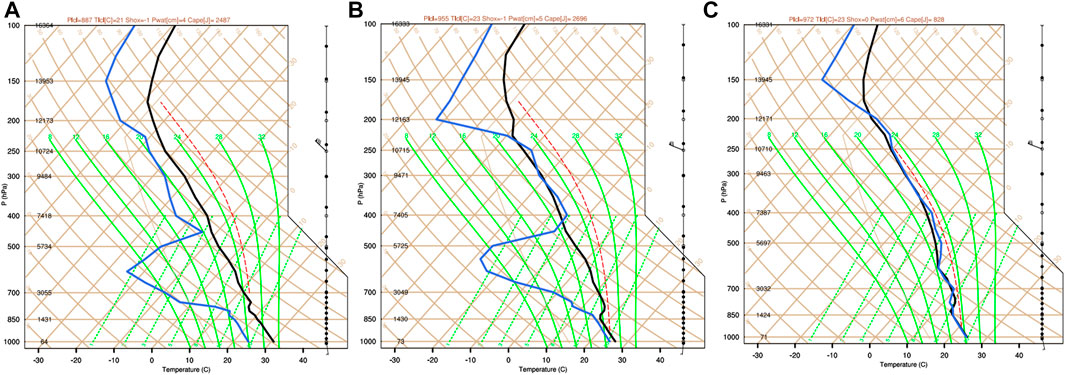
FIGURE 2. Skew-T log-P plots at point (109.45°E, 36.58°N) at (A) 0212 UTC, (B) 0218 UTC, and (C) 0300 UTC on 09 September 2021.
In summary, there was an invasion of dry, cold air over Yan’an before the occurrence of heavy rainfall, which had unstable energy in the environment and was prone to producing heavy rainfall. There were deep moisture layers in the lower levels with sufficient water vapor. This configuration of dry air in upper levels and moist air in lower levels can lead to atmospheric instability, which prompted strong convections to develop.
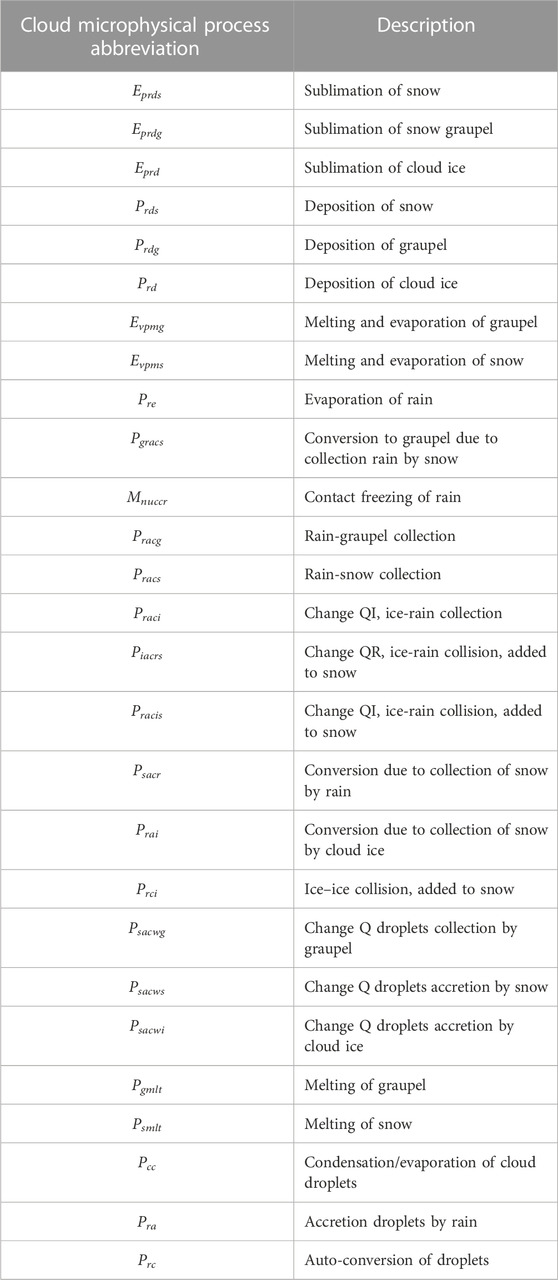
The WRF model is a new-generation mesoscale forecasting model and data assimilation system jointly developed by the USA’s National Center for Atmospheric Research, the National Oceanic and Atmospheric Administration, and other research departments, which has been widely studied and applied worldwide. The mesoscale model WRF4.2 was used to numerically simulate this heavy rainfall process in Yan’an. The 3D atmospheric initial conditions in the model and time-dependent boundary conditions were from the ERA5 data at a spatial resolution of 0.25° × 0.25°. The simulation area of the WRF model was nested in two layers (Figure 3). Domain1 and Domain2 were bidirectionally nested. The horizontal spatial resolution was set to 3 km and 1 km, respectively. The model vertical layer was 81. Time steps for integration were both 6 s. The valid period of the model was 3–4 September 2021. The output time interval was set to 1 h. The RRTM scheme was used for longwave radiation, the Dudhia scheme for shortwave radiation, and the MM5 Monin–Obukhov scheme for land surface processes. In addition, the simulation turned on topo_wind, which can correct the low-level wind field, and on gwd_opt, which can consider gravity waves induced by topography (Jing et al., 2019). The cloud microphysical scheme selected for the model was the Morrison 2-moment scheme (Morrison et al., 2015), which includes the mixing ratios of five water substances (cloud water, rain, cloud ice, snow, and graupel) and the calculation of the transformation term for these water substances (see Appendix A).
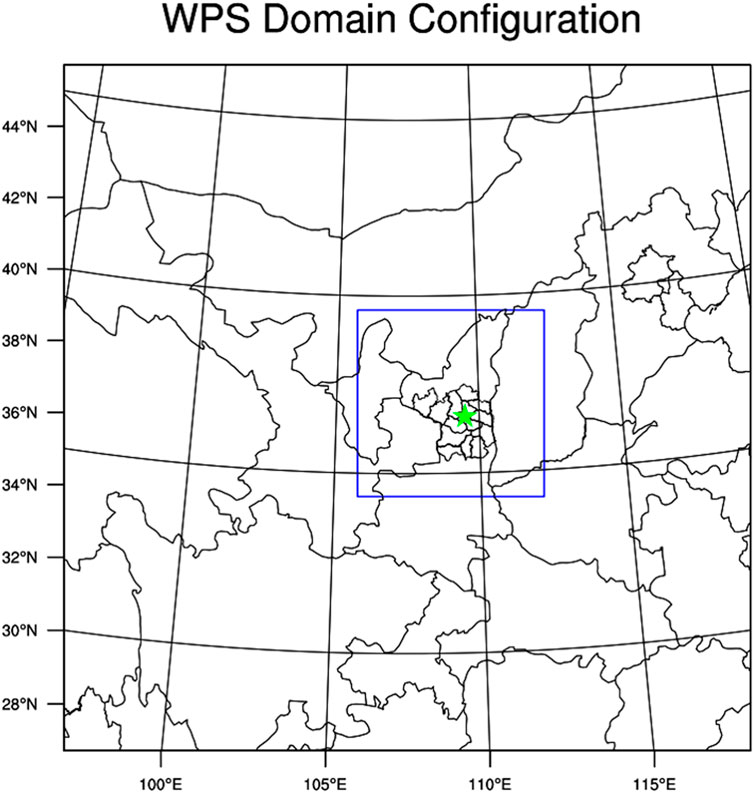
FIGURE 3. Configuration of WRF model simulation; the black box is the simulation range of Domain1, and the blue box is the simulation range of Domain2.
Spectral nudging is a way of constraining a model to be more consistent with observed behavior (Glisan J M et al., 2013). This FDDA (four-dimension data assimilation) method filters by setting the number of waves, filtering out high-frequency waves larger than this number in space, and retaining large-scale fluctuations. This fraction of large-scale fluctuations is added to the forecast field of the model according to a certain weighting. Thus, the simulation state can be kept close to the large-scale driving state, and the large-scale error can be better reduced. The model variables are free to develop large-scale processes whilst also responding to mesoscale processes (Liu et al., 2012; Ji, 2019). The wave number set in the FDDA method was wave number = 6.
To study the influence of microphysical processes on rainstorm, the diagnosis of the heat budget of hydrometeors must be calculated. The phase-change latent heat process was divided into the process of releasing phase-change latent heat to warm the air and the process of absorbing phase-change latent heat to cool the air. According to the method of Hjelmfelt et al. (1989) and Guo et al. (1999) for calculating the latent heat of phase change, the diabatic heating rate, diabatic cooling rate, and net heating rate can be calculated using the following equations:
Here, Rw is the total latent heat heating rate, Rc is the total latent heat cooling rate, Rt is the net latent heat heating/cooling rate, Lv is the latent heat constant of evaporation with a value of 2.5 × 10⁶, Lf is the latent heat constant of melting with a value of 3.34 × 10⁵, Ls is the latent heat constant of sublimation with a value of 2.8 × 10⁶ (in J kg−1), Cp is the constant pressure specific heat capacity of moist air at room temperature with a value of 1.007 × 10³ (in J kg−1 K−1), Pcond is the conversion rate of the condensation term, Pfrz is the conversion rate of the freezing term, Pdep is the conversion rate of the deposition term, Pevp is the conversion rate of the evaporation term, Pmlt is the conversion rate of the melting term, and Psub is the conversion rate of the sublimation term (all in kg kg−1 s−1).
In order to verify the accuracy of model simulation results, the actual precipitation distribution field (provided by Yan’an Meteorological Bureau) was selected for comparison with the model-simulated precipitation field, as shown in Figure 4. The simulated 24-h cumulative precipitation center in southwestern Yan’an cannot be verified due to the limitation of observation data, so this paper will focus on the cloud microphysical processes of two rainfall centers in northern Yan’an. In terms of rainfall intensity, the simulated 24-h cumulative precipitation had two heavy rainfall centers (24-h cumulative precipitation >100 mm) at northern Yan’an, which was consistent with observations. In terms of rainfall zone, two centers of heavy precipitation in the simulation are further north than the observation.
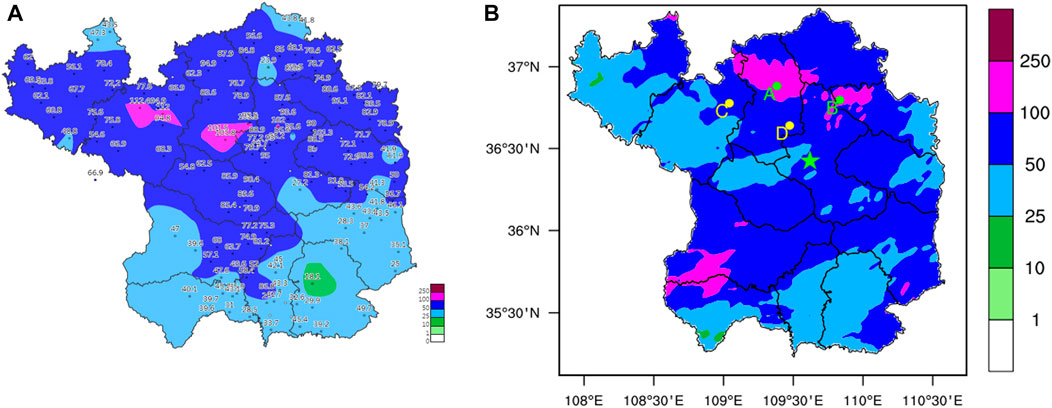
FIGURE 4. Comparison of observed and simulated 24-h cumulative precipitation from 0000 UTC 03 September 2021 to 0000 UTC 04 September 2021: (A) observation; (B) simulation. The green five-pointed star in the picture indicates the location of Yan’an Station 53,845. Point A represents the location of the simulated rainfall center in the west. Point B represents the location of the simulated rainfall center in the east. Point C represents the location of the observed rainfall center in the west, situated in Zhidan County. Point D represents the location of the observed rainfall center in the east, situated in Ansai County.
The 6-h cumulative precipitation between the observations and simulations at station 53,845 was compared to verify the accuracy of model simulation results (Figure 5A). The peak of the simulated 6-h accumulated rainfall intensity occurs at the same time as the observed peak in 53,845. The correlation coefficient between observed and simulated 6-h cumulative precipitation is 0.686 and the root mean square error is 14.41 mm/h. The 1-h cumulative precipitation from both observations and simulations at the Zhidan station was compared to evaluate the accuracy of the model simulation results (Figure 5B). Zhidan County, located in Yan’an, was the western center of this heavy rainfall event. On 3 September 2021, its 24-h cumulative precipitation reached 113.8 mm, surpassing the record for daily precipitation. Due to the discrepancy between the observed and simulated rainfall zones, simulated rainfall center A was chosen for comparison with the actual rainfall center of Zhidan (Figure 5B). The peak of the simulated 1-h cumulative rainfall intensity is consistent with the observed peak in Zhidan, and the intensity is also comparable. The correlation coefficient between the observed and simulated 1-h cumulative precipitation is 0.836, and the root mean square error is 4.01 mm/h. The simulated rainfall center B was chosen for comparison with the actual east rainfall center Ansai in this heavy rainfall event (Figure 5C). The peak of the simulated 1-h cumulative rainfall intensity is also consistent with the observed peak in Ansai. The correlation coefficient between the observed and simulated 1-h cumulative precipitation is 0.596, and the root mean square error is 3.96 mm/h. This demonstrates that the simulated and observed rainfall intensities at the rainfall center were consistent with time, further validating the reliability of the simulated precipitation.
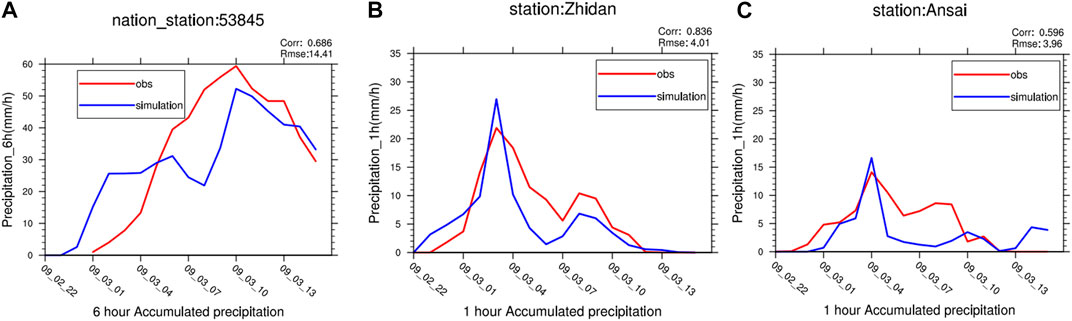
FIGURE 5. Comparison of the observed and simulated time series of station and simulated rainfall center point cumulative precipitation: (A) 6-h cumulative precipitation at Station 53,845; (B) 1-h cumulative precipitation at Zhidan; (C) 1-h cumulative precipitation at Ansai.
In summary, in 2D precipitation fields, although the simulated precipitation rainfall zone slightly deviated from the observed precipitation rainfall zone, the simulated precipitation rainfall intensity achieved the actual rainfall intensity. Since this paper focuses on the feedback processes of cloud microphysics and mesoscale environment that led to this strong rainfall intensity, this simulation result is considered reliable. In station precipitation, the intensity and occurrence time of precipitation simulated by WRF are closer to the actual observation, indicating that the simulated results are reliable for making the following research. Further verification of the reliability of the simulated precipitation results required Doppler radar data.
Doppler weather radar information is playing an increasingly important role in mesoscale numerical weather forecasting. The new generation of Doppler weather radar monitoring networks in China is equipped with a series of radars that cover different ranges of bands and wavelengths, which can make more accurate quantitative precipitation measurements and warnings of thunderstorms, typhoons, and heavy rainfall (He, 2012). Ding et al. (2018) found that rainstorm echoes in Yan’an were mainly in the form of band-like storm echoes, discrete clump-like storm echoes, and multiple parallel bands. Therefore, the reliability of simulated data can be demonstrated by the radar echo information provided by Doppler radar data. Figures 5B,C show the time series of 1-h of accumulated precipitation at the rainfall center, which was the crucial area of interest in this paper. As can be seen from Figures 5B,C, precipitation was mainly concentrated from 00:00 UTC to 04:00 UTC on 3 September 2021, indicating that this period is the most vigorous for convection development and is the most typical period of this Yan’an heavy rainfall process.
The radar echo shape of the Yan’an rainstorm in this paper showed an overall banding shape (Figures 6A–C), indicating that convection systems over Yan’an were repeatedly generated and developed, producing heavy precipitation through the train effect. There is a radial gap in the upper left of the radar echo which is mainly due to mountain obstruction. At 00:00 UTC, convection (>30 dBZ) from the northwest entered the northwest of Yan’an. Multiple strong convection centers (>40 dBZ) existed in convection, and the distribution of strong convection centers were scattered. At 01:00 UTC, strong convection centers gathered over northern Yan’an. At 02:00 UTC, the range of convection expanded; strong convection centers decayed, and the intensity of radar echoes decreased.
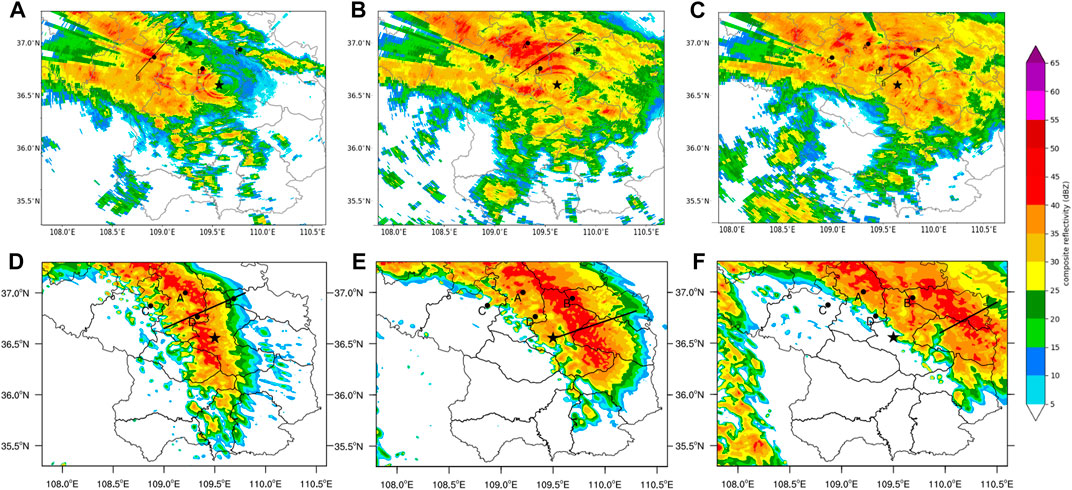
FIGURE 6. Horizontal evolution of radar reflectivity (color fill; unit: dBZ): (A) observation at 00:00 UTC 3 September 2021; (B) observation at 01:00 UTC 3 September 2021; (C) observation at 02:00 UTC 3 September 2021; (D) simulation at 00:00 UTC 3 September 2021; (E) simulation at 01:00 UTC 3 September 2021; (F) simulation at 02:00 UTC 3 September 2021. The black line in the figure indicates the profile position. The black five-pointed star in the picture indicates the location of Yan’an Station 53,845 and Yan’an radar station Z9911. The four black dots correspond to the four points of A, B, C, and D in Figure 4.
The simulated radar reflectivity is shown in Figures 6D–F. The range of simulated radar reflectivity was more westward than observed. Compared with observations, the simulated radar reflectivity had a smaller range of convection but a larger range of strong convection centers. At 00:00 UTC, the simulated radar reflectivity was band-like, stretching from northwest to middle Yan’an. At 01:00 UTC, the simulated radar reflectivity was stronger and more westward than previously, and the range of strong convection centers were extended. At 02:00 UTC, the main body of convection continued moving westward, and strong convection centers had dispersed.
In summary, the simulated horizontal composite reflectivity demonstrated observation characteristics with regards to movement, range, and intensity. The three selected moments were those of rainfall development and decay, which were used to research cloud microphysical characteristics and mechanisms during heavy rainfall.
To further discuss the three-dimensional structure of strong convection that affects heavy rainfall, an analysis of the radar profile of strong convection centers was required (Figure 7). Observed radar results are discontinuous in the upper levels of the profiles because there were gaps between the high and bottom elevation angle layers, and then radar profiles were interpolated. However, this did not affect our judgment about strong convection centers in the lower levels. As can be seen from Figures 7A–C, at 00:00 UTC, convection was in the development stage with maximum reflectivity at 35 dBZ and maximum echo center at a height of 4–5 km. At 01:00 UTC, the strong convection center reached maximum reflectivity of 45 dBZ and a height of 5 km. There was radar reflectivity greater than 35 dBZ extending from 5 km to the ground, indicating rainfall then. At 02:00 UTC, there was radar reflectivity greater than 40 dBZ extending from 5 km to the ground, indicating that the strong convection center had entered a decay period with rain falling.
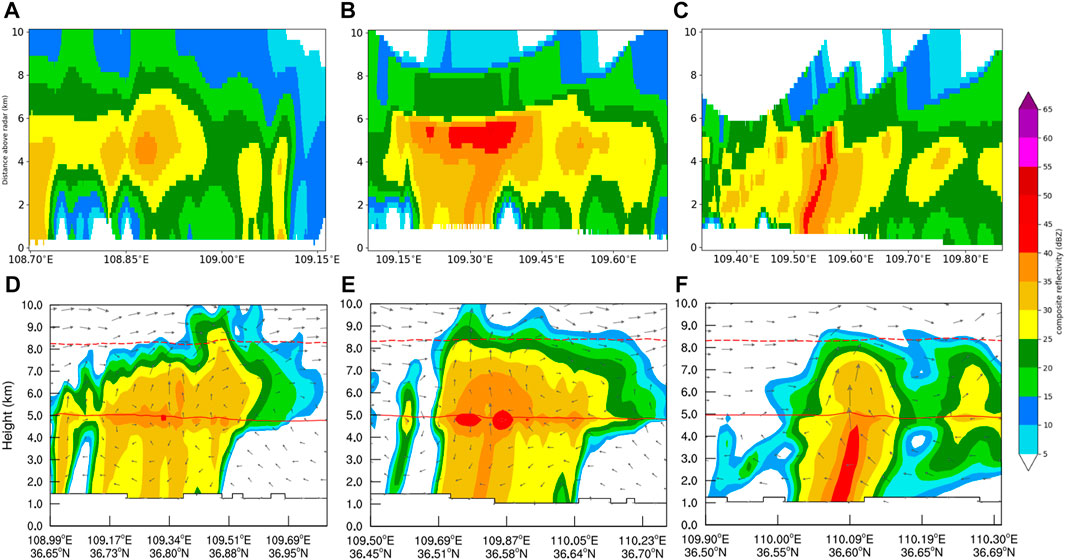
FIGURE 7. Vertical profiles of radar reflectivity in three moments of strong convection. (A) Observation at 00:00 UTC 3 September 2021; (B) observation at 01:00 UTC 3 September 2021; (V) observation at 02:00 UTC 3 September 2021; (D) simulation at 00:00 UTC 3 September 2021; (E) simulation at 01:00 UTC 3 September 2021; (F) simulation at 02:00 UTC 3 September 2021. The profile locations are shown in Figure 6. Red solid line represents the 0°C layer; red dash line represents the −20°C layer.
The simulated vertical radar reflectivity is shown in Figures 7D–F. At 00:00 UTC, the strong convection center of simulated radar echoes was stronger than observed. The height of the maximum echo center in the simulation was 5 km, conforming to observations. Upward motion was then mainly distributed right of the strong echo center at 4–8 km high. At 01:00 UTC, the simulated echo characteristics matched observations. Upward motion corresponded to the radar reflectivity center, extended 4–10 km, and then outflowed along the cloud anvil. At 02:00 UTC, simulated results had similar echo characteristics to observed echoes—radar reflectivity greater than 40 dBZ thus extended from 4.5 km to ground. However, the echo of the simulated strong convection center had a lower height than observed. The overall height of convection was lower than the previous moment, indicating that upward movement was active at 5–8 km.
In summary, Figure 7 shows the development processes of observed and simulated strong convection that affected heavy rainfall in Yan’an. The characteristics of simulated horizontal and vertical radar reflectivity were similar to observations, indicating that the simulated results were able to reflect actual convection conditions that affected heavy rainfall in Yan’an. Simulation results can be used to investigate how cloud microphysical processes and the mesoscale characteristics of convection influenced this heavy precipitation in Yan’an.
In addition to precipitation and radar reflectivity, the simulated mesoscale environmental conditions, including dynamic and thermodynamic fields, were also verified with the ERA5 reanalysis data (Yin L et al., 2023) (Figure 8). At 00:00 on 3 September 2021, a low-pressure center existed west of Yan’an, and the southwesterly flow of low pressure affected Yan’an in both ERA5 and simulations; the thermal center existed over Yan’an in both ERA5 and simulations. There was water vapor convergence over Yan’an at this moment, but the simulated precipitation was stronger than the water vapor convergence in ERA5. The aforementioned analysis shows that the model can capture the mesoscale dynamical and thermodynamic environment of this rainfall event in Yan’an.
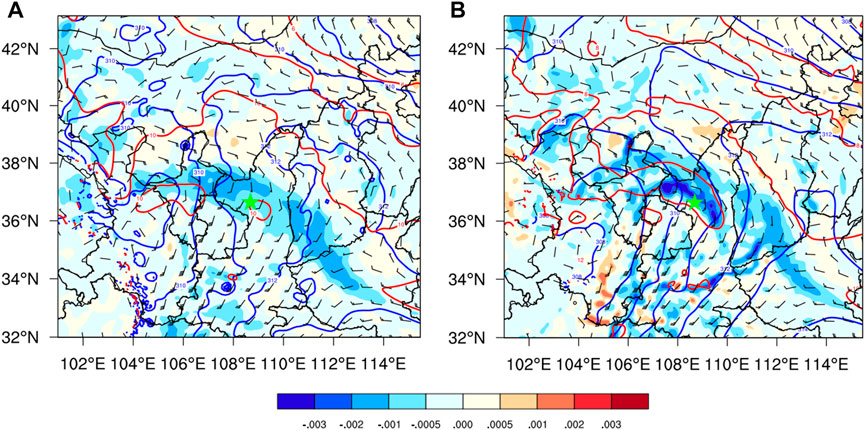
FIGURE 8. Mesoscale environmental fields derived from ERA5 data and simulation, with geopotential height (blue contour, units: dagpm), temperature (red contours, units: °C), wind field (barbs, full bar denotes 4 m/s) at 700 hpa, and the vertical intergral of divergence of water vapor flux (shading, units: kg m−2 s−1) at 00:00 UTC on 3 September 2021. The green five-pointed star in the picture indicates the location of Yan’an Station “53845”.
Cloud microphysical characteristics can have strong interactions with the environment through thermodynamic processes (Anthes R A et al., 1982). Therefore, this section is in two main parts. First, the vertical thermodynamic structures of the strong convection center that affected this heavy rainfall are discussed; then, the vertical distribution of liquid and ice particles within a strong convection center that affected this heavy rainfall is described, which is then used to analyze the cloud microphysical characteristics of strong convection.
Cloud microphysical processes can lead to variations in latent heat. Therefore, the characteristics of thermal variations in clouds are an intuitive reflection of cloud microphysical processes on mesoscale environmental feedback. Figure 9 shows simulated vertical profiles of the spatial and temporal evolution of the perturbation potential temperature and wind field before and during heavy rainfall. At 00:00 UTC, the negative disturbance potential temperatures were mostly below 3 km, and the positive disturbance potential temperatures were mostly above 5 km. Upward motion existed at a height of 4–8 km at 109.17°–119.51°E, 36.73°–36.88°N. The updraft in the upper outflow area corresponded to positive perturbation potential temperature centers (maximum value of positive perturbation potential temperature center exceeding 2 K) and strong radar echoes (maximum radar reflectivity exceeding 35 dBZ). This was due to the upward motion that brought liquid particles and water vapor from lower to upper levels, generating large amounts of ice-phase particles that resulted in latent heat release and thus heated the environmental air in the cloud. The upward motion turned to strong horizontal advection at a height of 8 km. Another positive perturbation potential temperature center, corresponding to horizontal outflow, was located near the −20°C layer and corresponded to the lower echo (radar reflectivity: 25 dBZ) (Figure 7D). This perturbation potential temperature center may be due to warm advection. At 01:00 UTC, the positive perturbation potential temperature centers were intensified and elevated, which were accompanied by increased upward motion and horizontal advection. The low-level centers of negative disturbance potential temperature also strengthened and were accompanied by downward motion, indicating precipitation evaporation with heat absorption, leading to cooling at the edge of strong convection. At 02:00 UTC, positive perturbation potential temperature centers were expanded and elevated even higher than the −20°C temperature line. Centers of positive perturbation potential temperature were vertically aligned with centers of negative perturbation potential temperature, indicating that this strong convection center then produced rainfall. The upward motion was stronger than the previous two moments but was tilted. The horizontal motion in upper-level outflow was also enhanced, but the echoes are below 20 dBZ or even absent at the corresponding position in Figure 7F.
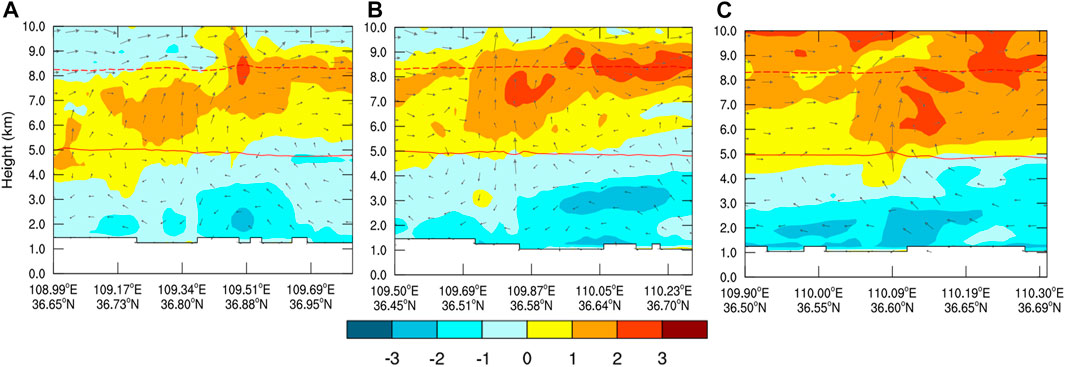
FIGURE 9. Vertical profiles of the perturbation potential temperature field (color fill; unit, K) and wind field (vector arrows; unit, m s−1) simulated in three moments of strong convection. (A) Simulated perturbation potential temperature at 00:00 UTC 3 September 2021; (B) simulated perturbation potential temperature at 01:00 UTC 3 September 2021; (C) simulated perturbation potential temperature at 02:00 UTC 3 September 2021. The profile locations are shown in Figure 6. Red solid line represents the 0°C layer; red dash line represents the −20°C layer.
In summary, Figure 9 shows thermal and dynamical variations in the development processes of strong convection affecting a heavy storm in Yan’an. The positive disturbance potential temperatures were mainly distributed in upper levels above 5 km. As the upward motion and radar echo gradually enhanced, the intensity of positive disturbance potential temperature gradually increased, and the height of positive disturbance potential temperature centers gradually elevated. This was related to the conversion process of ice phase particles, which are discussed in the following section. There was another positive perturbation potential temperature center corresponding to the weak echo with strong horizontal motion. This enhancement of a positive perturbation of a potential temperature center may be associated with horizontal advection. The negative perturbation potential temperatures were mainly distributed in the lower layers. The intensity of negative disturbance potential temperature also gradually increased. This was related to precipitation evaporation with heat absorption leading to cooling.
The generation of heavy rainfall is associated with positive feedback between the mesoscale environment and cloud microphysical processes. Therefore, an understanding of cloud microphysical characteristics and, thus, feedback processes in strong convection before and during heavy rainfall is needed. Figure 10 and Figure 11 show the vertical profiles of mixing ratios and wind fields of different water condensates, which allows us to determine links between the water condensates’ field and thermodynamic field with Figure 9.
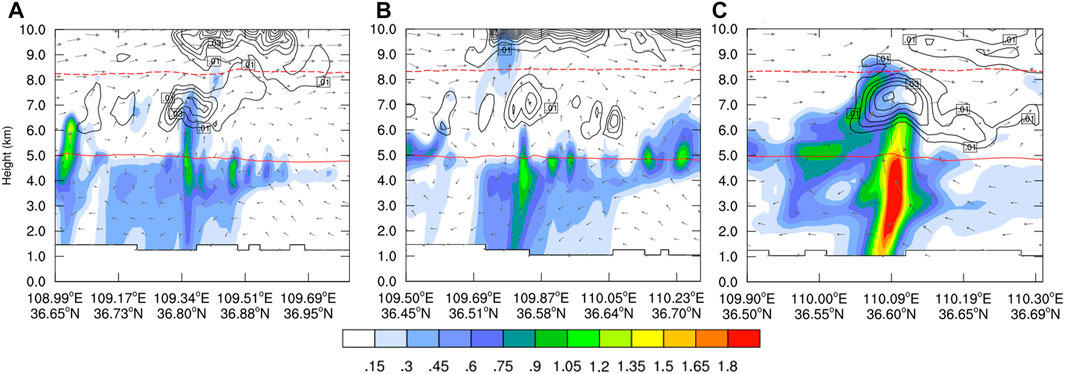
FIGURE 10. Mixing ratios of rainfall and cloud water (color fill; unit, g kg−1) and cloud ice (contours; unit, g kg−1), and wind field (vector arrows; unit, m s−1) simulated in three moments of strong convection. (A) Simulation at 00:00 UTC 3 September 2021; (B) simulation at 01:00 UTC 3 September 2021; (C) simulation at 02:00 UTC 3 September 2021. Profile locations are shown in Figure 6. Red solid line represents the 0°C layer; red dash line represents the −20°C layer.
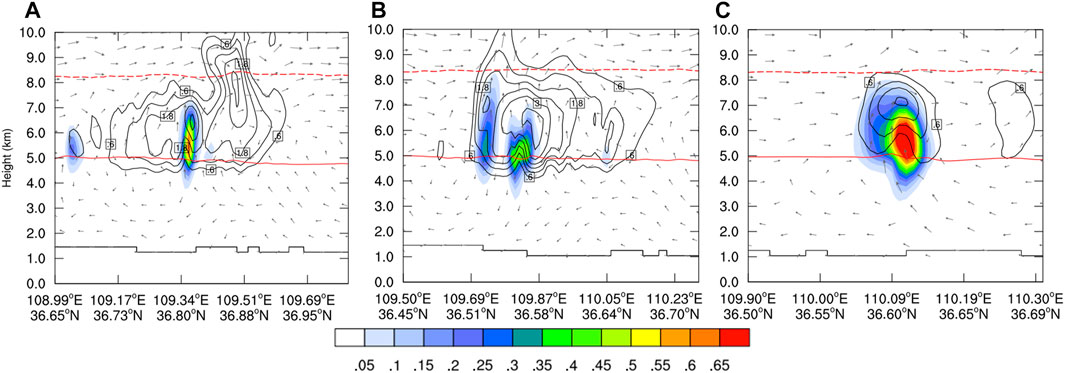
FIGURE 11. Mixing ratios of graupel (color fill; unit, g kg−1) and snow (contours; unit, g kg−1), and the wind field (vector arrows; unit, m s−1) simulated in three moments of strong convection. (A) Simulation at 00:00 UTC 3 September 2021; (B) simulation at 01:00 UTC 3 September 2021; (C) simulation at 02:00 UTC 3 September 2021. Profile locations are shown in Figure 6. Red solid line represents the 0°C layer; red dash line represents the −20°C layer.
Figure 10 shows the temporal evolution of vertical profiles of liquid water and cloud ice mixing ratios and the wind field before and during heavy rainfall. At 00:00, the large values of radar reflectivity center in the strong convection in Figure 7, corresponding to large values of mixing ratios of liquid water center (maximum value more than 1.05 g kg−1) near the melting layer in Figure 11 in the strong convection at 109.17°–119.51°E, 36.73°–36.88°N. The large value of the liquid-water mixing ratio corresponded to the upward motion, indicating that some of the liquid water may be lifted above the melting layer and produce supercooled water. Above the large value of mixing ratios of liquid water was a large value of cloud ice mixing ratios (maximum value more than 0.04 g kg−1). This phenomenon was mainly due to the upward motion that carried water vapor, liquid water, and supercooled water to high levels, where ice was formed through processes of deposition and freezing. At 01:00, the regions of large values of liquid-water mixing ratios were higher compared to the previous moment. The maximum cloud ice mixing ratios were also reduced compared to the previous moment. The mixing ratio of cloud ice and liquid water was at 02:00, when the liquid water mixing ratios reached their maximum (more than 1.8 g kg−1) and were connected from the melting layer to the surface. The cloud ice mixing ratios in high levels reached their maximum value (more than 0.06 g kg−1), and the regional range of cloud ice mixing ratios distribution increased. The upward motion was significantly stronger than previously. The positive perturbation potential temperature at 2:00 in Figure 9 was also enhanced in intensity and increased in extent compared to that previously. This suggested a positive correlation between environmental heating due to latent heat and the growth process of deposition and freezing.
In summary, upward motion carried water vapor and liquid water from lower to higher levels, where it accumulated near the melting layer. Some of the liquid water was carried to upper levels by the upward motion of the process of deposition and froze into ice. These processes released latent heat and thus warmed the center of the cloud. The melting of cloud ice facilitated rainfall, which is shown in the figure as the decreased cloud ice mixing ratio at 1:00 and the simultaneously increased liquid water mixing ratio. However, at 02:00 the cloud ice and liquid water mixing ratios were substantially enhanced. The upward motion was also dramatically enhanced due to synoptic and mesoscale forcing, which may affect the conversion of the ice-phase particles. The reason for this will be explained in detail in the following section.
Figure 11 shows the temporal evolution of vertical profiles of graupel and snow mixing ratios and the wind field before and during heavy rainfall. At 00:00, there were large graupel mixing ratios (maximum more than 0.65 g kg−1) above the melting layer. The region of a large value of snow mixing ratio (maximum more than 3 g kg−1) existed above the region of a large graupel mixing ratio, corresponding to the region of large cloud ice mixing ratios in Figure 10. At 01:00, the mixing ratios of graupel were reduced (maximum more than 0.4 g kg−1). Snow mixing ratios slightly increased, and the range of snow extended more than previously. However, the height of the snow mixing ratio centers decreased from that previous. At 02:00, snow-mixing ratios reduced (maximum value more than 2.4 g kg−1) compared to previously. The graupel mixing ratios sharply increased (maximum value more than 2.4 g kg−1) above the melting layer, accompanied by strong upward motion. Comparing Figure 10C and Figure11C shows that the lower pressure levels of graupel-mixing ratio centers correspond to the liquid water mixing ratio center.
In summary, upward motion lifted water vapor and liquid water to form upper-level cloud ice through deposition and freezing. The aggregation and collision of ice formed snow. The collision and merging of ice and liquid water form graupel, so the mixing ratio centers of graupel were always at the lower pressure levels of the snow-mixing ratio centers. By comparing Figures 9, Figure 10, and Figure 11, the increase of raindrops may be related to graupel melting, and the increase of latent heat release may be related to the deposition of cloud ice and snow. The quantitative analysis of rainfall production and latent heat release for conversions of cloud microphysical processes will be discussed next.
Section 5 focused on the mesoscale environmental features and cloud microphysical processes within strong convection that produced heavy rainfall in Yan’an. However, an overall quantitative understanding of the cloud microphysical processes and diabatic heating processes that produced precipitation over Yan’an is not clear in these processes. To understand the influence of microphysical processes on this heavy rainfall, further analysis of the mass balance of rainwater particles and the latent heat budget of water condensates is required.
Figure 12 shows the mean production rates of the microphysical process over height during heavy rainfall in Yan’an. It can be seen that the main microphysical conversion processes for the source of rainfall particles were accretion droplets by rain (Pra) and the melting of graupel (Pgmlt). The main micro-physical conversions processes for the sink of rainfall particles were rain-snow collection (Pracs) and the evaporation of rain (Pre).
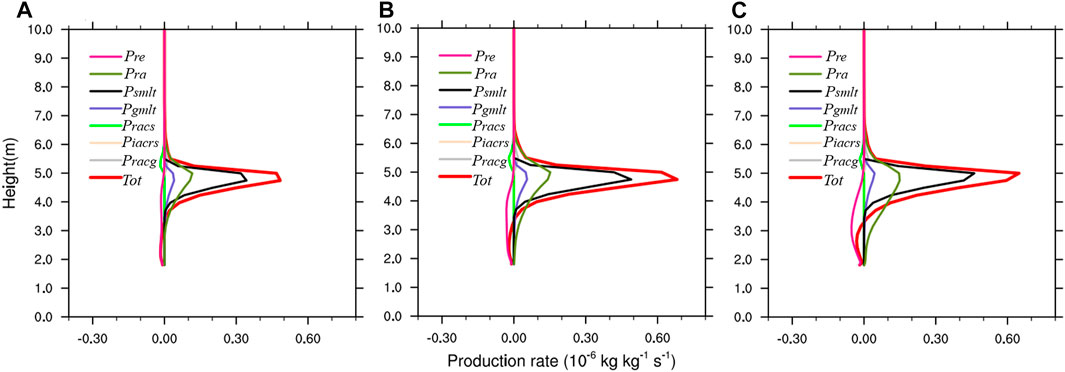
FIGURE 12. Mean production rates of the microphysical process over height in three moments of strong convection over Yan’an. (A) Simulation at 00:00 UTC 3 September 2021; (B) simulation at 01:00 UTC 3 September 2021; (C) simulation at 02:00 UTC 3 September 2021.
These main microphysical conversions processes for rainfall particles were gradually enhanced over time. In the main microphysical conversion processes for the source of rainfall particles, Psmlt was the most significant rainfall production in cloud microphysical conversions during heavy rain in Yan’an. The peak of Psmlt occurred mainly between 4.5 and 5 km, which were the distribution heights of melting. The snow mixing ratios at 2:00 in Figure 11 decreased compared to the previous moment, but the Psmlt process in Figure 12 increased. This is due to the increased temperature in the region of the snow-mixing ratios in Figure 9, resulting in easier melting of the snow. The melting of snow increased in liquid water and increased in the process of Pra, which also occurred in the melting layer. The process of graupel melting (Pgmlt) was also one of the main processes of rainfall particles sources. Due to the lower graupel-mixing ratio compared to snow, the impact on the increase of rainfall particles was also less than snow. However, the Pgmlt process also increased with the development of convection. On the one hand, the increase of liquid water due to snow melting favors the production of graupel, which is due to the phenomenon of snow mixing ratio centers always being above graupel mixing ratios centers, as mentioned previously. On the other hand, with the increase of temperature within the cloud, the two microphysical conversion processes for the sink of rainfall particles—Pracs and Pre—were smaller in magnitude than the three microphysical conversion processes for the source of rainfall particles. Pracs mainly occurred around 5.5 km. Pre mainly occurred 2–4km, which is mainly due to rain evaporation caused by rainfall.
Figure 13 shows the mean heating rates of the microphysical conversions process over height during heavy rainfall in Yan’an. The main microphysical conversions for heating were deposition of snow (Prds), deposition of cloud ice (Prd), and deposition of graupel (Prdg). The main microphysical conversions for cooling were sublimation of snow (Eprds), sublimation of cloud ice (Eprd), evaporation of rain (Pre), melting and evaporation of snow (Evpms), and the sublimation of snow graupel (Eprdg).
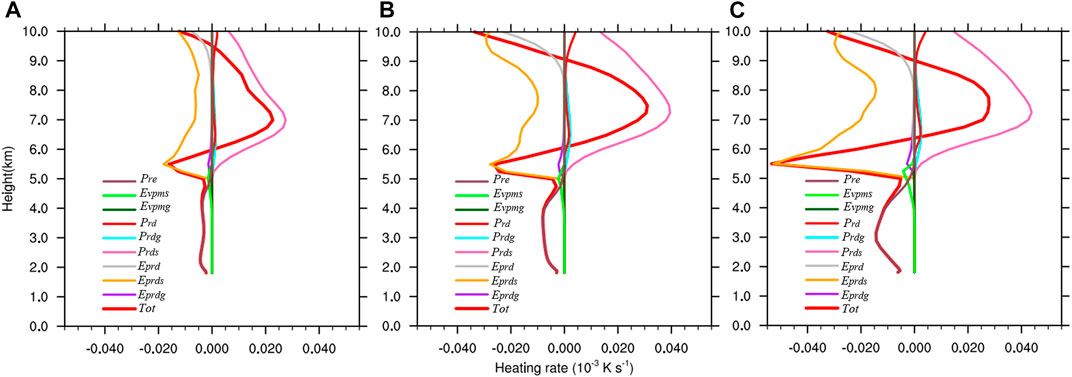
FIGURE 13. Mean heating rates of the microphysical process over height in three moments of strong convection over Yan’an. (A) Simulation at 00:00 UTC 3 September 2021; (B) simulation at 01:00 UTC 3 September 2021; (C) simulation at 02:00 UTC 3 September 2021.
These principal microphysical conversion processes that affect heating rates were also gradually enhanced over time. Snow was the most important water condensate that affected the heating or cooling rate within clouds. Prds was the most significant heating rate in cloud microphysical conversions during heavy rain in Yan’an. The peak of Prds occurred mainly between 7 and 8 km and elevated gradually with the development of convection. This was due to enhanced upward motion leading to more water vapor and liquid water from the lower to upper levels, which formed ice phase particles, especially snow. The deposition of snow in turn led to increased temperature within clouds. The increase in buoyancy within the clouds led in turn to the increase in upward motion. The peak of Eprds occurred mainly at 5–6 km—above the melting layer. This was caused by the saturated water vapor pressure at the ice surface being lower than the saturated water vapor pressure at the water surface. The sublimation process of snow absorbed heat, leading to a concentration of heat in the middle and upper layers, which was more favorable for cloud development. The peak of Evpms occurred mainly at 5 km, which was distribution height of the melting layer. The cooling rate of the Evpms process was smaller than other processes for snow. Pre was also an obvious microphysical transformation process. Pre occurred mainly below the melting layer, due to diabatic cooling caused by the dragging downward motion of rainfall. The heat released and absorbed by the microphysical conversion processes associated with graupel is very low. Based on the aforementioned analysis, the cloud microphysical processes leading to diabatic heating/cooling correspond well with the positive/negative centers of perturbation potential temperature within the cloud, except for the positive perturbation potential temperature centers at 9–10 km with strong horizontal outflow (Figure 9) and lower radar echo (Figure 7). According to the thermodynamic energy equation, local potential temperature variations are the result of temperature advection and diabatic effects, and the positive perturbation centers at this height correspond to stronger advection. Therefore, the strong heating effect at 9–10 km in Figure 9 is mainly related to temperature advection.
In summary, this heavy rainfall process over Yan’an was mainly produced by the conversion effect of snow. The conversion effect of graupel was smaller for the production of rainfall than with snow. However, Dong and Li, (2022) found that the increase in graupel mixing ratios corresponded to the three precipitation peaks in an extreme rainstorm event (1,056.7 mm/day) along the South China coast in summer 2018. The height of the 0°C layer for this rainfall was around 4.2 km. The snow and cloud ice did not correspond to the three precipitation peaks. This indicates that this extreme rainstorm event on the South China coast was mainly produced by the conversion effect of graupel. Li J et al. (2017) found that the maximum of the graupel mixing ratios was 1.4 g/kg, and the maximum of snow mixing ratios was 0.8 g/kg. The height of the 0°C layer for this rainfall was approximately 4.3 km. The latent heat center was mainly concentrated approximately 4–5 km. This paper found that the maximum graupel mixing ratio was 0.65 g/kg and the maximum snow mixing ratio was 3 g/kg. The height of the 0°C layer for this rainfall was approximately 5 km. The latent heating center was mainly concentrated approximately 7 km. This comparison indicates that the autumn rainstorm on Hainan Island was also mainly produced by the conversion effect of graupel. These are two examples of heavy rainfall that occurred in the southern monsoon region of China. In northern monsoon region of China, Chen et al. (2021) found that the largest source for rainfall particles is the melting of graupel in addition to rainwater harvesting cloud water in a Beijing rainstorm 18–19 July 2016. The height of the 0°C layer for this rainfall was approximately 4.5 km. In the Yangtze River monsoon region in China, the accretion from cloud liquid water to graupel (QCLcg) was the dominant microphysical process influencing the mixing ratio of cloud water (Li C et al., 2020). The height of the 0°C layer for this rainfall was approximately 4.2 km.
In the aforementioned examples of heavy rainfall in monsoon regions, the conversions of graupel were the main cloud microphysical processes. The height of the 0 °C layer of these precipitation events occurring in the monsoon region was 4–4.5 km. However, the cases of arid region rainstorms studied in this paper were dominated by the conversion processes of snow. The height of the 0 °C layer is approximately 5 km, which may be due to the following reasons. McCollum et al. (2000) noted that the convective cloud bases formed under the dry condition (i.e., cold-type clouds) are generally higher than those developed under the moist environments, causing higher evaporation for falling raindrops and thus less precipitation at the surface. This supports the limited growth of raindrops for cold-type heavy rainfall under relatively dry conditions. However, heavy rainfall is still produced in arid and semi-arid areas because there are two main ways in which water vapor can be saturated: due to the constant transport of water vapor in some regions, or due to the intrusion of dry, cold air resulting in relative saturation. Monsoon regions are more likely to lead to precipitation in the warm zone due to its abundant water vapor and southerly location, thus making the formation of graupel more likely to. However, rainstorms in arid and semi-arid regions are more likely due to the confrontation of the north–south air mass. The intrusion of dry, cold air into upper layers is often an important trigger for heavy rainfall, indicating that this production of rainstorms does not need an environment of high temperature and high humidity, which is more likely to lead to snow production with deep convection due to precipitation in cold, dry zone. This has some similarities to Mao et al. (2018), who divided the 721 heavy rainfall process in Beijing into a warm precipitation phase and a cold-front precipitation phase. The production of precipitation in both phases is dominated by the conversion of graupel. Although the precipitation efficiency of the cold-front phase is less than that of the warm zone phase, the former has well-developed stratocumulus clouds with higher cloud tops and stronger ice phase processes, which will release more latent heat and enhance updrafts, relatively increasing the effect of snow conversion. Another study also demonstrates that snow is more likely to be produced in rainstorms in arid areas and graupel is more likely to be produced in rainstorms in wet monsoon areas: Song H J et al. (2017) used idealized numerical experiments to find that a lack of upper-level snow and a strong riming process between the supercooled raindrops and ice particles were present at the initial stage in the warm-type experiment, leading to rapid graupel production. However, Takahashi T (2006) and Takahashi et al. (2015) reported that heavy precipitation over monsoon regions (similar to the warm type) is linked to frozen drops rather than graupel. This is mainly due to the deficiencies in current cloud microphysics schemes—there is no bulk microphysics scheme in the WRF model that differentiates graupel from frozen drops, and high graupel concentration may be attributed to the absence of frozen drops. In the idealized numerical experiments of Song H J et al. (2017), abundant snow was produced in cold-type experiments, and a much smaller quantity of snow was produced in warm-type experiments, corroborating the conclusions of this paper.
On the basis of the analysis of Figure 1, Figure 2, Figure 3, Figure 4, Figure 5, Figure 6, Figure 7, Figure 8, Figure 9, Figure 10, Figure 11, Figure 12, and Figure 13, a picture of cloud microphysical mechanisms affecting the heavy rainfall process in Yan’an can be given (Figure 14). At 500 hpa, a western Pacific subtropical high extended westward to the Sichuan basin, providing water vapor channels for water vapor from the Bay of Bengal to Yan’an. At 700 hpa, a lower-level jet transported water vapor and heat to Yan’an. At 850 hpa, Yan’an was located on the eastern side of low pressure accompanied by warm advection. Under the action of these weather systems, considerable heat and water vapor had accumulated over Yan’an. However, because it is located in an arid/semi-arid region and is vulnerable to dry, cold air from high latitudes, the water vapor content and temperature was not sufficient to reach saturation. At 200 hpa, there were a high-level cold trough and jet over Yan’an. The dry, cold air continuously invaded Yan’an, causing the accumulated water vapor to reach relative saturation. This rainfall event in Yan’an occurred in such a weather background.
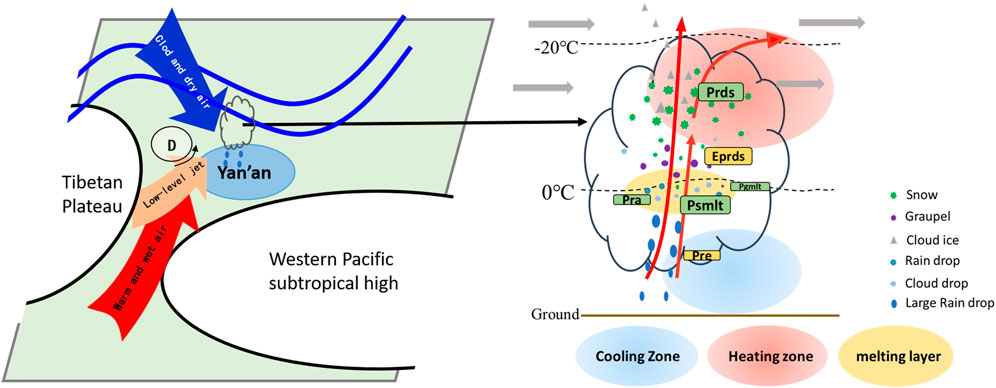
FIGURE 14. Conceptual model of the formation process for heavy rainstorm on 3–4 September 2021 in Yan’an.
The production of heavy rainfall in Yan’an was due to multiple strong convections through a train effect. Strong convection led to strong upward motion triggered by synoptic and mesoscale forcing. The upward motion carried water vapor and liquid water transported by a low-level jet. Some of the liquid water was carried by upward action above the melting layer and formed supercooled water. Water vapor and liquid water formed ice phase particles in the middle and upper layers, such as snow, cloud ice, and graupel, through deposition and freezing Bergeron processes. The microphysical conversion of ice phase particles facilitated rainfall. The microphysical conversion processes of phase particles released large amounts of latent heat, raising the environmental temperature. On the one hand, it led to increased cloud buoyancy and gave positive feedback to the upward motion. On the other hand, it led to the accumulation of unstable energy in the environment, which, in turn, sustained the development of convection. The Prds process with snow was the main heating process of the cloud environment. When the ice phase particles grew to certain scales, cooling ice phase particles above melting layer sublimated because the saturated water vapor pressure at the ice surface was less than the saturated water vapor pressure at the water surface, such as in the Eprds process. Within the melting layer, melting graupel and snow led to increased liquid water, such as Psmlt and Pgmlt possess. The process of raindrops collecting cloud drops (Pra) also occurred naturally within the melting layer. When raindrops grew, rainfall was generated. The dragging effect of the rainfall process led to diabatic cooling, which produced the cold pool at the lower layers. This configuration of lower layers for cooling and upper layers for heating in turn provided positive feedback to upward motion. The positive feedback effects of the cloud mesoscale environment and cloud microphysical processes led to a heavy rainstorm in Yan’an.
A cloud-resolved numerical simulation was carried out for an extreme rainfall case in Yan’an, a city in an arid/semi-arid region in northwest China, on 3–4 September 2021. Data from an auto-weather station and Doppler radar were used to verify the simulation results. This rainstorm process was shown as the band radar echo, which is due to multiple strong convections through a train effect. The characteristics of mesoscale cloud environment and cloud microphysical processes were analyzed in strong convection. The rainwater mass budget and latent heat budget of microphysical conversions about water condensates were then calculated for Yan’an. Finally, the possible mechanism by which cloud microphysical processes influenced the extreme rainfall was studied. The main conclusions are:
(1) There was positive feedback between the mesoscale cloud environment and cloud microphysical processes. The center of cloud ice and snow mixing ratios corresponded to the center of the positive perturbation potential temperature within the cloud, suggesting that the diabatic heating process was related to latent heat release due to the conversion of ice phase particles, which facilitated updraft and rainfall.
(2) Snow conversion was the most important process of this heavy rainfall incident. Psmlt was the most significant rainfall production in cloud microphysical conversions. Pra and Pgmlt also contributed to the production of rainfall but significantly less than Psmlt. Prds was the main heating process of the cloud environment, which can enhance updraft and produce positive feedback to other microphysical processes in clouds.
(3) Heavy rainfall in arid regions of China is generally the consequence of the confrontation between northern and southern air masses, where there is mostly dry and cold air intrusion leading to relative saturation. This precipitation is mostly cold-type precipitation and mainly manifested by snow-dominated cloud microphysical processes producing deep convection. Heavy rainfall in monsoon regions of China is mostly warm-type precipitation which needs a high wet and warm environment, mainly manifested by graupel-dominated cloud microphysical processes.
The raw data supporting the conclusion of this article will be made available by the authors, without undue reservation.
JX: responsible for logical construction, numerical simulation, analysis of pictures and mechanism, and writing of full text. FP: responsible for proposing primary logical idea of the paper, as well as choosing the topic and research direction of the paper, and providing the observational data to verify simulation. JL: responsible for processing data from radar data in articles, and interpolation and then image presentation. HD: responsible for providing ideas and directions for the analysis of cloud microphysical mechanisms after the article. All authors contributed to the article and approved the submitted version.
The authors declare that the research was conducted in the absence of any commercial or financial relationships that could be construed as a potential conflict of interest.
All claims expressed in this article are solely those of the authors and do not necessarily represent those of their affiliated organizations, or those of the publisher, the editors, and the reviewers. Any product that may be evaluated in this article, or claim that may be made by its manufacturer, is not guaranteed or endorsed by the publisher.
Anthes, R. A., Kuo, Y. H., Benjamin, S. G., and Li, Y. F. (1982). The evolution of the mesoscale environment of severe local storms: Preliminary modeling results. Mon. Weather Rev. 110 (9), 1187–1213. doi:10.1175/1520-0493(1982)110<1187:teotme>2.0.co;2
Bi, G., Liu, Y. W., and Li, Z. C. (2006). Study on the influence of Qinling Daba Mountain topography on heavy precipitation in southern Shaanxi [J]. Highl. Meteorol. 25 (3), 485–494.
Chen, Y., Ping, F., Zhou, S., Shen, X., and Sun, Y. (2021). Influence of microphysical processes on the initiation of the mesoscale convective system of a rainstorm over Beijing. Atmos. Res. 254, 105518. doi:10.1016/j.atmosres.2021.105518
Chen, Y. H. (2021). Influence of cloud microphysical processes on the triggering of convection systems in the Beijing. Nanjing: Nanjing University of Information Engineering, 7–20. rainstorm [D]. doi:10.27248/d.cnki.gnjqc.2021.000240
Ding, S., Xiao, T. G., Wang, W. B., Tong, M. W., Ren, X. Y., Gu, X. R., et al. (2018). “Analysis of Doppler radar storm identification techniques in Yan'an area [J],” in The 35th Annual Meeting of the Chinese Meteorological Society S25 Graduate Student Forum.
Dong, X., and Li, J. (2022). Simulations of an extreme rainstorm event (1056.7 mm/day) along the South China coast: The effect of single- and double-moment cloud microphysics schemes on precipitation. J. Atmos. Solar-Terrestrial Phys. 230, 105852. doi:10.1016/j.jastp.2022.105852
Fan, J. W., Zhang, R. Y., Li, G. H., and Tao, W. K. (2007). Effects of aerosols and relative humidity on cumulus clouds. J. Geophys. Res. 112 (D1420), D14204. doi:10.1029/2006jd008136
Fu, C., Liu, W. C., Song, X. Y., Xu, L. L., Sha, H. E., Ma, L., et al. (2022). Convective environmental characteristics of an extreme rainstorm with enhanced localization in the Northwest Arid Zone[J]. Arid. Meteorol. 40 (06), 909–921.
Gao, S. T., Cui, X. P., Zhou, Y. S., and Li, X. F. (2005). Surface rainfall processes as simulated in a cloud-resolving model. J. Geophys. Res. (D10202), 110.
Glisan, J. M., Gutowski, W. J., Cassano, J. J., and Higgins, M. E. (2013). Effects of spectral nudging in WRF on arctic temperature and precipitation simulations. J. Clim. 26 (12), 3985–3999. doi:10.1175/jcli-d-12-00318.1
Guo, X. L., Niino, H., and Kimura, R. (1999). “Numerical modeling on a hazardous microbust-producing hailstorm,” in Towards Digital Earth Proceedings of the International Symposium on Digital Earth, Beijing (Beijing: Science Press), 383–398.1
He, G. X. (2012). Study on velocity decluttering of new generation Doppler weather radar in China [D]. Nanjing: Nanjing University of Information Engineering.
Hjelmfelt, M. R., Robert, R. D., Orville, H. D., Chen, J. P., and Kopp, F. J. (1989). Observational and numerical study of a microburst line-producing storm. J. Atmos. Sci. 46, 2731–2744. doi:10.1175/1520-0469(1989)046<2731:oansoa>2.0.co;2
Huang, J., and Zhang, Q. (2012). Numerical simulation of mesoscale atmosphere and its progress [J]. Arid Zone Res. 29 (2), 273–283.
Ji, L. (2019), Numerical simulation of laminar cloud phase change latent heat nudging assimilation in high resolution WRF model. Beijing: Beijing Institute of Urban Meteorology, 03–27.
Jing, Y., Xu, J. J., Du, L. L., and Wang, J. P. (2019). Application of topographic gravity wave drag parameterization scheme to an extreme rainstorm weather process in Shaanxi [J]. Shaanxi Meteorol. (5), 16–22.
Kong, X. W., Tao, J. H., Liu, Z. G., Fu, C., and Ji, H. M. (2015). Analysis of extreme rainstorm cases in the west-central arid zone of the Hexi Corridor [J]. Highl. Meteorol. (1), 70–81.
Li, C., Deng, Y., Cui, C., Wang, X. F., Dong, X. Q., and Jiang, X. W. (2020). Hydrometeor budget of the Meiyu frontal rainstorms associated with two different atmospheric circulation patterns[J]. J. Geophys. Res. Atmos. 125 (16), 031955.
Li, J., Wu, K., Li, F., Chen, Y., Huang, Y., and Feng, Y. (2017). Effects of latent heat in various cloud microphysics processes on autumn rainstorms with different intensities on Hainan Island, China. Atmos. Res. 189, 47–60. doi:10.1016/j.atmosres.2017.01.010
Li, N., Ran, L. K., Jiao, B. F., Chang, Y. Z., and Xie, Y. (2022). Study on the organizing mechanism of heavy rainfall in the dry zone of Western South Xinjiang based on the wave action equation[J]. Atmos. Sci. 46 (06), 1557–1576.
Liu, P., Tsimpidi, A. P., Hu, Y., Stone, B., Russell, A. G., and Nenes, A. (2012). Differences between downscaling with spectral and grid nudging using WRF. Atmos. Chem. Phys. 12 (8), 3601–3610. doi:10.5194/acp-12-3601-2012
Mao, J., Ping, F., Yin, L., and Qiu, X. (2018). A study of cloud microphysical processes associated with torrential rainfall event over beijing. J. Geophys. Res. Atmos. 123 (16), 8768–8791. doi:10.1029/2018jd028490
McCollum, J. R., Gruber, A., and Ba, M. B. (2000). Discrepancy between gauges and satellite estimates of rainfall in equatorial africa. J. Appl. Meteorology Climatol. 39 (5), 666–679. doi:10.1175/1520-0450-39.5.666
Morrison, H., Milbrandt, J. A., Bryan, G. H., Ikeda, K., Tessendorf, S. A., and Thompson, G. (2015). Parameterization of cloud microphysics based on the prediction of bulk ice particle properties. Part II: Case study comparisons with observations and other schemes. J. Atmos. Sci. 72 (1), 312–339. doi:10.1175/jas-d-14-0066.1
Schumacher, R. S., and Johnson, R. H. (2005). Organization and environmental properties of extreme-rain-producing mesoscale convective systems. Mon. weather Rev. 133 (4), 961–976. doi:10.1175/mwr2899.1
Song, H. J., Sohn, B. J., Hong, S. Y., and Hashino, T. (2017). Idealized numerical experiments on the microphysical evolution of warm-type heavy rainfall. J. Geophys. Res. Atmos. 122 (3), 1685–1699. doi:10.1002/2016jd025637
Takahashi, T., Kawano, T., and Ishihara, M. (2015). Different precipitation mechanisms produce heavy rain with and without lightning in Japan. J. Meteorological Soc. Jpn. Ser. II 93 (2), 245–263. doi:10.2151/jmsj.2015-014
Takahashi, T. (2006). Precipitation mechanisms in east Asian monsoon: Videosonde study. J. Geophys. Res. Atmos. 111 (D9), 09202. doi:10.1029/2005jd006268
Wang, W. Y., Yin, H. T., Zhao, J. H., and Dou, C. W. (2018). Test and evaluation of 2014-2016 numerical precipitation forecast in Tianjin [J]. Meteorological Sci. Technol. 4.
Yin, L., Ping, F., Mao, J., and Jin, S. (2023). Analysis on precipitation efficiency of the “21.7” henan extremely heavy rainfall event. Adv. Atmos. Sci. 40 (3), 374–392. doi:10.1007/s00376-022-2054-x
Zhang, H., Hou, J. Z., Qiao, J., Xia, J., and Zhao, Q. (2011). Predicting As, Cd and Pb uptake by rice and vegetables using field data from China. Disaster Sci. 26 (1), 70–78. doi:10.1016/s1001-0742(10)60375-0
Zhao, Q., Wang, J. P., Wang, N., and Dai, C. M. (2017a). Diagnosis of topographic effects of heavy rainfall processes in the Qinba Mountains in the summer 2012[J]. Meteorological Sci. Technol. 45 (1), 139–147.
Zhao, Q., Wang, N., Li, P. Y., and Qu, L. W. (2017b). Diagnosis of thermodynamic mechanisms during two heavy rainstorms in northern Shaanxi[J]. Appl. J. Appl. Meteorology 28 (3), 340–356.
Zhao, S. M., Zuo, H. C., Guo, Y., Dong, L. X., Zhu, Y., and Yang, Y. L. (2016). Comparative analysis of different combinations of parameterization schemes of WRF model for primary rainstorm simulation in arid zones [J]. Arid Zone Res. 33 (06), 1157–1166. doi:10.13866/j.azr.2016.06.03
List of microphysical transformation terms for the Morrison 2-mom scheme.
Keywords: heavy rainfall, Yan’an, cloud-resolved numerical simulation, mesoscale environment, cloud microphysical processes
Citation: Xu J, Ping F, Li JY and Du H (2023) A study of cloud microphysical processes and a mesoscale environment in a heavy rainfall case over Yan’an. Front. Earth Sci. 11:1149856. doi: 10.3389/feart.2023.1149856
Received: 23 January 2023; Accepted: 24 May 2023;
Published: 19 June 2023.
Edited by:
Chenghai Wang, Lanzhou University, ChinaCopyright © 2023 Xu, Ping, Li and Du. This is an open-access article distributed under the terms of the Creative Commons Attribution License (CC BY). The use, distribution or reproduction in other forums is permitted, provided the original author(s) and the copyright owner(s) are credited and that the original publication in this journal is cited, in accordance with accepted academic practice. No use, distribution or reproduction is permitted which does not comply with these terms.
*Correspondence: Fan Ping, cGluZ2ZAbWFpbC5pYXAuYWMuY24=
Disclaimer: All claims expressed in this article are solely those of the authors and do not necessarily represent those of their affiliated organizations, or those of the publisher, the editors and the reviewers. Any product that may be evaluated in this article or claim that may be made by its manufacturer is not guaranteed or endorsed by the publisher.
Research integrity at Frontiers
Learn more about the work of our research integrity team to safeguard the quality of each article we publish.