 Hongli Pang
 Yunxia Jia
 Fuqiang Li4
 Lin Qin
- 1Department of Tourism Management, Shanghai Maritime University, Shanghai, China
- 2Key Laboratory of Desert and Desertification, Northwest Institute of Ecological Environment and Resources, Chinese Academy of Sciences, Lanzhou, Gansu, China
- 3School of Geographical Science, Shanxi Normal University, Shanxi, China
- 4College of Resources and Environment, Gansu Agricultural University, Lanzhou, Gansu, China
- 5Key Laboratory of Western China’s Environment System (Ministry of Education), College of Earth, and Environmental Science, Lanzhou University, Lanzhou, Gansu, China
Fluvial deposits represent a sedimentary archive of paleohydrological information, which can be utilized to reconstruct unrecorded floods. A multi-index (grain size, end-member model, and geochemistry elements) approach of core sediments from the upper Yellow River was used to reconstruct its flood history. A high-resolution geochemical profile of the 20.71-m-deep core was obtained by an XRF core scanner. A comparison of sediment grain size with geochemical element ratios indicated that ln(Zr/Ti) can be used as a grain size proxy for the core sediment. Combined with the end-member modeling analysis, the flood energy index (FEI) was constructed to highlight the flood signals and their similar trends with sediment ln(Zr/Ti). Coarsened grain size and increased ln(Zr/Ti) suggested that a high-frequency flood phase appeared to occur in the early Holocene (11–6.5 ka) and late Holocene (3.5–0 ka), while low-frequency floods occurred in the middle Holocene (6.5–3.5 ka). An extreme hydrological phase occurred during 5.8 ka–5.9 ka, which coincided with a sharp increase in sedimentation rates from 0.14 mm/yr to 0.48 mm/yr. The flood activities at the upper reach of the Yellow River are considered to respond to climate variability with the monsoonal shift.
1 Introduction
Long flood series are essential for improving predictions of responses to future warming scenarios (IPCC, 2013). However, establishing climate controls on flood events is challenging due to the short time of gauge records or historical documents (Munoz et al., 2018). Paleoflood hydrology (Baker, 1987), using geological evidence to extend flood records by hundreds to thousands of years, can be used to explore flood dynamics under different climate conditions (Knox, 1993).
The most widely employed technique for reconstructing paleoflood events is the identification of slackwater deposits (SWD) (Baker, 1987). These deposits are typically fine-grained sand and silt that accumulate rapidly from suspension during major floods in slackwater areas where the current velocity is reduced and are generally characterized by obvious changes in grain size (Huang et al., 2012). However, these sediments are generally scattered in arid and semiarid areas and are difficult to compile into continuous paleoflood series (Jones et al., 2012). Furthermore, only major floods exceeding a certain magnitude with clearly discernible flood layers can be preserved (Baker, 1987). As a result, developing additional, sensitive flood proxies is urgently required to provide a basis for deciphering flood series of secular magnitude (Jones et al., 2012).
Studies of alluvial river systems have demonstrated that the grain size can be used to reconstruct flood series. This assumption is based on the premise that high-velocity flood flows can transport coarser materials, which is also evidenced by a direct correlation between gaged peak discharges and coarse grain-size components (Toonen et al., 2015). A series of grain size indexes have been used for reconstructing flood histories from fluvial deposits including coarse end-member component (Parris et al., 2010; Peng et al., 2019), 90th percentile (Chiverrell et al., 2019), P95 (Aloserij, 2013), mean grain size (Toonen et al., 2015), and sand fraction (Werritty et al., 2006; Lim et al., 2013). However, the centimeter-scale flood series inferred from grain size falls short in capturing flood events without visible strata in the finer-grained floodplain (Jones et al., 2012). The grain size variation of core sediments with depth during a flood was still explicit in fine-grained alluvial rivers, where a limited number of coarse grains are conveyed to an inundated floodplain without preserving a thick coarse-grained layer (Maas et al., 2001; Knox, 2003). Thus, millimeter-scale non-destructive geochemical element parameters have been employed as a substitute for grain size proxies to distinguish paleoflood events, e.g., Si/Al (Calvert et al., 2001), Ti/Al (Calvert et al., 1996), Zr/Al (Schneider et al., 1997), Zr/Ti (Jones et al., 2012; Schulte et al., 2015), Zr/Fe (Wilhelm et al., 2013), and Zr/Rb (Dypvik and Harris, 2001; Kylander et al., 2011; Lintern et al., 2016; Schillereff et al., 2014). Although such a proxy-to-proxy calibration may introduce uncertainties, this approach has been successfully deployed in many environmental settings and, thus, serves as the threshold of flood layer detection in fluvial sequences (Wilhelm et al., 2018).
The Yellow River has had frequent flood disasters since ancient times. Previous scholars have used the method of identifying slackwater deposits to infer the discharge and magnitudes of floods at the Yellow River (Huang et al., 2011; Liu et al., 2014). Although the variations in grain size and geochemical composition of sediment in response to flood events in bedrock channels have been discussed, these properties have rarely been applied to reconstruct long timescale paleoflood records in the sandy reaches of the upper Yellow River. The Hetao Plain is located in the tectonic subsidence area of the upper Yellow River, which has received abundant sediment since the Quaternary, recording a wealth of paleo-environment information. This section lies in the transition zone of arid and semi-arid climate, and the river deposits are very sensitive to climate change; therefore, they could be a good carrier for the reconstruction of the paleoflood series of the Yellow River. This study aimed to analyze the suitability of the geochemical indicators as grain size proxies for the core sediment and, thus, explore the links between paleoflood and climate changes on a long time scale.
2 Geographic and geological setting
The Yellow River flows through the Hetao Plain from Dengkou to Sanhuhekou in the upper reach, with a length of 214 km and a width ranging from 500 m to 2500 m. The Hetao Plain section of the Yellow River is surrounded by the Ordos Plateau to the south, the Ulan Buh Desert to the west, and the Ural Mountains to the east (Figure 1). After Dengkou, the gradient of the river rapidly decreases to 1.3‰ and the coarse-grained sediment accumulated in the channel is controlled by decreased flow velocity. Many deserts are distributed on both sides of the Yellow River including the Ulan Buh Desert and Kubq Desert. Well-preserved ancient channel relics such as paleochannel and oxbow lakes are widely distributed (Li et al., 2003).
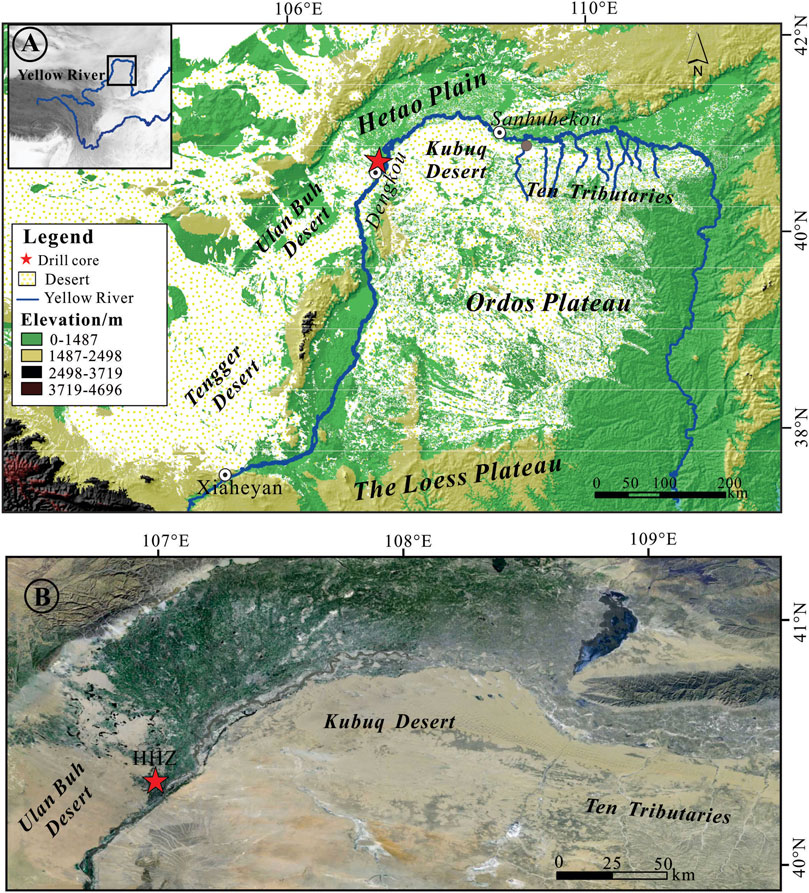
FIGURE 1. Location of the study area and drill core. (A) The Hetao Plain study area. (B) Local location of the HHZ drill core.
Tectonically, the Hetao Plain is a Cenozoic fault-subsiding basin located between the Yinshan fault block and Ordos block (Deng et al., 2009), and controlled by the Langshan Piedmont fault and Ural Mountain Piedmont fault in the east–west direction (Yang et al., 2018). It is a composite basin and contains a series of faults. The Oligocene strata mainly consist of brown, green-grayish clay and silty clay with a thickness of >1000 m. The Miocene strata mainly consist of brown clay and silty clay with a thickness of >1200 m. The Pliocene strata mainly consist of brown, yellow-grayish clay and silty clay with a thickness of >900 m. The Quaternary strata mainly consist of gray and green-grayish mudstone and yellow sandstone with a thickness ranging from 0–2500 m (Li et al., 2017).
The floodplain topography and sedimentation style are important factors for changing grain size in floodplain sediment. Therefore, the key to the reconstruction of flood records in alluvial rivers by floodplain core sediment sequences is choosing suitable floodplain sites, which are characterized by a stability channel and the dominance of vertical accretion. The channel of the Yellow River has frequently migrated seaward at the Dengkou–Sanhuhekou section during the past 2000 years. Many ancient channels have been preserved in the inundated floodplain of the Hetao basin, which is mainly characterized by straight channels and slightly meandering channels flowing NNE and NW, respectively (Li et al., 2003). Oxbow Lake distributed on the north of the Kubq desert was the abandoned channel left on the modern riverbed after the Yellow River moved northward. Embankment construction to address flood disasters has to a certain degree hindered the sediment exchange of the river bed and former distal floodplain but further accelerated the vertical accretion of fine-grained material during overbank flooding, resulting in the long-term, high-resolution preservation of flood records.
3 Materials and methods
3.1 Core preparation
A 20.71-m-long sediment core (HHZ) (40°20′11〞N, 107° 2′50〞E) was recovered from the paleoflood plain on the north bank of the modern Yellow River using an XY-4 geological exploration drilling machine (Huanghai Machinery Factory, Lianyungang, China). The length of the recovered core was 18.6 m, with a recovery rate of 89.8% (Figure 2). Core segments were encased in PVC tubes and stored in a refrigerator to prevent oxidation. In the laboratory, the core was split in half using a Core Splitter (Geotek company). The sedimentary characteristics of the fluvial deposits were described, including sediment colors, sedimentary textures, and sedimentary structures. Half of the core was used for sedimentary analysis, while the other half was prepared for XRF scanning. These experiments were completed in the Key Laboratory of Western China’s Environmental Systems (Ministry of Education), Lanzhou University.
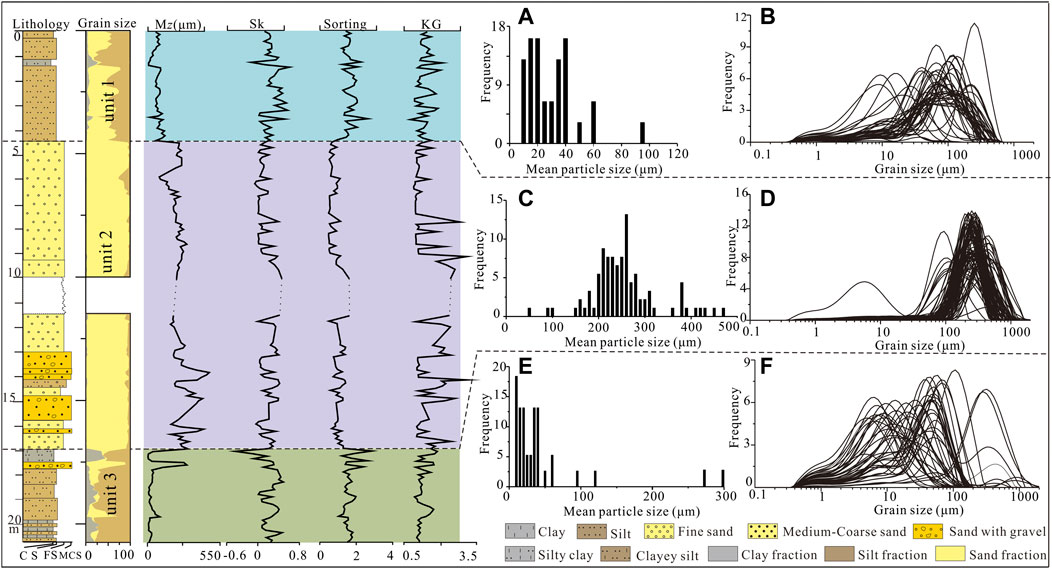
FIGURE 2. Sedimentary characteristics and grain size parameters of sediment in core HHZ. (A) Frequency distribution histogram of the mean particle size for sediments from unit 1. (B) Grain size distribution of sediments from unit 1. (C) Frequency distribution histogram of the mean particle size for sediments from unit 2. (D) Grain size distribution of sediments from unit 2. (E) Frequency distribution histogram of the mean particle size for sediments from unit 3. (F) Grain size distribution of sediments from unit 3. The dotted line of grain size parameters represents missing samples. FS = fine sand, MCS = medium and coarse sand.
3.2 Grain size and end-member modeling analysis (EMMA)
Continuous samples were collected at 50-mm intervals and analyzed on a Mastersizer 2000 instrument (Malvern Instruments Ltd., UK; measurement range 0.02–2000 μm). Before the measurements, the bulk samples were treated with 30% H2O2 and 10% HCl to remove organic materials and carbonate, respectively. The samples were rinsed with deionized water and mixed with 0.5 N (NaPO3)6 on an ultrasonic vibrator for 10 min. Grain size composition, mean particle size (Mz), sorting coefficient (σ), and kurtosis (KG) of the sediments were calculated based on the methods described by Folk and Ward (1957).
End-member modeling analysis (EMMA) was used to decompose the grain size distribution of the sediments into a set of members based on the principles of numerical inversion, a process that has been widely used for interpreting sedimentary processes (Weltje and Prins, 2003; Vandenberghe, 2013). We obtained the grain size distributions of 172 samples and divided them into 68 particle size components for each sample at 0.13 φ intervals. The grain-size data were analyzed using the end-member model to fix the end-member loadings and their proportional contributions. End-member loadings are genetically interpretable grain-size distributions. The optimal number of end-members was identified using cumulative variance contribution (>95%) and coefficients of determination (r2 close to 1) between the original and estimated data (Dietze et al., 2012). Proportional contributions are relative contributions of different end-members for each sample, which may vary from 0 to the maximum quantile (the highest quantile is 100). The end-member modeling analysis for core HHZ was performed as described by Zhang et al. (2018).
3.3 XRF core scanning
XRF core scanning was performed on the split-core surfaces, which were slightly scraped with a razor blade to make sure they were homogeneous and smooth. After taking high-resolution color images, the split core was covered with a layer of ultralene film and measured non-destructively at the sediment surface using an Avaatech XRF (X-ray fluorescence) Core Scanner. Geochemical measurements were undertaken at 10-mm intervals under two scanning conditions (25 s, 30 kV, 2 mA and 25 s, 10 kV, 1 mA). A total of 15 elements (Al, Si, S, Cl, K, Ca, Ti, Mn, Fe, Zn, Rb, Sr, Y, Zr, and Mo) were detected and presented as element intensities.
3.4 Age-depth model
Five samples for optically stimulated luminescence (OSL) dating were collected from the fine sand unit. First, a 10-cm-long core section was cut and sampled using stainless-steel tubes in the zone of optimal preservation and then sealed with a black plastic bag or tin foil in the shade to ensure that the sample was sealed and unexposed. OSL dating was carried out in the luminescence Laboratory at China Geological University (Wuhan) using a Risø-TL/OSL-DA20 dating system. The pretreatment process was performed with reference to Li et al. (2018). The 38–63 μm class obtained by sieving was soaked in 35% H2SiF6 for 2–3 weeks, stirring multiple times every day to remove feldspar, and a small amount of 10% HCL was finally added to remove the fluoride precipitate generated during the reaction of the sample with H2SiF6 (Roberts, 2007). The single-aliquot regenerative-dose (SAR) protocol was applied to measure the equivalent dose of the quartz samples, which required that the natural and regenerative luminescence signals of the test pieces of each sample be measured, respectively, to obtain the corrected natural light and regeneration dose luminescence intensities. The effective dose rate (Dy) was calculated based on the elemental concentrations using the revised dose rate conversion factors (Adamiec and Aitken, 1998). The OSL dating was calculated using AGEexe software. All the age data are presented in Table 1 below.
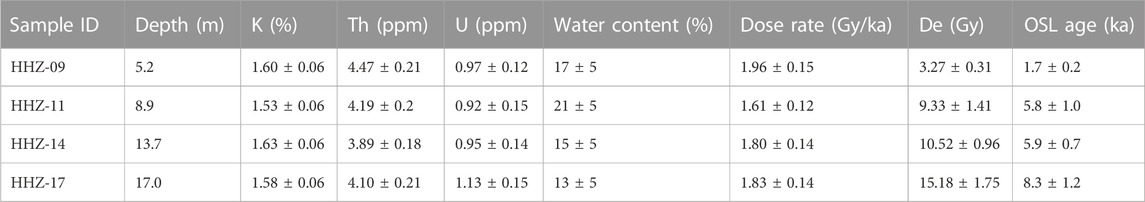
TABLE 1. OSL age of samples from HHZ.
4 Results
4.1 Lithology
Core HHZ comprised three sedimentary units from top to bottom, as follows (Figure 2):
Unit 1: 0–4.45 m. In this unit, the silt layer was intercalated with brownish-yellow, thin-bedded silty clay. The sediments mainly consisted of silt and clay, with mean particle sizes ranging from 8.9 μm to 134 μm. Furthermore, the frequency curves presented a bimodal pattern with the main peak varying from 80 μm to 100 μm. The grain size parameters of sediments showed that sediments in this unit were characterized by poor sorting, positive skewness, and flat-medium distribution.
Unit 2: 4.45–17.0 m. This unit was mainly composed of gray-green and gray-black fine sand, as well as medium–coarse sand. Some fine sand layers contained a small amount of gravel. The gravel was well rounded, with the diameter ranging from 2 mm to 5 cm. The sediments were composed of sand (94%), silt (5%), and clay fraction (1%), with the mean particle size of the sediments varying from 89 μm to 463 μm. The grain size distributions presented a bimodal pattern with a primary peak ranging from 100 μm to 500 μm and a secondary peak near 10 μm. The standard deviation values of sediments were between 0.4 and 1.4, belonging to the moderate–poor sorted. The skewness was dominated by a positive-skewed distribution, and the kurtosis mainly showed a sharp–very sharp distribution.
Unit 3: 17.0–20.71 m. This unit predominantly consisted of brownish-yellow, gray-brown silt. The silt layer was intercalated with brownish-yellow, thin-bedded silty clay. The silt content varied from 9% to 87%, while the clay content varied from 2% to 45%. The grain size distributions of representative samples from different depths showed poly-modal patterns with a dominant modal size varying from 10 μm to 100 μm. The sediments were poorly sorted, with positive skewness, and had flat-medium distributions.
4.2 End-member modeling analysis
The EMMA results showed that a four-member model explained >90% of the total variance of the GSD dataset. The grain size distributions of four end-members were unimodal patterns with different modal sizes (Figure 3A). The EM1 (End-Member 1) was the finest and had a mode at 10 μm (Figure 3B). The modes of EM2 and EM3 were coarser than those of EM1 and have the modes at 74 μm and 221 μm, respectively. The coarsest was labeled EM4 with a mode at 409 μm. The scores of four End-Members varied with the change of depth. In unit 1, EM2 was dominant through the core (54.5%), and the following were EM1 and EM3 accounting for 26.7% and 18.4%, respectively. The EM3 and EM4 were enriched in unit 2, and the average percent was 57.3% and 31.4%, respectively. In unit 3, the total contribution of EM1 and EM2 was 93.7%, larger than that of EM3 and EM4 (Figure 3C).
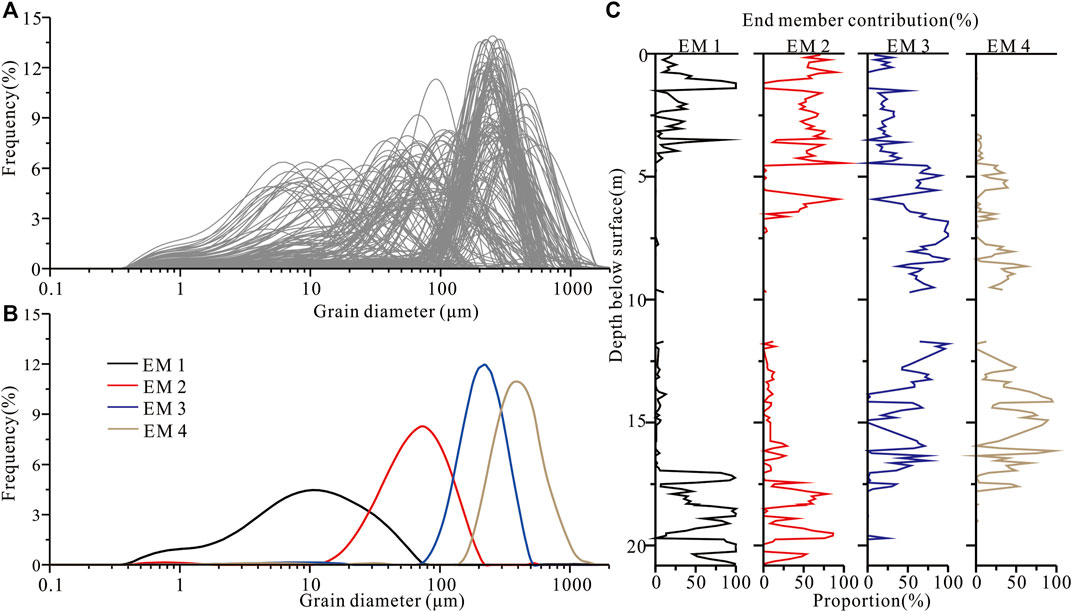
FIGURE 3. EMMA results. (A) Grain size distribution of sediments in the HHZ. (B) The four end-members (EMs) according to the EMMA. (C) Contributions of the four end-members with depth.
4.3 High-resolution elements obtained by XRF core scanning
The XRF core scanning technique was limited by a few factors (e.g., surface roughness, water content, and cracks); thus, this analysis only provided semi-quantitative element concentrations. Fifteen chemical elements were detected by the XRF core scanner in terms of peak areas: Al, Si, S, Cl, K, Ca, Ti, Mn, Fe, Zn, Rb, Sr, Y, Zr, and Mo. Those elements can be further classified into three groups based on the scanning peaks. Group I contained Al, Si, K, Ca, Ti, Fe, Zn, Rb, Sr, Y, and Zr, which are characterized by high peaks compared to the background. Group II included Cl, S, and Mo. The Cl in the spectrogram was influenced by the water content from the scanning core surface, while the S and Mo showed a low peak near the background value. Group III contained Mn, which was closely related to the filaments in the X-ray tube. Thus, we suspected that four elements (Cl, S, Mo, and Mn) from groups II and III could not be accurately detected by the XRF core scanner. We analyzed the correlations between the grain size component and various elements (Figure 4). The statistical analysis showed good positive linear relationships (0.663 < r2 < 0.812) between the clay component and K, Ca, Ti, Fe, and Rb, while the correlation with Zr was poor (r2 =0.07). On the contrary, the sand component was negatively correlated with K, Ti, Ca, Fe, and Rb. Only Zr was positively related weakly with the silt component (r2 =0.43).
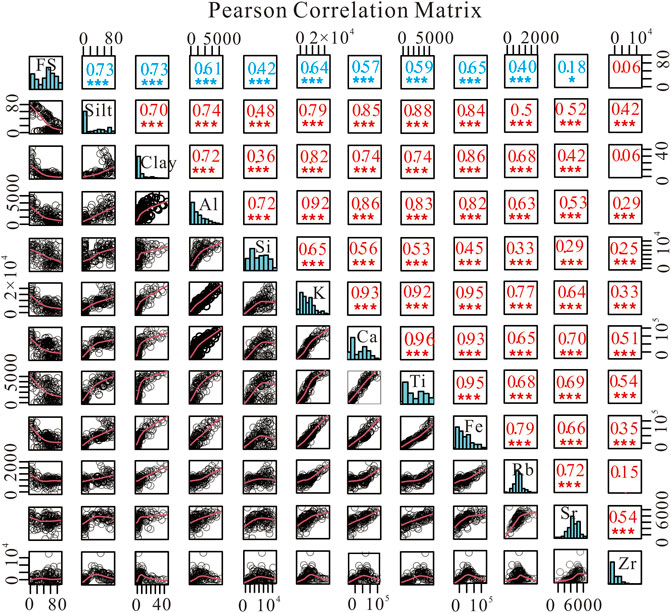
FIGURE 4. Correlations between chemical elements detected by XRF scanning and grain size components with a down-section variation.
5 Discussion
5.1 Comparison of paleoflood proxies
The grain size characteristics of sediment are often used to reconstruct paleoflood sequences in sedimentary strata. The hypothesis is that the flood could produce high-energy hydrodynamic conditions, which lead to changes in particle size of the transported sediment and sediment flux (Gilli et al., 2013). Due to the small resolution of grain size analysis, non-destructive, high-resolution element ratios as indicators of grain size have been widely used to identify paleoflood information (Jones et al., 2012). To select the optimal element ratio suitable for paleoflood analysis in the HHZ core, the correlation between grain size and chemical element ratios was analyzed. First, when XRF core scanning technology is applied, the water content of fluvial deposits will cause larger errors in elements Al and Si, while Zr, Ti, Fe, and Rb, with large atomic masses, are unaffected (Richter et al., 2006; Tjallingii et al., 2007). Furthermore, zirconium is enriched in coarse-grained minerals such as zircons with strong weathering resistance (Fralick and Kronberg, 1997), while titanium and iron are associated with fine-grained fractions (Kylander et al., 2011; Wilhelm et al., 2013). Similarly, rubidium is found in a range of potassium-containing minerals including feldspar, mica, and clay minerals (Dypvik and Harris, 2001; Chen et al., 2006). Therefore, increasing element ratios of Zr/Rb (Jones et al., 2012), Zr/Ti (Schulte et al., 2015), and Zr/Fe (Wilhelm et al., 2013) are associated with increased grain size and even stronger flood scales. However, the enrichment degree of elements in certain grain size components will also vary due to changes in sedimentary environments, source materials, and transport distances (Dypvik and Harris, 2001). Considering the rigorous statistical analysis of compositional data, the log-ratios of element intensities were applied to solve the problem of potentially unreliable measurements (Weltje and Tjallingii, 2008). Then, the Zr/Rb log-ratios, Zr/Ti log-ratios, and Zr/Fe log-ratios were used to verify the suitability of Zr/Rb, Zr/Ti, and Zr/Fe as proxies for geochemical grain size. The correlation analysis showed a poor linear relationship between ln(Zr/Rb) and the clay fraction (Figure 5A). On the contrary, the ln(Zr/Ti) showed a negative correlation with the clay component (r2=0.522) and a positive correlation with the sand fraction (r2=0.601) (Figure 5B). There is also a good correlation between ln(Zr/Fe) and clay fraction (r2=0.603) and a weak correlation with the sand component (r2=0.445) (Figure 5C). The reason for the poor correlation between ln(Zr/Rb) and grain size could be the variation in particle sizes. With increasing coarse-grained sediment, the larger particle gap and cracks lead to the gradually poor correlation between the Zr/Rb element concentration and grain size. Nevertheless, the heterogeneity showed little effect on elements Fe and Ti. Therefore, a higher correlation coefficient between ln(Zr/Ti) and grain size indicated that the Zr/Ti log-ratio should be a suitable paleoflood proxy for the HHZ core.
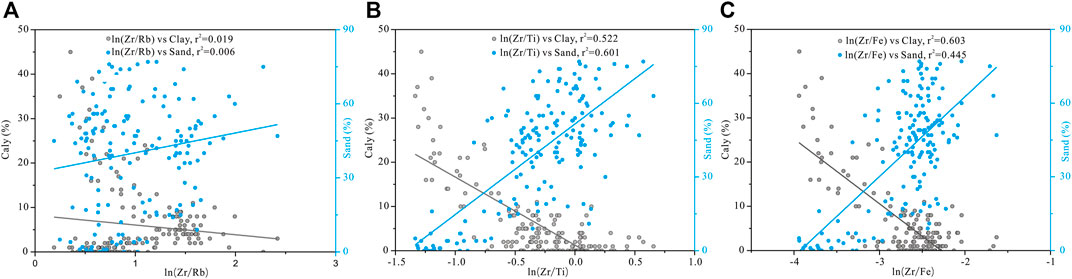
FIGURE 5. Correlations between grain size parameters and chemical element ratios. (A) ln(Zr/Rb) vs. Clay and ln(Zr/Rb) vs. Sand; (B) ln(Zr/Ti) vs. Clay and ln(Zr/Ti) vs. Sand; (C) ln(Zr/Fe) vs. Clay and ln(Zr/Fe) vs. Sand.
5.2 Reconstruction of Holocene paleofloods
The link between coarse-grained components and variations in flood magnitude was recently explicitly applied in paleohydrological research (Macklin et al., 1992; Maas et al., 2001; Knox, 2003). MS, P95, and coarsest end members indicated that significant differentiation occurs between different flood magnitudes and were widely used to describe the coarse tail of the grain-size distribution (Toonen et al., 2015; Munoz et al., 2018). However, the significant variation in the percentage of coarse fraction mainly occurred and was preserved in high-magnitude floods, and was difficult to detect in minor floods or edges of the floodplains in alluvial rivers. Although two coarser end-members were obtained from the fluvial deposit in core HHZ, it was still necessary to judge whether they were produced by floods, as those coarse particles were also caused by channel migration. For the reconstruction of paleoflood history, the hypothetical premise was that the river channel was relatively stable and the structure was not obvious; however, the method of using the coarser end-members index alone was not necessarily accurate for this site. The correlation between grain size and end-member score displayed that except for EM2 (r2 =0.1961) (Figure 6B), EM1, EM3, and EM4 were positively correlated with the clay (r2 =0.816), fine sand (r2 =0.6541), and medium–coarse sand (r2 =0.8494) fractions, respectively (Figures 6A, C, D). According to previous research (Erkens et al., 2013), the different grain size distribution of EM1–EM2 in comparison to EM3–EM4 indicates that EM1–EM2 represents a different transport process than EM3–EM4. We interpreted the finer EM1 and EM2 as suspended load and wash load populations for the fluvial sediments, and coarser EM3 and EM4 as bed load components. The grain size composition of modern sediments in the upper Yellow River showed that the main fractions of the floodplain sediments were 3.9–63 μm (Pang et al., 2015). The mode of EM1 is 10 μm; thus, we believed that the differences in sedimentary transport processes between different flood magnitudes were limited. However, the EM2 had a mode at 74 μm, with particle sizes ranging from the silt to very fine sand, which indicated that these particles were deposited in the channel during normal flow or in suspension during floods, and were linked to the peak charge during floods. For the coarser EMs (EM3 and EM4), it is difficult to exclude the influence of aeolian sand, although the use of the ratio of the coarsest bed load end members is reasonable. Thus, the relative contribution of coarse grains in flood deposits instead of a coarser end-member score was more suitable for the reconstruction of paleoflood records. Here, the flood energy index (FEI) was used to highlight the flood signals contained within the suspended load fractions during flood phases (Peng et al., 2019; 2020).
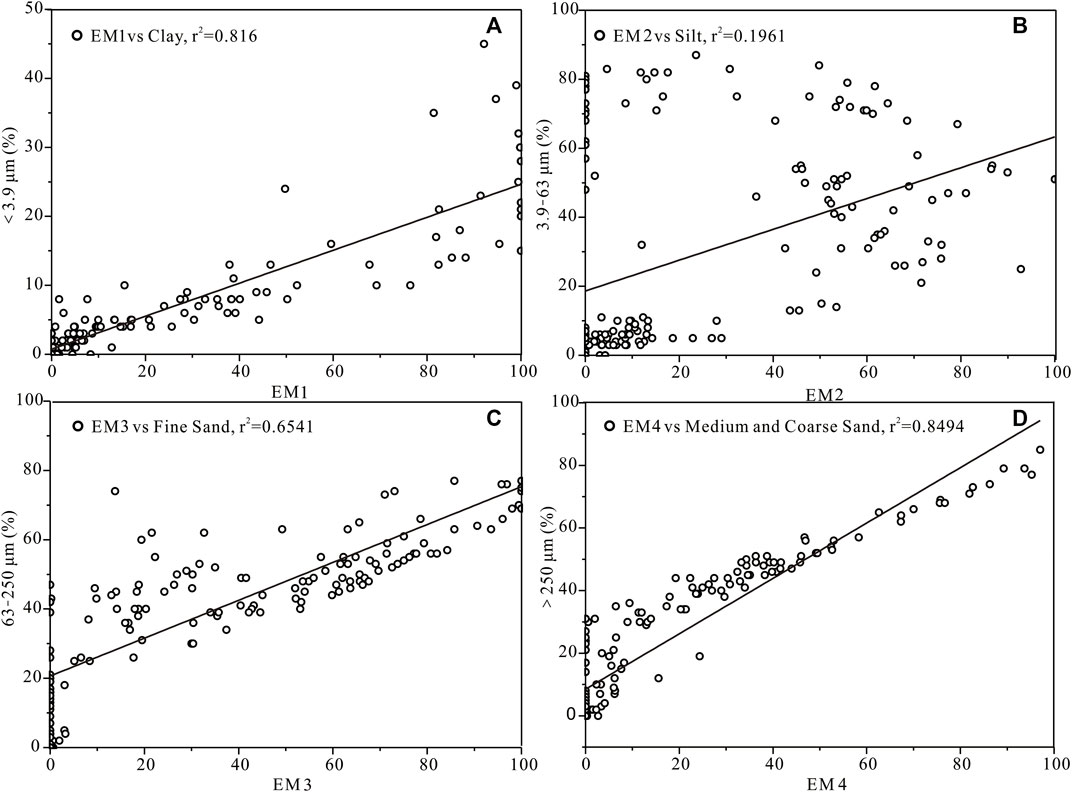
FIGURE 6. Correlations between grain size components and endmember scores. (A) EM1 vs Clay; (B) EM2 vs Silt; (C) EM3 vs Fine Sand; (D) EM4 vs Medium-Coarse sand.
Figure 7 shows the variation in FEI and ln(Zr/Ti) with core depth. In unit 3, the ln(Zr/Ti) and FEI values were both relatively low (Figures 7C, D). From unit 3 to unit 2, the grain size displayed a coarsened upward trend and the FEI and ln(Zr/Ti) increased steadily. In unit 2, the ln(Zr/Ti) and FEI maintained relatively high values during 7.8 ka–5.9 ka, with both indexes indicating a high energy flood condition. During 5.9 ka–5.8 ka, the FEI could not be calculated by end-member analysis because almost 1.7 m of core sediment was lost. The upward trend of ln(Zr/Ti) indicated a consistently high-energy flood environment. A significant change occurred after 5.8 ka, and the low FEI was consistent with the decreased ln(Zr/Ti). The FEI then drastically increased as the trend of ln(Zr/Ti) showed a slight increase. From unit 2 to unit 1, ln(Zr/Ti) showed a decreasing trend, and FEI showed a large fluctuation at 1.7 ka. A consistency in FEI and ln(Zr/Ti) was observed in unit 1, in which the low flood condition indicated by ln(Zr/Ti) was also observed in the FEI index at a depth of 1.4 m. Therefore, similarity existed between the ln(Zr/Ti) profile and FEI, although the detailed amplitude of fluctuation had some remarkable difference, suggesting that the sediment ln(Zr/Ti) is also sensitive to the flood magnitude.
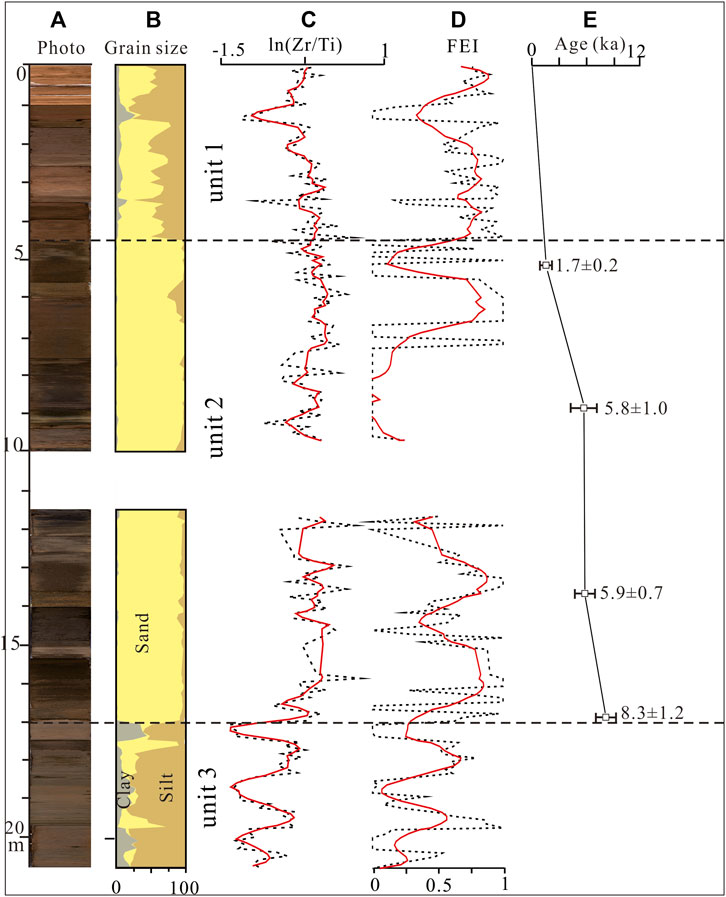
FIGURE 7. (A) High-resolution photo. (B) Grain size composition of the core sediments in core HHZ; (C) ln(Zr/Ti) values along the depth. (D) Flood energy index (FEI= EM2/(EM1+EM2)). The dotted black lines are raw data, and solid red lines are processed curves by using a locally estimated scatter plot smoothing method to prevent undue emphasis on single data; (E) Age profile of the sediments.
5.3 Holocene paleoflood phases
The profile of ln(Zr/Ti) was used to construct a record of Holocene flooding at the upper Yellow River (Figure 8). The primitive values of ln(Zr/Ti) were normalized with the movement to remove the long-term trends in sediment composition resulting from catchment-local geomorphic processes (Figure 8A) (Munoz et al., 2018). The profile of ln(Zr/Ti) showed significant variations with depth, with two large peaks present at almost 2.5 ka and 6 ka, respectively. The moving mean was used as a threshold for deriving the flood deposition series. Many peaks remained in the ln(Zr/Ti) profile after eliminating the underlying trend by setting the ln(Zr/Ti) value below the threshold to zero. We then further identified major flood magnitudes that exceeded the high pass moving mean with a threshold exceedance of 0.2 (Figure 8B). Existing studies successfully matched major ln (Zr/Ti) peaks to the high-magnitude historical floods (Jones et al., 2012). Due to the missing core, measurement error, and limited age data, some gaps were present in the sedimentary profile along the distance. Therefore, the profiles of ln(Zr/Ti) at core HHZ were considered to exactly reflect flood frequency and flood phase instead of special flood events.
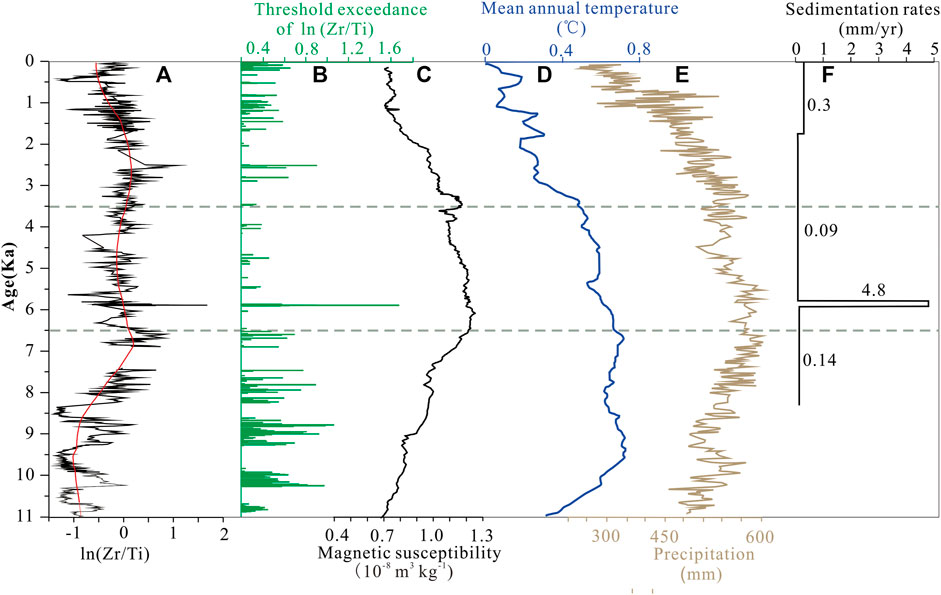
FIGURE 8. Comparison of the reconstructed flood record and Holocene climate indexes. (A) Downcore changes in ln(Zr/Ti). The red line is the moving mean value. (B) Major flood peaks identified based on the threshold. (C) Magnetic susceptibility on the Chinese Loess Plateau (Kang et al., 2020). (D) Reconstructed mean annual temperatures from 30–60°N (Kaufman et al., 2020). (E) Reconstructed precipitation from Lake Gonghai (GH) in northern China (Chen et al., 2015). (F) Sedimentation rate of the sediment in core HHZ. RT2,T1 = (H2-H1)/(T2-T1), where R is the sedimentation rate, T1 is the OSL age of sample 1, and H1 is the burial depth of sample 1 (Xu, 2007).
Climate change plays an important role in flood and river hydrology (Redmond et al., 2001). Under the condition of warming, with increases in atmospheric temperature and water vapor content, extreme hydrological events occur frequently (Knox, 2000). Variations in climatological dry and wet conditions are also key factors affecting flood activities (Vandenberghe, 2002). However, the relationship between climate and flood activities remains controversial at different time scales, such as weakening in the middle Holocene and strengthening in the early and late Holocene (Huang et al., 2007), or weakening in the early Holocene (Knox, 1985) and early–middle Holocene (Støren et al., 2010). Moreover, the variations in different regions at the same scales are still debated (Saint-laurent, 2004; Wilhelm et al., 2013; Benito et al., 2015). Our study compared the reconstructed paleoflood sequence with regional environmental indicators (Figure 8). During the early Holocene (11–6.5 ka), the climate was variable based on the temporal dissimilarity of the paleoclimatic records in the EASM-associated region in China (Zhang et al., 2021) and reconstructed precipitation from Lake Gonghai (GH) in northern China (Chen et al., 2015). The high flooding phase in this period was in response to higher climate fluctuation, and previous studies support these interpretations (Li et al., 2019; Peng et al., 2019).
In the period from 6.5 ka to 3.5 ka, the ln(Zr/Ti) was characterized by a low value and small frequency, indicating that the flood activity was low. The missing samples, more fluctuating flood regimes, and higher sedimentation rates indicated unstable hydroclimatic conditions. The dominance of palaeosol (Li et al., 2014), Daihai Lake (Xu et al., 2010), and north-central China (Herzschuh et al., 2019), and the high value of magnetic susceptibility (Lu et al., 2013; Kang et al., 2020) suggested warm–wet climate conditions during the Middle Holocene. Although the precipitation was relatively reduced due to the weakening of the East Asian summer monsoon, the uniform distribution of rainfall throughout the year may have led to less extreme events. Notably, a high-magnitude flood was observed during 5.9–5.8 ka, and the sedimentation rate reached 4.8 mm/yr (Figure 8F). This period corresponded to the Holocene Climate Optimum, which was characterized by relatively wet and warm climate conditions (Wanner et al., 2008). Based on the study of the accumulation rate in the North China Plain (Xu, 2007), the sediment accumulation was <4 mm/yr during 6–5 ka. The abrupt change in sedimentation rate may reflect an extreme hydrology phase. The core record from the Ulan Buh Desert revealed that a series of wetlands dried up and the modern Ulan Buh Desert landscape formed after 7 ka (Chen et al., 2014). The widespread desert would increase the volume of sediment in the channel of the Yellow River. The period of 5–3.5 ka followed the termination of the Holocene Climatic Optimum and a dryer and cooler climate phase resulted in a low discharge regime in the Yellow River, further suppressing flooding phases. This finding is in agreement with the flood–climate interaction in the Swiss Alps over 2600 yr (Schulte et al., 2015) and the middle Yellow River (Huang et al., 2007).
In the late Holocene (3.5–0 ka), the flood frequency increased and the sedimentary rate increased from 0.09 mm/yr to 0.3 mm/yr, suggesting that the floods intensified again. The late Holocene is a period characterized by cool–dry climate conditions in the north of China resulting from the weakening of the East Asian monsoon. Studies have also shown that the flooding deposits were widespread in the Yellow River during the late Holocene (Sun et al., 2019), including the Beiluohe River (Li et al., 2019), upper Yellow River (Huang et al., 2013), Yongding River (Zhao et al., 2017), Weihe River (He et al., 2019), Jinghe River (Huang et al., 2012), Jin-Shaan Gorges (Liu et al., 2014), Yihe River (Shen et al., 2015), Lajia Ruins (Wang et al., 2021), and Shilipu archaeological site (Yu et al., 2020). Extreme paleofloods were also common in the Yangtze River during this period; e.g., the Jinsha site (Jia et al., 2017) and Hanjiang River (Guo et al., 2015; Mao et al., 2016). Based on the aging regime for the late Holocene deposition, the ln(Zr/Ti) record revealed high-frequency floods and an accelerated sedimentary rate occurring 2000 years ago. This period most likely coincides with the Qin and Han dynasties, when population expansion and land reclamation stimulated soil erosion and desertification, and further increased the volume of sediment input to the channel. Therefore, human activity had increased significantly and, thus, to a certain degree, exacerbated the magnitude and frequency of the flood phases that occurred in the late Holocene.
6 Conclusion
The Hetao Plain, as a sedimentary geomorphic unit formed by the channel migration of the Yellow River, contains important paleohydrological information and has been regarded as an ideal place to reconstruct the paleoflood history of the alluvial plain at the upper Yellow River. In this study, a core with a length of 20.71 m was obtained from the floodplain of the upper Yellow River. A total of 15 chemical elements were detected by the XRF core scanner, and a high-resolution geochemical record of core sediments was reconstructed.
The results of this study indicated that there is a poor correlation between ln(Zr/Rb) and sediment grain size. By combining analysis with end-member modeling results, we argue that ln(Zr/Ti) may be regarded as a more sensitive grain size indicator to reconstruct paleoflood phases at this site. Based on the derived chronostratigraphic information, the age-depth model for core deposits was constructed. The variation of flood frequency and magnitude indicated that the low-frequent flood phase mainly occurred in the middle Holocene (6.5–3.5 ka), while strengthening occurred in the early Holocene (11–6.5 ka) and late Holocene. These periods were shown to correspond to changes in regional hydroclimate. An extreme paleoflood phase was recorded by the chemical elements during 5.8 ka–5.9 ka, which responded to accelerated accumulation rates. This method based on the chemical element and end-member model showed considerable potential to reconstruct flood sedimentation and identify flood phases. However, it should be noted that this approach is suitable for specific fluvial sedimentary environments such as floodplain environments dominated by relatively homogenous fine-suspended load sediments or high-resolution fluvial deposits with disturbed flood indicators. Here, the flood stage signal was extracted by the chemical element ratio. We suggest that the chemical element ratio should be critically assessed before using it for flood reconstruction. Compared to flood stages, individual flood events are difficult to determine; thus, they require precise dating and additional tracer indicators.
Data availability statement
The original contributions presented in the study are included in the article/Supplementary Material; further inquiries can be directed to the corresponding author.
Author contributions
Conceptualization, HP; methodology, YJ; validation, FL, YJ, and LQ; writing—review and editing, HP and LC. All authors contributed to the article and approved the submitted version.
Funding
We greatly appreciate very valuable comments and suggestion from the reviewers. This work was supported by the National Science Foundation of China (No. 42001004, 42001008, 42171002, and 42041006); the Science and Technology Achievements Transformation Project of Inner Mongolia Autonomous Region (2021CG0046); the Science and Technology Plan Project of the Alxa League (AMYY 2021-19).
Conflict of interest
The authors declare that the research was conducted in the absence of any commercial or financial relationships that could be construed as a potential conflict of interest.
Publisher’s note
All claims expressed in this article are solely those of the authors and do not necessarily represent those of their affiliated organizations, or those of the publisher, the editors, and the reviewers. Any product that may be evaluated in this article, or claim that may be made by its manufacturer, is not guaranteed or endorsed by the publisher.
References
Aloserij, L. H. J. (2013). “Historical floods of the Rhine river, reconstructed from the sedimentary fills of a dike breach pond and abandoned channels,” in Subtitle: Application for estimation of the design discharge.
Baker, V. R. (1987). Paleoflood hydrology and extraordinary flood events. J. Hydrology 96 (1), 79–99. doi:10.1016/0022-1694(87)90145-4
Benito, G., Macklin, M. G., Panin, A., Rossato, S., Fontana, A., Jones, A. F., et al. (2015). Recurring flood distribution patterns related to short-term Holocene climatic variability. Sci. Rep. 5, 16398–8. doi:10.1038/srep16398
Calvert, S. E., Bustin, R. M., and Ingall, E. D. (1996). Influence of water column anoxia and sediment supply on the burial and preservation of organic carbon in marine shales. GeochimicaEtCosmochimicaActa 60 (9), 1577–1593. doi:10.1016/0016-7037(96)00041-5
Calvert, S. E., Pedersen, T. F., and Karlin, R. E. (2001). Geochemical and isotopic evidence for post-glacial palaeoceanographic changes in Saanich Inlet, British Columbia. Mar. Geol. 174 (1–4), 287–305. doi:10.1016/s0025-3227(00)00156-0
Chapron, E., Courp, T., Tachikawa, K., Fanget, B., Malet, E., Bard, E., et al. (2013). Palaeoflood activity and climate change over the last 1400 years recorded by lake sediments in the north-west European Alps. J. Quat. Sci. 28 (2), 189–199. doi:10.1002/jqs.2609
Chen, J., Chen, Y., Liu, L., Ji, J., Balsam, W., Sun, Y., et al. (2006). Zr/Rb ratio in the Chinese loess sequences and its implication for changes in the East Asian winter monsoon strength. Geochimica Cosmochimica Acta 70 (6), 1471–1482. doi:10.1016/j.gca.2005.11.029
Chen, F. H., Li, G. Q., Zhao, H., Jin, M., and Fan, Y. X. (2014). Landscape evolution of the Ulan Buh Desert in northern China during the late Quaternary. Quat. Res. 81 (3), 476–487. doi:10.1016/j.yqres.2013.08.005
Chen, F., Xu, Q., Chen, J., Birks, H. J. B., Liu, J., Zhang, S., et al. (2015). East Asian summer monsoon precipitation variability since the last deglaciation. Sci. Rep. 5 (1), 11186. doi:10.1038/srep11186
Chiverrell, R. C., Sear, D. A., Warburton, J., Macdonald, N., Schillereff, D. N., Dearing, J. A., et al. (2019). Using lake sediment archives to improve understanding of flood magnitude and frequency: Recent extreme flooding in northwest UK. Earth Surf. Process. Landforms 44 (12), 2366–2376. doi:10.1002/esp.4650
Deng, Y. M., Wang, Y. X., Ma, T., and Gan, Y. Q. (2009). Speciation and enrichment of arsenic in strongly reducing shallow aquifers at Western Hetao Plain, northern China. Environ. Geol. 56 (7), 1467–1477. doi:10.1007/s00254-008-1243-y
Dietze, E., Hartmann, K., Diekmann, B., Ijmker, J., Lehmkuhl, F., Opitz, S., et al. (2012). An end-member algorithm for deciphering modern detrital processes from lake sediments of Lake Donggi Cona, NE Tibetan Plateau, China. Sediment. Geol. 243, 169–180. doi:10.1016/j.sedgeo.2011.09.014
Dypvik, H., and Harris, N. B. (2001). Geochemical facies analysis of fine-grained siliciclastics using Th/U, Zr/Rb and (Zr+Rb)/Sr ratios. Chem. Geol. 181 (1-4), 131–146. doi:10.1016/s0009-2541(01)00278-9
Erkens, G., Toonen, W. H. J., Cohen, K. M., and Prins, M. A. (2013). “Unravelling mixed sediment signals in the floodplains of the Rhine catchment using end member modelling of grain size distributions,” in 10th international conference on fluvial sedimentology (University of Leeds), 109–110.
Folk, R. L., and Ward, W. C. (1957). Brazos River bar: A study in the significance of grain size parameters. J. Sediment. Res. 27 (1), 3–26. doi:10.1306/74d70646-2b21-11d7-8648000102c1865d
Fralick, P. W., and Kronberg, B. I. (1997). Geochemical discrimination of clastic sedimentary rock sources. Sediment. Geol. 113 (1), 111–124. doi:10.1016/S0037-0738(97)00049-3
Fralick, P. W., KronbGilli, A., Anselmetti, F. S., Glur, L., and Wirth, S. B. (2013). “Lake sediments as archives of recurrence rates and intensities of past flood events [M],” in Dating torrential processes on fans and cones (Springer Netherlands), 225–242.
Gilli, A., Anselmetti, F. S., Glur, L., and Wirth, S. B. (2013). Lake sediments as archives of recurrence rates and intensities of past flood events. Springer Netherlands: Dating Torrential Processes on Fans and Cones, 225–242. doi:10.1007/978-94-007-4336-6_15
Guo, Y., Huang, C. C., Pang, J., Zha, X., Zhou, Y., Wang, L., et al. (2015). Investigating extreme flood response to Holocene palaeoclimate in the Chinese monsoonal zone: A palaeoflood case study from the Hanjiang River. Geomorphology 238, 187–197. doi:10.1016/j.geomorph.2015.03.014
He, Z., Long, H., Yang, L., and Zhou, J. (2019). Luminescence dating of a fluvial sequence using different grain size fractions and implications on Holocene flooding activities in Weihe Basin, central China. Quat. Geochronol. 49, 123–130. doi:10.1016/j.quageo.2018.05.007
Herzschuh, U., Cao, X., Laepple, T., Dallmeyer, A., Telford, R. J., Ni, J., et al. (2019). Position and orientation of the westerly jet determined Holocene rainfall patterns in China. Nat. Commun. 10 (1), 2376. doi:10.1038/s41467-019-09866-8
Huang, C. C., Pang, J., Zha, X., Su, H. X., Jia, Y. F., and Zhu, Y. Z. (2007). Impact of monsoonal climatic change on Holocene overbank flooding along Sushui River, middle reach of the Yellow River, China. Quat. Sci. Rev. 26 (17–18), 2247–2264. doi:10.1016/j.quascirev.2007.06.006
Huang, C. C., Pang, J., Zha, X., Su, H., and Jia, Y. (2011). Extraordinary floods related to the climatic event at 4200 a B.P. on the Qishuihe River, middle reaches of the Yellow River, China. Quat. Sci. Rev. 30 (3), 460–468. doi:10.1016/j.quascirev.2010.12.007
Huang, C. C., Pang, J., Zha, X., Zhou, Y., Su, H., Zhang, Y., et al. (2012). Holocene palaeoflood events recorded by slackwater deposits along the lower Jinghe River valley, middle Yellow River basin, China. J. Quat. Sci. 27 (5), 485–493. doi:10.1002/jqs.2536
Huang, C. C., Pang, J., Zhou, Y., Su, H., Zhang, Y., and Wang, L. (2013). Palaeoenvironmental implications of the prehistorical catastrophes in relation to the Lajia Ruins within the guanting basin along the upper Yellow River, China. Holocene 23 (11), 1584–1595. doi:10.1177/0959683613499052
IPCC (2013). in The physical science basis, contribution of working group I to the fifth assessment report of the intergovernmental panel on climate change. Editors Stocker T. F., Qin D., Plattner G.-K., Tignor M., Allen S. K., Boschung J.et al. (Cambridge, United Kingdom and New York, NY, USA: Cambridge University Press).
Jia, T., Ma, C., Zhu, C., Guo, T., Xu, J., Guan, H., et al. (2017). Depositional evidence of palaeofloods during 4.0–3.6ka B.P. At the Jinsha site, chengdu plain, China. Quat. Int. 440, 78–89. doi:10.1016/j.quaint.2016.07.008
Jones, A. F., Macklin, M. G., and Brewer, P. A. (2012). A geochemical record of flooding on the upper River Severn, UK, during the last 3750years. Geomorphology 179, 89–105. doi:10.1016/j.geomorph.2012.08.003
Kang, S., Du, J., Wang, N., Dong, J., Wang, D., Wang, X., et al. (2020). Early Holocene weakening and mid-to late Holocene strengthening of the East Asian winter monsoon. Geology 48 (11), 1043–1047. doi:10.1130/g47621.1
Kaufman, D., McKay, N., Routson, C., Erb, M., Dtwyler, C., Sommer, P. S., et al. (2020). Holocene global mean surface temperature, a multi-method reconstruction approach. Sci. Data 7 (1), 1–13. doi:10.1038/s41597-020-0530-7
Knox, J. C. (1985). Responses of floods to Holocene climatic change in the upper Mississippi Valley. Quat. Res. 23 (3), 287–300. doi:10.1016/0033-5894(85)90036-5
Knox, J. C. (1993). Large increases in flood magnitude in response to modest changes in climate. Nature 361 (6411), 430–432. doi:10.1038/361430a0
Knox, J. C. (2000). Sensitivity of modern and Holocene floods to climate change. Quat. Sci. Rev. 19 (1–5), 439–457. doi:10.1016/S0277-3791(99)00074-8
Knox, J. C. (2003). “North American palaeofloods and future floods: Responses to climatic change,” in Palaeohydrology: Understanding global change. Editors K. J. Gregory, and G. Benito (Chichester, UK: Wiley), 143–164.
Kylander, M. E., Ampel, L., Wohlfarth, B., and Veres, D. (2011). High-resolution X-ray fluorescence core scanning analysis of les echets (France) sedimentary sequence: New insights from chemical proxies. J. Quat. Sci. 26 (1), 109–117. doi:10.1002/jqs.1438
Li, B. Y., Ge, Q. S., and Zheng, J. Y. (2003). Evolution of the Yellow River in the houtao plain of inner Mongolia in the past 2000 years. Acta Geogr. Sin. 58 (2), 239–246. (In Chinese).
Li, Q., Wu, H., Yu, Y., Sun, A., Marković, S. B., and Guo, Z. (2014). Reconstructed moisture evolution of the deserts in northern China since the last glacial maximum and its implications for the East asian summer monsoon. Glob. Planet. Change 121, 101–112. doi:10.1016/j.gloplacha.2014.07.009
Li, B. F., Sun, D. H., Xu, W. H., Wang, F., Liang, B. Q., Ma, Z. W., et al. (2017). Paleomagnetic chronology and paleoenvironmental records from drill cores from the Hetao Basin and their implications for the formation of the Hobq Desert and the Yellow River. Quat. Sci. Rev. 156, 69–89. doi:10.1016/j.quascirev.2016.11.023
Li, F. Q., Pan, B. T., Lai, Z. P., Gao, H. S., and Ou, X. J. (2018). Identifying the degree of luminescence signal bleaching in fluvial sediments from the Inner Mongolian reaches of the Yellow River. Geochronometria 45 (1), 82–96. doi:10.1515/geochr-2015-0087
Li, Y., Huang, C., Ngo, H. H., Pang, J., Zha, X., Liu, T., et al. (2019). In situ reconstruction of long-term extreme flooding magnitudes and frequencies based on geological archives. Sci. Total Environ. 670, 8–17. doi:10.1016/j.scitotenv.2019.03.066
Lim, J., Lee, J. Y., Hong, S. S., and Kim, J. Y. (2013). Late Holocene flooding records from the floodplain deposits of the Yugu River, South Korea. Geomorphology 180-181, 109–119. doi:10.1016/j.geomorph.2012.09.010
Lintern, A., Leahy, P. J., Zawadzki, A., Gadd, P., Heijnis, H., Jacobsen, G., et al. (2016). Sediment cores as archives of historical changes in floodplain lake hydrology. Sci. Total Environ. 544, 1008–1019. doi:10.1016/j.scitotenv.2015.11.153
Liu, T., Huang, C. C., Pang, J., Zhou, Y., Zhang, Y., Ji, L., et al. (2014). Extraordinary hydro-climatic events during 1800–1600yr B.P. In the jin–shaan Gorges along the middle Yellow River, China. Palaeogeogr. Palaeoclimatol. Palaeoecol. 410, 143–152. doi:10.1016/j.palaeo.2014.05.039
Lu, H. Y., Yi, S. W., Liu, Z. Y., Mason, J. A., Jiang, D. B., Cheng, J., et al. (2013). Variation of East Asian monsoon precipitation during the past 21 k.y. and potential CO2 forcing. Geology 41 (9), 1023–1026. doi:10.1130/g34488.1
Maas, G. S., Macklin, M. G., Warburton, J., Woodward, J. C., and Meldrum, E. (2001). A 300-yearhistory of flooding in an andean mountain river system: The rio alizos, southern systems: Archives of environmental change. Lisse, Netherlands: Balkema, 297–323.
Macklin, M. G., Rumsby, B. T., and Newson, M. D. (1992). “Historical floods and vertical accretion of fine-grained alluvium in the lower Tyne valley, northeast England,” in Dynamics of gravel-bed rivers. Editors P. Billi, R. D. Hey, C. R. Thorne, and P. Tacconi (Chichester, UK: Wiley), 573–589.
Magand, O., Wilhelm, B., Arnaud, F., Sabatier, P., Chapron, E., Courp, T., et al. (2013). Palaeoflood activity and climate change over the last 1400 years recorded by lake sediments in the north-west European Alps. J. Quat. Sci. 28 (2), 189–199. doi:10.1002/jqs.2609
Mao, P., Pang, J., Huang, C., Zha, X., Zhou, Y., Guo, Y., et al. (2016). A multi-index analysis of the extraordinary paleoflood events recorded by slackwater deposits in the Yunxi Reach of the upper Hanjiang River, China. CATENA 145, 1–14. doi:10.1016/j.catena.2016.05.016
Munoz, S. E., Giosan, L., Therrell, M. D., Remo, J. W. F., Shen, Z., Sullivan, R. M., et al. (2018). Climatic control of Mississippi River flood hazard amplified by river engineering. Nature 556, 95–98. doi:10.1038/nature26145
Parris, A. S., Bierman, P. R., Noren, A. J., Prins, M. A., and Lini, A. (2010). Holocene paleostorms identified by particle size signatures in lake sediments from the northeastern United States. J. Paleolimnol. 43 (1), 29–49. doi:10.1007/s10933-009-9311-1
Peng, F., Prins, M. A., Kasse, C., Cohen, K. M., Van der Putten, N., van der Lubbe, J., et al. (2019). An improved method for paleoflood reconstruction and flooding phase identification, applied to the Meuse River in The Netherlands. Glob. Planet. Change 177, 213–224. doi:10.1016/j.gloplacha.2019.04.006
Peng, F., Kasse, C., Prins, M. A., Ellenkamp, R., Krasnoperov, M. Y., and van Balen, R. T. (2020). Paleoflooding reconstruction from Holocene levee deposits in the lower Meuse valley, The Netherlands. Geomorphology 352, 107002–107014. doi:10.1016/j.geomorph.2019.107002
Redmond, K. T., Enzel, Y., House, P. K., and Biondi, F. (2001). Climate impact on flood frequency at the decadal to millennial time scales. Clim. Change 5, 21–46.
Richter, T. O., Van, G. S., Koster, B., Vaars, A., Gieles, R., de Stigter, H. C., et al. (2006). The Avaatech XRF core scanner: Technical description and applications to NE atlantic sediments. Geol. Soc. Lond. Spec. Publ. 267, 39–50. doi:10.1144/GSL.SP.2006.267.01.03
Roberts, H. M. (2007). Assessing the effectiveness of the double-SAR protocol in isolating a luminescence signal dominated by quartz. Radiat. Meas. 42 (10), 1627–1636. doi:10.1016/j.radmeas.2007.09.010
Saint-laurent, D. (2004). Palaeoflood hydrology: An emerging science. Prog. Phys. Geogr. 28 (4), 531–543. doi:10.1191/0309133304pp423oa
Schillereff, D. N., Chiverrell, R. C., Macdonald, N., and Hooke, J. M. (2014). Flood stratigraphies in lake sediments: A review. Earth-Science Rev. 135 (4), 17–37. doi:10.1016/j.earscirev.2014.03.011
Schneider, R. R., Price, B., Müller, P. J., Kroon, D., and Alexander, I. (1997). Monsoon related variations in Zaire (Congo) sediment load and influence of fluvial silicate supply on marine productivity in the east equatorial Atlantic during the last 200,000 years. Paleoceanography 12 (3), 463–481. doi:10.1029/96pa03640
Schulte, L., Peña, J. C., Carvalho, F., Schmidt, T., Julià, R., Llorca, J., et al. (2015). A 2600-year history of floods in the bernese Alps, Switzerland: Frequencies, mechanisms and climate forcing. Hydrol. Earth Syst. Sci. 19 (7), 3047–3072. doi:10.5194/hess-19-3047-2015
Shen, H., Yu, L., Zhang, H., Zhao, M., and Lai, Z. (2015). OSL and radiocarbon dating of flood deposits and its paleoclimatic and archaeological implications in the Yihe River Basin, East China. Quat. Geochronol. 30, 398–404. doi:10.1016/j.quageo.2015.03.005
Støren, E. N., Svein, O. D., Atle, N., and Paasche, Ø. (2010). Identifying the sedimentary imprint of high-frequency Holocene river floods in lake sediments: Development and application of a new method. Quat. Sci. Rev. 29 (23), 3021–3033. doi:10.1016/j.quascirev.2010.06.038
Sun, Q., Liu, Y., Wünnemann, B., Peng, Y., Jiang, X., Deng, L., et al. (2019). Climate as a factor for Neolithic cultural collapses approximately 4000 years B.P. in China. Earth-Science Rev. 197, 102915. doi:10.1016/j.earscirev.2019.102915
Tjallingii, R., Röhl, U., Kölling, M., and Bickert, T. (2007). Influence of the water content on X-ray fluorescence core-scanning measurements in soft marine sediments. Geochem. Geophys. Geosystems 8 (2), 1074–1086. doi:10.1029/2006gc001393
Toonen, W. H. J., Winkels, T. G., Cohen, K. M., Prins, M. A., and Middelkoop, H. (2015). Lower Rhine historical flood magnitudes of the last 450years reproduced from grain-size measurements of flood deposits using End Member Modelling. CATENA 130, 69–81. doi:10.1016/j.catena.2014.12.004
Vandenberghe, J. (2002). The relation between climate and river processes, landforms and deposits during the Quaternary. Quat. Int. 91 (1), 17–23. doi:10.1016/s1040-6182(01)00098-2
Vandenberghe, J. (2013). Grain size of fine-grained windblown sediment: A powerful proxy for process identification. Earth-Science Rev. 121, 18–30. doi:10.1016/j.earscirev.2013.03.001
Wanner, H., Beer, J., Bütikofer, J., Crowley, T. J., Cubasch, U., Flückiger, J., et al. (2018). Mid-to Late Holocene climate change: an overview. Quat. Sci. Rev. 27, 1791–1828. doi:10.1016/j.quascirev.2008.06.013
Wang, H., Huang, C. C., Pang, J., Zhou, Y., Cuan, Y., Guo, Y., et al. (2021). Catastrophic flashflood and mudflow events in the pre-historical Lajia Ruins at the northeast margin of the Chinese Tibetan Plateau. Quat. Sci. Rev. 251, 106737. doi:10.1016/j.quascirev.2020.106737
Weltje, G. J., and Prins, M. A. (2003). Muddled or mixed? Inferring palaeoclimate from size distributions of deep-sea clastics. Sediment. Geol. 162 (1-2), 39–62. doi:10.1016/s0037-0738(03)00235-5
Weltje, G. J., and Tjallingii, R. (2008). Calibration of XRF core scanners for quantitative geochemical logging of sediment cores: Theory and application. Earth Planet. Sci. Lett. 274 (3–4), 423–438. doi:10.1016/j.epsl.2008.07.054
Werritty, A., Paine, J. L., Macdonald, N., Rowan, J., and McEwen, L. (2006). Use of multi-proxy flood records to improve estimates of flood risk: Lower River Tay, Scotland. Catena 66 (1-2), 107–119. doi:10.1016/j.catena.2005.07.012
Wilhelm, B., Arnaud, F., Sabatier, P., Magand, O., Chapron, E., Courp, T., et al. (2013). Palaeoflood activity and climate change over the last 1400 years recorded by lake sediments in the north-west European Alps. J. Quat. Sci. 28 (2), 189–199. doi:10.1002/jqs.2609
Wilhelm, B., Canovas, J. A. B., Aznar, J. P. C., Kämpf, L., Swierczynski, T., Stoffel, M., et al. (2018). Recent advances in paleoflood hydrology: From new archives to data compilation and analysis. Water Secur. 3, 1–8. doi:10.1016/j.wasec.2018.07.001
Wu, Q. L., Zhao, Z. J., Liu, L., Granger, D. E., Wang, H., Cohen, D. J., et al. (2016). Outburst flood at 1920 BCE supports historicity of China's Great Flood and the Xia dynasty. Science 353 (6299), 579–582. doi:10.1126/science.aaf0842
Xu, Q. H., Xiao, J. L., Li, Y. C., Tian, F., and Nakagawa, T. (2010). Pollen-based quantitative reconstruction of Holocene climate changes in the Daihai Lake area, inner Mongolia, China. J. Clim. 23 (11), 2856–2868. doi:10.1175/2009jcli3155.1
Xu, J. X. (2007). A study of depositional rate in the north China plain during the past 40000 years, based on 14C dating data from a large wealth of samples. Quanternary Sci. 27 (3), 437–443.
Yang, X., Cai, M., Ye, P., Ye, M. N., Li, C. L., Wu, H., et al. (2018). Provenance of aeolian sands in the Hetao Plain, northwestern China. Aeolian Res. 32, 92–101. doi:10.1016/j.aeolia.2018.02.002
Yu, S. Y., Hou, Z., Chen, X., Wang, Y., Song, Y., Gao, M., et al. (2020). Extreme flooding of the lower Yellow River near the northgrippian-meghalayan boundary: Evidence from the Shilipu archaeological site in southwestern shandong province, China. Geomorphology 350, 106878. doi:10.1016/j.geomorph.2019.106878
Zhang, Z., Liu, J., Chen, J., Chen, S., Shen, Z., Chen, J., et al. (2021). Holocene climatic optimum in the East Asian monsoon region of China defined by climatic stability. Earth-Science Rev. 212, 103450. doi:10.1016/j.earscirev.2020.103450
Keywords: ln(Zr/Ti), Yellow River, XRF, paleoflood, end-member modeling analysis
Citation: Pang H, Jia Y, Li F, Qin L and Chen L (2023) An improved method for paleoflood reconstruction from core sediments in the upper Yellow River. Front. Earth Sci. 11:1149502. doi: 10.3389/feart.2023.1149502
Received: 22 January 2023; Accepted: 30 May 2023;
Published: 04 July 2023.
Edited by:
Weiming Liu, Chinese Academy of Sciences (CAS), ChinaCopyright © 2023 Pang, Jia, Li, Qin and Chen. This is an open-access article distributed under the terms of the Creative Commons Attribution License (CC BY). The use, distribution or reproduction in other forums is permitted, provided the original author(s) and the copyright owner(s) are credited and that the original publication in this journal is cited, in accordance with accepted academic practice. No use, distribution or reproduction is permitted which does not comply with these terms.
*Correspondence: Hongli Pang, aGxwYW5nQHNobXR1LmVkdS5jbg==