 Aswin Sagar
 R. Krishnan
 T. P. Sabin
95% of researchers rate our articles as excellent or good
Learn more about the work of our research integrity team to safeguard the quality of each article we publish.
Find out more
ORIGINAL RESEARCH article
Front. Earth Sci. , 01 March 2023
Sec. Atmospheric Science
Volume 11 - 2023 | https://doi.org/10.3389/feart.2023.1149344
This article is part of the Research Topic Asian Monsoon: Drivers and Forcings in a Changing Climate View all 5 articles
This study addresses the role of human-induced climate change on the interactions of convective activities between the Indian summer monsoon (ISM) and western North Pacific (WNP) regions - an important scientific issue which has been hitherto overlooked. We have examined this problem using two numerical experiments of a high-resolution climate model, with and without anthropogenic forcing (i.e., HIST and HISTNAT) for the historical period 1951–2005, supplemented by innovative diagnostics like causal network analysis. Our findings suggest that an anthropogenically-forced weakening of the ISM circulation tends to significantly enhance the genesis potential index (GPI) of the WNP tropical cyclones by 13.5% and associated convective activities, by reorienting the large-scale flow over the tropical Indo-Pacific in a manner that is conducive for enhancement of the WNP tropical cyclogenesis. Additionally, it is found that the probability of extremely low sea-level pressure (SLP) (<995.5 hPa) around Taiwan and Chinese mainland is significantly higher by 10.3% in the anthropogenically-forced simulation as compared to the natural run. Using the model outputs from HIST and HISTNAT, we also performed a causal effect network (CEN) analysis to understand the causal connections among the three indices involved in the ISM-WNP interactions (a) Indian monsoon circulation index (IMI) which is the difference in the area-averaged 850 hPa zonal winds between the boxes (40oE-80oE, 5oN-15oN) and (70oE-90oE, 20oN-30oN) (b) WNP tropical cyclone activity expressed as the genesis potential index (GPI) averaged over the region (120oE-180oE, 5oN-30oN) and (c) Tropical Indo-Pacific wind index (IPWND) which is based on the 850 hPa zonal winds averaged over the domain (100oE-130oE, 5oN-20oN). Results from the CEN analysis indicate that an anthropogenically-forced weakening of the IMI can lead to possible strengthening of GPI and IPWND with time-lags of 5 and 7 days, respectively. In general, it is noted that the causal relationships among IMI, GPI and IPWND are associated with shorter time-lags (∼4–9 days) in HIST and longer time-lags (∼19–28 days) in HISTNAT.
The Asian summer monsoon rainy season exhibits a rich diversity of precipitation and convection variations spatially across South and Southeast Asia, tropical western North Pacific (WNP) and East Asia (Tanaka, 1992; Murakami and Matsumoto, 1994; Wang and LinHo, 2002). The WNP is a breeding ground for tropical cyclones (TCs) all through the year with peak activity during August-September (Ramsay, 2017), in contrast to the North Indian Ocean, particularly the Bay of Bengal, where tropical cyclones (TCs) are observed mainly during April-June and October-December but suppressed in July-August (Rajeevan et al., 2013) due to the combined effects of strong vertical wind shear of the Indian summer monsoon (ISM) circulation, low-level relative vorticity and sea surface temperature (SST) during the boreal summer monsoon season (Li et al., 2013). Although monsoons and tropical cyclones are both characterized by heavy rainfall and convective activities, the two phenomena have distinct dynamical features (Krishnamurti et al., 2013; Biasutti et al., 2018). Monsoon rainfall is closely connected to the seasonal migration of rain belts towards the summer hemisphere forced by the annual cycle of solar radiation (Wang and Xie, 1997; Gadgil, 2003; Mohtadi et al., 2016) and the tropical monsoon systems (Zhisheng et al., 2015) are characterized by the development of strong vertical shear of winds (Krishnamurti et al., 2013). On the other hand, tropical cyclogenesis is favoured in environments with weak vertical shear of winds and high low-level relative vorticity (Emanuel et al., 2008; Emanuel, 2010; Wang and Murakami, 2020).
Meteorologists have since long endeavoured to comprehend the interactions between the ISM circulation and the WNP tropical cyclone (TC) activities involved in the regional precipitation variations. Iyer (1931); Iyer (1935) suggested that westward travelling residual lows originating from typhoons over the west Pacific and South China Sea (SCS), during the July-November months, can influence the weather over the Indian region. Krishnamurti et al. (1977) proposed that the formation of summer monsoon disturbances (including depressions) over the northern Bay of Bengal can arise through a superposition of quasi-stationary long waves and slow westward-traveling shorter waves, resulting in downstream amplification of the propagating wave. The study by Saha et al. (1981) pointed out that the Bay of Bengal summer monsoon low pressure systems and depressions are typically associated with westward moving wave disturbances from the east, which have a westward phase speed of around 6 m s-1 and wavelength of about 2,300 km. More recently, Takahashi et al. (2015) have highlighted the role of westward propagating TCs from the WNP region during the 2011 heavy precipitation over Thailand.
Another interesting aspect of the ISM circulation interaction with the WNP TCs is related to the occurrence of monsoon ‘breaks’ over India, which typically coincide with periods of WNP TCs crossing over to the north of 30oN between the 110oE and 140oE longitudes (Raman, 1955; Kumar and Krishnan, 2005). A case in point is the recent example of the record-breaking number of 18 TCs which were witnessed over the WNP during the boreal summer of 2018 (Gao et al., 2020; Basconcillo et al., 2021; Figure 1), even as the Indian subcontinent was reeling through a deficient monsoon rainy season (Sunitha Devi et al., 2019). In the past, there have been several other cases (e.g., July 2002 August 1986 … ) of contrasting convective activities between the Indian and tropical WNP regions (Kumar and Krishnan, 2005; Mujumdar et al., 2007). In fact, studies have reported an inverse relationship between the ISM rainfall and the number of WNP typhoon days (Rajeevan, 1993; Pattanaik and Rajeevan, 2007); and an out-of-phase variation in the convective activities between the two regions on sub-seasonal timescales (Joseph, 1990; Krishnan et al., 2000).
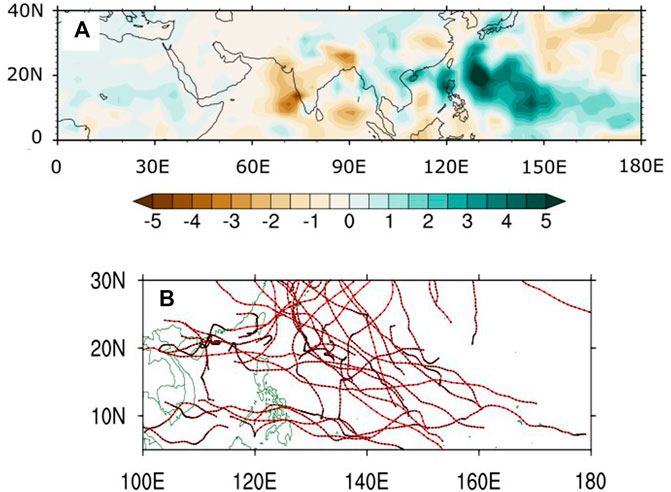
FIGURE 1. Spatial maps during the 2018 boreal summer monsoon season (JJAS): (A) Rainfall anomaly from GPCP precipitation dataset (B) Cyclone tracks over WNP from IBTrACS. The rainfall anomaly is relative to the 1991–2020 baseline climatology.
Several investigators have examined the interannual and inter-decadal variability of WNP TCs (e.g., Chan and Zhou, 2005; Zhao et al., 2018; Zhao and Wang, 2019; Liu and Chan, 2020). The inferences from the above studies indicate that a higher number of WNP TCs generally form during the developing phase of El Niño as compared to the decaying phase of El Niño (Li and Hsu, 2017). Interannual variations in the frequency of the WNP TCs can be modulated by multiple modes of climate variability in the Pacific, Atlantic and Indian Oceans (see Gao et al., 2020). Furthermore, the interannual variability of the Indian and WNP summer monsoons regions are closely linked to ENSO (see Wang et al., 2001). Thus the relationship between the ISM and WNP tropical cyclogenesis on the interannual time-scale appears to be a more complex issue as compared to the sub-seasonal/intraseasonal time-scales (Joseph, 1990).
The formation of WNP TCs and their track characteristics strongly depend on large-scale circulation (Harr and Elsberry, 1991). In particular, large-scale circulation anomalies over the Indo-Pacific sector, associated with the ISM interannual variability, can influence the genesis and movement of the WNP TCs (Kumar and Krishnan, 2005; Mujumdar et al., 2007). The WNP cyclogenesis tends to be significantly enhanced during years of weaker-than-normal ISM circulation, with a greater tendency for the TCs to move northward of 20oN and recurve (Kumar and Krishnan, 2005). In this context, it is noteworthy to mention that periods of anomalously weak low-level ISM cross-equatorial flow over the Indian Ocean tend to be accompanied by anomalous westerlies oriented along the equator with the eastward flow directed towards the South China Sea (SCS) and tropical west Pacific (Rodwell, 1997; Krishnan et al., 2006; Mujumdar et al., 2007). A recent study has reported an increase in the observed annual maximum landfall intensity over South China during (2012–2018) due to an increase in the frequency of TCs undergoing intensification over the SCS (Liu and Chan, 2020).
Human-induced climate change, in particular greenhouse gas (GHG) emissions, is recognized as the main driver of the observed changes in weather and climate extremes, especially heat waves, heavy precipitation, tropical cyclones and agricultural droughts, since the mid-20th century (IPCC AR6 WG1, 2021). On the other hand, it is also recognized that increases in the South Asian monsoon precipitation due to GHG warming were counteracted by precipitation decreases caused by Northern Hemispheric (NH) anthropogenic aerosol forcing since the mid-20th century (IPCC, 2021). While GHG warming is favourable for enhancement of the South Asian monsoon precipitation, due to increased moisture transport from the adjoining oceanic region and enhanced moisture convergence over the monsoon region (Cherchi et al., 2011; Turner and Annamalai, 2012; Krishnan et al., 2013; Kitoh, 2017), the rising burden of anthropogenic aerosols over different regions of the NH has offset the expected increase of monsoon precipitation due to GHG-forcing, thus leading to a decrease in the South Asian monsoon precipitation during the post-1950s (Ramanathan et al., 2005; Bollasina et al., 2011; Ganguly et al., 2012; Polson et al., 2014; Salzmann et al., 2014; Sanap et al., 2015; Krishnan et al., 2016; Undorf et al., 2018; Ayantika et al., 2021; Monerie et al., 2022). Based on a series of equilibrium experiments using the ECHAM4 model, Feichter et al. (2004) pointed out that the climate response to present-day anthropogenic aerosol forcing is not just a mirror image of the response to GHG forcing. While the temperature response is regionally more uniform for GHG forcing than for aerosol forcing, they noted that the global hydrological cycle is three times more sensitive to aerosol forcing as compared to GHG forcing given that the radiative effect of aerosols is mainly felt at the Earth’s surface. Therefore, although a global warming is simulated when both GHG and aerosol forcings are applied, global evaporation and precipitation tends to decrease by about 2% K−1, resulting in a negative hydrological sensitivity (Feichter et al., 2004). In a more recent study, Ayantika et al. (2021) examined the individual and combined effects of GHG and anthropogenic aerosol forcing on the South Asian monsoon precipitation response using the IITM Earth System Model (IITM ESMv2). They noted that the combined influence of GHG and aerosol forcing leads to a reinforced suppression of monsoon precipitation and organized convection over South and Southeast Asia, as compared to the aerosol-only forcing run. In particular, they found that the strong suppression of monsoon precipitation in the combined forcing experiment resulted from a pronounced negative gradient of radiative forcing (∼-14 Wm-2) between the equator and 20oN over the South and Southeast Asian longitudes (Ayantika et al., 2021). Given this background understanding of the South Asian monsoon response to anthropogenic GHG and aerosol forcing, a question arises as to how climate change can influence the interactions between the ISM and WNP convective activities.
Based on analyses of single-forcing and historical Coupled Model Intercomparison Project–Phase 5 (CMIP5) experiments, Sobel et al. (2016) noted that aerosols exert greater influence, as compared to GHGs, on the potential intensity (PI) of TCs, which results due to the stronger influence of aerosols on surface fluxes, as compared to GHG. On the other hand, the influence of climate change on the frequency of TCs is not adequately understood, especially at regional scales (Sobel et al., 2021). There is also substantial uncertainty in assessing the impact of anthropogenic forcing on specific episodes of TC activity, such as the active 2018 TC season in the North Pacific (Qian et al., 2019).
In this work, we have investigated the linkage between the ISM and WNP convective activities in a changing climate through analysis of numerical simulations for the historical period 1951–2005 based on a variable resolution global climate model (LMDz4, Laboratoire de Météorologie Dynamique, France), having high-resolution telescopic zooming (horizontal grid size ∼35 km) over South Asia (Sabin et al., 2013; Krishnan et al., 2016). Earlier results from this high-resolution (LMDz4) climate model simulations showed that the observed weakening trend of the ISM circulation and precipitation during the post-1950 is largely because of NH anthropogenic aerosols, with additional contributions from land-use land-cover changes and rapid warming of the equatorial Indian Ocean (Krishnan et al., 2016; Krishnan et al., 2020; see also Figure 5). Here, we focus on understanding the effects of climate change on the link between ISM and WNP convective activities using the LMDz4 climate change simulations.
We analysed two climate simulations (HIST and HISTNAT) for the historical period (1951–2005), based on the CMIP5 protocol, that were conducted using a variable resolution global atmospheric model with high-resolution telescopic zooming (horizontal grid size ∼35 km) over South Asia (Sabin et al., 2013; Ramarao et al., 2015; Krishnan et al., 2016; Krishnan et al., 2020). The HIST simulation includes both natural (e.g., varying solar-irradiance and volcanic-aerosols) and anthropogenic (GHG, aerosols, ozone and land use changes) forcing, whereas the HISTNAT simulation includes natural forcing only (Krishnan et al., 2016; Krishnan et al., 2020). This global atmospheric model (LMDz4), originally developed at the Laboratoire de Météorologie Dynamique, France, with the high-resolution zoom setup over South Asia realistically captures the observed regional summer monsoon rainfall distribution, including heavy rainfall over the narrow mountains along the Western Ghats of India and the west coast of Myanmar, large-scale monsoon circulation features, monsoon synoptic disturbances and organized convection (Sabin et al., 2013). In particular, the high-resolution representation of the regional surface topography in the model provides important value additions in realistically capturing the coupling between circulation and precipitation over the near-equatorial region. The SST boundary-forcing in LMDZ4 experiments is constructed by superposing the SST anomalies from the IPSL-CM5A-LR simulations on the observed climatological mean SST (for details see, Krishnan et al., 2016).
Additionally, we have presented analyses of monthly averaged ECMWF Reanalysis fifth Generation (ERA5) reanalysis fields with a spatial resolution of 0.25o x 0.25o from 1979 to 2005 (Hersbach et al., 2020), which include zonal and meridional components of wind, specific humidity, temperature, and geopotential height. For precipitation, we have used the Global Precipitation climatology product (GPCP) Version 2.3 Combined Precipitation Dataset which is a satellite-based rainfall measurement with a spatial resolution of 2.5o x 2.5o (Adler et al., 2018) from 1979 to 2005. Further we have utilised IBTrACS (Knapp et al., 2010), for analysing the 2018 cyclone tracks.
In this section, we briefly discuss the simulation of the time-mean features of the June-September precipitation and circulation from the LMDz4 HIST simulation and compare with the ERA5 reanalysis for the period 1979–2005 (Figure 2). We have also presented the time-mean maps of precipitation and circulation at 850 hPa and 200 hPa from the HISTNAT simulation, which are shown in Supplementary Figure S1.
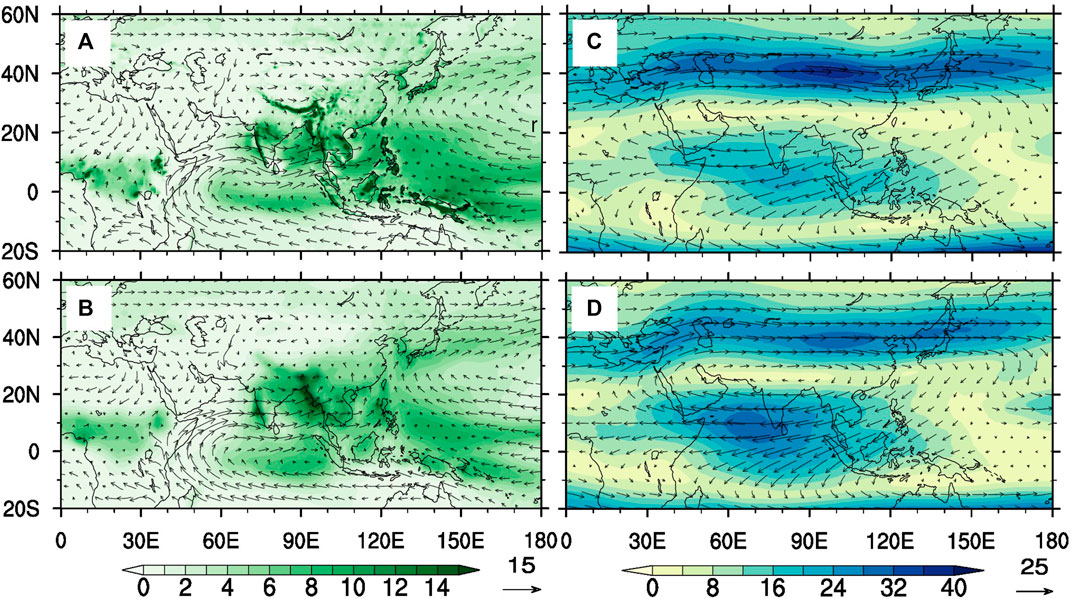
FIGURE 2. Spatial map of JJAS time-mean (1979–2005) precipitation (mm day-1) (shaded) and 850 hPa winds (ms-1) (vector): (A) HIST (B) GPCP and ERA5 (C–D) JJAS time-mean maps of 200 hPa winds (ms-1) (vector) and zonal wind speed (shaded) for HIST and ERA5, respectively.
It can be seen from Figure 2 that the overall structure of the observed summer monsoon precipitation over South and Southeast Asia, tropical west Pacific, the far eastern Asian regions over Japan and Korea, as well as the West African region is captured well in the HIST simulation. The benefit of high-resolution modelling is clearly evident from the fairly realistic simulation of monsoon rainfall along the narrow mountains of the Western Ghats and Myanmar. The model reasonably captures monsoon precipitation over India, even though there are differences with the observed precipitation at sub-regional scales. The difference maps between the simulation and reanalysis/observed data, shown in Supplementary Figure S2, are helpful in inferring the model bias. The simulated precipitation appears to be overestimated over the Himalayan foothills and underestimated over parts of southwest China and Bay of Bengal. Also seen in the simulation is the secondary rainfall maximum over the equatorial Indian Ocean between equator and 10oS, although this feature is extended more westward in the simulation as compared to observations. The summer monsoon cross-equatorial flow over the Indian Ocean and the west Pacific subtropical anticyclone are well represented in simulated winds at 850 hPa. It can be noticed that the precipitation over the tropical west Pacific, Philippine islands and adjoining areas is associated with convergence of the low-level monsoon westerly winds from the Indian Ocean and the Pacific easterly trade winds. It can be noted that the monsoon winds over India and Bay of Bengal are more zonal in ERA5, whereas they exhibit a southward curvature in the model simulation (see Supplementary Figure S2) which is typically observed during weak phases of the ISM circulation (Rodwell, 1997; Krishnan et al., 2000; 2006). This point will be discussed later in the paper.
The maps of 200 hPa winds (and wind speed) from the model simulation and ERA5 are shown in Figures 2B, D, respectively. The dominant features of the Asian summer monsoon upper troposphere/lower stratosphere circulation, including the Tibetan anticyclone and the Tropical Easterly Jet (TEJ) are captured in the simulation. One can also notice a band of strong mid-latitude westerlies around 40oN associated with the Asian jet (i.e., Enomoto et al., 2003; Krishnan et al., 2009), although the simulated mid-latitude westerlies are relatively stronger as compared to ERA5 (see Supplementary Figure S2). On the other hand, the speed of the tropical easterly jet is underestimated in the model as compared to ERA5 (see Supplementary Figure S2). In summary, it is inferred that the time-mean HIST simulation captures the large-scale features of the ISM circulation (Figure 2) although the strength of the ISM circulation is somewhat weaker in the HIST simulation as compared to ERA5.
Latitude-pressure sections of zonal wind averaged over the longitudes 65oE - 90oE for the HIST simulation and ERA5 are shown in Figures 3A, B, respectively. Additionally, the corresponding cross-section plot for the HISTNAT simulation is shown in Supplementary Figure S3. We can note a clear change of sign of the low level zonal winds between the south and north of the equator, associated with the monsoon cross-equatorial flow. The HIST simulation also clearly captures the upper-level tropical easterlies and mid-latitude westerlies. It is interesting to note that the simulated low-level easterly winds to the south of equator are slightly weaker as compared to ERA5, whereas the low-level to westerlies to the north of equator around 8-9oN are relatively stronger in the model simulation. In the upper levels, the simulated northern hemispheric mid-latitude and subtropical westerlies are relatively stronger and extend more downward into the mid-troposphere and below, as compared to ERA5. Likewise, the tropical upper tropospheric easterlies also seem to extend more downward in the HIST simulation.
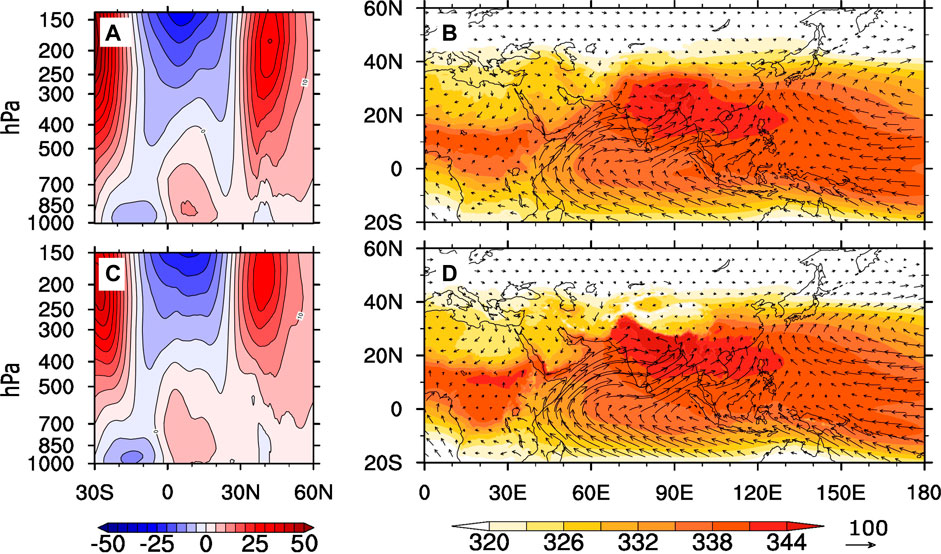
FIGURE 3. Latitude—Pressure section of JJAS time-mean zonal winds (ms-1) averaged over the longitudes (75oE-95oE): (A) HIST (C) ERA5. Moist static energy (MSE) (in 103 Jm-2). Moisture transport (vector) (kgm-1s-1) vertically averaged from surface to 300 hPa (B) HIST (D) ERA5.
Moist static energy (MSE) is a key parameter to understand deep vertical ascent in moist environments over the tropical monsoon regions (Boos and Emanuel, 2009; Nie et al., 2010). This quantity, which is a sum of internal energy, latent heat and potential energy, is mathematically expressed as MSE = CpT + Lvq + gz, where Cp is the specific heat at constant pressure, T is the absolute air temperature, LV is the latent heat of vaporisation, q is the specific humidity, g is the gravitational constant and z is the height about the surface. Maps of moist static energy (MSE) and vertically integrated moisture transport are shown in Figures 3B, D from HIST and ERA5, respectively. The broad features of the high MSE in the northern hemisphere, particularly over South and Southeast Asia, associated with the cross-equatorial transport of moisture are clearly evident. We also note that the simulated MSE has a positive bias that extends further northward into the Himalayan region and Tibetan Plateau, as compared to ERA5 (see Supplementary Figure S4). On the other hand, the simulation shows a weaker confinement of MSE and moisture transport over the Indian subcontinent relative to ERA5 (see Supplementary Figure S4). It is also interesting to note that the MSE over the West African monsoon region is comparatively lower in the model simulation as compared to ERA5.
In the previous sub-section, we evaluated the time-mean HIST simulations with the ERA5 datasets and noted that the model captures the dominant time-mean features of the boreal summer monsoon precipitation and circulation. The analysis in this section will focus on the differences in the time-mean simulations between the HIST and HISTNAT experiments for the period 1951–2005, in order to derive insights about the role of human-induced climate change on the monsoon climate. The choice of this longer period analysis in this section is based on the consideration that the ISM underwent a significant weakening of circulation and precipitation decrease since the mid-20th century, which is attributable to human-induced climate change as seen from the CMIP5 and CMIP6 models and several other studies (Douville et al., 2021). In particular, the historical climate change projections based on the LMDz4 model used in this study also indicated a robust decrease of ISM precipitation during the latter half of the 20th century in response to climate change (Krishnan et al., 2016; Krishnan et al., 2020).
The difference (HIST minus HISTNAT) maps shown in Figure 4 are used to infer the anthropogenic influence on the time-mean precipitation, circulation and MSE response for the boreal summer monsoon season (June-September, JJAS). A clear decrease of precipitation can be noted over the Indian landmass, West African monsoon region and parts of Southeast Asia, together with increased precipitation over the equatorial eastern Indian Ocean extending southward around 7-8oS, north-eastern Himalayan foothills and parts of Myanmar, equatorial west Pacific, WNP and Korea and Japan (Figure 4A). It is important to highlight that the aforementioned precipitation anomalies in Figure 4A are statistically significant at the 99 percent confidence level (p < 0.01). The low-level anti-cyclonic circulation anomaly over the Indian region (Figures 4A, B) and the anomalous easterlies extending westward from the Indian region across the Arabian Sea into the West African monsoon region, which are statistically significant at the 99 percent confidence level (p < 0.01) (Figure 4B), indicate a prominent weakening of the south-westerly monsoon flow in HIST relative to HISTNAT. It is interesting to note that the pronounced weakening of the ISM circulation is associated with the formation of an equatorial shear zone and enhancement of precipitation over the equatorial eastern Indian Ocean (Figure 4A) - which are typically observed during ‘breaks’ in the Indian monsoon (e.g., Krishnan et al., 2000; Krishnan et al., 2009). Furthermore, the weakened monsoon cross-equatorial flow over the western Indian Ocean is associated with anomalous westerly winds extending from the eastern equatorial Indian Ocean to the tropical west Pacific over the 0–15oN latitude belt, so that the convergence of westerly wind anomalies from the tropical Indian Ocean and the Pacific easterly trade wind anomalies results in enhanced precipitation over the equatorial and tropical west Pacific (Figure 4A). In this connection, it is important to mention that past studies have reported a possible reorientation of the westerly wind anomalies along the near-equatorial Indian Ocean towards to tropical west Pacific, following a weakening of the ISM cross-equatorial flow (e.g., Rodwell, 1997; Krishnan et al., 2006; Mujumdar et al., 2007; Swapna et al., 2014).
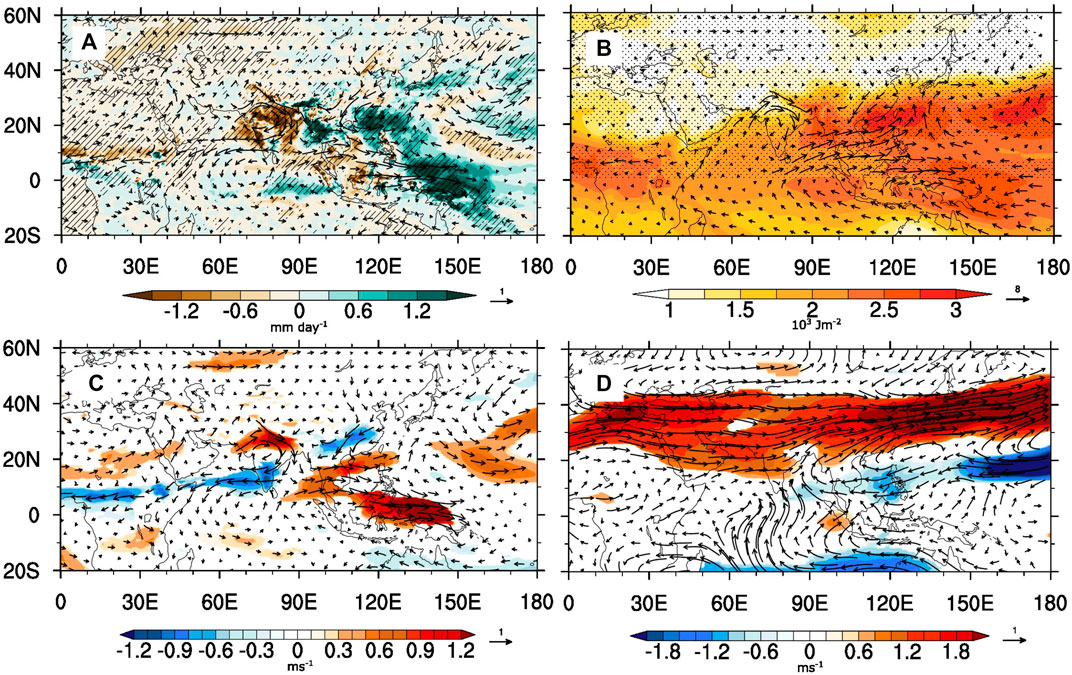
FIGURE 4. Difference (HIST- HISTNAT) maps of the JJAS time-mean fields for the period (1951–2005): (A) Precipitation (mm day-1) and 850 hPa winds (vector; ms-1). Areas with statistical significance (p < 0.01) are shown by hatched lines (B) MSE (103 Jm-2) (shaded) and moisture transport (vector; kgm-1s-1) vertically averaged from surface to 300 hPa. Dots indicate statistical significance (p < 0.01) based on Student’s t-test (C) 850 hPa zonal wind speed (shaded) and winds (vector) (D) 200 hPa zonal wind speed (shaded) and winds (vector). Note that only statistically significant (p< 0.01) zonal winds are shown (shaded) in c and (D)
Rodwell and Hoskins (1995) noted that the modification of potential vorticity (PV) of the summer monsoon low-level winds is essential for maintaining an irreversible cross-equatorial flow. On the other hand, they suggested that insufficient PV modification of the low-level cross-equatorial winds can lead to weaker south-westerly monsoon winds and a break-like pattern of low-level winds over the Indian region (Rodwell and Hoskins, 1995; Rodwell, 1997). In fact, the anomalous low-level easterlies over the Arabian Sea and Indian region in Figure 4A are indicative of insufficient PV modification of the ISM cross-equatorial flow in the HIST experiment. Consequently, a forced reduction of the ISM precipitation and slowdown of the monsoon low-level cross-equatorial flow in HIST tends to reorient the westerly anomalies along the equator towards the tropical west Pacific, akin to a break-monsoon situation.
A statistically significant (p < 0.01) increase of MSE in HIST relative to HISTNAT can be seen from the difference map (Figure 4C), over Southeast Asia and west Pacific oceanic regions and the continental regions of Asia and Africa. In particular, the increase of MSE in Figure 4C can be prominently seen extending eastward from the Bay of Bengal into the tropical west Pacific. The ridge-like feature associated with the anti-cyclonic anomaly of moisture transport over the Indian subcontinent is consistent with a weakened ISM circulation (Figure 4C). Here it is important to mention that the anomalous south-westerly transport of moisture extending from the western Arabian towards the Indian subcontinent is consistent with the faster increase of moisture in a warming climate, despite weakening of the monsoon circulation (e.g., Kitoh et al., 1997; Cherchi et al., 2011; Krishnan et al., 2013). Another noteworthy feature in Figure 4C is the enhanced transport of moisture from the equatorial eastern Indian Ocean and Bay of Bengal towards the tropical west Pacific in the (HIST - HISTNAT) difference map (Figure 4C), which includes the contributions from increased atmospheric water vapour content by GHG forcing, as well as changes in the atmospheric circulation. A significant enhancement of MSE is seen over the WNP and is accompanied by strong convergence of moisture transported from the tropical Indian and Pacific oceanic regions (Figure 4C).
The wind response in the upper troposphere is dominated by large-scale mid-latitude and subtropical westerly anomalies extending from the Eurasian region into South Asia, Far East into the north Pacific (statistically significant p < 0.01); and a weakened Tibetan anticyclone (Figure 4D). Anomalous intrusion of mid-latitude westerlies in the upper and middle troposphere over the Indian subcontinent basically weakens the ISM through subsidence of cold and dry air (Krishnan et al., 2009; Krishnan et al., 2016). A weakening of the ISM overturning circulation can be noted in the latitude-pressure cross-section of zonal winds averaged over the 65o-90oE longitude band, which display easterly anomalies in the lower troposphere around the 10oN-20oN latitude and westerly anomalies poleward of 15oN in the upper and middle troposphere (see Supplementary Figure S5). We also note an intensification of the upper-tropospheric mid-latitude westerly anomalies over the Far East areas covering Korea, Japan and north Pacific. This feature is reminiscent of an intensified Baiu subtropical frontal zone during weak phases of the Indian monsoon (Krishnan and Sugi, 2001). In short, it is seen that the simulated time-mean response to climate change is characterised by a monsoon break-like situation involving a large-scale weakening of the ISM circulation, but an intensified transport of moisture towards the WNP by westerly wind anomalies from the tropical eastern Indian Ocean region.
The influence of anthropogenic GHG and aerosol forcing on the observed precipitation changes over the Asian monsoon region has been well-documented, with the evidence suggesting that the increasing burden of anthropogenic aerosol emissions from the NH has offset the monsoon precipitation enhancement to GHG forcing and has been a key driver of the observed decrease in summer monsoon rainfall over the Indian region since the mid-20th century (IPCC, 2021 and references therein).
Besides HIST and HISTNAT, we had earlier conducted two additional experiments with GHG-only forcing (HISTGHG) and Aerosol-only forcing (HISTAero) for the historical period (1951–2005) using the LMDz4 model (see Krishnan et al., 2020)1. The time-mean difference maps of precipitation and 850 hPa wind from these two experiments relative to HISTNAT are shown in Figure 5. It can be seen from Figure 5 that the ISM circulation and precipitation over the Indian subcontinent weakens in HISTAero relative to HISTNAT, whereas they strengthen in HISTGHG relative to HISTNAT. It is also interesting to note an increase (decrease) of precipitation over the WNP in HISTAero (HISTGHG) respectively, relative to HISTNAT. We are, however, unable to show the statistical significance of the anomalies in Figure 5, since only the time-averaged (1951–2005) precipitation and 850 hPa winds from HISTGHG and HISTAero are presently available with us, but not the yearly/monthly/daily fields2. It can be inferred from Figure 5 that the NH anthropogenic aerosol forcing has largely influenced the weakening of the ISM circulation and decrease of precipitation over the Indian subcontinent in HIST.
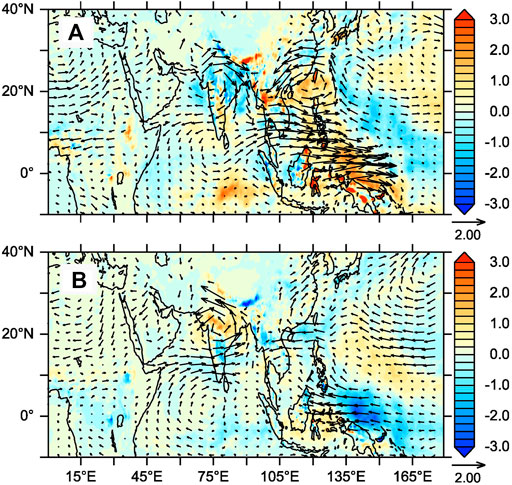
FIGURE 5. Spatial map of difference in the JJAS time-mean (1951–2005) precipitation (mm day-1, shaded) and 850 hPa winds (ms-1, vectors) (A) (HISTAero- HISTNAT) (B) (HISTGHG–HISTNAT).
To further support the anthropogenically-forced precipitation and circulation response between the ISM and WNP region, we examined the (HIST-HISTNAT) difference map of precipitation and 850 hPa winds for the boreal tropical cyclone season (Supplementary Figure S6). Here, it must be mentioned that Wang and Murakami (2020) have considered the May-to-October (MJJASO) months as the boreal tropical cyclone season. On the other hand, the May-to-November (MJJASON) months are regarded as the TC season for the WNP region by WMO (https://public.wmo.int/en/node/8447/tropical-cyclone-naming%29). The (HIST-HISTNAT) maps of precipitation and 850 hPa winds for JJAS, MJJASO and MJJASON are shown in Supplementary Figure S6. Interestingly, it turns out that the out-of-phase pattern of precipitation and wind anomalies between the ISM and WNP regions is noticeable in all the three seasons (i.e., JJAS, MJJASO and MJJASON). However, the magnitude of the out-of-phase anomalies between the ISM and WNP regions is reduced in MJJASO and substantially weakened in MJJASON, as compared to JJAS. While the contrasting anomalies between the ISM and WNP is dominant during JJAS, it is interesting to note that the magnitude and spatial extent of the precipitation anomalies over the equatorial Indian Ocean progressively increases as we move from the summer monsoon to the post-monsoon seasons.
Here we shall try to understand the forced weakening of the ISM in the HIST experiment. The spatial map of the difference in aerosol optical depth (AOD) between the HIST and HISTNAT experiments, shown in Figure 6A, is a measure of anthropogenic aerosols in the atmospheric column. A clear north-south asymmetrical pattern of AOD, with higher AOD values in the NH as compared to the SH, can be noted particularly over areas in Europe, Mediterranean, East Asia and South Asia - which are known to be dominated by industrial-type emissions (Stevens et al., 2017). On the other hand, the high AOD values over regions in Africa and Indonesia are mostly associated with anthropogenic biomass emissions (Stevens et al., 2017). Consistent with the spatial map of AOD, it can be noted that the NH regions over Europe, Mediterranean, East Asia and South Asia show negative aerosol radiative forcing, both at the surface (Figure 6B) and top-of-the-atmosphere (Supplementary Figure S7), which points to the shortwave radiation deficit resulting from scattering and absorption of radiation by anthropogenic aerosols. In particular, the aerosol radiative forcing is substantially higher in magnitude at the surface as compared to the top-of-the-atmosphere over Europe, Mediterranean, East Asia, South Asia, West and North Africa, Indonesia, which indicates strong extinction of radiation at the surface due to atmospheric absorption of shortwave radiation by absorbing aerosols (e.g., Ramanathan et al., 2005; Krishnan et al., 2016; Ayantika et al., 2021). The main point from the above analysis is the interhemispheric energy imbalance of the radiative fluxes resulting from the north-south asymmetric distribution of anthropogenic aerosol emissions.
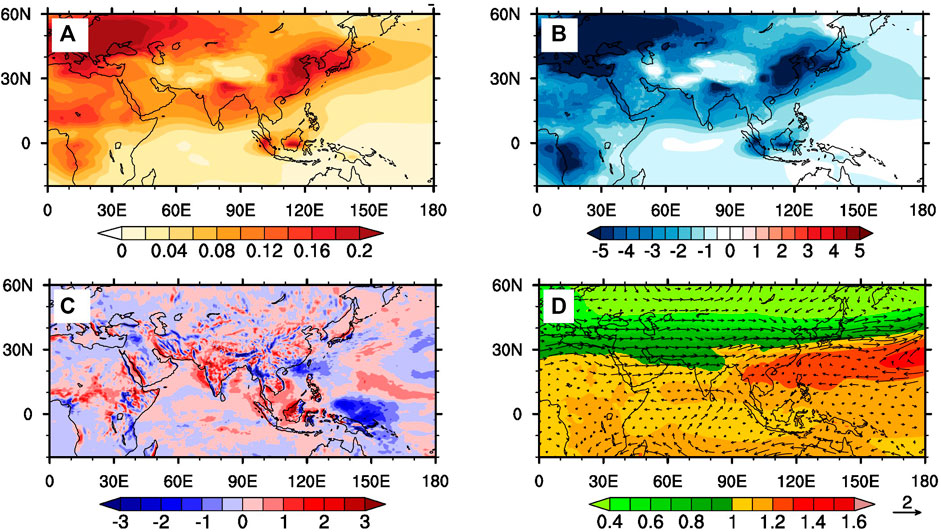
FIGURE 6. Difference (HIST- HISTNAT) maps of the JJAS time-mean fields for the period (1951–2005): (A) Aerosol optical depth (AOD) (B) Net radiative forcing at the surface (Wm-2) (C) 550 hPa vertical velocity ⍵ (x 100 Pa s-1) (D) Vertically averaged temperature (oC) and winds (vector, ms−1) from the mid-to-upper troposphere (600–150 hPa).
It is known from earlier studies that aerosol-induced energy imbalance between the NH and SH can alter the tropical meridional overturning circulation and in turn cause shifts in the tropical rain belts and precipitation changes over the tropics and monsoon regions (Bollasina et al., 2011; Shindell et al., 2012; Hwang et al., 2013; Seo et al., 2014; Wang et al., 2016). The difference (HIST minus HISTNAT) map of precipitation (Figure 4A) shows that the summer monsoon precipitation decrease over the Indian subcontinent and West Africa is accompanied by a southward shift of precipitation over the near-equatorial Indian Ocean and Africa. Enhancement of near-equatorial precipitation can also be noted over the equatorial west Pacific (Figure 4A), as discussed earlier. The anomalous precipitation response (Figure 4A) is largely consistent with the simulated changes in mid-tropospheric vertical velocities (Figure 6C).
The (HIST - HISTNAT) map of vertically integrated temperature and winds from 600 hPa to 150 hPa (Figure 6D) shows relatively cooler temperatures over the Mediterranean, West Asia and northern India and the mid-latitude regions of the Asian continent as compared to the equatorial and tropical regions, indicative of a weakened meridional gradient of mid-to-upper tropospheric temperature over the Asian continent. The vertically integrated (600–150 hPa) wind anomalies (Figure 6D) are dominated by anomalous mid-latitude westerlies over the Indian subcontinent. Basically, the intrusion of cold and dry westerly winds from the sub-tropics and mid-latitudes in the middle and upper troposphere tends to suppress the monsoon convective activity, which is typically observed during ‘breaks’ in the Indian monsoon (e.g., Krishnan et al., 2000; Krishnan et al., 2009; Krishnamurti et al., 2010). One can also note warmer temperatures extending eastward from East Asia with relatively cooler temperatures in the poleward flank. This feature gives rise to a strong meridional temperature gradient over the region and explains the strengthening of the mid-latitude westerly winds over the Far East and North Pacific, due to increased baroclinicity of the mid-latitude westerlies (Figure 6D).
The dynamical changes associated with the weakened ISM and intensified WNP convective activity can also be inferred from the longitude-pressure sections of east-west circulation and zonal winds, averaged between 18oN-25oN (Supplementary Figure S8). The longitude-pressure section of the east-west circulation in HIST (Supplementary Figure S8A) shows low-level westerlies and upper tropospheric easterlies associated with the ISM over the 60oE-90oE longitudes with ascending motions around 90oE and descent to the west around 45oE. Ascending motions are also seen around 120oE over the tropical west Pacific (Supplementary Figure S8A). The difference (HIST—HISTNAT) plot shows anomalous subsidence around 90oE and weakening of the ISM and the upper-tropospheric tropical easterly jet, which are clearly seen from the anomalous westerlies in the middle and upper troposphere to the west of 90oE (Supplementary Figure S8B). It is also interesting to note anomalous ascending motions around 135oE in Supplementary Figure S8B which are associated with enhanced convective activity over the tropical WNP. Mujumdar et al. (2007) suggested a possible feedback effect of the intensified WNP convective activity on the ISM via anomalous subsidence of the east-west circulation, which is also indicated in the model simulations. Longitude-pressure sections of condensational latent heating and vertical velocity, averaged between 18oN-25oN, are shown in Supplementary Figure S8. The HIST experiment (Supplementary Figure S8C) shows latent heating and upward motions over three longitudinal bands viz., 75oE-90oE, 90oE-110oE and east of 120oE, which correspond to convective activities associated with the ISM, Indo-China and the tropical west Pacific, respectively. In the difference (HIST–HISTNAT) plot (Supplementary Figure S8D), we note a decrease of latent heating and reduced upward motions over the ISM region, whereas the regions over the tropical west Pacific and Indo-China show stronger latent heating and increased upward motions.
The large-scale summer monsoon cross-equatorial flow can be understood as a n=2 Rossby response to an anti-symmetric pattern of boreal summer diabatic heating (Gill, 1980) and this feature is captured by simplified atmospheric models forced by the observed diabatic heating (e.g., Hoskins and Rodwell, 1995; Krishnan et al., 2000; Choudhury and Krishnan, 2011). Additionally, it is known that the East African Highlands and surface frictional effects are essential ingredients for maintaining the monsoon low-level East African jet, also known as the Somali jet (e.g., Anderson, 1976; Krishnamurti et al., 1983; Rodwell and Hoskins, 1995). The high-resolution LMDz4 zoomed setup has important value additions in terms of simulating the summer monsoon precipitation, including the orographic rainfall over the narrow Western Ghats, as well as the coupling between precipitation and low-level monsoon winds (see Sabin et al., 2013; Krishnan et al., 2016). Sabin et al. (2013) showed that high-resolution (grid size ∼35 km) telescopic zooming over South Asia and adjoining areas including the East African Highlands, significantly strengthens the Somali jet and enhances the mean monsoon rainfall over the Indian landmass, as compared to the simulation without zooming.
This section discusses the physical mechanism of the ISM-WNP connection in a changing climate. While anthropogenic GHG and aerosols exert opposite radiative effects on the climate system, the mechanism of the ISM precipitation response to the anthropogenic drivers is far more complex (see Krishnan et al., 2016; Ayantika et al., 2021). As compared to the global warming signal, the anthropogenic aerosol forcing mostly dominates over the NH resulting in an interhemispheric energy imbalance of radiative fluxes which in turn causes a southward shift of the tropical rain belts, which can be prominently seen over the Indian Ocean and West African regions, resulting in reduced precipitation over the Indian landmass and a weakened ISM circulation in the HIST simulation (Figure 4A). Additionally, the atmospheric absorption of shortwave radiation by absorbing aerosols over the Asian region results in strong extinction of radiation at the surface (see Figure 6B) which in turn can weaken the low-level southwesterly monsoon winds over the Arabian Sea, Indian landmass and Bay of Bengal (Figure 4A) by increasing the atmospheric static-stability (Ayantika et al., 2021). It is also noted that the suppressed ISM convective activity allows anomalous southward intrusion of mid-latitude westerlies in the middle and upper troposphere into west Asia and the Indian subcontinent (Figure 4D, Supplementary Figure S5).
A particularly noteworthy aspect of the HIST simulation is the reorientation of the low-level anomalous westerly winds from the near-equatorial and tropical eastern Indian Ocean towards the west Pacific, following a reduction in the ISM precipitation (Figure 4A) - a feature typically observed during ‘breaks’ in the ISM (see Rodwell, 1997; Krishnan et al., 2006). This reorientation of the monsoon low-level winds results in enhanced convergence of the westerly wind anomalies from the eastern Indian Ocean and the Pacific easterly trade winds and enrichment of low-level cyclonic vorticity over the tropical WNP and adjoining areas (Figure 4A) and encourages tropical cyclogenesis over the region (see Figure 8).
The enhancement of convection over the WNP in the HIST simulation prompted us to examine the TC response to climate change. We analysed the tropical cyclogenesis potential in the HIST and HISTNAT experiment based on the genesis potential index (GPI) as defined by (Emanuel and Nolan, 2004). The GPI is a measure of the number of tropical disturbances per unit area per unit time. The formula for computing the GPI is given by
GPI = |105ɳ|(3/2)(H/50)3(Vpot/70)3(1+0.1Vshear)−2, where η, H, Vpot, and VShear refer to 850 hPa absolute vorticity (s−1), 600 hPa relative humidity, potential intensity (m s−1) and the magnitude of the vertical wind shear between 850 hPa and 200 hPa (ms−1), respectively (Camargo et al., 2007). We used the daily data from HIST and HISTNAT for the GPI computation. From the daily GPI values for the period (1951–2005), we computed the JJAS average for each year and then calculated the climatological mean GPI by taking the average for the period 1951–2005.
Tang et al. (2022) evaluated the impact of model resolution, TC tracker, and ocean coupling in simulating TC activities over the WNP using the CMIP6 High-Resolution Model Intercomparison Project (HighResMIP). They noted that high resolution models have a higher Taylor skill score in capturing both the temporal and spatial patterns of tropical cyclogenesis frequency and accumulated cyclone energy as compared to low resolution models. The LMDz4 model setup in our study has sufficiently high resolution over the WNP region. The latitudinal grid size in our model setup is less than 35 km and the longitudinal grid size varies between 0.5o to 0.76o over the domain (110 oE-130oE, 10oN-30oN) which covers Taiwan, Chinese mainland and adjoining areas. In fact, the latitudinal resolution over this domain used in this study is comparable to the highest resolution of the HighResMIP models considered by Tang et al. (2022). Following Wang and Chan (2002), we have considered a large region of the tropical Pacific Ocean (120oE-180oE, 5oN-30oN) as the WNP domain. The climatological annual cycle of GPI averaged over the WNP domain using the LMDz4 HIST experiment and ERA5 reanalysis is shown in Figure 7. It can be seen that the annual cycle of GPI over WNP in the HIST experiment is in reasonable agreement with ERA5, although the model overestimates the GPI values particularly during June, August and September (Figure 7).
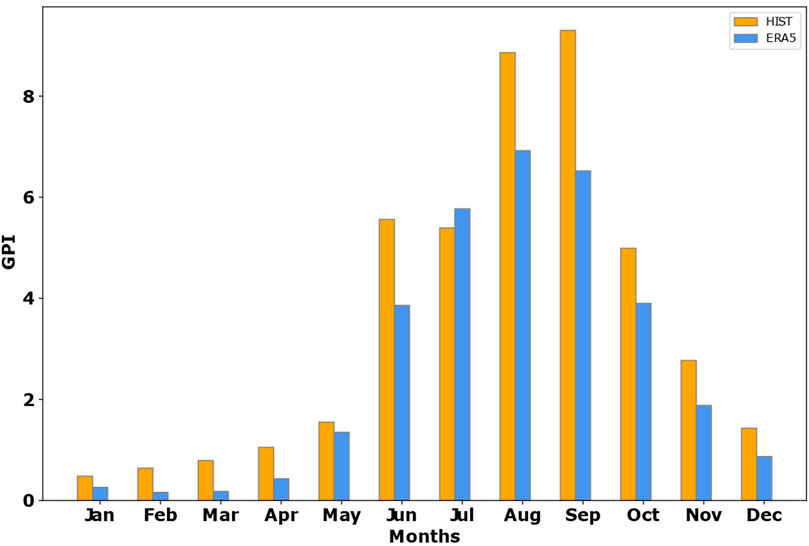
FIGURE 7. Time-mean (1979–2005) annual cycle of GPI over WNP (120oE-180oE, 5oN-30oN) from HIST (orange bars) and ERA5 reanalysis (blue bars).
The spatial maps of the time-mean GPI for the HIST and HISTNAT experiments and the difference (HIST - HISTNAT) map along with the statistical significance are shown in Figures 8A–C, respectively. Higher values of GPI can be noted in HIST, as compared to HISTNAT, in the 18oN-25oN latitude belt extending eastward from the WNP region around Taiwan up to 170o E (Figure 8C), which are statistically significant (p < 0.05). We also note that the GPI values to the south of 15oN over the South China Sea and areas adjoining Philippines are lower in HIST relative to HISTNAT. The positive anomalies of GPI (Figure 8C) over a large-area extending from the WNP up to 170o E point to a higher potential for tropical cyclogenesis over this region in HIST as compared to HISTNAT. The individual components of the GPI viz., potential intensity (m s−1), absolute vorticity (s−1) at 850 hPa, relative humidity at 600 hPa, and vertical wind shear between 850 hPa and 200 hPa (ms−1) for HIST, HISTNAT and their differences (%) along with statistical significance are shown in Supplementary Figure S9. It can be noted that the HIST experiment shows a statistically significant increase in potential intensity, mid-tropospheric relative humidity and absolute vorticity over the tropical WNP, relative to HISTNAT, which are typically in the range of 2%–6% (Supplementary Figure S9F-H). The HIST experiment also shows a slight decrease of vertical shear around Taiwan with a larger decrease to the east and southeast, while the areas near South China Sea and Philippines show an increase relative to HISTNAT (Supplementary Figure S9I). It is particularly interesting to note a substantial enrichment of low-level relative vorticity (∼38%) in HIST, relative to HISTNAT, over a large area of the tropical western north Pacific (110oE-135oE, 10oN-20oN) (Supplementary Figure S9J).
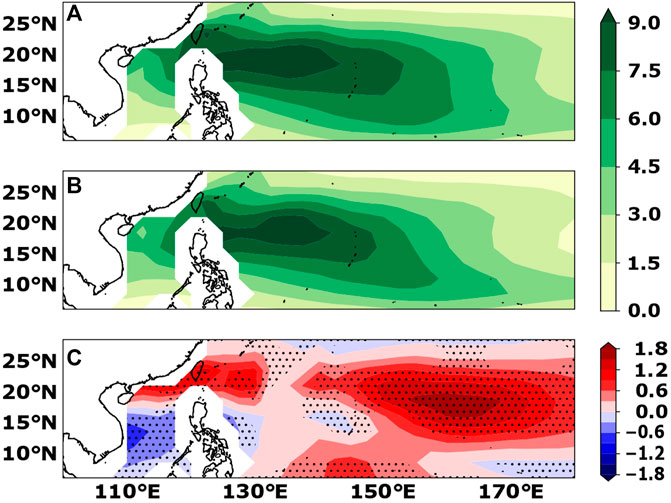
FIGURE 8. Spatial map of JJAS time-mean tropical cyclogenesis potential index (GPI) for the period 1951–2005: (A) HIST, (B) HISTNAT and (C) (HIST–HISTNAT). The dots indicate statistical significance (p < 0.05) based on Student’s t-test.
Using the daily outputs of sea-level pressure (SLP), we examined the bottom one percentile values of SLP in HIST and HISTNAT, and their difference (HIST - HISTNAT) along with statistical significance, which are shown in Figure 9A–C. The bottom one percentile of SLP is a measure of extreme cyclonic activity. We note from Figure 9C that the extremely low SLP values are significantly lower in HIST as compared to HISTNAT, over a large area around Taiwan, the Chinese mainland and areas to the southwest of Japan. This also points to the role of enhanced activity of extreme TCs, in response to climate change, in contributing to the higher GPI values around this region in Figure 8C.
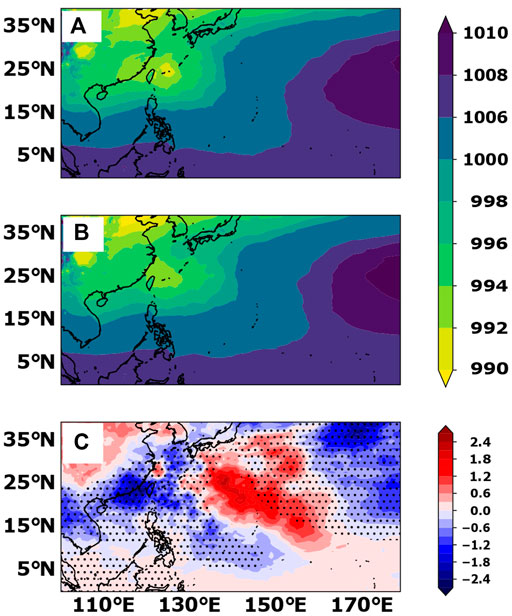
FIGURE 9. Spatial map of the bottom 1 percentile SLP from 01 June to 30 September for the period (1951–2005): (A) HIST (B) HISTNAT (C) (HIST—HISTNAT). Dots indicate the statistical significance levels (p < 0.05) based on Student’s t-test.
The probability density function (PDF) of GPI computed over the WNP domain (120oE-180oE, 5oN-30oN) for the two experiments is shown in Figure 10A. It can be noted that the mean value of GPI in HIST (= 4.36) is shifted to the right as compared to that of HISTNAT (= 3.84), indicating an increase in the mean GPI in HIST by 13.5% relative to HISTNAT. In other words, the HIST experiment shows significantly higher frequency of tropical cyclogenesis over the WNP as compared to HISTNAT. Further, we compared the bottom one percentile SLP in HIST and HISTNAT, over the region (110oE-130oE, 15oN-25oN) around Taiwan and the Chinese mainland by computing the generalized extreme value distribution and fitting with the Weibull distribution (Figure 10B). It is noted that the mean of the extremely low SLP in HIST is 996.07 hPa and the left tail extends up to 991.18 h Pa; whereas the corresponding mean in HISTNAT is 996.87 hPa and the left tail extends up to 992 hPa. The reference SLP (= 995.5 hPa) is the intersection of the HIST and HISTNAT Weibull distribution curves. To get an estimate of the probability of the lowest one percentile SLP, we calculated the area under the curve to the left of the reference SLP (995.5 hPa) for HIST and HISTNAT (Figure 10B), respectively. By computing the definite integrals for the two curves in Figure 10B between the reference SLP and the lower limit (i.e., left tail), it is found that the probability of extremely low SLP (<995.5 hPa) is 10.3% higher in HIST as compared to HISTNAT.
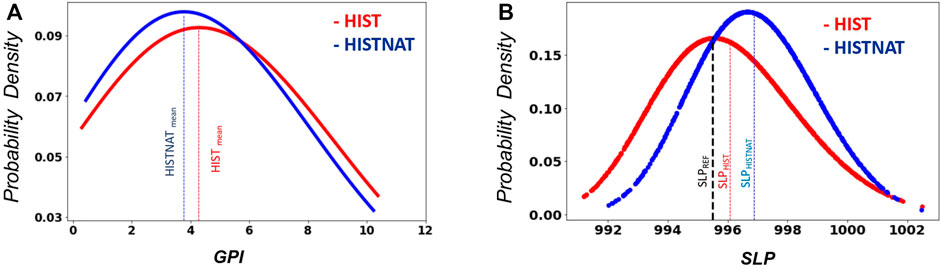
FIGURE 10. (A) Probability distribution function of GPI over WNP (120oE–180oE, 5oN–30oN) for HIST and HISTNAT (B) Generalized Extreme Value (GEV) distribution of extremely low SLP (<1 percentile) calculated over the domain (110oE–130oE, 15oN–25oN) for HIST and HISTNAT. The blue and red dashed lines are the mean SLP for HISTNAT and HIST, respectively. The black dashed line is the reference SLP (995.5 hPa) which corresponds to the intersection of the two GEV distribution curves.
In an important study, Joseph (1990) noted that the ISM rainfall variations have linkages to the WNP TC activity and low-frequency intra-seasonal variations of convection over the tropical Indian and west Pacific Oceans on the 30–50 day time-scale. He highlighted the complex nature of interactions of convective activities over the Indian monsoon and tropical Indo-Pacific regions on sub-seasonal/intra-seasonal time-scales.
This section focuses on understanding the causal relationships among the ISM circulation, WNP TC activity and wind anomalies over the tropical Indo-Pacific region, in the HIST and HISTNAT experiments. Keeping this in view, we have performed the PCMCI causal analysis which combines the Peter and Clarke (PC) algorithm (see Sprites et al., 2000) and the Momentary Conditional Independence (MCI) algorithm (Runge et al., 2019). The PCMCI causal analysis makes it possible to identify causal relationships in time-series of complex dynamical systems and quantify their strengths and their interdependences (Runge et al., 2014; Runge et al., 2019; Di Capua et al., 2020). A brief description of the PCMCI causal analysis is given in Appendix.
By employing the PCMCI analysis on the HIST and HISTNAT experiments, it is intended to gain additional insights into the role of climate change on the interactions among the ISM circulation, WNP TC activity and equatorial wind anomalies. The PC algorithm computes the regression coefficient between two time-series with varying lags, resulting in different sets of parents and actors; and provides the lagged regression with the maximum strength. The MCI algorithm computes the partial correlation between the actor and its respective set of parents and the MCI test is performed to determine the final set of parents. The details of the PCMCI causal analysis are explained in Di Capua et al. (2020).
To represent the ISM circulation index, we used the daily series of the Indian monsoon index (IMI) suggested by Wang et al. (2001) which is calculated as the difference of the area-averaged 850 hPa zonal winds between box 1 (40oE-80oE,5oN-15oN) and box 2 (700 E-90oE,20oN-30oN). The IMI circulation index is highly correlated with all India summer rainfall (Wang et al., 2001). The daily time-series of GPI averaged over the WNP domain (120oE-180oE, 5oN-30oN) is used as the index to represent the WNP TC activity. The winds over the near-equatorial and tropical Indo-Pacific region serve as the connection between the convective activities over the Indian landmass and WNP regions (see Joseph, 1990; Rodwell, 1997; Krishnan et al., 2006; Mujumdar et al., 2007). We use the daily time-series of zonal winds averaged over the region (1000 E-130oE, 5oN-20oN) to represent the near-equatorial and tropical Indo-Pacific wind index (IPWND). For the PCMCI causal analysis, we considered the daily time-series of the above three indices (IMI, GPI and IPWND) during the June-September months for the period 1951–2005 from the HIST and HISTNAT experiments.
The causal effect network (CEN), developed using the IMI, GPI and IPWND indices for the HIST and HISTNAT experiments, is shown in Figures 11A, B, respectively. We begin our analysis by first examining the CEN between IMI and GPI in HIST and HISTNAT. In the case of HIST, we note that the bi-directional links between IMI and GPI are negative and statistically significant indicating that a weakening (strengthening) of IMI tends to be followed by possible increase (decrease) of GPI with a lag of 5 days. Conversely, a weakening (strengthening) of the GPI in HIST tends to be followed by an increase (decrease) of IMI with a lag of 9 days. In the case of HISTNAT, a weakening (strengthening) of the GPI tends to be followed by an increase (decrease) of IMI with a longer time-lag of about 28 days. On the other hand, it is noted from Figure 11B that a strengthening (weakening) of IMI in HISTNAT tends to be followed by an increase (decrease) of GPI with a lag of about 23 days. The reason for the opposite sign of the path-coefficient from IMI to GPI in HISTNAT, albeit with a significantly longer time-lag, is not clear to us. It appears that this complex behaviour may be possibly related to the slow northward movement of large-scale organized convective anomalies from the equatorial areas into the Indian subcontinent and tropical west Pacific on the 30–50 day time-scale, associated with the active and break monsoon cycles (Joseph, 1990). Nevertheless, the main point is that the time-lags of the links between IMI and GPI appear to be generally shorter in HIST and much longer (23–28 days) in HISTNAT. The relatively shorter time-lags (∼4–7 days) in HIST and longer time-lags (∼19–28 days) in HISTNAT are also consistently seen in the (IMI and IPWND) and (GPI and IPWND) links. While the shorter time-scales of the links among IMI, GPI and IPWND in HIST are more indicative of synoptic time-scale interactions; the longer time-scales in HISTNAT are indicative of low-frequency intra-seasonal interactions. In summary, it is noted that the causal relationships among the IMI, GPI and IPWND indices are statistically significant and associated with lags having shorter time-scales (∼4–9 days) in HIST, whereas they are mostly associated with lags having significantly longer time-scales (∼19–28 days) in HISTNAT. Given the inherent non-linearities of the IMI, GPI and IPWND time-series and their mutual interactions on different time-scales, further work is needed to fully comprehend the behaviour of the causal relationships in HIST and HISTNAT which is beyond the scope of this work. Also the non-availability of daily outputs from the HISTGHG and HISTAero has been a limitation in identifying the individual roles of anthropogenic GHG and aerosol forcing on the causal relationships among the IMI, GPI and IPWND indices.
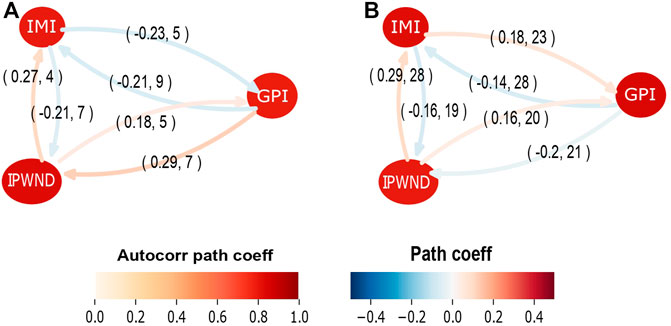
FIGURE 11. Causal network analysis among Indian Monsoon Index (IMI), WNP Genesis Potential Index (GPI) and Tropical Indo-Pacific wind index (IPWND) (A) HIST and (B) HISTNAT. The dark red circles around the three nodes (IMI, GPI and IPWND) indicate high auto-correlation path coefficient. The red links correspond to positive standardised regression path coefficients and the blue links correspond to negative standardised regression path coefficients and the arrows represent the direction of the link. The first number in the bracket represents the maximum strength of the causal link expressed as standardised regression path coefficient and the second number corresponds to the lag with maximum strength. Only statistically significant causal links with p < 0.01 are shown.
Human-induced climate change has been a key driver of the observed changes in global land monsoon precipitation, since the second half of the 20th century (IPCC, 2021). In particular, it is recognized that the expected enhancement of the ISM precipitation by greenhouse gas (GHG) forcing has been offset by the NH anthropogenic aerosols, causing precipitation reductions during the post-1950. In this study, we performed a detailed diagnostic analysis of two high-resolution climate simulations, with and without anthropogenic forcing (i.e., HIST and HISTNAT) for the historical period (1951–2005), to understand the influence of human-induced climate change on the linkage of convective activities between the two regions. In addition, we performed causal network analyses to quantify causal relationships among the ISM circulation, WNP TC activity and wind anomalies over the tropical Indo-Pacific region, using the HIST and HISTNAT experiments.
The present findings suggest that an anthropogenically-forced weakening of the ISM precipitation and circulation significantly alters the monsoon flow pattern over the near-equatorial and tropical Indo-Pacific Oceans in a manner as to enhance the tropical cyclogenesis over WNP. In particular, we find that the forced weakening of the ISM is accompanied by a significant increase (13.5%) in the tropical cyclogenesis potential index (GPI) over the WNP. Furthermore, it is noted that the probability of extremely low SLP (<995.5 hPa) around Taiwan and the Chinese mainland is 10.3% higher in HIST as compared to HISTNAT.
Using the HIST and HISTNAT simulations, we also performed causal effect network (CEN) analyses of the IMI, GPI and IPWND indices which show statistically significant causal relationships among the Indian monsoon, WNP TC activity and winds over the tropical Indo-Pacific. The CEN analysis enabled us to fingerprint the role of climate change on the causal relationships among the three indices. From the HIST experiment, it is noted that a weakening of IMI can lead to possible increase of GPI with a lag of about 5 days and an increase of IPWND in about 7 days. On the other hand, the time-scales of interactions among the three indices are found to be much longer (∼19–28 days) in HISTNAT.
While the time-mean difference maps of precipitation and 850 hPa winds from the GHG-only forcing (HISTGHG) and aerosol-only forcing (HISTAero) experiments (Figure 5) suggest that the weakening of ISM in the HIST experiment is linked to the anthropogenic aerosol forcing, the non-availability of daily outputs from the HISTGHG and HISTAero precludes us from making detailed inferences about the individual contributions of anthropogenic GHG and aerosol forcing on the ISM and WNP interactive systems.
Although future climate projections indicate an increase of ISM precipitation during the latter half of the 21st century in response to continued global warming across the CMIP6 high emission scenarios, it is important to note that the near-term (2021–2040) monsoon precipitation response will be dominated by the effects of internal variability and future aerosol emission pathways (Huang et al., 2020; Wilcox et al., 2020; Douville et al., 2021). Thus the results from this study have key policy implications for near-term mitigation of the Asian monsoon hydrological response to climate change.
The observed datasets (GPCP, ERA5, IBTrACS) are publicly available. Selected fields of the LMDz4 simulations are available in the link below. Additional fields from the LMDz4 simulations can be provided upon request. https://cccr.tropmet.res.in/home/workshop/sept2014/index.html.
AS performed the analysis of model simulations and observations, performed the causal effect network (CEN) analysis, prepared the figures and was involved in conceptualization of the problem and manuscript writing. RK led the conceptualization of the scientific problem, guided the study and led the manuscript writing. TS conducted the LMDz4 simulations and was involved in the scientific discussions. All authors reviewed the manuscript.
The authors thank the Indian Institute of Tropical Meteorology and Ministry of Earth Sciences, Government of India for supporting this research work. AS acknowledges the PhD fellowship support from University Grants Commission, Government of India. The LMDZ4 simulations were performed on the IITM HPC. The authors are grateful to the reviewers and the editor for providing valuable comments and suggestions that have significantly helped us to improve the manuscript. The use of Tigramite python package developed by Jakob Runge for causal inference is gratefully acknowledged. Also, thanks to Manmeet Singh for providing useful tips about the python package. The authors thank the editor and the two reviewers for providing constructive reviews and helpful suggestions.
The authors declare that the research was conducted in the absence of any commercial or financial relationships that could be construed as a potential conflict of interest.
All claims expressed in this article are solely those of the authors and do not necessarily represent those of their affiliated organizations, or those of the publisher, the editors and the reviewers. Any product that may be evaluated in this article, or claim that may be made by its manufacturer, is not guaranteed or endorsed by the publisher.
The Supplementary Material for this article can be found online at: https://www.frontiersin.org/articles/10.3389/feart.2023.1149344/full#supplementary-material
1It must be mentioned that the HISTGHG and HISTAero experiments were performed on a different high-performance computing (HPC) system that is presently not available to us.
2Fortunately, only the time-averaged (1951–2005) fields of precipitation and 850 hPa winds from the HISTGHG and HISTAero had been saved from these runs and are presented in Figure 5.
Adler, R. F., Sapiano, M. R. P., Huffman, G. J., Wang, J. J., Gu, G., Bolvin, D., et al. (2018). The global precipitation climatology Project (GPCP) monthly analysis (new version 2.3) and a review of 2017 global precipitation. Atmos 9, 138. doi:10.3390/ATMOS9040138
Anderson, D. L. T. (1976). The low-level jet as a western boundary current. Mon. Wea. Rev. 104, 907–921. doi:10.1175/1520-0493(1976)104<0907:TLLJAA>2.0.CO;2
Ayantika, D. C., Krishnan, R., Singh, M., Swapna, P., Sandeep, N., Prajeesh, A. G., et al. (2021). Understanding the combined effects of global warming and anthropogenic aerosol forcing on the South Asian monsoon. Clim. Dyn. 56, 1643–1662. doi:10.1007/s00382-020-05551-5
Basconcillo, J., Cha, E. J., and Moon, I. J. (2021). Characterizing the highest tropical cyclone frequency in the Western North Pacific since 1984. Sci. Rep. 11. doi:10.1038/s41598-021-93824-2
Biasutti, M., Voigt, A., Boos, W. R., Braconnot, P., Hargreaves, J. C., Harrison, S. P., et al. (2018). Global energetics and local physics as drivers of past, present and future monsoons. Nat. Geosci. 11, 392–400. doi:10.1038/s41561-018-0137-1
Bollasina, M. A., Ming, Y., and Ramaswamy, V. (2011). Anthropogenic aerosols and the weakening of the south Asian summer monsoon. Science 80334, 502–505. doi:10.1126/science.1204994
Boos, W. R., and Emanuel, K. A. (2009). Annual intensification of the Somali jet in a quasi equilibrium framework: Observational composites. Q. J. R. Meteorol. Soc. 135 (639), 319–335. doi:10.1002/qj.388
Camargo, S. J., Emanuel, K. A., and Sobel, A. H. (2007). Use of a Genesis potential index to diagnose ENSO effects on tropical cyclone Genesis. J. Clim. 20, 4819–4834. doi:10.1175/JCLI4282.1
Chan, J. C. L., and Zhou, W. (2005). PDO, ENSO and the early summer monsoon rainfall over south China. Geophys Res. Lett. 32, L08810. doi:10.1029/2004GL022015
Cherchi, A., Alessandri, A., Masina, S., and Navarra, A. (2011). Effects of increased CO2 levels on monsoons. Clim. Dyn. 37, 83–101. doi:10.1007/s00382-010-0801-7
Choudhury, A. D., and Krishnan, R. (2011). Dynamical response of the South Asian monsoon trough to latent heating from stratiform and convective precipitation. J. Atmos. Sci. 68, 1347–1363. doi:10.1175/2011jas3705.1
Di Capua, G., Kretschmer, M., Donner, R. V., Hurk, B., Vellore, R., Krishnan, R., et al. (2020). Tropical and mid-latitude teleconnections interacting with the Indian summer monsoon rainfall: A theory-guided causal effect network approach. Earth Syst. Dyn. 11 (1), 17–34. doi:10.5194/esd-11-17-2020
Douville, H., Raghavan, K., Renwick, J., Allan, R. P., Arias, P. A., Barlow, M., et al. (2021). “Water cycle changes,” in Climate change 2021: The physical science basis. Contribution of working group I to the sixth assessment report of the intergovernmental panel on climate change. Editors V. Masson-Delmotte, P. Zhai, A. Pirani, S. L. Connors, C. Péan, S. Bergeret al. (Cambridge, United Kingdom and New York, NY, USA: Cambridge University Press), 1055–1210. doi:10.1017/9781009157896.010
Emanuel, K., Sundararajan, R., and Williams, J. (2008). Hurricanes and global warming: Results from downscaling IPCC AR4 simulations. Bull. Am. Meteorol. Soc. 89, 347–368. doi:10.1175/bams-89-3-347
Emanuel, K. (2010). Tropical cyclone activity downscaled from NOAA-CIRES Reanalysis, 1908–1958. J. Adv. Model. Earth Syst. 2, 1. doi:10.3894/james.2010.2.1
Emanuel, K. A., and Nolan, D. (2004). “Tropical cyclone activity and global climate,” in 26th conf. On hurricanes and tropical Meteorology (Miami, FL: Ameri. Meteor. Soc), 240–241.
Enomoto, T., Hoskins, B. J., and Matsuda, Y. (2003). The formation mechanism of the Bonin high in August. Q. J. R. Meteorol. Soc. 129, 157–178. doi:10.1256/qj.01.211
Feichter, J., Roeckner, E., Lohmann, U., and Liepert, B. (2004). Nonlinear aspects of the climate response to greenhouse gas and aerosol forcing. J. Clim. 17 (12), 2384–2398. doi:10.1175/1520-0442(2004)017<2384:naotcr>2.0.co;2
Gadgil, S. (2003). The Indian monsoon and its variability. Ann. Rev. Earth Planet. Sci. 31, 429–467. doi:10.1146/annurev.earth.31.100901.141251
Ganguly, D., Rasch, P. J., Wang, H., and Yoon, J-H. (2012). Climate response of the South Asian monsoon system to anthropogenic aerosols. J. Geophys. Res. Atmos. 117, D13209. doi:10.1029/2012JD017508
Gao, S., Zhu, L., Zhang, W., and Shen, X. (2020). Western north pacific tropical cyclone activity in 2018: A season of extremes. Sci. Rep. 10, 5610–5619. doi:10.1038/s41598-020-62632-5
Gill, A. E. (1980). Some simple solutions for heat-induced tropical circulation. Quart. J. Roy. Meteor. Soc. 106, 447–462. doi:10.1002/qj.49710644905
Harr, P. A., and Elsberry, R. L. (1991). Tropical cyclone track characteristics as a function of large-scale circulation anomalies. Mon. Weather Rev. 119, 1448–1468. doi:10.1175/1520-0493(1991)119<1448:tctcaa>2.0.co;2
Hersbach, H., Bell, B., Berrisford, P., Hirahara, S., Horanyi, A., Munoz-Sabater, J., et al. (2020). The ERA5 global reanalysis. Q. J. R. Meteorol. Soc. 146, 1999–2049. doi:10.1002/qj.3803
Hoskins, B. J., and Rodwell, M. J. (1995). A model of the asian summer monsoon. Part I: The global scale. J. Atmos. Sci. 52 (9), 1329–1340. doi:10.1175/1520-0469(1995)052<1329:amotas>2.0.co;2
Huang, X., Zhou, T., Dai, A., Li, H., Li, C., Chen, X., et al. (2020). South Asian summer monsoon projections constrained by the interdecadal pacific oscillation. Sci. Adv. 6 (11), eaay6546. doi:10.1126/sciadv.aay6546
Hwang, Y., Frierson, D. M. W., and Kang, S. M. (2013). Anthropogenic sulfate aerosol and the southward shift of tropical precipitation in the late 20th century. Geophys Res. Lett. 40, 2845–2850. doi:10.1002/grl.50502
Iyer, V. D. (1931). Typhoons of the pacifc oceans and South China sea. India Meteorol. Dep. (IMD) Sci. Notes 3, 25.
Joseph, P. V. (1990). Monsoon variability in relation to equatorial trough activity over Indian and West Pacific Oceans. MAUSAM 41, 150–155. doi:10.54302/mausam.v41i2.2560
Kitoh, A. (2017). The asian monsoon and its future change in climate models: A review. J. Meteorol. Soc. Jpn. Ser. II 95, 7–33. doi:10.2151/jmsj.2017-002
Kitoh, A., Yukimoto, S., Noda, A., and Motoi, T. (1997). Simulated changes in the asian summer monsoon at times of increased atmospheric CO<sub>2</sub>. J. Meteorol. Soc. Jpn. Ser. II 75, 1019–1031. doi:10.2151/jmsj1965.75.6_1019
Knapp, K. R., Kruk, M. C., Levinson, D. H., Diamond, H. J., and Neumann, C. J. (2010). The international best track archive for climate stewardship (IBTrACS): Unifying tropical cyclone data. Bull. Am. Meteorol. Soc. 91, 363–376. doi:10.1175/2009bams2755.1
Kretschmer, M., Adams, S. V., Arribas, A., Robinson, N., Saggioro, E., and Shepherd, T. G. (2021). Quantifying causal pathways of teleconnections. Bull. Am. Meteorol. Soc. 102, E2247–E2263. doi:10.1175/BAMS-D-20-0117.1
Krishnamurti, T. N., Molinari, J., Pan, H., and Wong, V. (1977). Downstream amplification and formation of monsoon disturbances. Mon. Weather Rev. 105, 1281–1297. doi:10.1175/1520-0493(1977)105<1281:daafom>2.0.co;2
Krishnamurti, T. N., Wong, V., Pan, H. L., Pasch, R., Molinari, J., and Ardanuy, P. (1983). A three dimensional planetary boundary layer model for the Somali jet. J. Atmos Sci. 40, 894–908.
Krishnamurti, T. N., Thomas, A., Simon, A., and Kumar, V. (2010). Desert air incursions, an overlooked aspect, for the dry spells of the Indian summer monsoon. J. Atmos. Sci. 67, 3423–3441. doi:10.1175/2010jas3440.1
Krishnan, R., Zhang, C., and Sugi, M. (2000). Dynamics of breaks in the Indian summer monsoon. J. Atmos. Sci. 57, 1354–1372. doi:10.1175/1520-0469(2000)057<1354:dobiti>2.0.co;2
Krishnan, R., Ramesh, K. V., Samala, B. K., Meyers, G., Slingo, J. M., and Fennessy, M. J. (2006). Indian Ocean-monsoon coupled interactions and impending monsoon droughts. Geophys Res. Lett. 33, L08711. doi:10.1029/2006GL025811
Krishnan, R., Kumar, V., Sugi, M., and Yoshimura, J. (2009). Internal feedbacks from monsoon-midlatitude interactions during droughts in the Indian summer monsoon. J. Atmos. Sci. 66, 553–578. doi:10.1175/2008JAS2723.1
Krishnan, R., Sabin, T. P., Ayantika, D. C., Kitoh, A., Sugi, M., Murakami, H., et al. (2013). Will the South Asian monsoon overturning circulation stabilize any further? Clim. Dyn. 40, 187–211. doi:10.1007/s00382-012-1317-0
Krishnan, R., Sabin, T. P., Vellore, R., Mujumdar, M., Sanjay, J., Goswami, B. N., et al. (2016). Deciphering the desiccation trend of the South Asian monsoon hydroclimate in a warming world. Clim. Dyn. 47, 1007–1027. doi:10.1007/s00382-015-2886-5
Krishnan, R., and Sugi, M. (2001). Baiu rainfall variability and associated monsoon teleconnections. J. Meteorol. Soc. Jpn. Ser. II 79, 851–860. doi:10.2151/jmsj.79.851
Krishnan, R., Sabin, T. P., Sagar, A., Swapna, P., and Choudhury, A. D. (2020). South Asian monsoon climate change projections. CLIVAR Exchanges, 50–54. doi:10.36071/clivar.79.2020
Kumar, V., and Krishnan, R. (2005). On the association between the Indian summer monsoon and the tropical cyclone activity over the Northwest Pacific. Curr. Sci. 88, 602–612. doi:10.13140/2.1.2044.4805
Li, T., and Hsu, P. C. (2017). Fundamentals of tropical climate dynamics, Text Book. Springer. ISBN 978-3-319-59595-3.
Li, Z., Yu, W., Li, T., Murty, V. S. N., and Tangang, F. (2013). Bimodal character of cyclone climatology in the Bay of Bengal modulated by monsoon seasonal cycle. J. Clim. 26 (3), 1033–1046. doi:10.1175/jcli-d-11-00627.1
Liu, K. S., and Chan, J. C. L. (2020). Recent increase in extreme intensity of tropical cyclones making landfall in South China. Clim. Dyn. 55, 1059–1074. doi:10.1007/s00382-020-05311-5
IPCC (2021). in Climate change 2021: The physical science basis. Contribution of working group I to the sixth assessment report of the intergovernmental panel on climate change. Editors V. Masson-Delmotte, P. Zhai, A. Pirani, S. L. Connors, C. Péan, S. Bergeret al. (Cambridge, United Kingdom and New York, NY, USA: Cambridge University Press). doi:10.1017/9781009157896
Mohtadi, M., Prange, M., and Steinke, S. (2016). Palaeoclimatic insights into forcing and response of monsoon rainfall. Nature 533, 191–199. doi:10.1038/nature17450
Monerie, P. A., Wilcox, L. J., and Turner, A. G. (2022). Effects of anthropogenic aerosol and greenhouse gas emissions on northern hemisphere monsoon precipitation: Mechanisms and uncertainty. J. Clim. 35, 2305–2326. doi:10.1175/JCLI-D-21-0412.1
Mujumdar, M., Kumar, V., and Krishnan, R. (2007). The Indian summer monsoon drought of 2002 and its linkage with tropical convective activity over northwest Pacific. Clim. Dyn. 28, 743–758. doi:10.1007/s00382-006-0208-7
Murakami, T., and Matsumoto, J. (1994). Summer monsoon over the Asian continent and Western north Pacific. J. Meteorol. Soc. Jpn. 72, 719–745. doi:10.2151/jmsj1965.72.5_719
Nie, J., Boos, W. R., and Kuang, Z. (2010). Observational evaluation of a convective quasi-equilibrium view of monsoons. J. Clim. 23 (16), 4416–4428. doi:10.1175/2010JCLI3505.1
Pattanaik, D. R., and Rajeevan, M. (2007). Northwest Pacific tropical cyclone activity and July rainfall over India. Meteorol. Atmos. Phys. 95, 63–72. doi:10.1007/s00703-006-0193-0
Polson, D., Bollasina, M., Hegerl, G. C., and Wilcox, L. J. (2014). Decreased monsoon precipitation in the Northern Hemisphere due to anthropogenic aerosols. Geophys Res. Lett. 41, 6023–6029. doi:10.1002/2014gl060811
Qian, Y., Murakami, H., Nakano, M., Hsu, P-C., Delworth, T. L., Kapnick, S. B., et al. (2019). On the mechanisms of the active 2018 tropical cyclone season in the North Pacific. Geophys Res. Lett. 46, 12293–12302. doi:10.1029/2019gl084566
Rajeevan, M. (1993). Interrelationship between NW pacific typhoon activity and Indian summer monsoon on inter-annual and intra-seasonal time-scale. MAUSAM 44, 109–111. doi:10.54302/mausam.v44i1.4974
Rajeevan, M., Srinivasan, J., Kumar, N. K., Gnanaseelan, C., and Ali, M. M. (2013). On the epochal variation of intensity of tropical cyclones in the Arabian Sea. Atmos. Sci. Lett. 14, 249–255. doi:10.1002/asl2.447
Raman, C. R. V. (1955). Breaks in the Indian southwest monsoon and typhoons in southwest Pacific. Curr. Sci. 24, 219–220.
Ramanathan, V., Chung, C., Kim, D., Bettge, T., Buja, L., Kiehl, J. T., et al. (2005). Atmospheric Brown clouds: Impacts on South Asian climate and hydrological cycle. Proc.Natl.Acad.Sci., U. S. A. 102, 5326–5333. doi:10.1073/pnas.0500656102
Ramarao, M. V. S., Krishnan, R., Sanjay, J., and Sabin, T. P. (2015). Understanding land surface response to changing South Asian monsoon in a warming climate. Earth Syst. Dyn. 6, 569–582. doi:10.5194/esd-6-569-2015
Ramsay, H. (2017). “The global climatology of tropical cyclones,” in Oxford research encyclopedia of natural hazard science (Oxford University Press), 34.
Rodwell, M. J. (1997). Breaks in the Asian monsoon: The influence of Southern Hemisphere weather systems. J. Atmos. Sci. 54, 2597–2611. doi:10.1175/1520-0469(1997)054<2597:bitamt>2.0.co;2
Rodwell, M. J., and Hoskins, B. J. (1995). A model of the Asian summer monsoon. Part II: Cross-equatorial flow and PV behavior. J. Atmos. Sci. 52 (9), 1341–1356. doi:10.1175/1520-0469(1995)052<1341:amotas>2.0.co;2
Runge, J., Petoukhov, V., and Kurths, J. (2014). Quantifying the strength and delay of climatic interactions: The ambiguities of cross correlation and a novel measure based on graphical models. J. Clim. 27, 720–739. doi:10.1175/JCLI-D-13-00159.1
Runge, J., Nowack, P., Kretschmer, M., Flaxman, S., and Sejdinovic, D. (2019). Detecting and quantifying causal associations in large nonlinear time series datasets. Sci. Adv. 5, eaau4996. doi:10.1126/sciadv.aau4996
Sabin, T. P., Krishnan, R., Ghattas, J., Denvil, S., Dufresne, J. L., Hourdin, F., et al. (2013). High resolution simulation of the South Asian monsoon using a variable resolution global climate model. Clim. Dyn. 41, 173–194. doi:10.1007/s00382-012-1658-8
Saha, K., Sanders, F., and Shukla, J. (1981). Westward propagating predecessors of monsoon depressions. Mon. Weather Rev. 109, 330–343. doi:10.1175/1520-0493(1981)109<0330:wppomd>2.0.co;2
Salzmann, M., Weser, H., and Cherian, R. (2014). Robust response of Asian summer monsoon to anthropogenic aerosols in CMIP5 models. J. Geophys Res. 119 (11), 11,321–11,337. doi:10.1002/2014jd021783
Sanap, S. D., Pandithurai, G., and Manoj, M. G. (2015). On the response of Indian summer monsoon to aerosol forcing in CMIP5 model simulations. Clim. Dyn. 45, 2949–2961. doi:10.1007/s00382-015-2516-2
Seo, J., Kang, S. M., and Frierson, D. M. W. (2014). Sensitivity of intertropical convergence zone movement to the latitudinal position of thermal forcing. J. Clim. 27, 3035–3042. doi:10.1175/jcli-d-13-00691.1
Shindell, D. T., Voulgarakis, A., Faluvegi, G., and Milly, G. (2012). Precipitation response to regional radiative forcing. Atmos. Chem. Phys. 12, 6969–6982. doi:10.5194/acp-12-6969-2012
Sobel, A., Camargo, S. J., Hall, T. M., Lee, C. Y., Tippet, M. K., and Wing, A. A. (2016). Human influence on tropical cyclone intensity. Science 353, 242–246. doi:10.1126/science.aaf6574
Sobel, A. H., Wing, A. A., Camargo, S. J., Patricola, C. M., Vecchi, G. A., Lee, C-Y., et al. (2021). Tropical cyclone frequency. Earth's Future 9 (12), e2021EF002275. doi:10.1029/2021ef002275
Spirtes, P., Glymour, C., and Scheines, R. (2000). Causation, prediction, and search. Boston: The MIT Press.
Stevens, B., Fiedler, S., Kinne, S., Peters, K., Rast, S., Musse, J., et al. (2017). MACv2-SP: A parameterization of anthropogenic aerosol optical properties and an associated twomey effect for use in CMIP6. Geosci. Model. Dev. 10, 433–452. doi:10.5194/gmd-10-433-2017
Sunitha Devi, S., Sathi Devi, K., and Naresh Kumar, C. S. (2019). “Regional characteristics of the 2018 southwest monsoon,” in Monsoon 2018: A report pp 1-20, IMD met monograph: ESSO/IMD/synoptic met/01 (2019)/23. Editors O. P. Sreejith, D. S. Pai, and M Mohapatra.
Swapna, P., Krishnan, R., and Wallace, J. M. (2014). Indian Ocean and monsoon coupled interactions in a warming environment. Clim. Dyn. 42, 2439–2454. doi:10.1007/s00382-013-1787-8
Takahashi, H. G., Fujinami, H., Yasunari, T., Matsumoto, J., and Baimoung, S. (2015). Role of tropical cyclones along the monsoon trough in the 2011 Thai flood and interannual variability. J. Clim. 28, 1465–1476. doi:10.1175/jcli-d-14-00147.1
Tanaka, M. (1992). Intraseasonal oscillation and the onset and retreat dates of the summer monsoon over east, southeast Asia and the western pacific region using GMS high cloud amount data. J. Meteorol. Soc. Jpn. Ser. II 70, 613–629. doi:10.2151/jmsj1965.70.1b_613
Tang, Y., Huangfu, J., Huang, R., and Chen, W. (2022). Simulation and projection of tropical cyclone activities over the Western north Pacific by CMIP6 HighResMIP. J. Clim. 35 (23), 4171–4194. doi:10.1175/jcli-d-21-0760.1
Turner, A. G., and Annamalai, H. (2012). Climate change and the South Asian summer monsoon. Nat. Clim. Change 2, 587–595. doi:10.1038/nclimate1495
Undorf, S., Polson, D., Bollasina, M. A., Ming, Y., Schurer, A., and Hegerl, G. C. (2018). Detectable impact of local and remote anthropogenic aerosols on the 20th century changes of West African and South Asian monsoon precipitation. J. Geophys Res. Atmos. 123, 4871–4889. doi:10.1029/2017JD027711
Wang, B., and Chan, J. C. L. (2002). How strong ENSO events affect tropical storm activity over the Western North Pacific. J. Clim. 15, 1643–1658. doi:10.1175/1520-0442(2002)015<1643:hseeat>2.0.co;2
Wang, B., and LinHo, (2002). Rainy season of the asian–pacific summer monsoon. J. Clim. 15, 386–398. doi:10.1175/1520-0442(2002)015<0386:rsotap>2.0.co;2
Wang, B., and Murakami, H. (2020). Dynamic Genesis potential index for diagnosing present-day and future global tropical cyclone Genesis. Environ. Res. Lett. 15, 114008. doi:10.1088/1748-9326/abbb01
Wang, B., and Xie, X. (1997). A model for the boreal summer intraseasonal oscillation. J. Atmos. Sci. 54, 72–86. doi:10.1175/1520-0469(1997)054<0072:amftbs>2.0.co;2
Wang, B., Wu, R., and Lau, K-M. (2001). Interannual variability of the asian summer monsoon: Contrasts between the Indian and the Western north pacific–east asian monsoons*. J. Clim. 14, 4073–4090. doi:10.1175/1520-0442(2001)014<4073:ivotas>2.0.co;2
Wang, H., Xie, S., Tokinaga, H., Liu, Q., and Kosaka, Y. (2016). Detecting cross-equatorial wind change as a fingerprint of climate response to anthropogenic aerosol forcing. Geophys Res. Lett. 43, 3444–3450. doi:10.1002/2016GL068521
Wilcox, L. J., Liu, Z., Samset, B. H., Hawkins, E., Lund, M. T., Nordling, K., et al. (2020). Accelerated increases in global and Asian summer monsoon precipitation from future aerosol reductions. Atmos. Chem. Phys. 20, 11955–11977. doi:10.5194/acp-20-11955-2020
Zhao, H., and Wang, C. (2019). On the relationship between ENSO and tropical cyclones in the Western North Pacific during the boreal summer. Clim. Dyn. 52, 275–288. doi:10.1007/s00382-018-4136-0
Zhao, J., Zhan, R., Wang, Y., and Xu, H. (2018). Contribution of the interdecadal Pacific oscillation to the recent abrupt decrease in tropical cyclone Genesis frequency over the Western North Pacific since 1998. J. Clim. 31, 8211–8224. doi:10.1175/jcli-d-18-0202.1
The development of novel data-driven causal methods has received considerable attention in recent times for causal inference applications in large-scale complex dynamical systems such as the Earth System sciences and various other disciplines (Runge et al., 2019). The causal network analysis used in our study is a combination of the Peter and Clarke (PC) algorithm and the Momentary Conditional Independence (MCI) algorithm and is commonly known as the PCMCI causal analysis. The PCMCI is a novel method that can be used to investigate a variety of climate science problems, such as climate teleconnections across different regions of the globe, causal hypothesis testing, detection of causes of extreme impacts, complex network analysis of multi-variate climatic parameters, multi-scale interactions of climatic phenomena, among others (Runge et al., 2019; Kretschmer et al., 2021).
The PC algorithm starts by first identifying the set of actors (i.e., set of several univariate time-series) to be analysed, which are hypothesized to share causal relationships (Di Capua et al., 2020). This initial set of actors is referred to as the initial parents. The PC method first determines simple correlations for each element of the initial parents with every other element at a specific lag. This is followed by calculation of partial correlations for each element conditioning on the initial strongest correlation, required for identifying the next set of parents. The partial correlation between the variables p and q conditioned on variable r is calculated by first performing linear regressions of p on r and of q on r and then calculating the correlation between the residuals (Di Capua et al., 2020). This process helps in determining the conditional dependence (or independence) of the variables p and q, given variable r. If the two variables p and q are conditionally independent, given variable r, then the link is spurious and therefore filtered out. This process essentially results in the set of parents being reduced. In the next step, the algorithm tests the remaining parents conditioning on a subset of two variables, again starting from the strongest, which results in further reduction of the set of parents (Di Capua et al., 2020). In the subsequent steps, the algorithm is iteratively tested for a combination of 3, 4, 5, etc.,…. variables, until the number of parents becomes smaller or equal to the number of conditions that should be tested. Once the algorithm converges for a given element say ‘A’, then the same process is followed to test the parents of ‘B’ and so on. The above process of the PC algorithm generates sets of parents which then enter the PCMCI step. It must be mentioned that the above steps of the PC algorithm uses one main free parameter α, which is the significance level chosen to retain or discard a parent after calculating the partial correlation. In our analysis, the free parameter corresponding to the significance level is chosen to be α = 0.01 (i.e., 99% confidence level). In the MCI-step, the partial correlations between an actor and its set of parents are recalculated, by conditioning on the sets of parents of the parents of a particular actor (see Di Capua et al., 2020). The MCI-step helps in determining the final set of parents for a particular actor. The MCI-step is successively applied to all the actors to determine the final sets of parents of the respective actors. For more information about causal inference theory, the reader is referred to the papers by Runge et al. (2019), Di Capua et al. (2020) and Kretschmer et al. (2021).
Keywords: Indian summer monsoon (ISM), western North Pacific (WNP) tropical cyclogenesis, climate change, forced ISM weakening, enhanced WNP convection, genesis potential index (GPI), causal network analysis
Citation: Sagar A, Krishnan R and Sabin TP (2023) Anthropogenically-forced weakening of the Indian summer monsoon and enhancement of the western North Pacific tropical cyclogenesis. Front. Earth Sci. 11:1149344. doi: 10.3389/feart.2023.1149344
Received: 21 January 2023; Accepted: 15 February 2023;
Published: 01 March 2023.
Edited by:
Divya Surendran, IMD, Pune, IndiaReviewed by:
Dushmanta Ranjan Pattanaik, India Meteorological Department, IndiaCopyright © 2023 Sagar, Krishnan and Sabin. This is an open-access article distributed under the terms of the Creative Commons Attribution License (CC BY). The use, distribution or reproduction in other forums is permitted, provided the original author(s) and the copyright owner(s) are credited and that the original publication in this journal is cited, in accordance with accepted academic practice. No use, distribution or reproduction is permitted which does not comply with these terms.
*Correspondence: R. Krishnan, a3Jpc2hAdHJvcG1ldC5yZXMuaW4=
Disclaimer: All claims expressed in this article are solely those of the authors and do not necessarily represent those of their affiliated organizations, or those of the publisher, the editors and the reviewers. Any product that may be evaluated in this article or claim that may be made by its manufacturer is not guaranteed or endorsed by the publisher.
Research integrity at Frontiers
Learn more about the work of our research integrity team to safeguard the quality of each article we publish.