 Huajun Fan1,2
 Peng Liu3
 Hao Zhao1,2Mengsheng Zhang1,2Maojie Liao4Guanghai Zhong4Kewen Wang3Hongliang Wu3*
- 1State Key Laboratory of Petroleum Resources and Prospecting, China University of Petroleum (Beijing), Beijing, China
- 2Beijing Key Laboratory of Earth Prospecting and Information Technology, China University of Petroleum (Beijing), Beijing, China
- 3Department of Borehole Logging Technology, PetroChina Research Institute of Petroleum Exploration & Development, Beijing, China
- 4Shale Gas Research Institute, PetroChina Southwest Oil & Gas Field Company, Chengdu, China
Horizontal wells play an important role in expanding the drilling volume of reservoirs and oil production area, and are widely used in unconventional reservoirs. Fractures have a positive effect on reservoir permeability, but fractures can also cause accidents such as casing deformation and inter-well frac-hit. It is of great significance to identify and evaluate fractures intersected with horizontal wells in tight reservoirs. In this paper, a three-dimensional numerical model of horizontal wells and fractures in tight reservoirs is designed. The responses of monopole P-wave and dipole S-wave to fractures with different width, dip angle and filling medium are systematically studied, by using three-dimensional finite difference algorithm. The results show that when the fracture is filled with calcite, the amplitude attenuation of monopole P-wave and dipole S-wave has a monotonic exponential increase with the increase of fracture width and the decrease of fracture dip angle. In the real data processing, the amplitude attenuation of P- and S-waves can be used to jointly evaluate the fracture filled with calcite. When the fracture is filled with water, both P- and S-waves have prominent amplitude attenuation. P wave amplitude attenuation does not have a monotonic variation with the increase of fracture width but it has a monotonic increase with the decrease of fracture dip angle. S wave amplitude attenuation has a monotonic increase with the increase of fracture width and the decrease of fracture dip angle. The amplitude attenuation of P- and S- waves rises significantly when the fracture is filled with natural gas. This study is crucial for better understanding the response of P- and S-waves to fractures intersected with borehole in tight reservoirs, and it provides useful information for the inversion of fracture parameters by using P- and S-waves.
1 Introduction
With the vigorous development of unconventional reservoir exploration and development (Ozkan et al., 2009; Sayed et al., 2017; Dang et al., 2022; Zhao et al., 2023), horizontal well has been widely used for its effectively connecting with reservoirs and expanding oil production area (Joshi, 1991; Soliman and Boonen, 1996; Qun et al., 2022). Exploration and development practice has shown that fractures are key factors for deep gas development. On one hand, fractures play a role in connecting oil and gas and increasing reservoir permeability; On the other hand, fractures may cause casing deformation, inter-well frac-hit and other accidents. Therefore, identifying and evaluating the fractures near the well, especially the fractures intersected with the well bore, has guiding significance for formulating reasonable development and production planning for unconventional reservoirs (Cai et al., 2022a; Cai et al., 2022b; Qian et al., 2022). At present, the unconventional reservoir fracture logging evaluation method is difficult to meet the field demand, especially in highly deviated wells and horizontal wells. Due to problems of the electrode plate opening and the instrument size, it is difficult to effectively collect the electrical imaging and nuclear magnetic resonance logging data. Therefore, the use of array acoustic logging data to identify and evaluate the fractures near the well bore has unique advantages (Spring and Dudley, 1992; Lynn et al., 1995; Yan et al., 2020; Cai et al., 2022a; Cai et al., 2022b).
P wave and S wave responses of fractures intersected with vertical wells have been widely studied. Morris et al. (1964) first studied the relationship between the P wave amplitude and the fracture width from the acoustic logging data. They proposed that P wave attenuation is very small after it passing through the horizontal fracture and can be ignored. They also found that the transmission coefficient of the shear wave is affected by the fracture dip angle, and it is more significant at the horizontal fracture. Paillet (1980) analyzed the shear wave attenuation at the fracture using array sonic logging data. Zlatev et al. (1988) used physical experiments to simulate the propagation of sound wave at the fracture intersected with the borehole, and pointed out that the shear wave amplitude would be greatly reduced when passing through the fracture. Tang and Cheng (1988) experimentally studied the wave mode in a liquid-filled fracture. They found that there are some pseudo-Rayleigh modes in the “hard” fractures, and leak-P modes in the “soft” fractures. Chen (1994) studied the propagation of borehole mode waves in isotropic formation based on the three-dimensional finite difference algorithm of second order time and fourth order space. He showed that when the dipole sound source is parallel to the formation boundary, the formation boundary has little influence on the waveform. When the dipole sound source is perpendicular to the formation boundary, there is strong dipole shear wave interferometry. Zhu et al. (1994) studied the propagation of dipole S waves in fractures using aluminum and fluorite borehole models. They found that dipole shear waves are more sensitive to horizontal fractures than vertical fractures. Haldorsen et al. (2006) studied the propagation of P and S waves in irregular wells and anisotropic formations. Wei et al. (2010) carried out numerical simulation on the full wave train of fractures at different angles and positions near the well bore with the existing array sonic logging tools. They observed the reflected P wave between the sliding P wave and the sliding S wave of the formation, which can indicate the existence of fracture. Matuszyk et al. (2013) used monopole source and dipole source to simulate the acoustic response to horizontal fractures intersected with the borehole and thin layers, by using high-precision finite element method (hp-FEM). They pointed out that horizontal fractures have little effect on P wave amplitude. They also found that shear wave is very sensitive to the fracture, the shear wave amplitude has larger attenuation when the fracture becomes thicker. Yan et al. (2015) used the non-uniform mesh finite difference method to simulate the sound field in the borehole in porous media with fractures and fracture zones. He found that the S wave in the borehole will reflect at the fracture, but the amplitude of the reflected wave is not affected by the fracture width much. And the P wave is almost not affected by the fracture. Xue (2018) used the staggered grid finite difference method of the second order time and the 10th order space, to simulate the borehole sound field under different fracture density and different fracture dip angles. The numerical simulation wave field indicates that with the increase of fracture dip angle, the P-wave velocity first decreases and then increases. For different fracture filling medium, compared with wet fractures saturated with oil and water, the P wave velocity in dry fractures saturated with gas is significantly reduced, while the S wave velocity does not have marked change.
As discussed above, we know that P- and S- waves are effective means to identify the fractures intersected with the well bore. To some extent, they can semi-quantitatively evaluate the fracture occurrence and even the fluid properties. However, there are few research of P- and S- waves response on fractures intersected with horizontal wells in tight reservoirs. Especially, there is lack of the systematic research on the response of calcite-filled fractures by P- and S-waves. For some tight reservoirs in China, a large number of high angle fractures are developed and the horizontal wells are widely used. So it is crucial to carry out the research of P- and S-waves response of fractures intersected with horizontal wells.
This paper first introduces a three-dimensional finite difference algorithm. Then, the forward simulation on the three-dimensional numerical model of fracture intersected with horizontal well in an isotropic tight reservoir is carried out. The response of monopole P wave and dipole S wave on fracture is discussed respectively when the fracture is filled with calcite, water and gas. With the same filling medium, the influence of fracture width and fracture dip angle on P- and S-waves is considered. This research is conducive to effectively identifying the fractures intersected with the borehole in tight formations. The results can be compared with the simulation of anisotropic reservoirs in future studies and have positive significance for the stimulation of unconventional reservoirs.
2 Methods and models
2.1 Three-dimensional finite difference algorithm
2.1.1 Wave equation in the form of velocity and stress
The propagation of sound waves in horizontal fluid-filled borehole is simulated by using three-dimensional finite difference algorithm. We use the forward simulation theory of Li (2019) and Ou (2019). Without considering the sound source, the equation of motion of isotropic elastic media can be written as the following two first-order partial differential equations
where
As the stress tensor is a symmetric tensor, and
where
where
We thus obtain Eqs 4, 5, which are the velocity and stress equations of isotropic elastic media.
2.1.2 Finite difference approximation based on staggered grid
After obtaining the velocity and stress equations, we use staggered grids to approximate Eqs 4, 5. Define that normal stress
The remaining stress components can be denoted by
where
where
2.2 3D numerical model
Figure 1 is a schematic diagram of three-dimensional model of an infinite extent fracture intersected with horizontal well in tight formation. The well is filled with water. The dimensions of the model in X, Y and Z directions is 4, 2 and 7 m respectively. The radius of the well bore is 0.1 m. The well bore axis coincides with the Z-axis. The sound source and receivers are positioned along the well axis. The sound source is located at X=0, Y=0, Z=0. The minimum distance between the receiver and the sound source is 1.05 m, and 35 receivers are placed continuously at an interval of 0.15 m. The fracture plane is parallel to the Y-axis and extends infinitely after passing through the well bore. The intersection point of the fracture and the well axis is at X=0, Y=0, Z=4.5 m. The width, dip angle and the filling medium of the fracture are variable. The formation where the fracture and well bore are located is elastic. Table 1 shows the physical parameters of the elastic tight formation and the fracture filling medium (dry gas, water, calcite). In the finite difference method, the space step
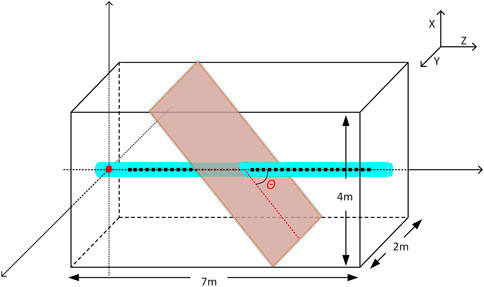
FIGURE 1. Schematic diagram of three-dimensional model of an infinite extent fracture intersected with horizontal well in tight reservoirs.
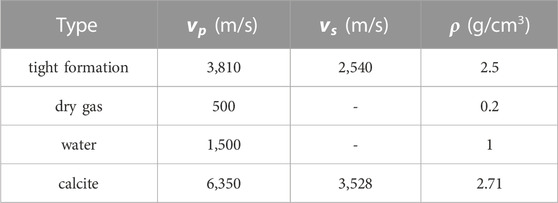
TABLE 1. Physical parameters of elastic formation and fracture filling medium.
In order to excite relatively pure waves in the fluid-filled borehole, we select the Ricker wavelet source with the dominant frequency of 10 kHz to study the response of the monopole P wave, and the narrow-band cosine envelope source with the dominant frequency of 3.5 kHz to study the response of the dipole S wave. The sound source waveform and amplitude spectrum are shown in Figure 2.
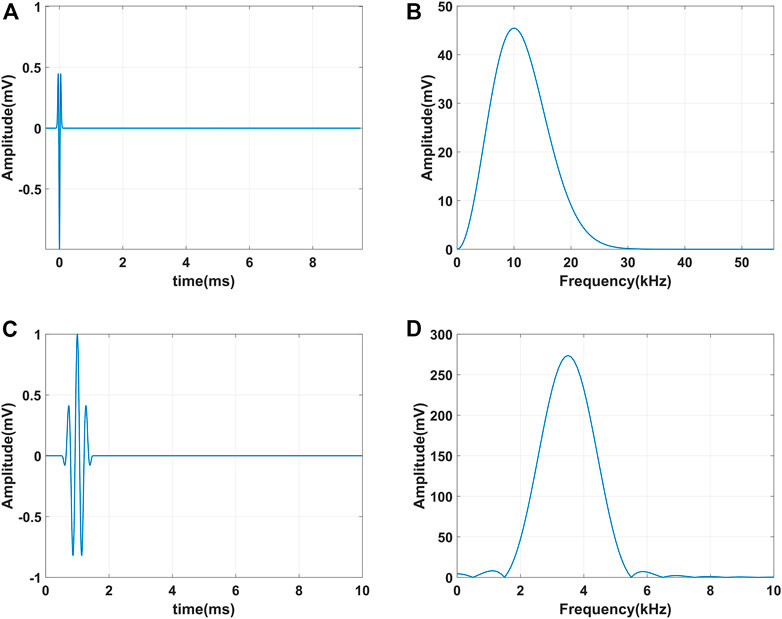
FIGURE 2. Sound source waveform and amplitude spectrum. (A, B) are the waveform and amplitude spectrum of the Ricker wavelet source that excites the monople P wave, respectively; (C, D) are the waveform and amplitude spectrum of the narrow-band cosine envelope source that excites the dipole S wave, respectively.
3 Forward modeling of fracture filled with calcite
3.1 Wave field and waveform analysis
3.1.1 Monopole P wave
Using the broadband monopole sound source (Figures 2A,B) in Section 2.2, we can excite the monopole full-wave train waveform, in which the first wave is P wave. The subsequent modes include waves like S wave, pseudo-Rayleigh wave and Stoneley wave (St). In this section, we will mainly investigate the response of the P wave to the fracture filled with calcite. Figure 3 shows the wave field slice of the full wave excited by a broadband monopole sound source. The energy distribution of the wave field in the slice at different times is described by the color scale at the bottom of the figure. Yellow and blue respectively correspond to the peak and trough energy of the mode wave. The fracture is perpendicular to the well bore, the fracture width is 40 mm with the filling medium calcite. Figure 3A represents a wave field slice with the time 1.8 ms where the sound waves have not reached the fracture yet. The wave energy in the borehole has a large leakage into the formation as the formation is soft. P- and S-waves can be clearly observed in the formation. The sliding P wave that propagates in the formation along the borehole wall has a very weak energy. Figure 3B is the 2.2 ms wave field slice where the P wave has passing through the fracture filled with calcite. There is a reflected P wave (RP) from the fracture. And it should be noted that this reflected wave not only exists in the wellbore, but also in the formation, which indicates that P wave is sensitive to the fracture filled with calcite. Figure 3C is the 2.7 ms wave field slice where the monopole S wave has also passing through the fracture. There is a strong reflected S wave (RS) from the fracture. And it can also be observed that part of the S wave energy goes into the fracture and forms the fracture wave. Figure 3D shows the wave field slice at 6.7 ms. The direct waves and reflected waves are distinctly separated. Most of the sound energy is bound inside the borehole. The reflected waves (RW) include P wave, S wave, pseudo Rayleigh wave and Stoneley wave.
FIGURE 3. Wave field slice of the full wave excited by a broadband monopole sound source. The color scale at the bottom of the figure describes the wave energy distribution. Yellow and blue respectively correspond to the peak and trough energy of the mode wave. The fracture dip angle is 90°, the fracture width is 40 mm and filled with calcite. (A) 1.8 ms; (B) 2.2 ms; (C) 2.7 ms; (D) 6.7 ms.
Figure 4 is the monopole array waveforms. The abscissa is the time, and the ordinate is the spacing between the sound source and the receiver. The figure shows 35 waveforms with the source-receiver spacing from 1.05m to 6.15 m. The red dotted line stands for the fracture center, which is 4.5 m away from the sound source. In Figure 4A, the S wave and Stoneley wave can be clearly observed, but the P wave is difficult to be identified. This is consistent with Figure 3A that the sliding P wave has a weak amplitude. The amplitude of the direct P wave in Figure 4A is enlarged by 200 times while the amplitudes of S wave and Stoneley wave remain unchanged, and the results are plotted in Figure 4B. We can now see clear arrivals of direct P wave in Figure 4B.
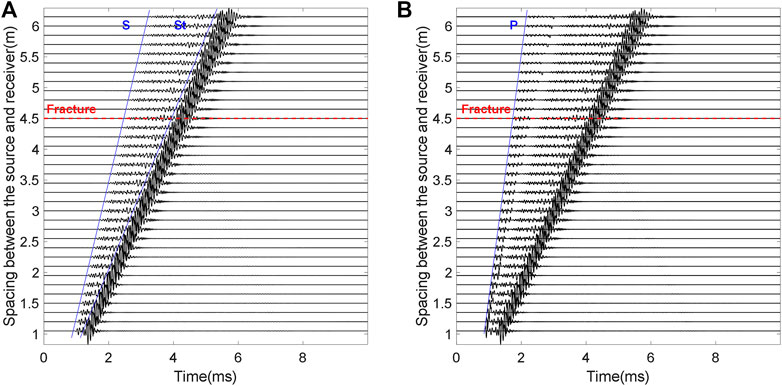
FIGURE 4. Monopole array waveforms. The red dotted line stands for the fracture center, which is 4.5 m away from the sound source. The fracture dip angle is 90°, the fracture width is 40 mm and filled with calcite. (A) Array waveforms (original); (B) Array waveforms (P wave is amplified by 200 times; S wave and Stoneley wave remain unchanged).
3.1.2 Dipole S wave
We can use the narrowband dipole sound source (Figures 2C,D) in Section 2.2 to excite the dipole S wave. Figure 5 shows wave field slices of the dipole S wave passing through the fracture. The fracture is perpendicular to the well bore. The width of the fracture is 40mm, and the filling medium is calcite. Figure 5A is the wave field at 1.8 ms. The S wave does not yet arrive at the fracture. Part of the S wave propagates in the formation along the borehole wall, and part of the S wave energy leaks into the formation. Compared with the monopole full-wave wave field (Figure 3), the dipole S wave is wider as it has a lower dominant frequency of sound source (3.5 kHz). Figures 5B,C are wave field slices at the time 5.8 ms and 6.7 ms, respectively. The S wave has passed through the fracture filled with calcite. Most of the energy is bound in the borehole and forms the direct S wave. A few energy forms the reflected S wave (RS) from the fracture both in and outside the borehole. After a period of time, the direct S wave and reflected S wave are distinctly separated (Figure 5D). The reflected S wave is clearly visible. The amplitude of direct S wave will attenuate after passing through the fracture, which indicates that the S wave is sensitive to the fracture filled with calcite.
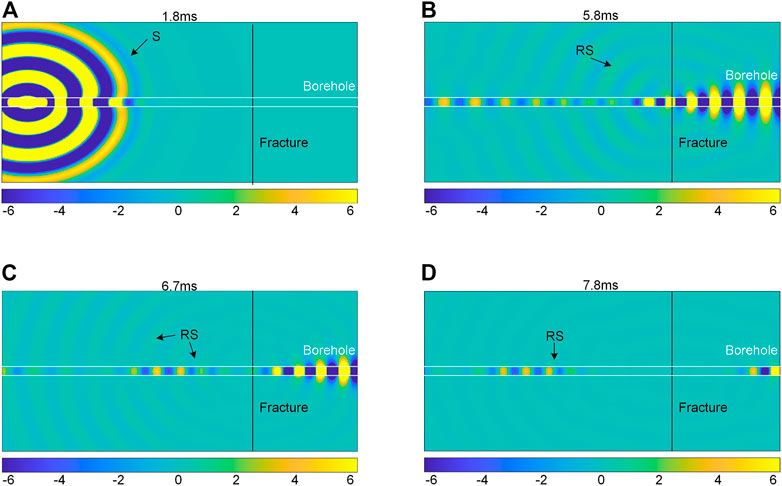
FIGURE 5. Wave field slice of the S wave excited by a dipole sound source. The color scale at the bottom of the figure describes the wave energy distribution. Yellow and blue respectively correspond to the peak and trough energy of the S wave. The fracture dip angle is 90°, the fracture width is 40 mm and filled with calcite. (A) 1.8 ms; (B) 5.8 ms; (C) 6.7 ms; (D) 7.8 ms.
Figure 6A shows the dipole S wave array waveforms. The abscissa in the figure is the time, and the ordinate is the spacing between the sound source and the receiver. The figure shows 35 waveforms with the source-receiver spacing from 1.05m to 6.15 m. The red dotted line is fracture center which locates at 4.5 m away from the sound source. In Figure 6A, there is only one mode wave excited by the dipole sound source: flexural wave. The flexural wave is a strong dispersive wave. With the increase of the propagation distance, the “tailing” of the waveform is clearly visible. The amplitude of the S wave in Figure 6A is enlarged by 10 times, and the results are plotted in Figure 6B. In Figure 6B, we can see that a small part of the energy of dipole S wave forms reflected S wave when it passing through the fracture. This is consistent with the results illustrated in the wave field in Figure 5D.
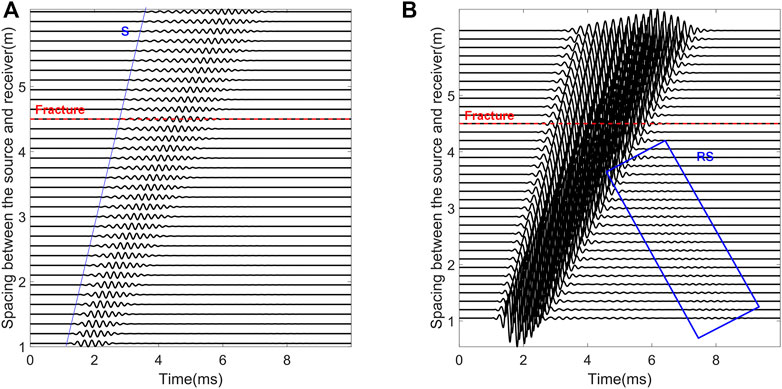
FIGURE 6. Dipole array waveforms. The red dotted line stands for the fracture center, which is 4.5 m away from the sound source. The fracture dip angle is 90°, the fracture width is 40 mm and filled with calcite. (A) Array waveforms (original); (B) Array waveforms (S wave is amplified by 10 times).
3.2 Influence of fracture dip angle
3.2.1 Monopole P wave
Let’s first focus on the amplitude change of monopole P wave when it passing through the 40 mm width fracture filled with calcite. The absolute amplitudes of the direct P waves in the 35 waveforms in Figure 4B are counted and normalized. The variation of the normalized amplitude of the monopole P wave with the source-receiver spacing is plotted in Figure 7. For fracture dip angle with 90° in Figure 7A, the amplitude of P wave decreases monotonously with the increase of source-receiver spacing. This is because the tight reservoir is relatively soft, and part of the P wave energy leaks into the formation during the propagation along the wellbore (as also illustrated in Figure 3). At the position where the fracture intersected with the borehole (red dotted line in Figure 7A), the amplitude of the P wave increases first and then decreases. It is probably caused by the interferometry between direct P wave and fracture reflected P wave. In real conditions, this phenomena can be used to identify fractures filled with calcite and perpendicular to the well bore. In Figure 7B, the fracture dip angle is 10°, thus the influence range of the fracture on P wave amplitude becomes larger (see the two red dotted lines in Figure 7B). In Figure 7B, the P wave amplitude recorded by the 1.5 m spacing receiver (blue dotted line in the figure) has already been affected by the fracture. The fracture effect on P wave is continuous until the maximum source-receiver spacing (6.15 m). The amplitude of P wave has the trend of “increase then drop” for multiple times. The P wave amplitude is significantly reduced by the fracture, which indicates that P wave is sensitive to the fracture with a dip angle of 10° and filled with calcite.
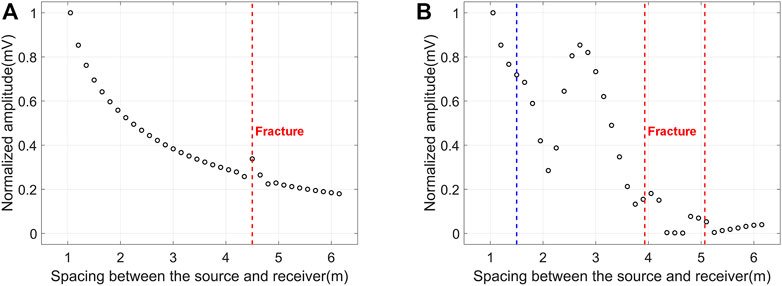
FIGURE 7. Normalized amplitude of monopole P wave versus source-receiver spacing. The fracture width is 40 mm and filled with calcite. (A) The fracture dip angle is 90°, red dotted line stands for the position where the fracture intersected with the borehole; (B) The fracture dip angle is 10°, red dotted lines stands for the positions where the fracture intersected with the borehole, blue dotted line stands for the position where the P wave amplitude has already been affected by the fracture.
Figure 8 shows the wave field slice of full wave that excited by monopole sound source for a 10° fracture. Figure 8A represents a wave field slice with the time 1.3 ms where the direct P wave has not reached the fracture yet. However, there is already some sound energy in the fracture. This is because the sound energy excited by monopole source leaks into the formation and then goes inside the fracture. As the distance between the fracture and the borehole is very close (about one P wave wavelength, 0.4 m), the acoustic energy in the fracture interacts with the borehole acoustic field. This interaction directly affects the P wave amplitude in the borehole, although the P wave has not yet reached the fracture (as also shown in Figure 7B). Figure 8B is the wave field slice at 2.2 ms. The direct P wave and reflected P wave (RP) are clearly visible.
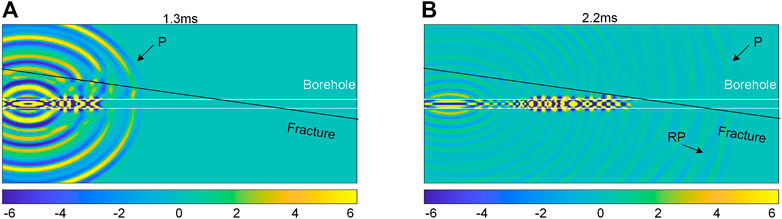
FIGURE 8. Wave field slice of the full wave excited by a broadband monopole sound source. The fracture dip angle is 10°, the fracture width is 40 mm and filled with calcite. (A) 1.3 ms; (B) 2.2 ms.
We define amplitude attenuation
In Figure 9, amplitude attenuation of monopole P wave (calculated by formula 9) versus four fracture dip angles is plotted. When the fracture dip angle is 10°, the amplitude attenuation of P wave reaches the maximum value and the attenuation exceeds 80%. With the increase of fracture dip angle, the amplitude attenuation of P-wave has a monotonic logarithmic drop. When the dip angle reaches 90°, the amplitude attenuation becomes 4.9%. This is also a considerable amount of attenuation within the observable range under real logging conditions. From Figure 9, the relationship between monopole P wave amplitude attenuation and fracture dip angle can be obtained
where
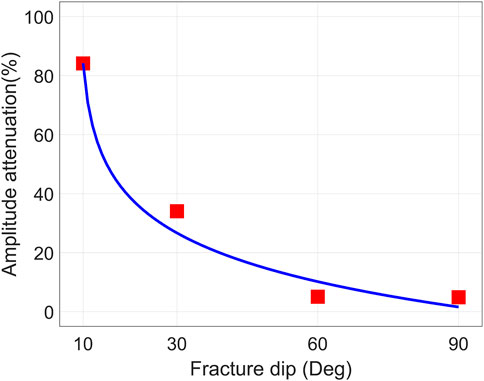
FIGURE 9. Amplitude attenuation of monopole P wave versus different fracture dip angles. The fracture width is 40 mm and filled with calcite.
3.2.2 Dipole S wave
We now discuss the amplitude change of dipole S wave when it passing through the 40 mm width fracture filled with calcite. The absolute amplitudes of the dipole S waves in the 35 waveforms in Figure 6B are counted and normalized. The variation of the normalized amplitude of the dipole S wave with the source-receiver spacing is plotted in Figure 10. In Figure 10A, the fracture dip angle is 90°. Similar with P wave, the S wave energy will also leak into the formation. Consequently, the direct S wave amplitude will decrease with the increase of source-receiver spacing. At the position where the fracture intersected with the borehole (red dotted line in Figure 10A), the amplitude of the S wave increases first and then decreases. It is probably caused by the interferometry between direct S wave and fracture reflected S wave. In Figure 10B, the fracture dip angle is 10°, thus the influence range of the fracture on S wave amplitude becomes larger (see the two red dotted lines in Figure 10B). The S wave amplitude has a continuous decline within this range. In Figure 11, amplitude attenuation of dipole S wave (calculated by formula 9) versus four fracture dip angles is plotted. When the fracture dip angle is 10°, the amplitude attenuation of S wave has the maximum value about 5%. With the increase of fracture dip angle, the amplitude attenuation of S wave has a monotonic logarithmic drop. When the dip angle reaches 90°, the amplitude attenuation becomes 0.7%. This is the critical value that can be observed under real logging conditions. From Figure 11, the relationship between dipole S wave amplitude attenuation
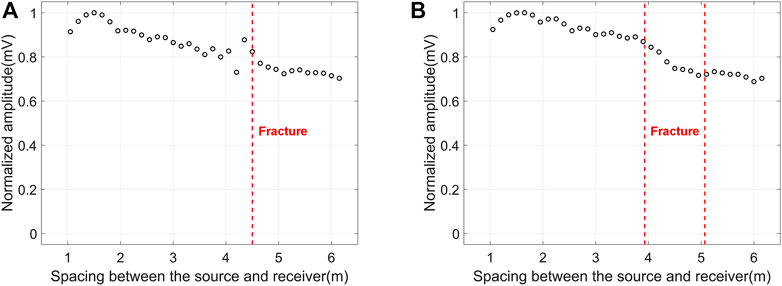
FIGURE 10. Normalized amplitude of dipole S wave versus source-receiver spacing. The fracture width is 40 mm and filled with calcite. (A) The fracture dip angle is 90°, red dotted line stands for the position where the fracture intersected with the borehole; (B) The fracture dip angle is 10°, red dotted lines stands for the positions where the fracture intersected with the borehole.
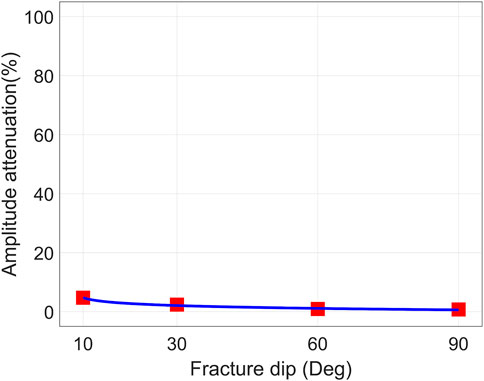
FIGURE 11. Amplitude attenuation of dipole S wave versus different fracture dip angles. The fracture width is 40 mm and filled with calcite.
The amplitude of dipole S wave is sensitive to the fracture filled with calcite. S wave can be used to identify and evaluate fracture filled with calcite, especially when the fracture dip angle is small. Compared with P wave, the amplitude attenuation of S wave is smaller. However, the absolute amplitude of S wave is larger. Therefore, the use of P wave or S wave for fracture parameter inversion in real logging data processing has to be considered comprehensively.
3.3 Influence of fracture width
In Sections 3.1, 3.2, we have discussed the responses of monopole P wave and dipole S wave to fractures filled with calcite. We found P- and S- waves are both sensitive to different dip angle fractures filled with calcite. In this section, we will further study the amplitude attenuation of monopole P wave and dipole S wave under different fracture widths and fracture dip angles. We use the similar processing methods as in Sections 3.1 and 3.2. The waveforms of the P- and S- waves are first calculated. The amplitudes of P- and S- waves are then counted and normalized. Finally, variation of the amplitude attenuation of P- and S- waves are obtained. In order to avoid redundancy, we do not present the waveforms of P- and S- waves in this section. We directly plot the variation of P- and S- wave amplitude attenuation with fracture width and dip angle (see Figure 12). In Figure 12, the abscissa is fracture width, the ordinate is amplitude attenuation, the curves and scattered points of different colors represent different fracture dip angles. The fracture widths are 0, 5, 10, 20 and 40 mm. The fracture dip angles are 10°, 30°, 60° and 90°. The fracture is filled with calcite. The amplitude attenuation of P wave and S wave is plotted in Figures 12A,B, respectively. In Figure 12A, the amplitude attenuation of monopole P wave has a monotonic exponential increase with the increase of fracture width. And with the decrease of fracture dip angle, the amplitude attenuation of P wave also has a monotonic exponential increase (can also be found in Figure 9). We can use this characteristic of P wave to quantitatively evaluate the fracture filled with calcite. In Figure 12B, the amplitude attenuation of dipole S wave has a monotonic exponential increase with the increase of fracture width. Remarkably, it rises more significantly for the small fracture dip angle. For fractures of the same width, the amplitude attenuation of dipole S wave has a monotonic exponential increase with the decrease of fracture dip angle (can also be found in Figure 11). Similar with P wave, the S wave also shows two monotonic exponential variations. Therefore, S wave can also be implemented to quantitatively evaluate the fracture filled with calcite. As discussed in Section 3.2, the advantage of using dipole S wave to evaluate the calcite filled fracture is that dipole S wave has a large amplitude. Whereas, the advantage of using monopole P wave to evaluate calcite filled fracture is that the amplitude attenuation of P wave is greater. This implies that in the real logging data processing, the amplitude attenuation of P- and S-waves can be used to jointly evaluate the fracture filled with calcite.
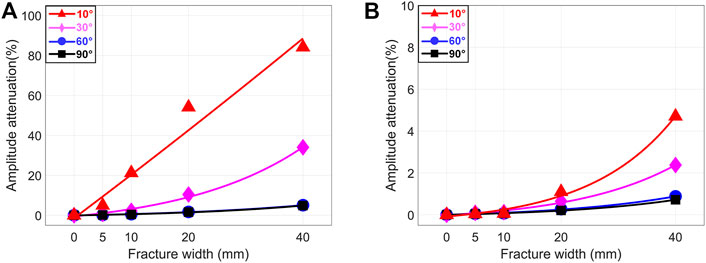
FIGURE 12. Amplitude attenuation of P- and S- waves versus different fracture widths and dip angles. The fracture is filled with calcite. The fracture widths are 0, 5, 10, 20 and 40 mm. The fracture dip angles are 10°, 30°, 60° and 90°. (A) P wave; (B) S wave.
4 Forward modeling of fracture filled with fluid
4.1 Fracture filled with water
In this section, we will discuss the effect of water filled 90° fracture on P- and S- waves amplitudes. Figure 13 shows the variation of the normalized amplitude of the monopole P wave with the source-receiver spacing. In Figure 13A, as the formation is relatively soft and there is no fracture, the amplitude of P-wave continuously decreases versus the increase of source-receiver spacing. At receiver 33 (blue arrow in the figure), the normalized amplitude is 0.203 mV. In Figure 13B, the fracture width is 10 mm. The normalized amplitude of P wave recorded by receiver 33 is reduced to 0.106 mV. The amplitude attenuation is 48%. In Figure 13C, the fracture width reaches 20 mm. The normalized amplitude of P wave recorded by receiver 33 is now 0.076 mV. The amplitude attenuation goes to 63%. In Figure 13D, the fracture width is 40 mm. The P wave normalized amplitude received by receiver 33 is 0.087 mV. We found that the monopole P wave amplitude attenuation for 40 mm fracture is less than that of the 20 mm fracture.
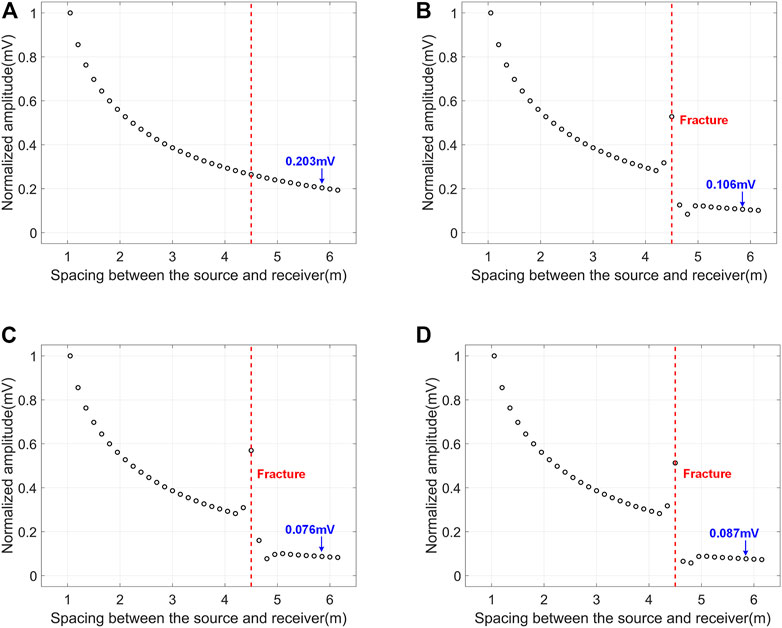
FIGURE 13. Normalized amplitude of monopole P wave versus source-receiver spacing. The fracture dip angle is 90° and filled with water. (A) No fracture; (B) 10 mm width fracture; (C) 20 mm width fracture; (D) 40 mm width fracture.
Figure 14 shows the amplitude attenuation of the monopole P wave and dipole S wave versus the width and dip angle of water-filled fractures. P- and S- waves amplitude attenuation is plotted in Figures 14A,B, respectively. In Figure 14A, P wave amplitude attenuation increases logarithmically with the increase of fracture width before the 20 mm fracture. However, the P wave amplitude attenuation decreases when the fracture width increases from 20 to 40 mm. This happens not only for fracture dip angle of 90° (Figure 13), but also for fracture dip angle of 60°, 30° and 10°. The amplitude attenuation of P wave has a monotonic increase with the decrease of the fracture dip angle. In Figure 14B, when the fracture dip angle remains constant, the dipole S wave amplitude attenuation has a monotonic logarithmic increase with the increase of fracture width. For fixed fracture width, the amplitude attenuation of dipole S wave has a monotonic increase with the decrease of fracture dip angle. Especially when the fracture dip angle is 90° and 60°, the amplitude attenuation discrepancy is very small. By using these two monotonic variation relations, the amplitude attenuation of dipole S wave can potentially be used to identify water filled fracture intersected with the borehole. And it is also possible to use these relations to further quantitatively calculate fracture parameters. We should be noted that, as the elastic parameters of oil and water are similar, the simulation results of P- and S- waves for fracture filled with water are applicable to that of the fracture filled with oil.
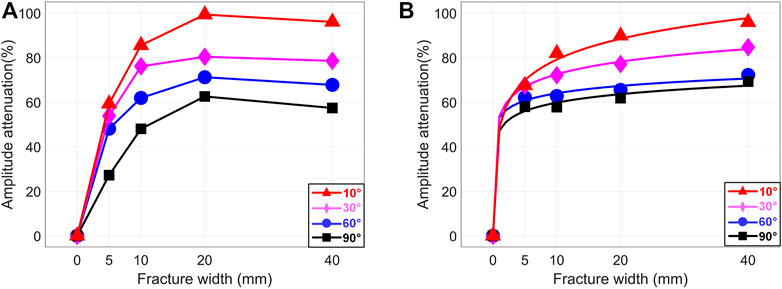
FIGURE 14. Amplitude attenuation of P- and S- waves versus different fracture widths and dip angles. The fracture is filled with water. The fracture widths are 0, 5, 10, 20 and 40 mm. The fracture dip angles are 10°, 30°, 60° and 90°. (A) P wave; (B) S wave.
4.2 Fracture filled with gas
Figure 15A shows the amplitude attenuation of the monopole P wave versus the width and dip angle of gas-filled fractures. Even when the fracture width is small (5 mm), the amplitude attenuation of monopole P wave already reaches 95%. This indicates that most of the energy forms reflected waves, or leaks out into the formation and fractures. After the fracture width is larger than 5 mm, the monopole P wave amplitude attenuation is more than 95%, no matter how the fracture width and fracture dip angles change. It indicates that monopole P wave is sensitive to gas filled fracture. Figure 15B shows the amplitude attenuation of the dipole S wave versus the width and dip angle of gas-filled fractures. The amplitude attenuation of dipole S wave has the monotonic variation both for the fracture width and dip angle. Similar to P wave, the amplitude attenuation of dipole S wave already becomes very high when the fracture width is small (5 mm). Therefore, the dipole S wave is also sensitive to gas filled fracture.
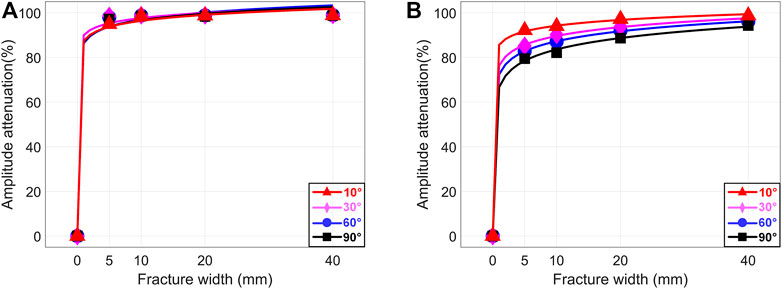
FIGURE 15. Amplitude attenuation of P- and S- waves versus different fracture widths and dip angles. The fracture is filled with gas. The fracture widths are 0, 5, 10, 20 and 40 mm. The fracture dip angles are 10°, 30°, 60° and 90°. (A) P wave; (B) S wave.
5 Conclusion
A three-dimensional finite difference algorithm is introduced to model the response of monopole P wave and dipole S wave to fractures intersected with the horizontal well bore in tight reservoir. The fractures are of different width, dip angle and filling medium. When the fracture is filled with calcite, the monopole P wave is sensitive to the fracture, especially when the fracture dip angle is small. The amplitude attenuation of P wave has a monotonic exponential increase with the increase of fracture width and the decrease of fracture dip angle. However, as the absolute amplitude of P wave is small, it requires more accurate means to extract P wave from real logging data. For the response of fracture width and fracture dip angle, the amplitude attenuation of dipole S wave has the similar variation to that of the monopole P wave. Compared with the P wave, the amplitude attenuation of dipole S wave is smaller. However, the absolute amplitude of S wave is larger than P wave. This implies that in the real logging data processing, the amplitude attenuation of P- and S-waves can be used to jointly evaluate the fracture filled with calcite.
When the fracture is filled with water, the monopole P wave and dipole S wave both have a large amplitude attenuation. P wave amplitude attenuation increases logarithmically with the increase of fracture width before the 20 mm fracture, but it decreases when the fracture width enlarges from 20mm to 40 mm. S wave amplitude attenuation increases logarithmically with the increase of fracture width. The amplitude attenuation of P- and S- waves has a monotonic increase with the decrease of fracture dip angle. P- and S- waves can be used to identify and evaluate water filled fracture as they are both sensitive to it. Because the oil and water elastic parameters are similar, the modeling results of P- and S- waves for fracture filled with water are also applicable to that of the fracture filled with oil. When the fracture is filled with gas, the amplitude attenuation of P- and S- waves has significant response to the fracture. Therefore, P- and S- waves can be used to identify and evaluate gas filled fractures. Especially for monopole P wave, when the fracture width is small (5 mm), its amplitude attenuation is already more than 95%. This indicates that it is possible to use monopole P wave to identify fractures with smaller width and even micrometer size.
Data availability statement
The original contributions presented in the study are included in the article/supplementary material, further inquiries can be directed to the corresponding author.
Author contributions
HF is responsible for writing the paper, performing the modeling and data analysis. PL, HZ, and MZ are responsible for performing the modeling and data analysis. ML and GZ are responsible for providing technical assistance and analyzing the data. KW is responsible for writing the paper. HW is responsible for guiding the project.
Funding
This work is supported by Scientific Research and Technology Development Project of CNPC (2021DJ4002, 2022DJ3908).
Conflict of interest
Authors ML and GZ were employed by PetroChina Southwest Oil & Gas Field Company. Authors PL, KW, and HW were employed by PetroChina.
The remaining authors declare that the research was conducted in the absence of any commercial or financial relationships that could be construed as a potential conflict of interest.
Publisher’s note
All claims expressed in this article are solely those of the authors and do not necessarily represent those of their affiliated organizations, or those of the publisher, the editors and the reviewers. Any product that may be evaluated in this article, or claim that may be made by its manufacturer, is not guaranteed or endorsed by the publisher.
References
Cai, M., Wu, H., Liu, P., Zhang, C., Tang, J., Chen, Y., et al. (2022a). Intelligent calculation method of relative sonic attenuation and its application to fracture evaluation in tight sandstone reservoir. J. Pet. Sci. Eng. 218, 110968. doi:10.1016/j.petrol.2022.110968
Cai, M., Wu, H., Xin, Y., Liu, P., Zhang, C., Tang, J., et al. (2022b). Experimental study on shear wave transmission in fractured media. Sensors 22 (11), 4047. doi:10.3390/s22114047
Chen, N. (1994). Borehole wave propagation in isotropic and anisotropic media: Three-dimensional finite difference approach. dissertation. Boston (MA): Massachusetts Institute of Technology.
Dang, W., Nie, H., Zhang, J., Tang, X., Jiang, S., Wei, X., et al. (2022). Pore-scale mechanisms and characterization of light oil storage in shale nanopores: New method and insights. Geosci. Front. 13 (5), 101424. doi:10.1016/j.gsf.2022.101424
Haldorsen, J. B., Johnson, D. L., Plona, T., Sinha, B., Valero, H.-P., and Winkler, K. (2006). Borehole acoustic waves. Oilfield Rev. 18 (1), 34–43.
Li, Z. (2019). Basic theory and applied research of borehole acoustic remote sensing technology. dissertation. Qingdao: China University of Petroleum. (East China).
Lynn, H., Bates, R., Layman, M., and Jones, M. (1995)“Natural fracture characterization using P-wave reflection seismic data, VSP, borehole imaging logs, and the in-situ stress field determination,” in Low Permeability Reservoirs Symposium, Denver, Colorado, March 1995 (OnePetro). doi:10.2118/29595-MS
Matuszyk, P. J., Torres-Verdín, C., and Pardo, D. (2013). Frequency-domain finite-element simulations of 2D sonic wireline borehole measurements acquired in fractured and thinly bedded formations. Geophysics 78 (4), D193–D207. doi:10.1190/geo2012-0397.1
Morris, R., Grine, D., and Arkfeld, T. (1964). Using compressional and shear acoustic amplitudes for the location of fractures. J. Pet. Technol. 16 (06), 623–632. doi:10.2118/723-PA
Ou, W. M. (2019). Study on the effect of fractures and porous formation on acoustic waves in borehole based on finite difference method. dissertation. Jilin: Jilin University.
Ozkan, E., Brown, M., Raghavan, R., and Kazemi, H. (2009). “Comparison of fractured horizontal-well performance in conventional and unconventional reservoirs,” in Proceeding of the SPE Western Regional Meeting, San Jose, California, March 2009 (OnePetro). doi:10.2118/121290-ms
Paillet, F. L. (1980). “Acoustic propagation in the vicinity of fractures which intersect a fluid-filled borehole,” in Proceeding of the SPWLA 21st Annual Logging Symposium, Lafayette, Louisiana, July 1980 (OnePetro).
Qian, Y., Gao, P., Fang, X., Sun, F., Cai, Y., and Zhou, Y. (2022). Microstructure characterization techniques for shale reservoirs: A review. Front. Earth Sci. 10, 930474. doi:10.3389/feart.2022.930474
Qun, L., Yun, X., Bo, C., Baoshan, G., Xin, W., Guoqiang, B., et al. (2022). Progress and prospects of horizontal well fracturing technology for shale oil and gas reservoirs. Pet. Explor. Dev. 49 (1), 191–199. doi:10.1016/s1876-3804(22)60015-6
Sayed, M. A., Al-Muntasheri, G. A., and Liang, F. (2017). Development of shale reservoirs: Knowledge gained from developments in North America. J. Pet. Sci. Eng. 157, 164–186. doi:10.1016/j.petrol.2017.07.014
Soliman, M. Y., and Boonen, P. (1996). “Review of fractured horizontal wells technology,” in Proceeding of the Abu Dhabi International Petroleum Exhibition and Conference, Abu Dhabi, United Arab Emirates, October 1996 (OnePetro). doi:10.2118/36289-ms
Spring, C. T., and Dudley, D. (1992). Acoustic wave propagation in a cylindrical borehole with fractures. J. Acoust. Soc. Am. 91 (2), 658–669. doi:10.1121/1.402527
Tang, X., and Cheng, C. (1988). Wave propagation in a fluid-filled fracture—an experimental study. Geophys. Res. Lett. 15 (13), 1463–1466. doi:10.1029/gl015i013p01463
Wei, Z. T., Chen, X. L., Fan, Y. R., and Wang, T. (2010). Sonic field simulation for borehole-side fracture and reflection wave extraction method. Oil Geophys. Prospect. 45 (5), 748–756. doi:10.13810/j.cnki.issn.1000-7210.2010.05.024
Xue, Y. Q. (2018). Study on sonic logging response characteristics of fracture formation. dissertation. Beijing: China University of Petroleum Beijing.
Yan, B., Ou, W., Huang, X., and da Silva, N. V. (2020). Numerical simulation of shear wave attenuation in borehole inserted by a horizontal fracture. Acta Geophys. 68 (6), 1715–1726. doi:10.1007/s11600-020-00503-3
Yan, S. G., Xie, F. L., Gong, D., Zhang, C.-G., and Zhang, B. X. (2015). Borehole acoustic fields in porous formation with tilted thin fracture. Chin. J. Geophys. 58 (1), 307–317. doi:10.6038/cjg20150128
Zhao, L., Mao, W., Liu, Z., and Cheng, S. (2023). Research on the differential tectonic thermal evolution of Longmaxi shale in the southern Sichuan Basin. Adv. Geo Ener. Res. 7 (3), 152–163. doi:10.46690/ager.2023.03.02
Zhu, Z., Cheng, C. H., and Toksöz, M. N. (1994). Experimental study of flexural waves in a fractured or cased borehole model. Seg. Tech. Program Expand. Abstr. 13 (1), 1679. doi:10.1190/1.1931968
Keywords: tight reservoir, horizontal well, fracture, calcite, monopole P wave, dipole S wave, amplitude attenuation
Citation: Fan H, Liu P, Zhao H, Zhang M, Liao M, Zhong G, Wang K and Wu H (2023) Forward modeling of P- and S-waves response of fractures intersected with horizontal wells in tight reservoirs. Front. Earth Sci. 11:1149171. doi: 10.3389/feart.2023.1149171
Received: 21 January 2023; Accepted: 27 February 2023;
Published: 21 March 2023.
Edited by:
Xinmin Ge, China University of Petroleum (East China), ChinaCopyright © 2023 Fan, Liu, Zhao, Zhang, Liao, Zhong, Wang and Wu. This is an open-access article distributed under the terms of the Creative Commons Attribution License (CC BY). The use, distribution or reproduction in other forums is permitted, provided the original author(s) and the copyright owner(s) are credited and that the original publication in this journal is cited, in accordance with accepted academic practice. No use, distribution or reproduction is permitted which does not comply with these terms.
*Correspondence: Hongliang Wu, d3Vob25nbGlhbmdAcGV0cm9jaGluYS5jb20uY24=