- 1Tianjin Key Laboratory for Oceanic Meteorology, Tianjin, China
- 2Tianjin Weather Modification Office, Tianjin, China
- 3Key Laboratory of Climate Resource Development and Disaster Prevention of Gansu Province, College of Atmospheric Sciences, Lanzhou University, Lanzhou, China
- 4Taiyuan Satellite Launch Center, Xinzhou, China
- 5Tianjin Institute of Meteorological Science, Tianjin, China
- 6Baotou Meteorological Bureau, Baotou, Inner Mongolia, China
In this study, the effects of background error covariance (BE) using the stream function ψ and unbalanced velocity potential χu as momentum control variables (CV5 scheme) and BE using the velocity U and V as momentum control variables (CV7 scheme) on assimilating radar radial velocity and reflectivity data for short-term forecasts of dispersive convection in a weak environmental field are explored based on the weather research and forecasting model (WRF) model and its 3DVAR assimilation system. The 4 km resolution forecast samples are generated to formulate the CV5 and CV7 BE by the National Meteorological Center (NMC) method. The single-observation experiments reveal that the differences between the two BE statistics are mainly reflected on the momentum control variables. The increment of wind field from CV7 shows more small-scale local characteristics. Comparing with control experiment, real radar observation assimilation tests of CV5 and CV7 both improve the reflectivity and precipitation forecasts. But the CV7 scheme improves the forecasting of strong convective systems in weak environmental fields better than CV5. First, the CV7 scheme improves both reflectivity and dispersive precipitation forecasts and significantly suppresses the spurious precipitation forecasts when compared with the CV5 scheme. In addition, CV7 also significantly reduces the forecast errors of surface variables and the wind analysis from CV7 is more local. Further analysis shows that the CV7 improves the water vapor convergence conditions compared to the CV5 scheme, which may be the reason for its better performance in the subsequent forecasts.
1 Introduction
Hazardous weather induced by mesoscale convective systems such as thunderstorms, gales and rainstorms causes a serious threat to life and property. One of the main reasons why the numerical weather prediction (NWP) model performs the worst in forecasting such intense weather is its sensitivity to initial conditions (Sun, 2005). The data assimilation technique uses available meteorological observations and NWP products (background) to estimate the optimal state of the atmosphere (Ide et al., 1997), which is the main strategy to reduce the uncertainty of the initial field and improve NWP results at present (Bouttier and Courtier, 2002). Numerous studies have shown that the assimilation of conventional observations, radar and satellite data has a positive impact on initial conditions and forecasts (Sun, 2005; Johnson et al., 2015; Gan et al., 2021; Lin et al., 2021; Eyre et al., 2022). Compared with conventional observations, radar observation has higher temporal resolution (5–10 min) and spatial resolution (250–1000 m), which can better observe meso- and small-scale weather systems and provide valuable information for convective scale data assimilation (Xiao and Sun, 2007; Wang et al., 2013; Tong et al., 2016, etc.).
Compared with the more advanced four-dimensional variational method (4DVAR), ensemble method or hybrid method, the three-dimensional variational method (3DVAR) is the most commonly used method for data assimilation due to its practicality in terms of computational efficiency. The 3DVAR approach seeks optimal analysis by minimizing the cost function associated with the control variables (Barker et al., 2004). The calculation of the background cost function requires statistical information on the model prediction error (Buehner, 2010; Brousseau et al., 2011). The background error covariance (BE) matrix is critical to the success of data assimilation systems because it controls the degree of influence of each observation in the analysis and how this influence is propagated spatially and across different analysis variables (Fisher, 2003). However, due to the rather large dimension of the BE matrix (107×107), accurate determination of the BE matrix is very difficult and usually requires simplification through control variable preprocessing (Barker et al., 2012). The selection of control variables changes the entire structure of the BE matrix and thus the assimilation results (Descombes et al., 2015). Therefore, the choice of control variables greatly affects the assimilation effect of variational assimilation systems.
There are two different control variable schemes most commonly used in the variational data assimilation system of the regional NWP model: 1) the stream function (ψ) and velocity potential (χ) as momentum control variables (Wu et al., 2002) and 2) the velocity components (U, V) as momentum control variables (Gao et al., 1999). Scholars have compared two control variable schemes. Xie and MacDonald (2012) analyzed the differences between the two control variable schemes from a mathematical perspective and concluded that background fields and small-scale observations can be better combined when UV is chosen as the momentum control variable, while using ψχ as the momentum control variable is more suitable for analyzing large-scale motion. Xu (2019) demonstrated that the choice of different momentum control variables is theoretically equivalent in the case that the error covariance function satisfies the derived relationship. Dong et al. (2022) investigated the role of two control variable schemes for assimilating conventional observation data with a 3 km resolution model. With UV control variables, 0∼6-h ground forecast was improved. Sun et al. (2016) compared the effects of two sets of mome of the mesoscale horizontal wind component and reduced the variance, while the use of UV control variables could be closer to the radar wind observations, thus improving the 0–12 h precipitation forecasts. Li et al. (2016) studied the effects of two momentum control variable schemes on radar radial velocity data assimilation using a squall line process as an example and concluded that the UV control variable scheme significantly improves the quality of the initial field and is better for squall line forecasting, while the ψχ control variable scheme generates unrealistic convergence/divergence in the analysis field, which leads to a degraded precipitation forecast. Shen et al. (2019) investigated the impacts of different momentum control variables assimilating radar radial velocity data on typhoon forecasts, and the results showed that UV as the control variable could more objectively reflect the observed wind itself. Compared with the vertical structure predicted by the ψχ scheme, the vertical structure predicted by the UV scheme is more accurate, and the predicted reflectivity, typhoon track and intensity are improved.
These studies indicate that BE with UV as the momentum control variable is more advantageous than BE with ψχ as the momentum control variable when assimilating observations. Nevertheless, among these studies, there are fewer radar data assimilation tests for strong convective cases, and most of them focus on organized convective systems (e.g., squall lines, typhoons). To make better use of radar observation data, it is necessary to carry out radar data assimilation tests for more types of convective cases and compare the effects of different BEs on severe convection forecasts to make the results more applicable. Based on the WRF model and its 3DVAR assimilation system, taking a dispersed convective process in a weak environmental field under the control of a subtropical anticyclone in the Jianghuai region of China on 26 July 2018 as an example, this study further evaluates the impact of the assimilation of radar radial velocity and reflectivity data by the two control variable schemes on the short-term prediction of strong convection to provide a reference for better radar data assimilation.
The remainder of this paper is organized as follows. Section 2 describes the WRF 3DVAR data assimilation method and the specific scheme of control variables in the assimilation system. The severe convective case, Doppler radar observations, model configuration and experimental design are introduced in Section 3. In Section 4, the characteristics of the two BE statistics are compared, and the impact of the two control variable schemes on the short-term prediction of severe convection is assessed. Finally, the summary and discussion are presented in Section 5.
2 Methodology
2.1 WRFDA 3DVAR assimilation method
The basic goal of the WRFDA 3DVAR system is to obtain the optimal estimate of the true atmospheric state at the analysis time by iteratively minimizing a prescribed non-linear cost function (Ide et al., 1997):
Where
where
2.2 Control variable schemes in the WRFDA 3DVAR assimilation system
The following two control variable schemes based on domain specificity are commonly used in the current WRFDA 3DVAR assimilation system, each containing five control variables. One of them uses the stream function (ψ) and unbalanced velocity potential (χu) as momentum control variables (CV5 scheme), and the other control variables include the unbalanced temperature (Tu), the unbalanced surface pressure (Psu) and the pseudo relative humidity (RHs). Another option uses the velocity U and V as momentum control variables (CV7 scheme), and other control variables include full temperature (T), full surface pressure (Ps), and pseudo relative humidity (RHs).
The BE matrices for two control variable schemes were generated using the gen_be utility from the WRFDA 3DVAR system by the National Meteorological Center (NMC) method (Parrish and Derber, 1992) in this study. A dataset containing 1 month in summer of cold-start 24-h forecasts over the simulation domain was produced every day starting at 0,000 and 1200 UTC. The domain-averaged BE statistics may then be obtained by averaging these differences between the 24- and 12-h forecasts valid at the same times.
3 Case description and experimental setup
3.1 Overview of the severe convection case
From afternoon to night on 26 July 2018, severe convective weather occurred over the Jianghuai region of China. Sudden strong weather was a dispersed convective process in a weak environmental field under the control of a subtropical anticyclone, mainly caused by the joint action of weak cold air infiltrating from the rear of the Mongolian cold vortex and the stable maintained subtropical anticyclone circulation. The process was of great intensity and serious disaster, with precipitation of more than 100 mm at many stations, thunderstorms and gales more than Grade 8, hail in many districts, severe flooding, traffic jams and damage to people and goods in many cities. Figure 1A shows the temperature, geopotential height, convective available potential energy (CAPE) and wind vector fields at 500 hPa, and Figure 1B shows the relative humidity, wind vector and geopotential height fields at 850 hPa from the National Centers for Environmental Prediction (NCEP) Global Forecast System (GFS) analysis at 1200 UTC on 26 July 2018. The Jianghuai region is controlled by a subtropical anticyclone. At the upper level, there is anticyclonic circulation along its eastern coast. The cold and dry air from the northeast at the bottom of the northeast trough meets the warm and wet air from the southwest of the subtropical anticyclone in Henan and Anhui provinces. The low-level humidity is very high, with relative humidity exceeding 70%, the southerly winds and easterly southeasterly winds continue to transport water vapor, and wind shear exists in the Jianghuai region. The CAPE value in most parts of the Jianghuai region exceeds 1500 J/kg, and the atmospheric energy is sufficient. Such high- and low-altitude configurations are conducive to the formation and development of convective weather systems and the occurrence of severe convection and even hailstorms.
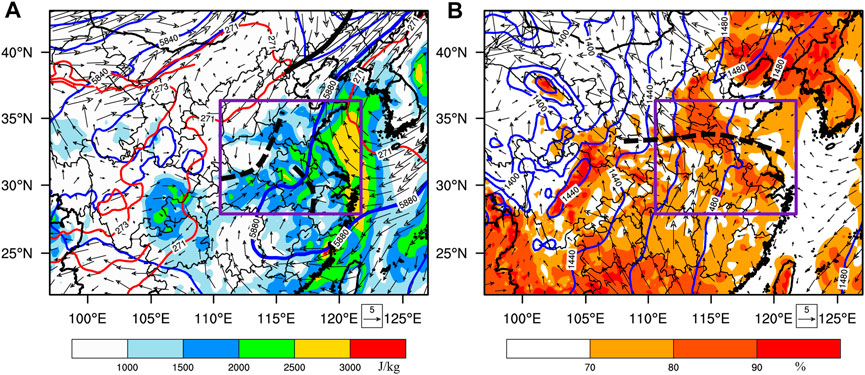
FIGURE 1. (A) Temperature (red contour; units: K), geopotential height (blue contour; units: gpm), CAPE (shaded; units: J kg-1) and wind vector (arrows; units: m s-1) fields at 500 hPa and (B) relative humidity (shaded; units: %), wind vectors (arrows; units: m s-1) and geopotential height (blue contour; units: gpm) fields at 850 hPa from the Global Forecast System (GFS) analysis at 1200 UTC on 26 July 2018. The purple rectangle indicates the area of focus for severe convection case. The solid dark line represents a through line and the dashed dark line represents a convergence line. The bolded blue line in the left panel represents the extent of subtropical anticyclone.
The radar composite reflectivity observations on 26 July 2018 are shown in Figure 2. At 0600 UTC (Figure 2A), there was dispersed convection over the Jianghuai region and strong convective cores over southeastern Jiangsu Province and southwestern Shandong Province. Then, the severe convective systems in southwestern Shandong Province gradually moved to the southeast, and those in southeastern and eastern Jiangsu Province gradually moved to the west. By 1400 UTC (Figure 2E), the severe convective systems were basically concentrated in Jiangsu and Anhui provinces, causing heavy precipitation and hail. Subsequently, the center of strong convection gradually weakened and largely dissipated by 2000 UTC. Due to the limited coverage of radar observations (8 of the 9 radars used in this study are located in Jiangsu Province, see Figure 3 for the distribution of radar sites), the complete convective weather process cannot be well presented.
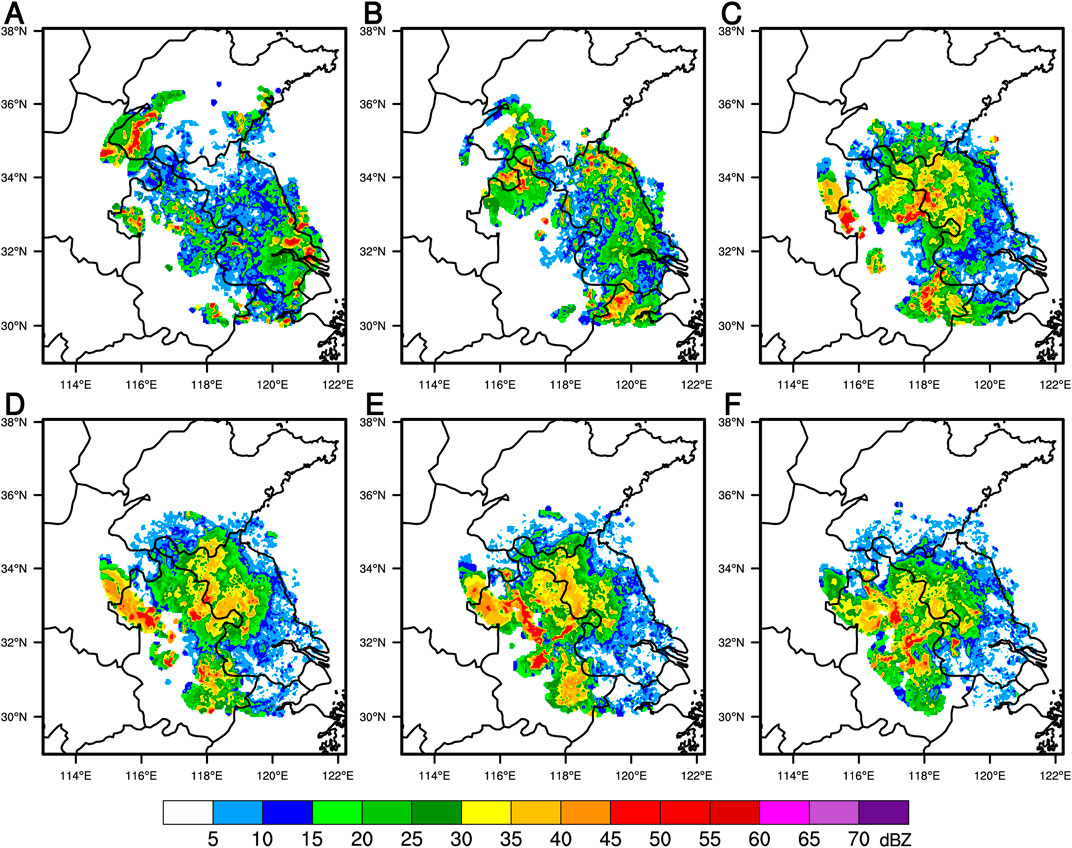
FIGURE 2. Observed radar composite reflectivity (units: dBZ) at (A) 0600 UTC, (B) 0900 UTC (C) 1200 UTC, (D) 1300 UTC (E) 1400 UTC, and (F) 1500 UTC on 26 July 2018.
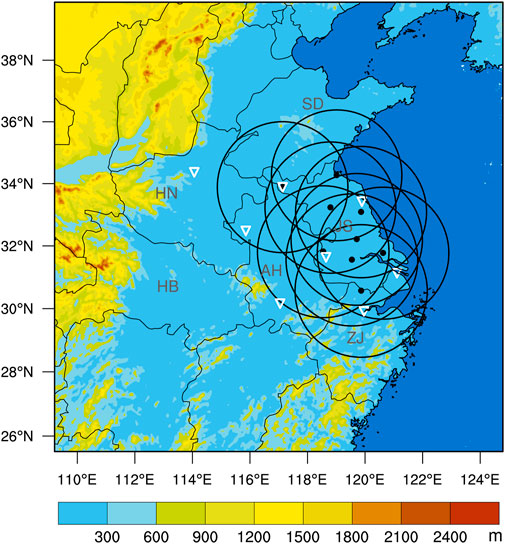
FIGURE 3. Simulation domain superposed with the terrain height (units: m) and the locations of nine radar stations (black dots). The maximum range of every radar is represented by the corresponding circle. The inverted white triangles represent the locations of sounding stations. The abbreviations for Henan, Shandong, Hubei, Anhui, Jiangsu and Zhejiang Provinces are HN, SD, HB, AH, JS and ZJ, respectively.
3.2 Doppler radar and precipitation observations
The Doppler radar data used in this study are all obtained from nine S-band CINRAD WSR-98D radars in Jiangsu and Zhejiang provinces, the locations of which are shown in Figure 3. All radars use the VCP21 mode during operation, with one volume scan completed in approximately 6 min, consisting of nine scan elevations (0.5°, 1.5°, 2.4°, 3.3°, 4.3°, 6.0°, 9.9°, 14.6° and 19.5°). The azimuth resolution is 1°, and the gate spacings of radial velocity and reflectivity factor are 250 m and 1,000 m, respectively. Before the radar observations are assimilated, they need to be preprocessed and quality controlled, including velocity dealiasing, removal of isolated points and removal of clutter and noise (Steiner and Smith, 2002; Kessinger et al., 2003; Zhang and Wang, 2006). Figure 4 illustrates the validity of radar data quality control. After the quality control of reflectivity data, non-meteorological echoes such as ground clutter, anomalous propagation signals are greatly suppressed. In addition, the quality controlled data need to be thinned and are spatially mapped from spherical coordinates (distance, azimuth and elevation) onto the model regular grids using a local least square fitting method (Brewster et al., 2005) prior to assimilation. The observation errors of reflectivity and radial velocity are set to 2 dBZ and 1 m s-1 in all the radar data assimilation experiments of this study, respectively. The precipitation observation data are obtained from the hourly precipitation grid dataset created by merging data from automatic weather stations in China and CMORPH satellite data with a spatial resolution of 0.1°×0.1°, provided by the Chinese National Meteorological Information Center (NMIC) for the evaluation of precipitation forecasting skills.
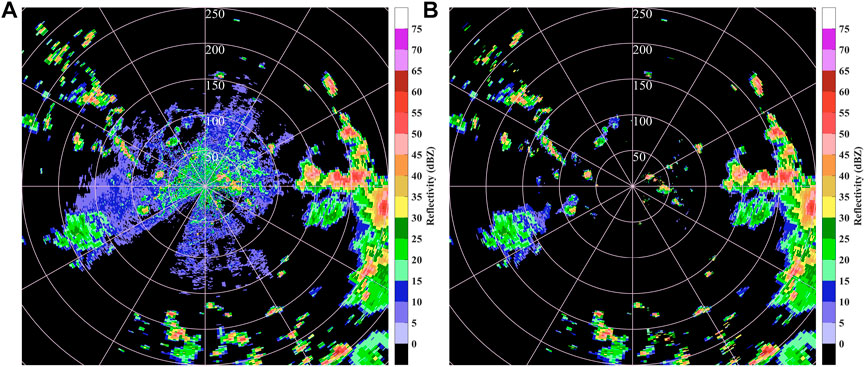
FIGURE 4. (A) Original reflectivity and (B) reflectivity after being quality controlled for 0.5° elevation angle at 0600 UTC on 26 July 2018 from the Nanjing radar.
3.3 Model configuration and experimental design
The WRF model and its 3DVAR assimilation system WRFDA (version 3.9.1) are adopted in this study, and a single domain (shown in Figure 3) is applied for all simulations. The model domain has horizontal dimensions of 400×400 and grid spacings of 4 km. The integration time step of the simulation is 20 s, and the domain has 50 terrain-following eta layers from the surface to 50 hPa. The initial and boundary conditions are provided by NCEP GFS 0.25°×0.25° analysis and forecast fields at 3-h intervals. The main parameterizations used in WRF simulations include the WRF single-moment 6-class (WSM6) microphysics scheme (Hong and Lim, 2006), the Goddard shortwave radiation scheme (Chou and Suarez, 1999), the Rapid Radiative Transfer Model (RRTM) longwave radiation scheme (Mlawer et al., 1997), the Yonsei University (YSU) planetary boundary layer scheme (Hong et al., 2006) and the Noah land surface model (Ek et al., 2003). The cumulus parameterization scheme is not used due to the fine grid resolution. The two BE matrices (CV5 scheme and CV7 scheme) are calculated by the NMC method using a sample of forecasts of approximately 1 month in summer.
To investigate the effects of two BE matrices on radar data assimilation analysis and severe convection forecasting, single observation and real radar observation assimilation experiments are designed in this study. The detailed configuration of the single observation tests is described in the next section. A control experiment and two assimilation experiments are designed for real radar observation experiments (shown in Figure 5). The control experiment EXP_CTL is run 24 h from 1800 UTC 25 July 2018 to 1800 UTC on 26 July, and the initial 12 h represents the “spin-up” period of model integration. EXP_CTL does not assimilate any observations and is used to examine the effect of the assimilation experiments. Both assimilation experiments take the 12-h prediction field of the control experiment as the background field of the first assimilation. EXP_CV5 and EXP_CV7 assimilate radar observations (both reflectivity and radial velocity) every 3 h from 0600 UTC to 1200 UTC, taking the analysis field assimilated at 1200 UTC as the initial field and integrating forward for 6 h. The difference is that the former uses the BE matrix of the CV5 scheme for assimilation, while the latter uses the BE matrix of the CV7 scheme for assimilation. Current studies generally agree that the BE matrix obtained statistically using the NMC method overestimates the characteristic length scale (Liu et al., 2005; Li et al., 2012; Sun et al., 2016; Stanesic et al., 2019; Thiruvengadam et al., 2020). Therefore, in the two assimilation experiments, the length scales are reduced to half of the default value, which are set to 0.5. The radial velocity observations are assimilated directly using the assimilation scheme described by Xiao et al. (2005). For the reflectivity data, the indirect assimilation scheme introduced by Wang et al. (2013) is used to assimilate retrieved rainwater and water vapor within the cloud estimated from reflectivity. In addition, the snow and graupel mixing ratios retrieved from reflectivity data are assimilated using the relationships presented by Gao and Stensrud (2012).
4 Results
4.1 Comparison of the BE statistics
The characteristic length scale represents the range of influence of background error, and the characteristic length scales of BE in the two control variable schemes are first compared below. Since the control variables are derived based on the assumption of uniformity and isotropy, their length scales vary only with height (Barker et al., 2004). Figure 6 shows the variation of characteristic length scales of two groups of control variables with vertical modes. As seen from Figures 6A,B, the length scales of U and V are significantly smaller than those of ψ and χu. The length scales of the first modes of U and V are approximately 60 km, while the corresponding length scales of ψ and χu are over 180 km. The solid black line in the figure indicates the ratio of the length scales of the two variables. These two ratios increase gradually with increasing wavenumber, indicating that ψ and χu lead to larger length scales for small-scale features of the atmosphere compared to U and V. The characteristic length scale difference of temperature is mainly reflected in the first 25 modes. The length scale of the temperature in the CV7 scheme is slightly larger than that of the unbalanced temperature in the CV5 scheme (Figure 6C). The characteristic length scales of relative humidity are identical in both schemes, with a maximum value of approximately 32 km (Figure 6D). The above comparison shows that the difference in characteristic length scales between the two groups of control variables is mainly reflected in the differences between the variables U and ψ, V and χu. The BE generated using the CV7 scheme has a smaller length scale for its momentum control variables, which is consistent with the findings of Sun et al. (2016).
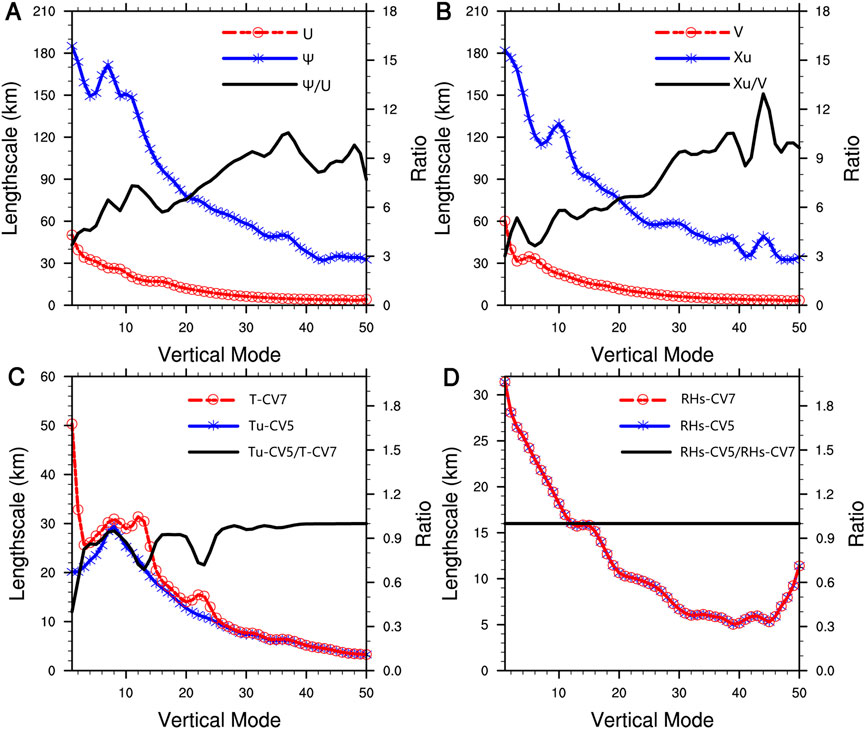
FIGURE 6. Variation of length scale with vertical mode for each variable in the CV5 and CV7 schemes: (A) ψ and U (B) χu and V, (C) Tu and T (D) RHs-CV5 and RHs-CV7. The blue line represents the control variable of CV5 scheme, and the red line represents the control variable of CV7 scheme. The solid black line represents the ratio of the variable length scales in the two schemes.
4.2 Single observation tests
To verify the rationality of statistical BEs and more intuitively compare the differences between the two control variable schemes, assimilation tests of single observations are conducted before the assimilation experiments of real radar observations. Using the forecast field of experiment EXP_CTL at 0600 UTC on 26 July 2018 as the background field, a single temperature and westward wind observation are added at the center of the model domain (33°N, 117°E) at the 11th level of the model (approximately 850 hPa). The innovations of the perturbation point (observation-background) are set to 1 K and 1 m/s, and the observation errors are set to 1 K and 1 m/s, respectively.
Figures 7A,B show the analysis increments of temperature and horizontal wind at the 11th model level after assimilating single temperature observations using the CV5 and CV7 schemes, respectively. The temperature increments produced by the two experiments are basically the same, uniform and isotropic. The increment is the largest near the observation location and gradually decreases from the inside out, indicating that there is little difference in the assimilation of temperature between the two BEs. Note that the CV5 scheme generates circular anticyclonic wind field increments near the observation location because the correlation between the variables ψ and temperature is considered in the CV5 scheme, so wind field increments are generated, but the incremental values are very small. The CV7 scheme does not consider the correlation between control variables, so the temperature perturbation will not produce the wind increment.
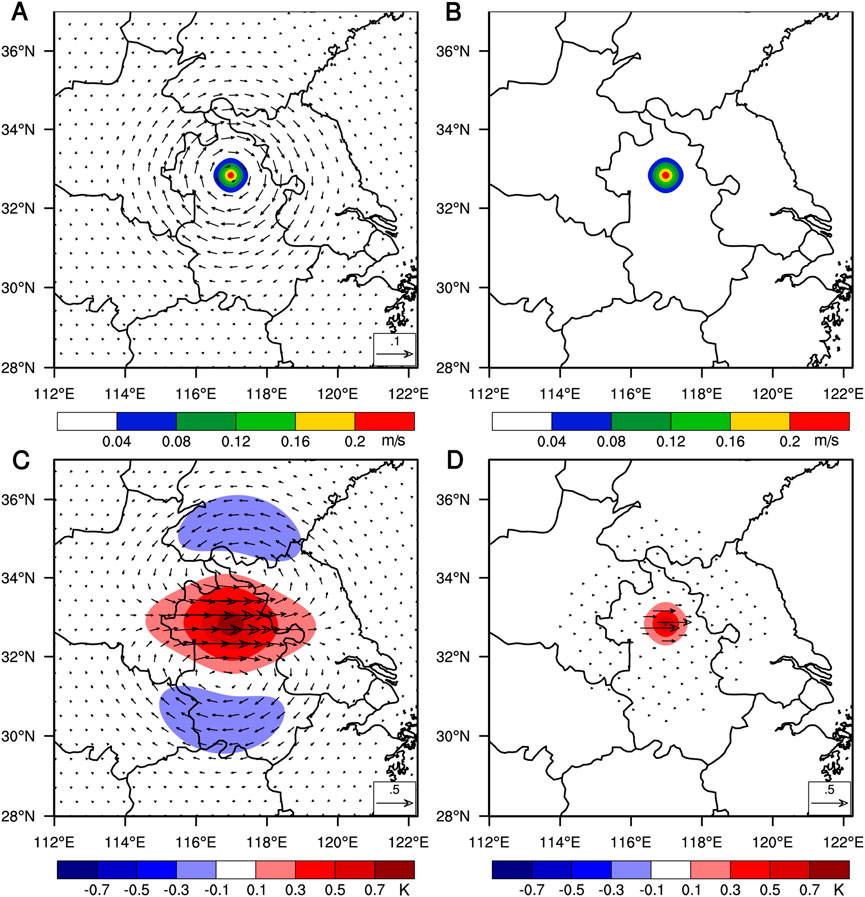
FIGURE 7. The increments of temperature (shaded; units: K) and wind field (vector; units: m s-1) with a single temperature observation at the 11th model level: (A) CV5 scheme (B) CV7 scheme. The increments of U-wind (shaded; units: m s-1) and wind field (vector; units: m s-1) with a single westward wind observation at the 11th model level: (C) CV5 scheme (D) CV7 scheme.
Figures 7C,D display the analysis increments of U-wind and horizontal wind at the 11th model level after assimilating single westward wind observations using the CV5 and CV7 schemes, respectively. It is easy to find that wind field increments vary greatly between different control variable schemes. The propagation of the positive increment region of the U-wind generated by the CV5 scheme is much larger than that of the CV7 scheme on the horizontal scale because the two have different characteristic length scales. The CV5 scheme generates anticyclonic and cyclonic wind field increments on the north and south sides of the large value area of westerly wind increments, respectively, and produces negative incremental regions of U-wind on both the north and south sides, which has non-physical significance. These negative increments will lead to unrealistic local divergence and convergence if the radial velocity observations are assimilated with the CV5 scheme. In contrast, the CV7 scheme is able to more objectively reflect the observed winds themselves. Since the CV5 scheme considers the correlation of the control variables, the perturbation westward wind variable produces increments of V-wind in the analyzed field, but the increment value of V-wind is much smaller compared to U-wind. In contrast, U and V are independent control variables that are not correlated with each other, so only westerly wind increments are generated in the CV7 scheme. It is worth noting that humidity is an independent control variable in both schemes, so the assimilation of single observations will not produce humidity increments.
Figures 8A,B show the vertical profile of the increment of U-wind along 33°N in Figures 7C,D, respectively. The increments generated by the CV5 scheme have a much larger propagation in the horizontal direction than those generated by the CV7 scheme. The incremental horizontal propagation range produced by the CV7 scheme is small, and the influence range is relatively concentrated. The single observation tests show that compared with the CV5 scheme, the CV7 scheme contains smaller scale features and is more local.
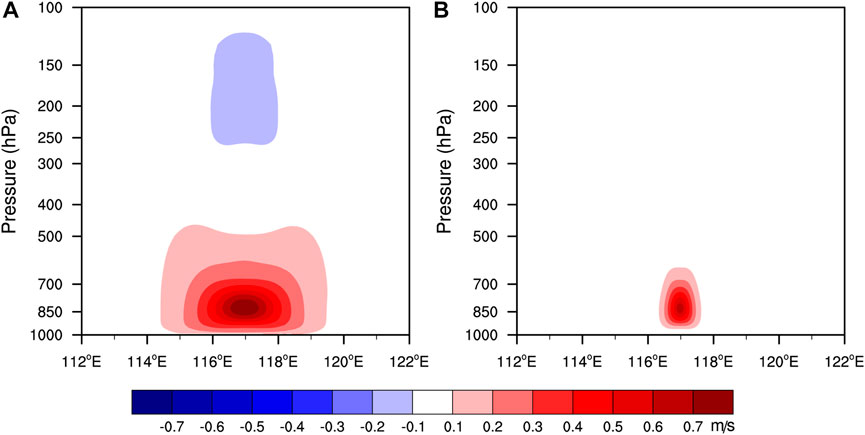
FIGURE 8. Vertical profile of U-wind analysis increments (units: m s-1) along 33°N in the single westward wind observation test: (A) CV5 scheme (B) CV7 scheme.
4.3 Comparison of the increment fields of assimilated radar observations
The effects of the two schemes on the assimilation of real radar observations are investigated next. Figure 9 demonstrates the analysis increments at 850 hPa resulting from the assimilation of the radar observations at 0600 UTC for experiments EXP_CV5 (left column) and EXP_CV7 (right column). EXP_CV5 (Figure 9A) produces a much larger range of wind field increments than EXP_CV7 (Figure 9B). EXP_CV5 produces multiple large value regions of wind speed increments and cyclonic wind field increments in the northern part of Henan Province and the southeastern coastal area of Jiangsu Province. The wind field increments generated by EXP_CV7 contain more small-scale characteristics. EXP_CV7 produces almost no temperature increment (Figure 9D), while EXP_CV5 (Figure 9C) produces a temperature increment of some magnitude (0.1 K), which is due to the correlation between the control variables in the CV5 scheme. There is no significant difference in humidity increment between the two groups of experiments, and both have large humidity increments in the area with a large value of radar composite reflectivity (see Figure 2A).
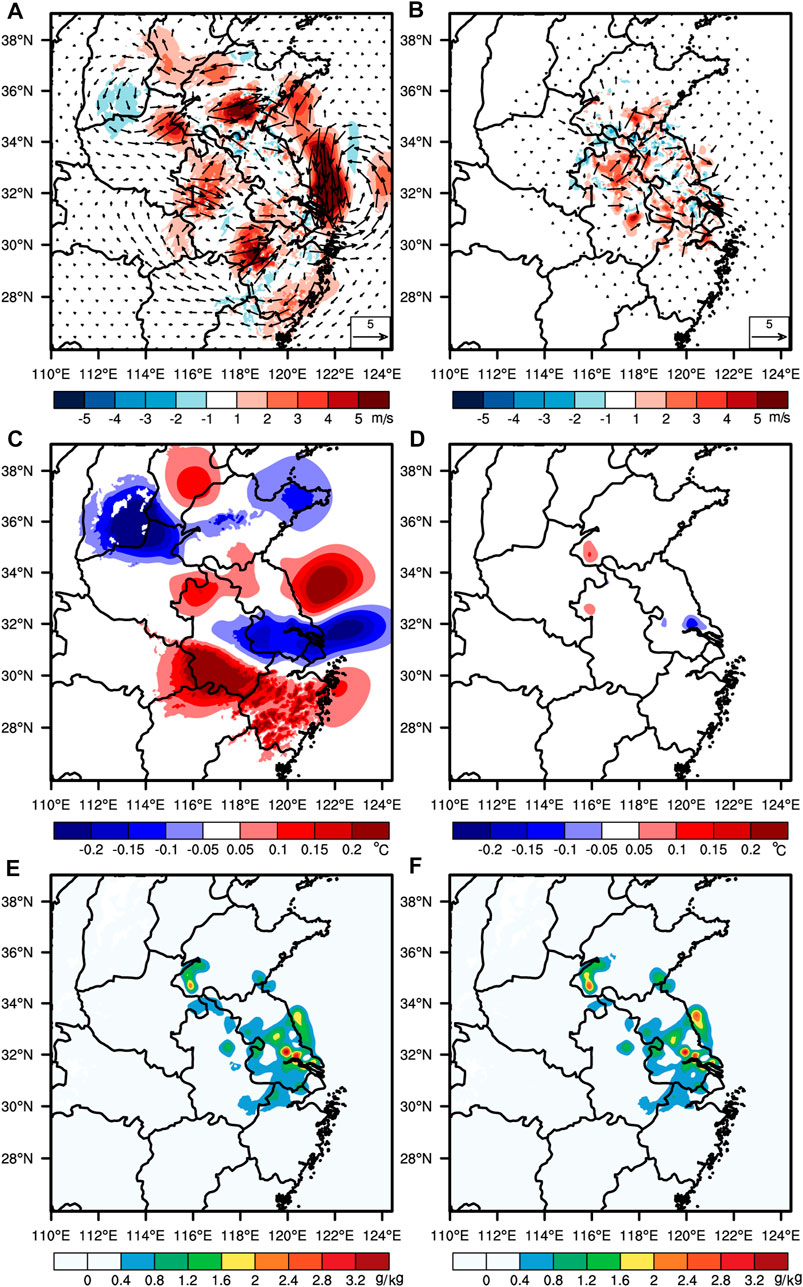
FIGURE 9. Analysis increments of (A), (B) wind speed and wind vector (units: m s-1) (C) (D) temperature (units: °C); and (E), (F) water vapor mixing ratio (units: g kg-1) at 850 hPa at 1200 UTC on 26 July 2018 from the real radar observation experiments EXP_CV5 (left column) and EXP_CV7 (right column).
4.4 Reflectivity forecasts
To better compare the effects of the two control variable schemes on convective forecasts, the observed composite reflectivity field and the predicted third hour (1500 UTC) composite reflectivity fields calculated from three experiments are presented in Figure 10. At this time, the observed echo areas with large values were mainly located in Anhui Province. The echoes in the high value area are hardly forecasted in EXP_CTL (especially in the area inside the black circle) but instead generate false strong convection in eastern Henan Province and southern Anhui Province. The predicted echoes of EXP_CV5 and EXP_CV7, after cyclic assimilation of radar data, are much improved compared with EXP_CTL. Both assimilation experiments successfully predict strong echoes in north-central Anhui Province, but the predicted echoes from EXP_CV7 are closer to the observations. Although both assimilation experiments produce spurious convection within Henan Province, the false convection predicted by EXP_CV5 is significantly more, which may be due to unrealistic convergence after assimilating radar observations using the CV5 scheme.
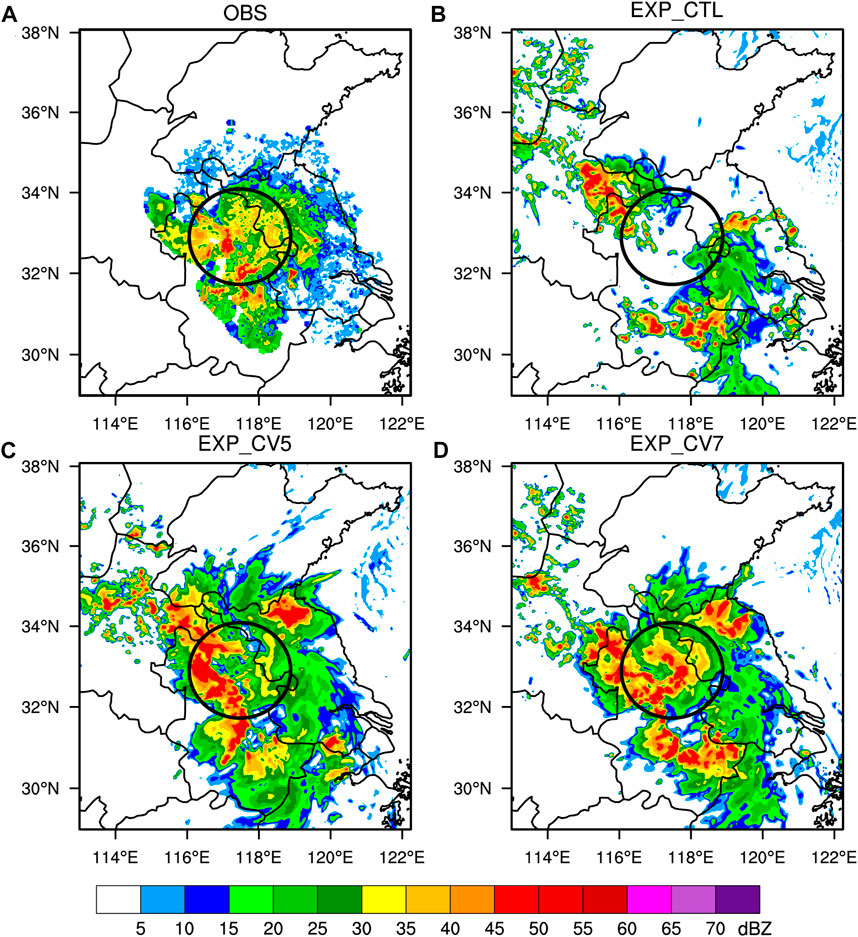
FIGURE 10. Composite reflectivity fields (units: dBZ) at 1500 UTC on 26 July 2018: (A) for the observations, the third hour forecast of experiments (B) EXP_CTL, (C) EXP_CV5, and (D) EXP_CV7.
In this study, the equitable threat score (ETS), false alarm rate (FAR), BIAS and missing alarm rate (MAR) scores are used to evaluate reflectivity and quantitative precipitation forecasts, and the range of the validation area is shown in Figure 10A. ETS considers the hit number achieved by chance and has the fairness property, which is measured in the range of −1/3 to 1. Larger values indicate better forecasting skill. The measurement range of BIAS is 0 ∼ ∞, and the ideal BIAS score is 1. A BIAS higher than 1 indicates overestimation and less than 1 indicates underestimation (Goines and Kennedy, 2018). The values of MAR and FAR range from 0 to 1, with lower values indicating better forecasting skill.
The ETS, FAR and BIAS scores of the maximum reflectivity predicted by the three experiments against the observations are given in Figure 11 for three thresholds of 10, 20 and 30 dBZ. It can be seen that the two assimilation experiments significantly improve the ETS scores compared to the control experiment. It is obvious that EXP_CV7 has higher ETSs and lower FARs than EXP_CV5, except for the sixth-hour forecast at the 20 dBZ threshold and the fourth- and fifth-hour forecasts at the 30 dBZ threshold. The BIASs of EXP_CTL are below 1 at all thresholds throughout the forecast period, indicating that it underestimates the echoes. In contrast, both assimilation tests overestimate the echoes, and the BIAS values of EXP_CV7 are generally smaller than those of EXP_CV5. Overall, EXP_CV7 performs better in forecasting the echoes.
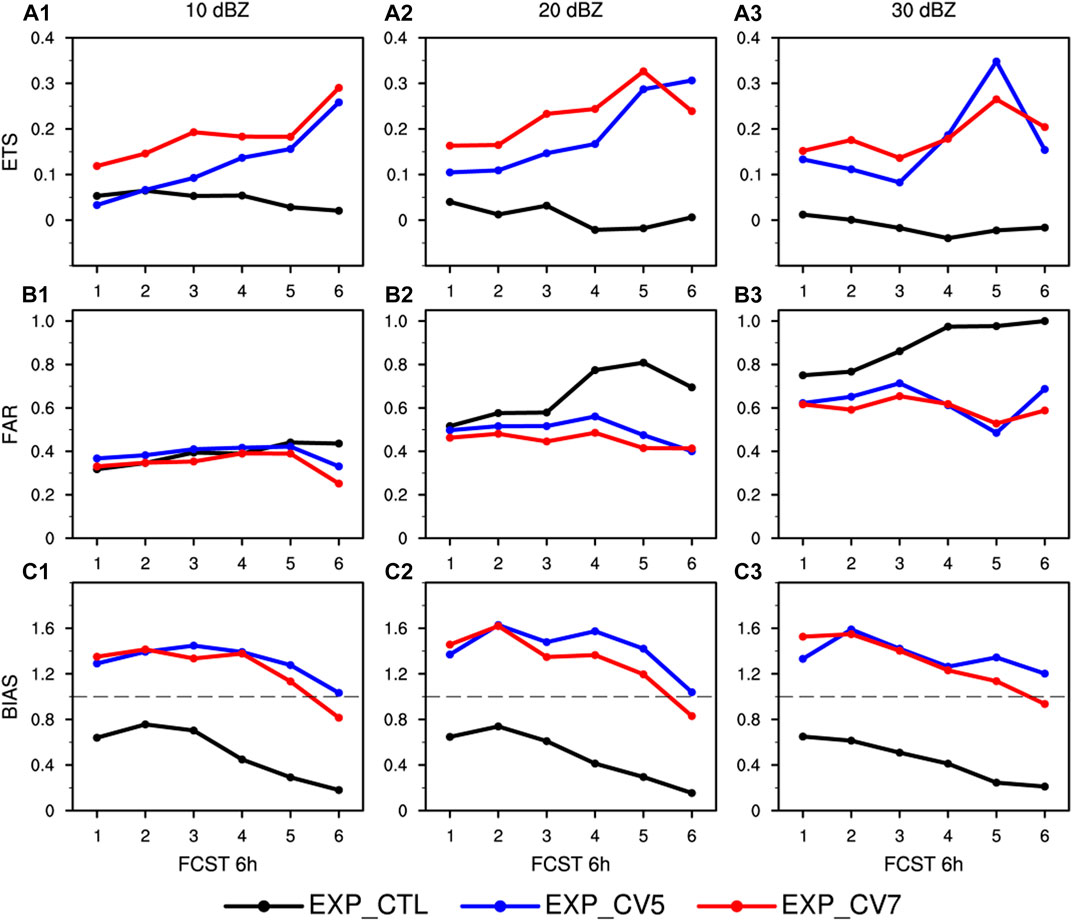
FIGURE 11. ETS (A1-A3), FAR (B1-B3) and BIAS (C1-C3) scores for the maximum reflectivity predicted by the three experiments. The first, second and third columns are the results of thresholds of 10, 20 and 30 dBZ, respectively.
4.5 Precipitation forecasts
To verify the spatial pattern of precipitation, the simulated precipitation results of the three experiments are compared with the observed precipitation in Figure 12. The first and second rows are the 3-h accumulated precipitation for 1,200–1500 UTC and 1,500–1800 UTC, respectively, and the third row is the 6-h accumulated precipitation for 1,200–1800 UTC. The first column shows the observed precipitation, and the second, third, and fourth columns successively represent the precipitation forecasted by EXP_CTL, EXP_CV5, and EXP_CV7. The observed precipitation is mainly located in Anhui Province and western Jiangsu Province, and the area with 6-h accumulated precipitation exceeding 50 mm is mainly located in central Anhui Province. 1,200–1500 UTC, EXP_CTL (Figure 12B1) barely predicts the heavy rainfall band and generates false strong precipitation forecasts in eastern Henan Province and Jiangsu Province. After assimilating the radar data, the intense precipitation forecasts in EXP_CV5 (Figure 12C1) and EXP_CV7 (Figure 12D1) are well improved. Compared with EXP_CV5, EXP_CV7 has better precipitation forecasts in northern Anhui Province, which is closer to the observation, and reduces the false precipitation of EXP_CV5 in Henan Province to some extent. 1,500–1800 UTC, the observed precipitation area shrinks toward central Anhui Province, and EXP_CTL (Figure 12B2) completely misses precipitation and produces false heavy precipitation forecasts in eastern Henan Province and southern Anhui Province. Both experiments EXP_CV5 (Figure 12C2) and EXP_CV7 (Figure 12D2) predicted precipitation in central Anhui Province, but EXP_CV7 forecasted precipitation that was more consistent with observations, and the unrealistic heavy precipitation of EXP_CV5 was significantly reduced in Henan Province. 1,200–1800 UTC, the precipitation in Anhui Province is not predicted by EXP_CTL, while the location of precipitation in EXP_CV5 and EXP_CV7 remains largely consistent with the observation, but the intensity of precipitation is obviously overestimated. EXP_CV7 is better than EXP_CV5 in predicting precipitation in central and southern Anhui Province and Henan Province.
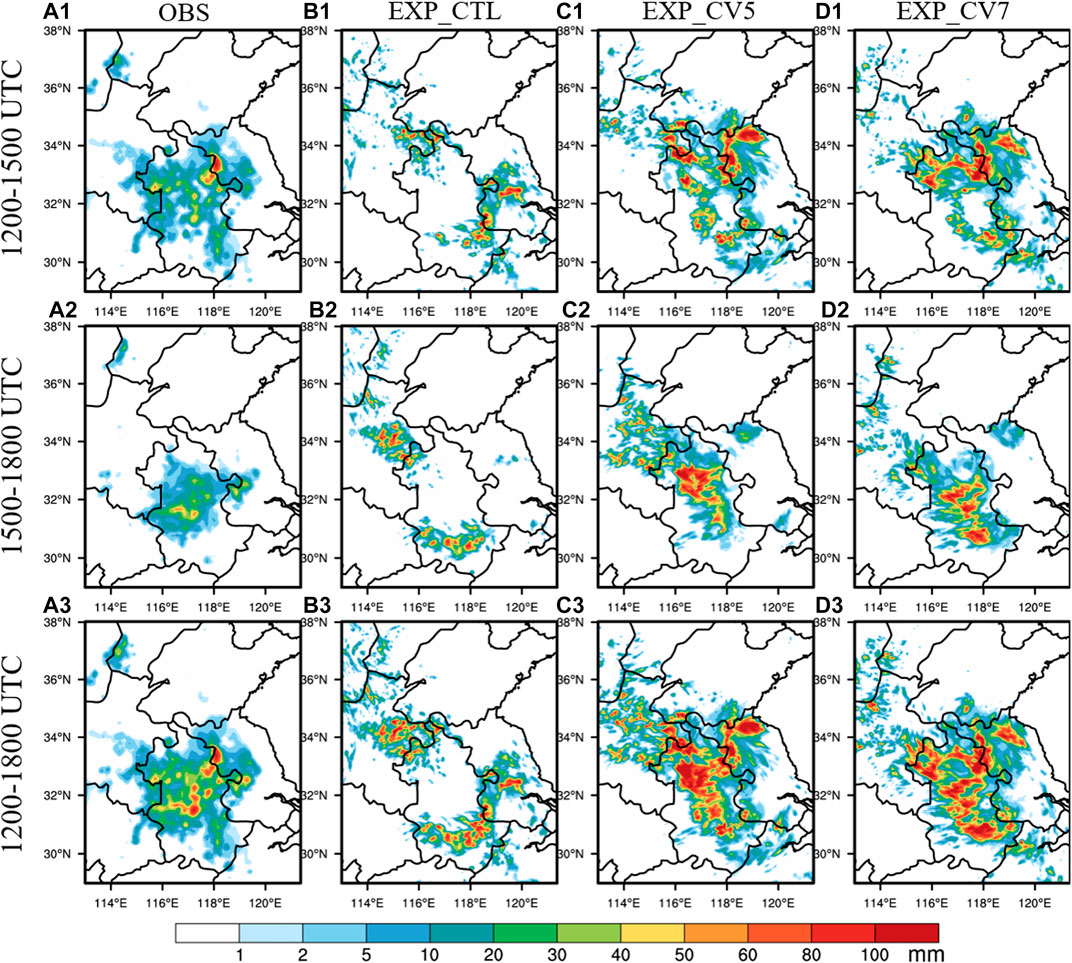
FIGURE 12. Observed and forecasted 3-h and 6-h accumulated precipitation (units: mm). From left to right: observations (A1, A2, A3), EXP_CTL (B1, B2, B3), EXP_CV5 (C1, C2, C3) and EXP_CV7 (D1, D2, D3); from top to bottom: 1,200–1500 UTC, 1,500–1800 UTC and 1,200–1800 UTC.
Statistical validation scores are calculated to quantitatively assess the impact of the two control variable schemes on convective precipitation forecasts. The ETS, FAR, MAR, and BIAS scores of the 6-h accumulated precipitation against observed precipitation with different thresholds of 1, 2, 5, 10, 20, 30, 40, and 50 mm are given in Figure 13. The ETSs for both assimilation experiments are consistently higher than EXP_CTL at all thresholds, and the FARs and MARs are consistently lower than EXP_CTL at all thresholds. The FAR and MAR scores of EXP_CTL at the threshold of 50 mm are 1, indicating that heavy precipitation above 50 mm is completely missed, and there are many false heavy precipitations. The ETSs of EXP_CV7 at all thresholds are consistently higher than those of EXP_CV5, and the FARs, MARs and BIASs of EXP_CV7 at all thresholds are consistently lower than those of EXP_CV5. The results show that both assimilation experiments improve precipitation forecasts after assimilating radar observations, but using the CV7 scheme to assimilate radar data has better performance in precipitation forecasting.
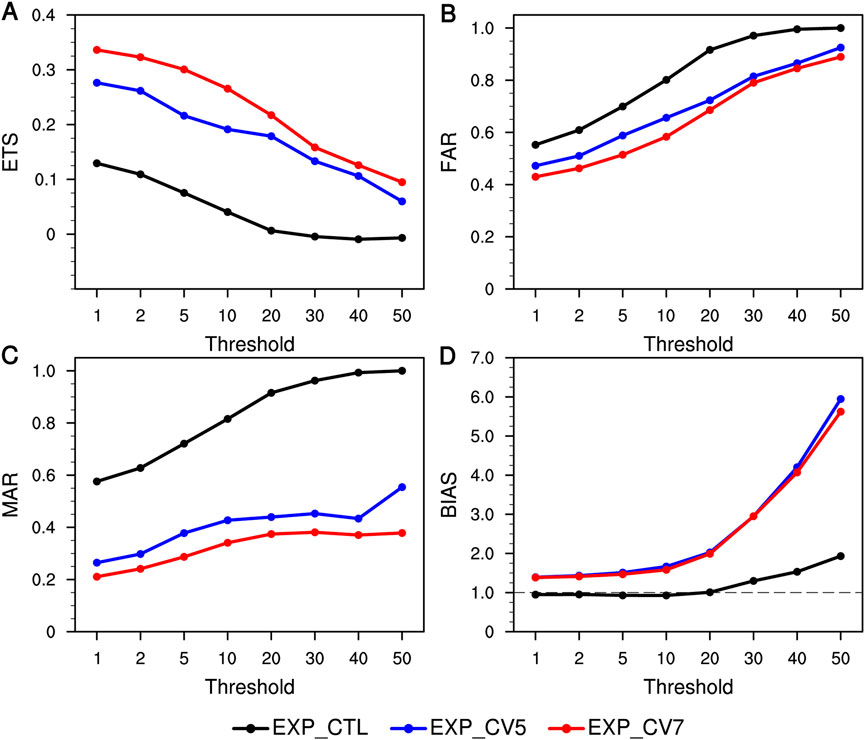
FIGURE 13. (A) ETS, (B) FAR (C) MAR and (D) BIAS scores for forecasted 6-h accumulated precipitation with thresholds of 1, 2, 5, 10, 20, 30, 40 and 50 mm for the three experiments.
4.6 Verification against conventional observations
Conventional observations are used to verify the impact of both schemes on analysis and forecasting. Figure 14 shows the vertical profiles of root-mean-square errors (RMSEs) for horizontal wind speed (U and V), temperature T), and water vapor mixing ratio Q) in the initial field (1200 UTC) for each experiment. The RMSEs are calculated against the observations from eight sounding stations in Figure 3. EXP_CV7 greatly improves the wind field compared with EXP_CV5. For the U wind component, the RMSEs of EXP_CV7 are smaller than those of EXP_CTL except for 250–150 hPa and are significantly lower than those of EXP_CV5 except for 400 hPa and 150 hPa. For the V wind component, the RMSEs of EXP_CV7 are significantly smaller than those of EXP_CTL except for 200 hPa and 100 hPa and are significantly lower than those of EXP_CV5 except for 850 hPa. With smaller length-scale, EXP_CV7 could capture more local characteristic and make the analysis increment more consistent with high-density radar observation. For temperature T, the RMSEs of EXP_CV7 are smaller than those of EXP_CV5 except for 400–300 hPa, and its RMSEs are larger than those of EXP_CTL at heights above 500 hPa. For the water vapor mixing ratio Q, EXP_CV7 has lower RMSEs than EXP_CV5 at altitudes above 700 hPa. EXP_CV5 has larger RMSEs than EXP_CTL for multiple height levels for all variables, which may be caused by excessive propagation of variable increments and overestimation of variable subsequent predictions after assimilation of radar observations. Figure 14 shows that the assimilation effect of the CV7 scheme on radar data is better than that of the CV5 scheme, especially for the improvement of the wind field.
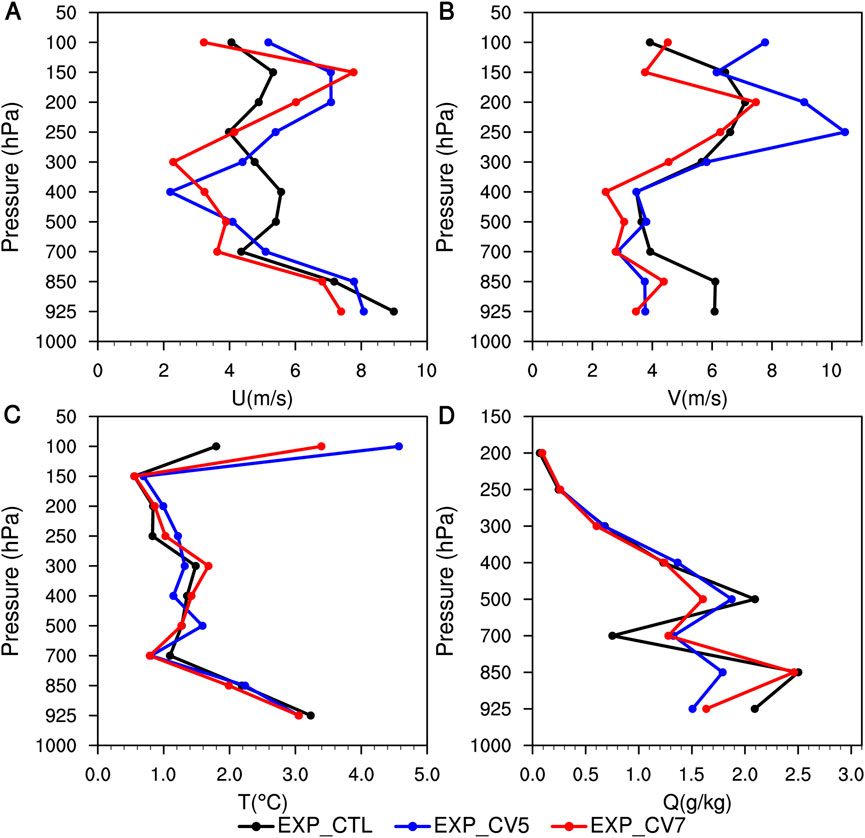
FIGURE 14. Vertical profiles of root-mean-square errors (RMSEs) of analyses against sounding observations at 1200 UTC on 26 July 2018 for (A) the U wind component (m s-1), (B) the V wind component (m s-1), (C) temperature T (°C), and (D) water vapor mixing ratio Q (g kg-1).
Figure 15 describes the time series RMSEs of the 10 m wind speed (WP10 M), 2 m temperature (T2 M), 2 m relative humidity (RH2 M) and surface pressure (Ps) from the forecasts of EXP_CTL, EXP_CV5 and EXP_CV7. The RMSEs are calculated against the SYNOP observations from 319 surface stations. Compared with EXP_CV5, EXP_CV7 seems to have a smaller RMSE for all surface variables, especially for the wind field where the reduction in RMSE is most pronounced. Overall, the assimilation of radar data using the CV7 scheme produces analysis fields fitting observations well and can significantly reduce forecast errors for model surface variables.
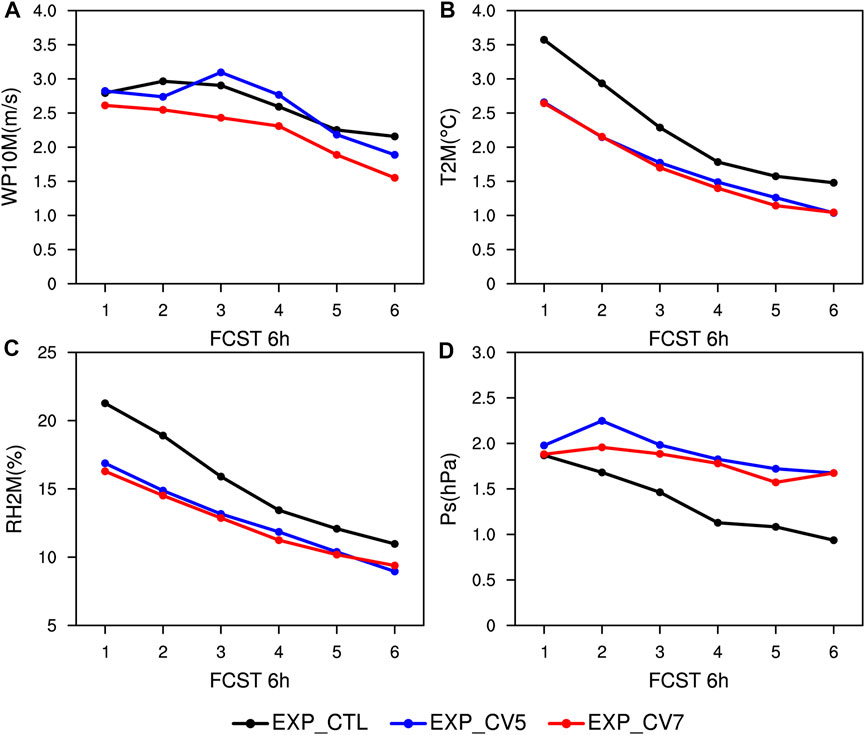
FIGURE 15. Time series of the RMSE of the predicted surface variables against the SYNOP observations for (A) wind speed at 10 m, (B) temperature at 2 m (C) relative humidity at 2 m and (D) surface pressure.
4.7 Diagnosis of wind and moisture fields
The wind and moisture fields at 700 hPa provide information on the source and transport mechanism of water vapor. To analyze the reasons for the differences in the forecasts of each experiment, the horizontal wind vector and water vapor flux divergence fields at 700 hPa for the initial fields of the three experiments are presented in Figure 16. The wind speeds in the initial fields of experiments EXP_CV5 and EXP_CV7 are larger than those in EXP_CTL due to the assimilation of high-resolution radar observations, and the enhanced southeasterly wind continuously transports the water vapor from the East China Sea to Jiangsu and Anhui Provinces. The negative large value of water vapor flux divergence in all three experiments is mainly located at the border of Anhui Province and Jiangsu Province. Compared with EXP_CV7, EXP_CV5 has obvious cyclonic wind shear in region A, and there are many scattered water vapor convergence zones, which is also the reason for its spurious heavy precipitation forecast in this region in the subsequent forecast. EXP_CTL has a small range of negative large values of water vapor flux divergence in region B, and water vapor convergence is very weak. EXP_CV5 and EXP_CV7 both significantly enhance the convergence of water vapor in region B. The airflow from all directions gathers in this region, and the range of water vapor convergence increases significantly. However, the latter has a larger range of water vapor convergence than the former (especially in northern Anhui Province) and suppresses the unrealistic convergence of EXP_CV5 in region A, which better matches the observed radar echo region with a large value (Figure 2C), resulting in the improved forecast.
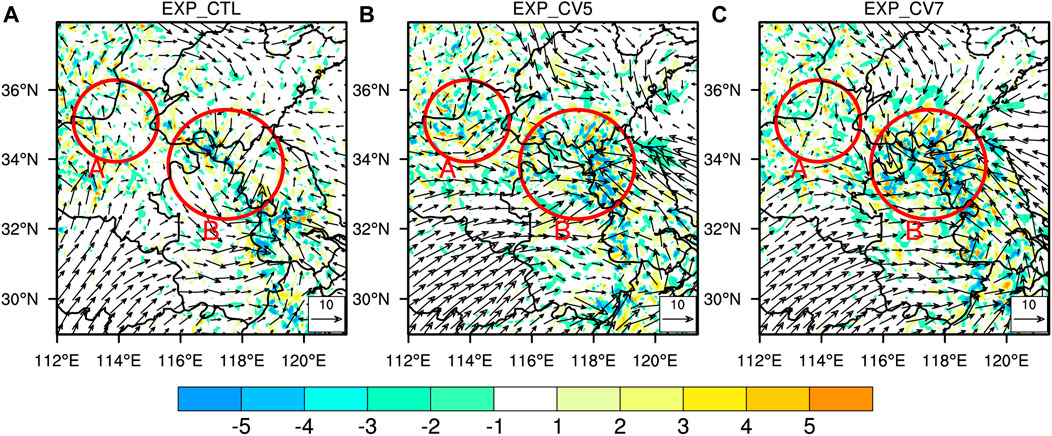
FIGURE 16. Horizontal wind vectors (arrows; units: m s-1) and water vapor flux divergence (shaded; units: g cm-2 hPa-1 s-1) at 700 hPa from the initial fields of (A) EXP_CTL, (B) EXP_CV5, and (C) EXP_CV7. The valid time is 1200 UTC on 26 July 2018.
5 Summary and discussion
The choice of control variables is crucial for the assimilation efficiency of variational assimilation systems. In this study, based on the WRF model and its 3DVAR assimilation system, the BE matrix with ψχu as the momentum control variable (CV5 scheme) and the BE matrix with UV as the momentum control variable (CV7 scheme) are calculated by the NMC method. The characteristic length scales of two BE statistics are compared, and the characteristics of BE of two control variable schemes are analyzed by single temperature and westward wind observation tests. The impact of assimilating radial velocity and reflectivity on short-term forecasts of reflectivity and precipitation using the two control variable schemes is also evaluated by taking a dispersive convective process in a weak environmental field under the control of a subtropical anticyclone in the Jianghuai region of China on 26 July 2018 as an example.
The comparison of the characteristic length scales reveals that the differences between the two BE statistics are mainly reflected in the differences between the momentum control variables. The single observation tests show that the analysis increments of the wind field generated by the two BEs is significantly different. The analysis increments generated by the BE of the CV5 scheme have a larger range of influence, and the negative increments non-physically will lead to unrealistic local divergence and convergence. In contrast, the analysis increments produced by the BE of the CV7 scheme tend to capture small-scale features and are more localized.
The real radar observation assimilation experiments show that the range of the wind field analysis increment generated by EXP_CV5 is much larger than that generated by EXP_CV7, and there is little difference in the temperature analysis increment and almost no difference in the water vapor mixing ratio analysis increment. Compared with EXP_CTL, both assimilation tests improve the reflectivity and precipitation forecasts. However, the distribution of the predicted reflectivity and accumulated precipitation and objective statistical scores show valuable improvements in EXP_CV7 compared with EXP_CV5. EXP_CV7 improves the convective precipitation forecasts and distinctly reduces the spurious precipitation forecasted by EXP_CV5. This is consistent with the results of previous studies for assimilating both radar and other observations (Li et al., 2016; Sun et al., 2016; Thiruvengadam et al., 2019; Wang et al., 2020; Dong et al., 2022). In addition, it also significantly reduces the prediction error of surface variables. Further analysis shows that compared to EXP_CV5, EXP_CV7 improves the wind, temperature and water vapor fields in the initial field and improves the water vapor convergence conditions, which may be the reason for its better performance in the subsequent forecasts.
The results provide strong evidence that the assimilation of radar reflectivity and radial velocity using the CV7 scheme can improve the forecasting of strong convective systems in weak environmental fields. However, in this study, only one dispersed convection process is studied, and more case studies and more long-term experiments are needed to make the results more applicable to make better use of the radar observations.
Data availability statement
The raw data supporting the conclusion of this article will be made available by the authors, without undue reservation.
Author contributions
WS involved throughout the research, analysis, and manuscript process. EL helped to analyze and interpret the results, reviewed and revised the manuscript. XQ developed the concept for the manuscript and provided ongoing manuscript feedback. YX provided insight and feedback in the analysis process.
Funding
This research was mainly supported by the Key Laboratory of Climate Resource Development and Disaster Prevention of Gansu Province (No. 20JR10RA654), Bohai Rim Meteorological Science Collaborative Innovation Fund (No. QYXM201901) and the Natural Science Foundation of Tianjin (No. 20JCYBJC00780).
Acknowledgments
The authors acknowledge the Mesoscale and Microscale Meteorology Laboratory of National Center for Atmospheric Research (NCAR) for providing the WRF. We also thank the NCEP for providing the 0.25°
Conflict of interest
The authors declare that the research was conducted in the absence of any commercial or financial relationships that could be construed as a potential conflict of interest.
Publisher’s note
All claims expressed in this article are solely those of the authors and do not necessarily represent those of their affiliated organizations, or those of the publisher, the editors and the reviewers. Any product that may be evaluated in this article, or claim that may be made by its manufacturer, is not guaranteed or endorsed by the publisher.
References
Barker, D. M., Huang, W., Guo, Y. R., Bourgeois, A. J., and Xiao, Q. N. (2004). A three-dimensional variational data assimilation system for MM5: Implementation and initial results. Mon. Weather Rev. 132, 897–914. doi:10.1175/1520-0493(2004)132<0897:ATVDAS>2.0.CO;2
Barker, D. M., Huang, X. Y., Liu, Z. Q., Auligné, T., Zhang, X., Rugg, S., et al. (2012). The weather research and forecasting model's community variational/ensemble data assimilation system: WRFDA. B. Am. Meteorol. Soc. 93, 831–843. doi:10.1175/BAMS-D-11-00167.1
Bouttier, F., and Courtier, P. (2002). Data assimilation concepts and methods March 1999. Meteorological training course lecture series. ECMWF 718, 59.
Brewster, K., Hu, M., Xue, M., and Gao, J. (2005). “Efficient assimilation of radar data at high resolution for short-range numerical weather prediction,” in World Weather Research Program Symposium on Nowcasting and Very Short-range Forecasting.
Brousseau, P., Berre, L., Bouttier, F., and Desroziers, G. (2011). Background-error covariances for a convective-scale data-assimilation system: AROME–France 3D-var. Q.J.R. Meteorol. Soc. 137, 409–422. doi:10.1002/qj.750
Buehner, M. (2010). Error statistics in data assimilation: Estimation and modelling. Data assimilation. Berlin, Heidelberg: Springer, 93–112.
Chou, M. D., and Suarez, M. J. (1999). A solar radiation parameterization for atmospheric studies. Available at: https://ntrs.nasa.gov/citations/19990060930.
Descombes, G., Auligné, T., Vandenberghe, F., Barker, D. M., and Barré, J. (2015). Generalized background error covariance matrix model (GEN_BE v2.0). Geosci. Model Dev. 8, 669–696. doi:10.5194/gmd-8-669-2015
Dong, Q., Wang, X. L., Fan, S. Y., Li, Y. H., Qiu, X. B., and Liu, L. L. (2022). Comparison of two kinds of momentum control variables in 3DVAR during assimilating low-resolution observations in a convective-scale model: A case study of torrential rainfall in north China. J. Atmos. Sci. 58, 697–713. doi:10.1007/s13143-022-00290-5
Ek, M. B., Mitchell, K. E., Lin, Y., Rogers, E., Grunmann, P., Koren, V., et al. (2003). Implementation of Noah land surface model advances in the National Centers for Environmental Prediction operational mesoscale Eta model. J. Geophys. Res. Atoms. 108. doi:10.1029/2002JD003296
Eyre, J. R., Bell, W., Cotton, J., English, S. J., Forsythe, M., Healy, S. B., et al. (2022). Assimilation of satellite data in numerical weather prediction. Part II: Recent years. Q.J.R. Meteorol. Soc. 148, 521–556. doi:10.1002/qj.4228
Fisher, M. (2003). “Background error covariance modelling,” in Seminar on recent development in data assimilation for atmosphere and ocean, 45–63.
Gan, R. H., Yang, Y., Qiu, X. B., Wang, R. C., Qiu, X. X., and Zhu, L. J. (2021). Assimilation of the maximum vertical velocity converted from total lightning data through the EnSRF method. J. Geophys. Res. Atoms. 126. doi:10.1029/2020JD034300
Gao, J. D., and Stensrud, D. J. (2012). Assimilation of reflectivity data in a convective-scale, cycled 3DVAR framework with hydrometeor classification. J. Atmos. Sci. 69, 1054–1065. doi:10.1175/JAS-D-11-0162.1
Gao, J. D., Xue, M., Shapiro, A., and Droegemeier, K. K. (1999). A variational method for the analysis of three-dimensional wind fields from two Doppler radars. Mon. Weather Rev. 127, 2128–2142. doi:10.1175/1520-0493(1999)127<2128:AVMFTA>2.0.CO;2
Goines, D. C., and Kennedy, A. D. (2018). Precipitation from a multiyear database of convection-allowing WRF simulations. J. Geophys. Res. Atoms. 123, 2424–2453. doi:10.1002/2016JD026068
Hong, S. Y., and Lim, J. O. J. (2006). The WRF single-moment 6-class microphysics scheme (WSM6). J. Korean Meteor. Soc. 42, 129–151.
Hong, S. Y., Noh, Y., and Dudhia, J. (2006). A new vertical diffusion package with an explicit treatment of entrainment processes. Mon. Weather Rev. 134, 2318–2341. doi:10.1175/MWR3199.1
Ide, K., Courtier, P., Ghil, M., and Lorenc, A. C. (1997). Unified notation for data assimilation: Operational, sequential and variational (gtSpecial IssueltData assimilation in meteology and oceanography: Theory and practice). J. Meteorol. Soc. Jpn. Ser. II 75, 181–189. doi:10.2151/jmsj1965.75.1B_181
Johnson, A., Wang, X. G., Carley, J. R., Wicker, L. J., and Karstens, C. (2015). A comparison of multiscale GSI-based EnKF and 3DVar data assimilation using radar and conventional observations for midlatitude convective-scale precipitation forecasts. Mon. Weather Rev. 143, 3087–3108. doi:10.1175/MWR-D-14-00345.1
Kessinger, , Ellis, S., Vanandel, J., and Yee, J. (2003). “The AP clutter mitigation scheme for the WSR-88D,” in 31st Conference on Radar Meteorology, 526–529.
Li, X., Zeng, M. J., Wang, Y., Wang, W. L., Wu, H. Y., and Mei, H. X. (2016). Evaluation of two momentum control variable schemes and their impact on the variational assimilation of radarwind data: Case study of a squall line. Adv. Atmos. Sci. 33, 1143–1157. doi:10.1007/s00376-016-5255-3
Li, Y. Z., Wang, X. G., and Xue, M. (2012). Assimilation of radar radial velocity data with the WRF hybrid ensemble–3DVAR system for the prediction of hurricane ike (2008). Mon. Weather Rev. 140, 3507–3524. doi:10.1175/MWR-D-12-00043.1
Lin, E. L., Yang, Y., Qiu, X. B., Xie, Q., Gan, R. H., Zhang, B., et al. (2021). Impacts of the radar data assimilation frequency and large-scale constraint on the short-term precipitation forecast of a severe convection case. Atmos. Res. 257, 105590. doi:10.1016/j.atmosres.2021.105590
Liu, S., Xue, M., Gao, J. D., and Parrish, D. (2005). “Analysis and impact of super-obbed Doppler radial velocity in the NCEP grid-point statistical interpolation (GSI) analysis system,” in Proceedings of the 17th Conference on Numerical Weather Prediction (Washington, DC: American Meteorological Society).
Mlawer, E. J., Taubman, S. J., Brown, P. D., Iacono, M. J., and Clough, S. A. (1997). Radiative transfer for inhomogeneous atmospheres: RRTM, a validated correlated-k model for the longwave. J. Geophys. Res. Atoms. 102, 16663–16682. doi:10.1029/97JD00237
Parrish, D. F., and Derber, J. C. (1992). The national meteorological center’s spectral statistical-interpolation analysis system. Mon. Weather Rev. 120, 1747–1763. doi:10.1175/1520-0493(1992)120<1747:TNMCSS>2.0.CO;2
Shen, F. F., Xu, D. M., and Min, J. Z. (2019). Effect of momentum control variables on assimilating radar observations for the analysis and forecast for Typhoon Chanthu (2010). Atmos. Res. 230, 104622. doi:10.1016/j.atmosres.2019.104622
Stanesic, A., Horvath, K., and Keresturi, E. (2019). Comparison of NMC and ensemble-based climatological background-error covariances in an operational limited-area data assimilation system. Atmosphere 10, 570. doi:10.3390/atmos10100570
Steiner, M., and Smith, J. A. (2002). Use of three-dimensional reflectivity structure for automated detection and removal of nonprecipitating echoes in radar data. J. Atmos. Ocean. Technol. 19, 673–686. doi:10.1175/1520-0426(2002)019<0673:UOTDRS>2.0.CO;2
Sun, J. Z. (2005). Convective-scale assimilation of radar data: Progress and challenges. Q.J.R. Meteorol. Soc. 131, 3439–3463. doi:10.1256/qj.05.149
Sun, J. Z., Wang, H. L., Tong, W. X., Zhang, Y., Lin, C. Y., and Xu, D. M. (2016). Comparison of the impacts of momentum control variables on high-resolution variational data assimilation and precipitation forecasting. Mon. Weather Rev. 144, 149–169. doi:10.1175/MWR-D-14-00205.1
Thiruvengadam, P., Indu, J., and Ghosh, S. (2019). Assimilation of Doppler Weather Radar data with a regional WRF-3DVAR system: Impact of control variables on forecasts of a heavy rainfall case. Adv. Water Resour. 126, 24–39. doi:10.1016/j.advwatres.2019.02.004
Thiruvengadam, P., Indu, J., and Ghosh, S. (2020). Improving convective precipitation forecasts using ensemble-based background error covariance in 3DVAR radar assimilation system. Earth Space Sci. 7, e2019EA000667. doi:10.1029/2019EA000667
Tong, W., Li, G., Sun, J., Tang, X., and Zhang, Y. (2016). Design strategies of an hourly update 3DVAR data assimilation system for improved convective forecasting. Weather Forecast 31, 1673–1695. doi:10.1175/waf-d-16-0041.1
Wang, C., Chen, Y., Chen, M., and Shen, J. (2020). Data assimilation of a dense wind profiler network and its impact on convective forecasting. Atmos. Res. 238, 104880. doi:10.1016/j.atmosres.2020.104880
Wang, H. L., Sun, J. Z., Fan, S. Y., and Huang, X. Y. (2013). Indirect assimilation of radar reflectivity with WRF 3D-var and its impact on prediction of four summertime convective events. J. Appl. Meteor. Climatol. 52, 889–902. doi:10.1175/JAMC-D-12-0120.1
Wu, W. S., Purser, R. J., and Parrish, D. F. (2002). Three-dimensional variational analysis with spatially inhomogeneous covariances. Mon. Weather Rev. 130, 2905–2916. doi:10.1175/1520-0493(2002)130<2905:TDVAWS>2.0.CO;2
Xiao, Q. N., Kuo, Y. H., Sun, J. Z., Lee, W. C., Lim, E., Guo, Y. R., et al. (2005). Assimilation of Doppler radar observations with a regional 3DVAR system: Impact of Doppler velocities on forecasts of a heavy rainfall case. J. Appl. Meteor. Climatol. 44, 768–788. doi:10.1175/JAM2248.1
Xiao, Q., and Sun, J. (2007). Multiple-radar data assimilation and short-range quantitative precipitation forecasting of a squall line observed during IHOP_2002. Mon. Weather Rev. 135, 3381–3404. doi:10.1175/mwr3471.1
Xie, Y. F., and MacDonald, A. E. (2012). Selection of momentum variables for a three-dimensional variational analysis. Pure Appl. Geophys. 169, 335–351. doi:10.1007/s00024-011-0374-3
Xu, Q. (2019). On the choice of momentum control variables and covariance modeling for mesoscale data assimilation. J. Atmos. Sci. 76, 89–111. doi:10.1175/JAS-D-18-0093.1
Keywords: radar data assimilation, 3DVAR, background error covariance, momentum control variables, dispersive convection
Citation: Song W, Lin E, Qiu X and Xue Y (2023) Comparison of different momentum control variables on assimilating radar observations for the forecasts of a dispersive convective event. Front. Earth Sci. 11:1148921. doi: 10.3389/feart.2023.1148921
Received: 20 January 2023; Accepted: 21 March 2023;
Published: 06 April 2023.
Edited by:
Feifei Shen, Nanjing University of Information Science and Technology, ChinaReviewed by:
Jincheng Wang, CMA Earth System Modelling Center, ChinaXueXing Qiu, Anhui Provincial Meteorological Bureau, China
Copyright © 2023 Song, Lin, Qiu and Xue. This is an open-access article distributed under the terms of the Creative Commons Attribution License (CC BY). The use, distribution or reproduction in other forums is permitted, provided the original author(s) and the copyright owner(s) are credited and that the original publication in this journal is cited, in accordance with accepted academic practice. No use, distribution or reproduction is permitted which does not comply with these terms.
*Correspondence: Erliang Lin, bGluZXJsaWFuZ0Bmb3htYWlsLmNvbQ==; Xiaobin Qiu, UWl1WGlhb0Jpbi5USkBvdXRsb29rLmNvbQ==
 Wei Song
 Erliang Lin
 Xiaobin Qiu
 Yuting Xue6