 Yifei Hou1,2
 Min Zhang3
 Kuang He3,4
 Zhongshan Shen1
 Liang Dong1,2
 Yunchang Fan2,3
 Kaixian Qi1,2
 Shuangchi Liu1
 Shuhui Cai1,2*
 Huafeng Qin1
- 1State Key Laboratory of Lithospheric Evolution, Institute of Geology and Geophysics, Chinese Academy of Sciences, Beijing, China
- 2College of Earth and Planetary Sciences, University of Chinese Academy of Sciences, Beijing, China
- 3Key Laboratory of Earth and Planetary Physics, Institute of Geology and Geophysics, Chinese Academy of Sciences, Beijing, China
- 4Frontiers Science Center for Deep Ocean Multispheres and Earth System, Key Lab of Submarine Geosciences and Prospecting Techniques, MOE and College of Marine Geosciences, Ocean University of China, Qingdao, China
Standard-size samples are usually used for traditional paleomagnetic studies. In some cases, small irregular samples are employed considering their amount and magnetic strength as well as experiment efficiency. With the development of deep space exploration, the demand for studying small and magnetic weak samples is increasing. In this study, we established a magnetic measurement technique for small rare samples. We designed low-background, sample-nondestructive and high-flexibility holders with various materials for different measurements of small samples. With the customized holders, we estimated uncertainty and reliability of magnetic measurements of small specimens from a terrestrial basalt. The results indicate that susceptibility and remanence of small specimens (e.g., 2-mm cubes) are more affected by measurement position than larger specimens (≥5 mm), which reminds us to pay special attention to consistency of the small specimen position during series of measurements. Moreover, susceptibility and remanence of small sister specimens (2-mm and 5-mm cubes) are more scattered than those of large ones (cube length ≥1 cm), mainly due to inhomogeneity of magnetic mineral abundance in the sample. Nevertheless, the average magnetic results of different-size specimens are generally consistent within error, indicating the inhomogeneity of small specimens can be averaged out and demonstrating the reliability of small samples during magnetic measurements. Finally, we tested our measurement system with a lunar meteorite, which mimics the Chang’e-5 returned samples in both size and mineralogy. The main minerals of the meteorite are plagioclase, pyroxene, troilite and kamacite. The isothermal remanent magnetization normalized paleointensity method recovered the expected laboratory field while the anhysteretic remanent magnetization corrected paleointensities are about 2-3 times the expected field, where the latter can be explained by inapplicability of the empirical f′ to the meteorite specimens. The anhysteretic remanent magnetization and IRM paleointensity calibration factor f′ and a of the lunar meteorite were calculated to be 3.89 and 3138 μT, respectively, which provides new constraints for the empirical values. The magnetic results of the lunar meteorite demonstrate the utility of our measurement system for small weak samples. This study provides technical support for paleomagnetic study of the Chang’e-5 and other extraterrestrial samples in the future.
1 Introduction
Standard-size specimens, typically cylinders of 1-inch diameter and 2.2-cm height and 2-cm cubes, have been widely used in paleomagnetic studies for decades. With the improvement of sensitivity of the magnetometers, measurements of smaller samples become practicable. A few studies have estimated validity of magnetic measurements of smaller samples compared to standard samples. For example, Borradaile et al. (2006) proved using smaller cores (5.1 cm3) with cubic adapters can increase the orientation precision during measurements. Böhnel et al. (2009) compared directions of characteristic remanence (ChRM) recovered from small (12-mm diameter and 10-mm length) and standard-size cylindrical samples and found their site-mean directions are indistinguishable. Small irregular specimens are necessary and have their advantages in many cases. For example, extraterrestrial samples such as meteorites and returned samples from space exploration missions, especially the latter, are so precious that available materials for a paleomagnetic study are usually quite limited. Tremendous efforts have been made to obtain magnetic information from small extraterrestrial samples (e.g., Nagata et al., 1970; Fuller, 1972; Runcorn, 1975; Cisowski et al., 1977; Collinson, 1979; Weiss et al., 2009; Weiss and Tikoo, 2014; Mighani et al., 2020; Tarduno et al., 2021). Some archeological materials are also not accessible easily and usually in irregular shapes (e.g., potteries), which hinders us from cutting them into standard-size specimens (Cai et al., 2014). In other cases, using small specimens allows us to select the fresh and ideal parts of the sample, which can promote success of the experiment, e.g., recovering paleointensity with volcanic chips (Pick and Tauxe, 1993) and single-crystal minerals (Tarduno et al., 2006). Furthermore, using small specimens can raise experimental efficiency given certain capacity of some equipment, e.g., the thermal ovens. With the development of deep space explorations, the demand for studying small and magnetic weak samples is increasing. For example, the Chang’e-5 returned samples are mainly regolith fines (mean particle size ∼50 μm) with limited millimeter-scale rock chips (Li et al., 2022). Besides high-precision equipment, clean holders and proper techniques to fix the small irregular samples are essential during measurements. The most common methods used for small irregular samples in previous studies are fixing them in glass tubes (Tauxe and Love, 2003; Tauxe and Staudigel, 2004) or mounting them on quartz rounds (Shea et al., 2012; Wang et al., 2017) or quartz tubes (Tarduno et al., 2002; Tarduno et al., 2015) with certain kind of non-magnetic glue or cement. These methods can satisfy the requirement of low measurement background, but are not applicable to some rare samples, e.g., the rare millimeter-scale rock chips from the Chang’e-5 returned samples, when they need to be reused for other measurements after paleomagnetic study since sample may break when dug out of the stuff and the glue or cement may chemically contaminate the sample. In this study, we designed low-background holders with various materials for different measurements of the small weak samples, which can fix the irregular rare samples non-destructively with flexible shapes to be designed arbitrarily according to the sample size. And then, with these customized holders, we estimated the reliability and possible uncertainties during magnetic measurements for small samples with various-size specimens from a terrestrial basalt. Finally, we tested our measurement system and methods with small lunar meteorite samples. This study serves as a pre-study and provides technical support for the paleomagnetic investigation of the Chang’e-5 returned sample and other extraterrestrial samples in the future.
2 Materials and equipment
2.1 Sample preparation
2.1.1 Terrestrial basalt
A piece of Cenozoic basalt from the Changbaishan area in China was cut into four different sizes (2 mm, 5 mm, 1 cm, and 2 cm cubes) using a diamond wire saw with water cooling. Then, these specimens were used to test the reliability and uncertainty of magnetic measurements for small weak samples (Figure 1A). Some of them were relatively oriented for directional consistency test.
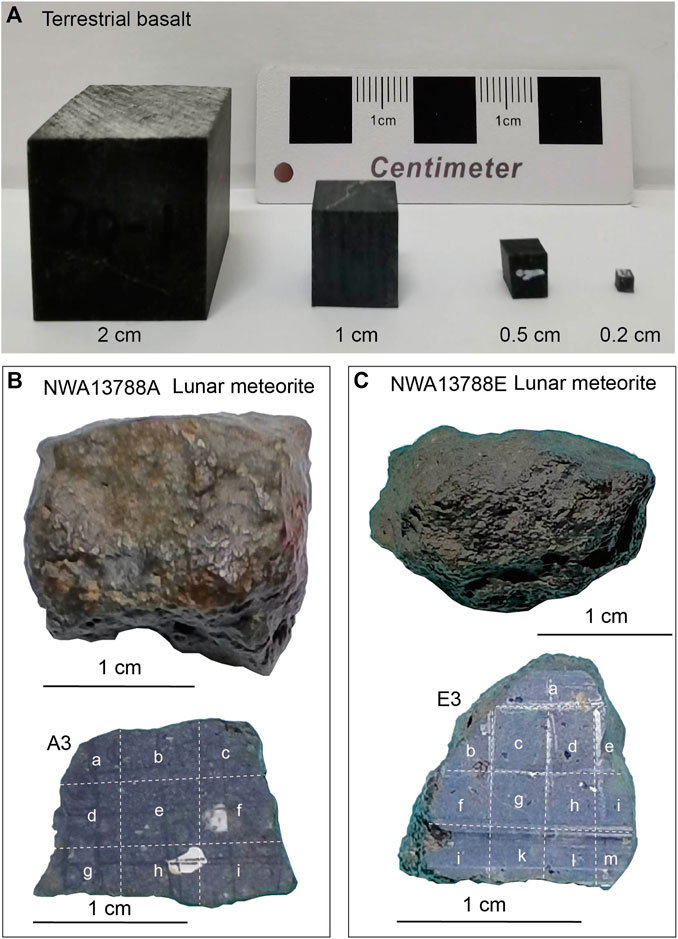
FIGURE 1. (A) Four different sizes of basalt samples. From left to right, the side length is 2 cm, 1 cm, 5 mm and 2 mm, respectively. (B) and (C) Photos of the lunar meteorite NWA13788 and the representative slice with positions of sister specimens.
2.1.2 Lunar meteorite
The lunar meteorite NWA13788 was bought from a dealer, which was discovered in Algeria, Northwest Africa and classified as lunar melt breccia. It includes a few small pieces, where two of them (NWA13788A and NWA13788E) were used in this study (Figures 1B, C). Each piece was sliced into different layers and named as 1, 2, 3, and so on. Each layer was further cut into small pieces and named as a, b, c, and so on. We treated all the small pieces from different layers of a big piece as sister specimens in this study.
2.2 Equipment
The equipment used in this study include 3D printer, high-precision superconducting magnetometers, rock magnetic devices and microscopic analysis instruments. A Formlabs 3+ 3D printer and Formlabs photopolymer resin were used to print the customized resin holders. A 2G RAPID magnetometer (with precision of 10−12 Am2) was equipped with a direct-current power supply and an alternating-field demagnetizer. The system was used for remanence measurements, anhysteretic remanent magnetization (ARM) imparting and AF demagnetization. A Eusci pulse magnetizer (MC-1) was used for imparting isothermal remanent magnetization (IRM). An Agico Multifunction Kappabridges susceptibility meter (MFK1-FA) was used for magnetic susceptibility and anisotropy of magnetic susceptibility (AMS) measurements. A Princeton Measurements Corporation MicroMag 3900 vibrating sample magnetometer (VSM) was used for measurements of hysteresis loop, IRM acquisition and back-field demagnetization curve and first-order reversal curve (FORC). A Quantum Design magnetic properties measurement system (MPMS XL-5) was used for low-temperature magnetic measurements. A Magnetic Measurements variable field translation balance (VFTB) was used for the temperature dependence of induced magnetization (M-T). A Magnetic Measurements thermal demagnetizer super cooled (MMTDSC) oven was used for paleointensity experiment. Microscopic analysis was carried out using the Thermo Fisher Scientific Apreo S LoVac scanning electron microscope (SEM) with a backscattered electron (BSE) detector and a Bruker QUANTAX energy dispersive X-ray spectrometer (EDXS) with an XFlash 6–60 silicon drift detector.
All the magnetic measurements were carried out at the Paleomagnetism and Geochronology Laboratory (PGL) while the microscopic analysis was conducted at the Electron Microscope Laboratory in the Institute of Geology and Geophysics, Chinese Academy of Sciences. Remanence measurements were conducted in the shielding room (<300 nT) at PGL.
3 Methods
3.1 Customized holders for small weak samples
For magnetic measurement of small weak samples, we need not only high-precision instruments but also clean holders with very low background magnetic moments to reduce magnetic contaminations to the sample signals as much as possible. Non-destructive fixing techniques are also required for some special samples. In this study, we designed holders with different materials and shapes for various magnetic measurements.
3.1.1 Quartz holders for remanence measurements
Quartz materials were selected for manufacturing holders for remanence measurements because they have high purity and can withstand high temperature over 1,000°C. We designed quartz cylinders with an external dimension of 2 cm in diameter and 1.3 cm in length (Figure 2A). It includes two parts, a lid and a body, which can be screwed together. A cylindrical hole was machined in the body center, whose size can vary according to specimen size. A size of 1-cm diameter and 1-cm length was used in this study. Small specimens can be fixed in the hole with clean medical sterile cotton for room-temperature or quartz wool for high-temperature experiments. The quartz wool is comprised of silica and quartz fiber, which can survive high temperatures over 1,000°C. Remanence of the cotton and quartz wool will be measured and those with low values (10−9 Am2) will be selected for the experiments. The lid can be screwed tightly to the body to fasten the contents inside. For quartz cylinders to be heated in the oven, a 3-mm diameter hole was punched in the center of the lid and body to keep the air flowing during the experiments. This design will keep the sample inside the holder and protect it from exposure contamination and accident fall. The natural remanent magnetization (NRM), ARM and IRM were measured for representative quartz holders to estimate their remanence background. All tested quartz cylinders were filled with cotton to include all the possible contributions to the background noise. The ARM was imparted under a direct current (DC) field of 50 μT in a peak alternating field (AF) of 150 mT. The IRM was imparted in a field of 1 T. The background magnetic moment of the 2G RAPID magnetometer was kept under ×310−12 Am2 during measurements. NRMs of the tested quartz cylinders are at the order of 10−12 Am2, ARMs at 10−11 Am2 and IRMs lower than 2×10⁻⁹ Am2 (Figure 2B), which are generally orders of magnitude lower than corresponding intensities of the samples.
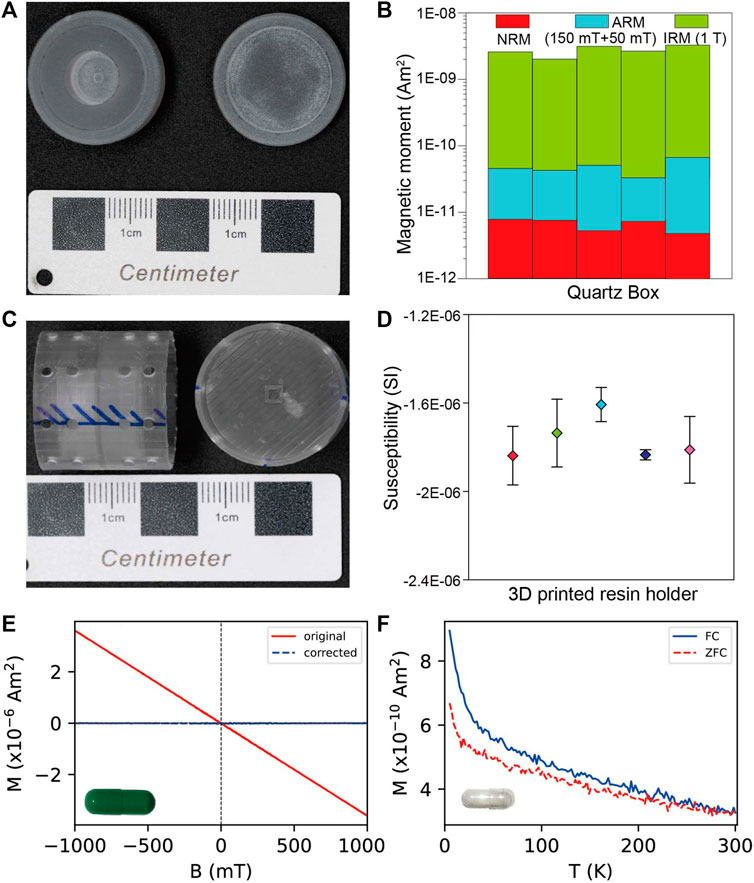
FIGURE 2. (A) Picture of the customized quartz box. (B) The intensity of NRM, ARM and IRM of representative quartz boxes. (C) Picture of 3D printed resin cylinder. (D) Mean magnetic susceptibility of representative 3D printed resin boxes and its standard deviation. (E) Representative hysteresis loop of a capsule for Micromag 3900 VSM. (F) Representative in-field and zero-field magnetization curves of a low-temperature capsule for MPMS.
3.1.2 3D-printed resin holders for susceptibility measurements
For the measurements of susceptibility and AMS, we designed hollow cylinder with an external dimension of 2.5-cm diameter and 2-cm length (about the size of a standard sample) with a wall thickness of 1 mm and printed it on the 3D printer using Formlabs photopolymer resin materials (Figure 2C). A cubic box is embedded on the center plane of the cylinder, whose size can vary, e.g., 3-mm, 5-mm and 10-mm side length, according to the sample size. The thickness of the cubic box and center plane is limited to 1 mm. This design ensures the sample can be set in the center of the cylinder holder. Circular holes are designed on the cylinder side to reduce the resin material used, and thus decrease the background susceptibility of the holder. Each holder was measured three times considering errors caused by instrument noise. The average susceptibilities and standard deviations are shown in Figure 2D. The magnetic susceptibilities of these resin holders are between −1.6 and −2×10⁻⁶ SI, at the level of the instrument background. We compared susceptibility backgrounds of holders made of different materials including quartz, ceramic and resin. Their mass-normalized susceptibilities are about the same level, e.g., quartz ∼−4×10⁻⁹ m3/kg, ceramic ∼−5×10⁻⁹ m3/kg and resin ∼−8×10⁻⁹ m3/kg. However, the advantage of the 3D-printed resin holder is that we can design the shape and size of the holder flexibly according to the sample size and reduce the amount of material as much as possible, which can decrease the bulk susceptibility of the holder significantly. The bulk susceptibilities of the quartz, ceramic and our 3D-printed resin holders are ∼−10×10−6, ∼−5×10⁻⁶ and ∼−2×10⁻⁶ SI, indicating the 3D-printed resin holder is advantageous to susceptibility and AMS measurements.
3.1.3 Plastic capsules for hysteresis and low-temperature measurements
Non-magnetic plastic capsules are used as holders for measurements of hysteresis loop, IRM acquisition and back-field demagnetization curve and FORC (Figure 2E). The representative hysteresis loop of the capsule demonstrates the material is diamagnetism with very low magnetization (10−9 Am2) after paramagnetic correction. The reason we choose the plastic capsules is their background magnetic moments are indistinguishable from those of the ceramic or quartz holders about the same size, but the plastic ones are much lighter and can fit the irregular chips better because of their plasticity.
The capsules used for low-temperature magnetic measurements are required to be non-magnetic and low-temperature resistible. The in-field and zero-field cooling curves (FC and ZFC) of our representative capsule indicate its magnetization is at the order of 10−10 Am2 (Figure 2F), orders of magnitude lower than magnetic signals of the samples.
3.2 Test the reliability and uncertainty of magnetic measurements for small basalt samples
We carried out a series of tests with various-size specimens (2 mm, 5 mm, 1 cm and 2 cm) from the terrestrial basalt, including effect of equipment noise on magnetic signals, effect of measurement position on small samples and consistency of magnetic measurements among different sizes of samples.
In order to evaluate the effect of measurement positions on the magnetic susceptibility and AMS, we measured the susceptibility and AMS of a 2-mm and 5-mm cube at different positions in the 3D printed holder in the designed measurement region of the MFK1-FA system. A frequency of 967 Hz and an applied field of 200 A/m were adopted. Multiple positions are measured for the 2-mm cube (Figure 3A). The interval of positions on the three orthogonal lines (FB [Front Back], LR [Left Right], and UD [Up Down])) is 2 mm. On the central plane of cylinder, the four corner positions, about 11 mm away from the center (LB, LF, RF and RB), were also measured. For the 5-mm cube, only 7 positions, including one center and 6 end points (6 mm from the center) of the three orthogonal lines (L, R, F, B, U, D), were measured since there is not enough space in the holder (Figure 3B). We measured three times at each position to estimate the instrumental noise. A similar test was conducted on the AMS measurements of 2-mm and 5-mm cubes. Each specimen was measured at five positions on the central plane of the cylinder (L, R, B, F and middle as shown in Figure 3B) and measured three times at each position. We further tested the consistency of susceptibilities of different-size cubes, including 2 mm, 5 mm, 1 cm and 2 cm. A few specimens from each size were measured at the middle position and their mean values were compared together.
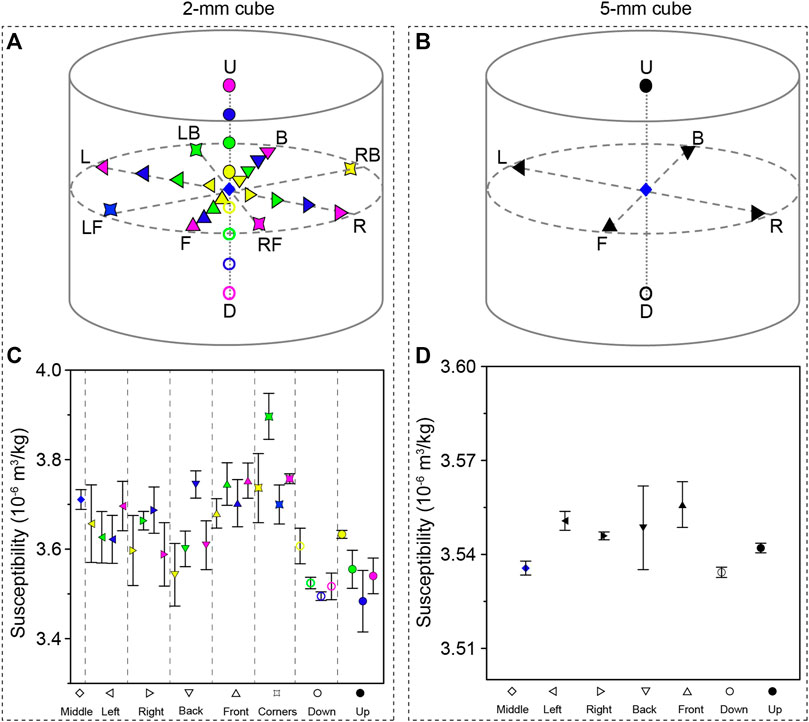
FIGURE 3. (A) Sketch map of measurement position of a 2-mm basalt cube, moving 2,4, 6, 8 mm from middle towards up (U), down (D), left (L), right (R), back (B), and forth (F) respectively. Four corner positions about 11 mm far from the center of left back (LB), left front (LF), right back (RB), and right front (RF) were also measured. (B) Sketch map of measurement position of a 5-mm basalt cube. Each end position of three orthogonal lines is about 6 mm from the center. (C) Mean magnetic susceptibility and its standard deviation at different positions of the 2-mm cube. (D) Mean magnetic susceptibility and its standard deviation at different positions of the 5-mm cube.
NRMs of a 2-mm and 5-mm cube at different positions were measured with the 2G RAPID magnetometer (Figure 4A). Specimens were stuck on the lid of the quartz holder with non-magnetic double-sided tape and measured three times at each position. The five positions on the central plane (L, R, F, B and M) were achieved by moving the specimen on the lid, while vertical positions were realized by controlling position of the sample positioning rod of the magnetometer. On the central plane, the distance between central position and every end point of two orthogonal lines is about 8 mm for the 2-mm cubes and 6 mm for the 5-mm cubes. Meanwhile, the measurement interval for vertical positions is 1 cm. The positions on the central plane and vertical positions U0 and U1 are in the designed measurement region of the magnetometer. Different-size oriented specimens, including 2-mm, 5-mm and 1-cm cubes, were selected for AF demagnetization measurements to test the consistency of their NRMs and directions. The 2-cm standard cubes were not measured because they are too strong and exceed the measurement range of the magnetometer. Before the specimen was fixed in the holder, its marker line was aligned to the directional line of the holder to keep directional consistency. The AF demagnetization steps are 1 mT between 0 and 10 mT, 2 mT from 10 to 30 mT, 5 mT from 30 to 100 mT and 10 mT from 100 to 150 mT.
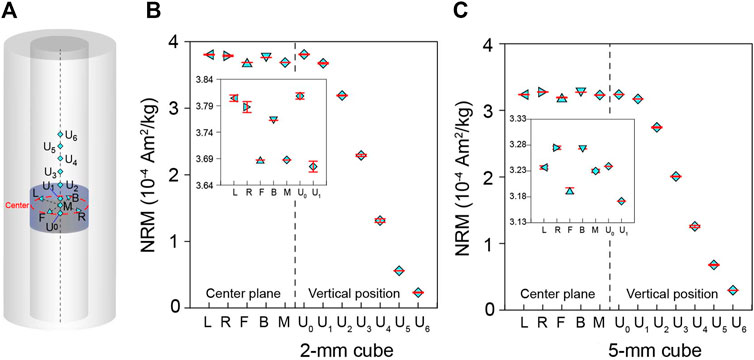
FIGURE 4. (A) Sketch map of NRM measurement position. The distance between central position and every end point of two orthogonal lines is about 8 mm for the 2-mm cubes and about 6 mm for the 5-mm cubes. The measurement interval for vertical positions is 1 cm. Mean NRM of a 2-mm basalt cube (B) and 5-mm basalt cube (C) and its standard deviation at different positions. Inserts in (B) and (C) are amplified results of positions in the designed measurement region of the magnetometer.
3.3 A case study for lunar meteorite samples
The lunar meteorite NWA13788 is supposed to possess similar magnetic carrying minerals to the Chang’e-5 returned samples although they may have different lithologies. Also, we cut it to millimeter pieces to mimic the size of the Chang’e-5 returned samples. We conducted microscopic, rock magnetic and paleointensity experiments on small specimens from the meteorite.
To test ability of the small meteorite specimens to record magnetic field strength, paleointensity studies were carried out on two representative specimens from NWA13788. The small specimens were fixed in the customized high-temperature quartz holders and applied thermal remanent magnetization (TRM) by heating them to 800°C under a laboratory field of 5 or 15 μT. The specimens were heated and cooled in argon environment in the MMTDSC paleointensity oven. The laboratory-induced TRMs in the known magnetic field serve as NRMs of the specimens in the following paleointensity experiment. Thermal paleointensity methods, e.g., the traditional Thellier-Thellier method (Thellier and Thellier, 1959) or its variant “IZZI” method (Tauxe and Staudigel, 2004), are widely used for the terrestrial samples because they can mimic the procedure of NRM acquirement sufficiently during the experiment and thus recover the ancient field most likely once the experiment succeeds. However, one of the main limitations of the thermal paleointensity method is sample may alter when heated, which leads into large uncertainty of the result. Great efforts have been made to reduce thermal alteration when applying the thermal paleointenstiy method to extraterrestrial samples, e.g., controlling the oxygen fugacity (Suavet et al., 2014) or using the CO2 laser heating method instead of the traditional furnace heating method (Tarduno et al., 2021), and some successful results have been reached (Tikoo et al., 2017). Despite all this, the application of thermal paleointensity method on extraterrestrial samples is also limited in some cases since the heating process is destructive and hinders the samples to be used for other measurements. Therefore, the non-thermal paleointensity method is widely used for extraterrestrial samples because it is non-destructive and can avoid the chemical properties of the samples alteration during heating, which normalizes NRM of the sample by ARM or IRM and calculates the paleointensity with the ratios and related calibration factors. In this study, we use the non-thermal paleointensity method, in which ratios of the AF demagnetization spectrum of NRM to those of ARM and IRM are used to calculate the paleointensity of the specimens. The calculation formulas are Banc = (1/f′) × (ΔNRM/ΔARM) × Blab for the ARM-correction method (Stephenson and Collinson, 1974) and Banc = a × (ΔNRM/ΔIRM) for the IRM-correction method (Gattacceca and Rochette, 2004), where Banc is the ancient field intensity producing the NRM (i.e., laboratory field for the TRM here), Blab is the DC bias field for the ARM, and f′ and a are calibration factors. Values of f′ and a rely on magnetic properties of the samples, such as type and domain state of the magnetic minerals, and thus have a large distribution among different kinds of materials (Weiss and Tikoo, 2014). The modern lunar paleointensity studies usually use the empirical values of f′ = 1.34 (Stephenson and Collinson, 1974; Mighani et al., 2020) and a = 3000 μT (Gattacceca and Rochette, 2004; Shea et al., 2012), which were also adopted in this study. It is worth noting that there are some basic assumptions embedded in the application of the non-thermal paleointensity method, including particle size independence, volume concentration independence and a linear field dependence of weak-field remanences (Yu, 2010). If the assumptions are not met, uncertainties will be introduced. Therefore, paleointensity recovered from the ARM and IRM corrected methods with the empirical values of f′ and a are usually believed to have the typical factor of 3-5 systematic errors because of the various of particle size, volume concentration independence, condition of instrument and so on (Yu, 2010; Shea et al., 2012; Tikoo et al., 2014). The ARMs were imparted with a DC bias field of 50 μT and an AF peak field of 150 mT. The IRMs were imparted in a field of 1 T. The AF demagnetization steps for the NRMs, ARMs and IRMs of the specimens are the same as those for the basalt cubes mentioned above.
4 Results
4.1 Results of the terrestrial basalt
4.1.1 Magnetic homogeneity of the basalt
Rock magnetic characteristics of representative 2-mm cubes were measured to test the magnetic homogeneity of the basalt. These specimens show similar shapes of hysteresis loops, IRM acquisition and back-field demagnetization curves as well as FORCs (Supplementary Figure S1). Their coercivities (Bcs) and remanent coercivities (Bcrs) are quite consistent, ∼10 mT and ∼22–24 mT, respectively, while the saturation remanent magnetizations (Mrss) and saturation magnetizations (Mss) have a variation of less than two times. Projections of the hysteresis parameters (Bcr/Bc and Mrs/Ms) are clustered on the Day plot (Dunlop, 2002) (Supplementary Figure S2). All these together indicate the basalt is generally magnetic homogeneous, possibly with varying amounts of magnetic minerals in different regions as indicated by the Mrs and Ms values.
4.1.2 Effect of measurement position on susceptibility and AMS
For the susceptibility and AMS measurements, the empty 3D-printed resin holder was loaded and measured as part of the instrumental holder background before starting to measure a sample so that the value of the customized holder can be subtracted automatically during sample measurements. The mean mass-normalized susceptibility and its standard deviation of each position for the 2-mm and 5-mm cubes are shown in Figures 3C, D. For the 2-mm cube, the maximum standard deviation among all the measurement positions is 2.4% of the mean susceptibility, while the difference between the maximum and minimum mean value at different measurement positions is 10.6% (calculated by the difference between the maximum and minimum mean value divided by the maximum value). It suggests the discrepancy among mean values of different positions is larger than the instrumental noise and thus demonstrates susceptibility of the 2-mm cube is affected by the measurement position. For the 5-mm cube, the maximum standard deviation of all positions is 0.4%, while the difference between the maximum and minimum mean values is 0.6%, which means the discrepancy among mean values of different positions is comparable to the instrumental noise, and thus demonstrates the influence of measurement position on the susceptibility of the 5-mm cube is negligible. The standard deviations of 2-mm cubes are overall larger than those of the 5-mm cubes as expected since smaller specimens have weaker magnetic signals and lower signal-to-noise ratios.
For the 2-mm cube, directions of the three principal axes of the AMS from three repeated measurements at the same position are not entirely consistent (Figure 5A), which is probably because susceptibility of the specimen is very low (∼8×10⁻⁶ SI) and can be affected by the instrument noise. The scatters among repeated measurements at the same position hinder us from estimating the influence of measurement position on the AMS of the 2-mm basalt cube. For the 5-mm cube, both measurement results at the same position and different positions are generally coincident (Figure 5B), suggesting it is hardly affected by either the instrument noise or measurement position. The AMS parameters were calculated and summarized in Supplementary Table S1.
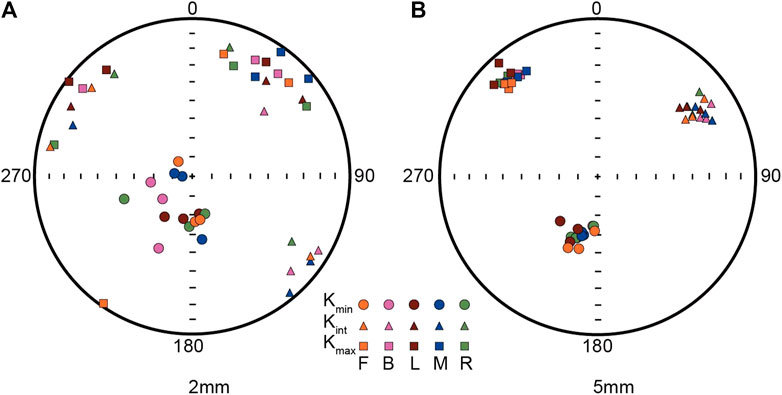
FIGURE 5. Equal-area projections of the three principal axes of AMS results measured at different positions (left, right, back, forth, and middle shown in Figure 3B) for 2-mm (A) and 5-mm (B) cubes. Specimens were measured three times at each position.
4.1.3 Consistency of susceptibility among various-size specimens
The mass-normalized susceptibility of each specimen as well as mean value and its standard deviation of all specimens from each size are shown in Figure 6. Susceptibilities of the 2-mm cubes are much more scattered than the others, with a standard deviation of 11.9%, much larger than the instrumental noise level. It indicates susceptibilities of the 2-mm cubes are distinguishable excluding the influence of instrumental noise, which can be explained by uneven distribution of the amount of the magnetic minerals revealed by the rock magnetic results of the basalt. Standard deviations of 5-mm and 1-cm cubes are 4.7% and 3.8%, also larger than the instrumental noise level, indicating the effect of inhomogeneous distributions of the magnetic minerals on these specimens is observable. The standard deviation of the 2-cm cubes is 0.6%, comparable to the noise level. The mean values of different-size specimens are comparable with a standard deviation of 3.1%, which supports that small and weak samples can average out effects of instrumental noise and magnetic inhomogeneity, and yield similar magnetic susceptibilities to standard-size samples although small samples may have larger scatters.
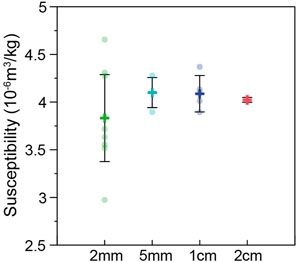
FIGURE 6. Mean magnetic susceptibility of basalts with different sizes and its standard deviation. Every specimen was measured at the center position.
4.1.4 Effect of measurement position on NRM
Maximum standard deviations of NRMs measured at these positions for the 2-mm and 5-mm cubes are 0.3% and 0.2%, respectively, demonstrating excellent stability and low noise level of the equipment (Figures 4B, C). The difference between the maximum and minimum mean NRM of these measurement positions for the 2-mm and 5-mm cubes are 1.5% and 0.9%, respectively, all larger than their maximum standard deviations of repeated measurements at each position. This indicates measurement positions have detectable effects on NRMs of these small specimens, especially the 2-mm cube. Vertical positions U2-U6 are outside the designed measurement region. NRMs measured at these positions for both the 2-mm and 5-mm cube decay with distance from the center as expected (Figures 4B, C).
4.1.5 Consistency of NRM and directions among various-size specimens
NRMs and remanences after 10-mT (NRM_10 mT) and 20-mT (NRM_20 mT) demagnetization of the specimens are shown in Figure 7. Standard deviations of NRMs for the 2-mm, 5-mm and 1-cm cubes are 86.7%, 56.0% and 6.3%, respectively (Figure 7A), which reduce to 45.4%, 17.0% and 4.6% after 10-mT demagnetization (Figure 7B), and to 31.4%, 6.1% and 2.9% after 20-mT demagnetization (Figure 7C). The standard deviations of mean values of different-size cubes for NRM, NRM_10 mT and NRM_20 mT are 18.2%, 4.5% and 6.9%, respectively. The very large scatter of NRMs and NRM_10 mT is probably caused by a combination of inhomogeneous distribution of the magnetic minerals and secondary remanences, e.g., viscous remanent magnetizations (VRMs), acquired by the specimens. After demagnetizing at 20 mT, the secondary components are removed as shown by the demagnetization trajectory of representative specimens in Figures 8A–C, so that the standard deviations of NRM_20 mT reduced significantly. However, the standard deviation of NRM_20 mT for 2-mm cubes is still large, which should mainly be due to inhomogeneous distribution of the magnetic minerals. Although direct comparisons among remanences of different-size specimens are relatively complicated, the 2-mm, 5-mm and 1-cm cubes still yield comparable mean values of NRM_20 mT with a standard deviation of 6.9%.
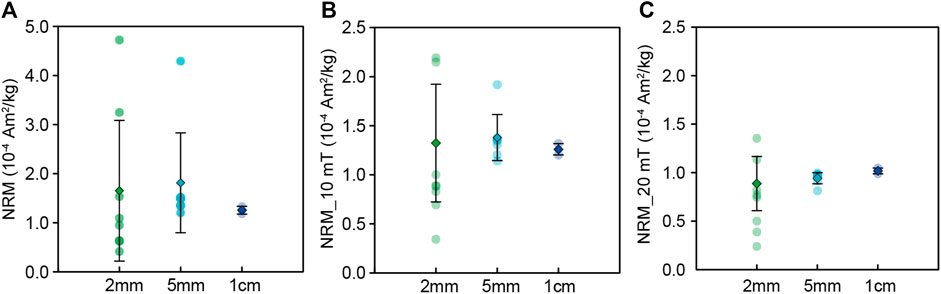
FIGURE 7. Mean NRM of different-size basalts after 0 mT (A), 10 mT (B), 20 mT (C) AF demagnetization and its standard deviation. Every specimen was measured at the middle position of the center plane.
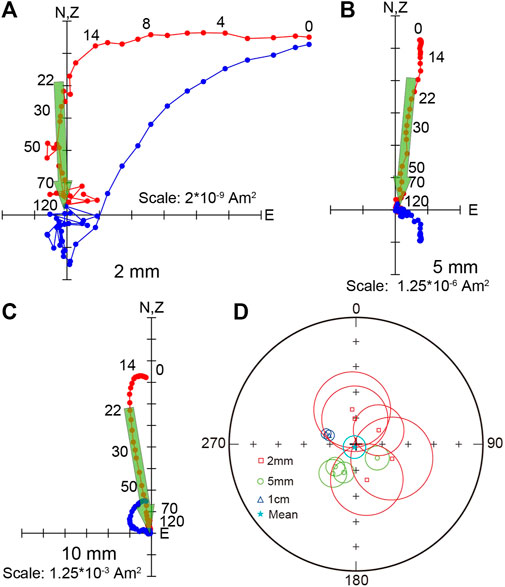
FIGURE 8. Typical orthogonal vector plots of AFD results of (A) 2-mm side length specimen, (B) 5-mm side length specimen and (C) 10-mm side length specimen. Magnetic directions are plotted in core coordinates for representative specimens. Blue/red circles represent vector endpoints projected onto the horizontal/vertical plane. Numbers on the plots show AFD steps in mT. (D) Equal-area projections of the paleomagnetic directions of the characteristic remanent components. Red, green and blue circles around each symbol represent MADs of each specimen. The cyan circle represents α95 of fisher mean of all the specimens.
Representative orthogonal vector projection plots (Zijderveld, 1967) of different-size specimens are shown in Figures 8A–C. At least five consecutive demagnetization points were selected for ChRM direction fitting. The ChRM directions of all the specimens are shown in Figure 8D. All specimens display similar inclinations varying from 75° to 81° while the declinations are scattered varying from 58.3° to 357.2° (Supplementary Table S2). Scatters of directions among different specimens are probably caused by orientation errors while cutting the specimens or the high inclinations of the specimens increasing uncertainty of the declinations. In addition, it is worth noticing that the maximum angular deviations (MADs) of the 2-mm cubes are larger than the 5-mm and 1-cm cubes, which can be attributed to weak signal-to-noise ratio of smaller specimens. When calculating fisher mean of all these specimens, the α95 is not very large (7.2°), indicating all the specimens yield comparable ChRM directions. The information of NRMs and ChRM directions of different-size basalt cubes is summarized in Supplementary Table S2.
4.2 Results of the lunar meteorite
4.2.1 Minerology of the lunar meteorite
Figure 9 displays the BSE images and EDXS results of two representative specimens of NWA13788A3i and NWA13788E4d. Figures 9A, D are the overall images of the specimens, while Figures 9B, C are the magnified images of the areas marked with red squares in Figures 9A, D. The main detected minerals of NWA13788 are plagioclase, pyroxene, troilite and FeNi alloys. The Ni contents in the FeNi alloys are typically between 5% and 10%, indicating they are kamacite (Nagata et al., 1974; Ji and Pan, 2011). The mineral compositions are generally consistent with those of published Apollo samples, except that ilmenite is not abundant in this meteorite (Rochette et al., 2010). Previous magnetic studies of lunar samples indicate pure iron and kamacite are the main magnetic carriers since troilite and ilmenite have no contributions to the remanence due to their antiferromagnetic and paramagnetic characteristics (Rochette et al., 2010). For the meteorite NWA13788, kamacite is the main magnetic carrier based on the SEM results.
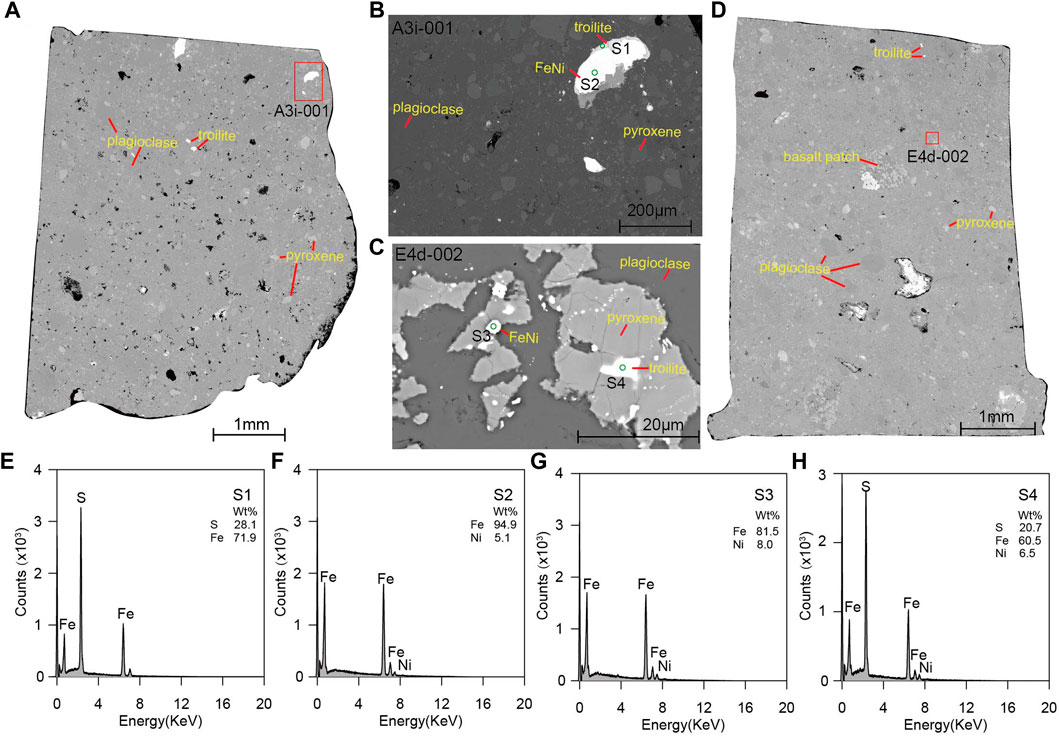
FIGURE 9. (A–D) Representative BSE images of the studied lunar meteorite NWA13788. (E–H) The EDXS results of the studied lunar meteorite NWA13788.
4.2.2 Magnetic properties of the lunar meteorite
Specimens from NWA13788A are inhomogeneous with a wide distribution of susceptibilities, while the susceptibilities of specimens from NWA13788E are less scattered (Figure 10A). Selected specimens were heated to 800°C in argon environment and their susceptibilities were remeasured. The susceptibilities after heating did not change obviously compared to those before heating, suggesting these specimens are relatively thermally stable. AMS results of two representative specimens A3e and E4k2 show good consistency for both repeated measurements at the same position and measurements at different positions (Figures 10B, C). The sizes of A3e and E4k2 are tinny, 4 mm × 2 mm × 2 mm and 5 mm × 1 mm × 1 mm, respectively, but their susceptibilities are strong enough, ∼21 × 10−6 and ∼42 × 10−6 SI, compared to the instrument noise. This suggests that AMS measurements of small specimens are hardly affected by measurement positions as long as their signals are strong enough. The AMS parameters of the two specimens are listed in Supplementary Table S1.
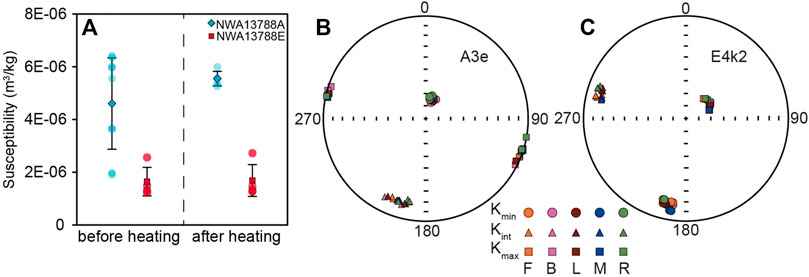
FIGURE 10. (A) Magnetic susceptibilities of specimens from NWA13788A and NWA13788E before and after heating. Mean value and its standard deviation of each sample are shown on the plot. (B) and (C) Equal-area projections of the three principal axes of AMS results of representative specimens from NWA13788. Specimens were measured three times at each position.
The hysteresis loops show that Bcs of the measured specimens are very low (<5 mT) (Figures 11A–D) while the Bcrs varies from 20.47 mT to 61.77 mT (Figures 11E–H). The Mrs and Ms vary significantly, 8.32 × 10⁻⁴−1.48 × 10⁻² Am2/kg and 1.68 × 10⁻¹–1.64 Am2/kg, respectively. The larger variation of specimens from NWA13788A suggest heterogeneity of the specimens, which is consistent with previous susceptibility results. The IRM acquisition curves rise rapidly below 100 mT and nearly saturate at 200 mT, indicating soft magnetic minerals are dominant (Figures 11E–H). FORC diagrams spread widely over 30 mT along the vertical axis (Figures 11I–L) and contours are open and centered around the origin, indicating that the coercivity distribution of main magnetic minerals is relatively narrow and may contain contributions of multi-domain particles. Magnetic signal of E4f is weaker than other specimens as demonstrated by its Mrs, scatter of IRM acquisition and back-field demagnetization curves and FORC diagram. The specimen mass and rock magnetic results of lunar meteorite NWA13788 are listed in Supplementary Table S3.
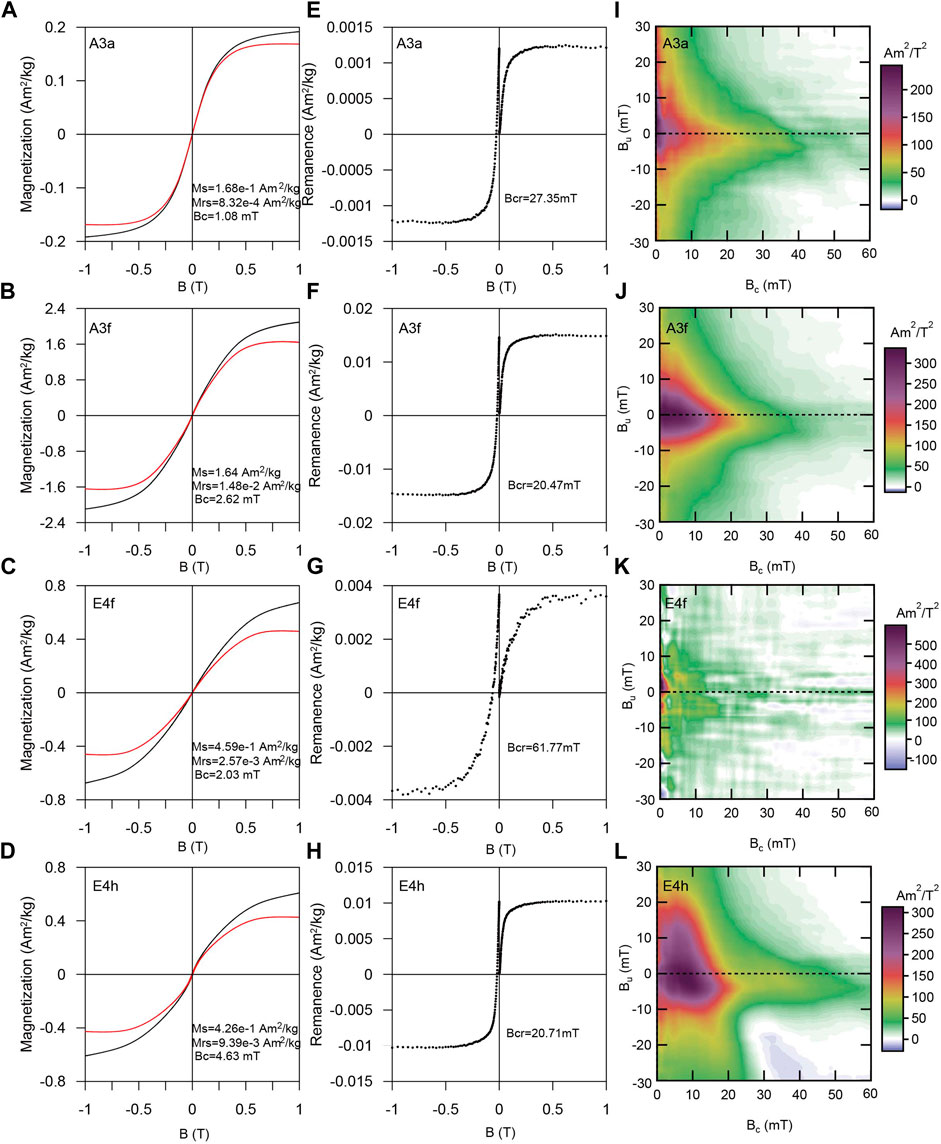
FIGURE 11. (A–D) Representative hysteresis loops of NWA13788. Black and red lines are loops before and after high-field slope correction. (E–H) Isothermal remanent magnetization (IRM) acquisition and back-field demagnetization curves. (I–L) Representative FORC diagrams. Data were processed using the FORCinel software version 3.08 (Harrison and Feinberg, 2008). A smoothing factor of 10 was used for the central area.
For measurements of the M-T of NWA13788, the specimens were heated to 800°C and then cooled to room temperature at a rate of 30°C/min in air condition with an applied field of ∼1 T, and magnetizations were measured during this process. This procedure was repeated once to test the thermal stability of the specimens. Results of two representative specimens from NWA13788A and NWA13788E are shown in Figures 12A, B. The heating curves show an unblocking temperature, i.e., the Curie temperature (Tc) of the magnetic mineral, of ∼710°C, which is lower than the Tc of pure iron (780°C), indicating kamacite should be the dominant magnetic mineral. The heating and cooling curves display irreversible patterns with specimens blocked between ∼580°C and 600°C during cooling. This behavior can be repeated during the second heating-cooling cycle, which indicates it is not due to thermal alteration but caused by phase transformation between the α- and γ-phase of the FeNi alloys. The α-phase FeNi alloys can change their crystallographic structure to γ-phase at a certain high temperature and change back from γ-to α-phase at lower temperatures (Strangway et al., 1970; Ji and Pan, 2012; Mushnikov et al., 2022). The first and second heating-cooling curves are almost coincident, suggesting the main magnetic minerals, at least their induced magnetization at 1 T (regarded as Ms here) are thermally stable.
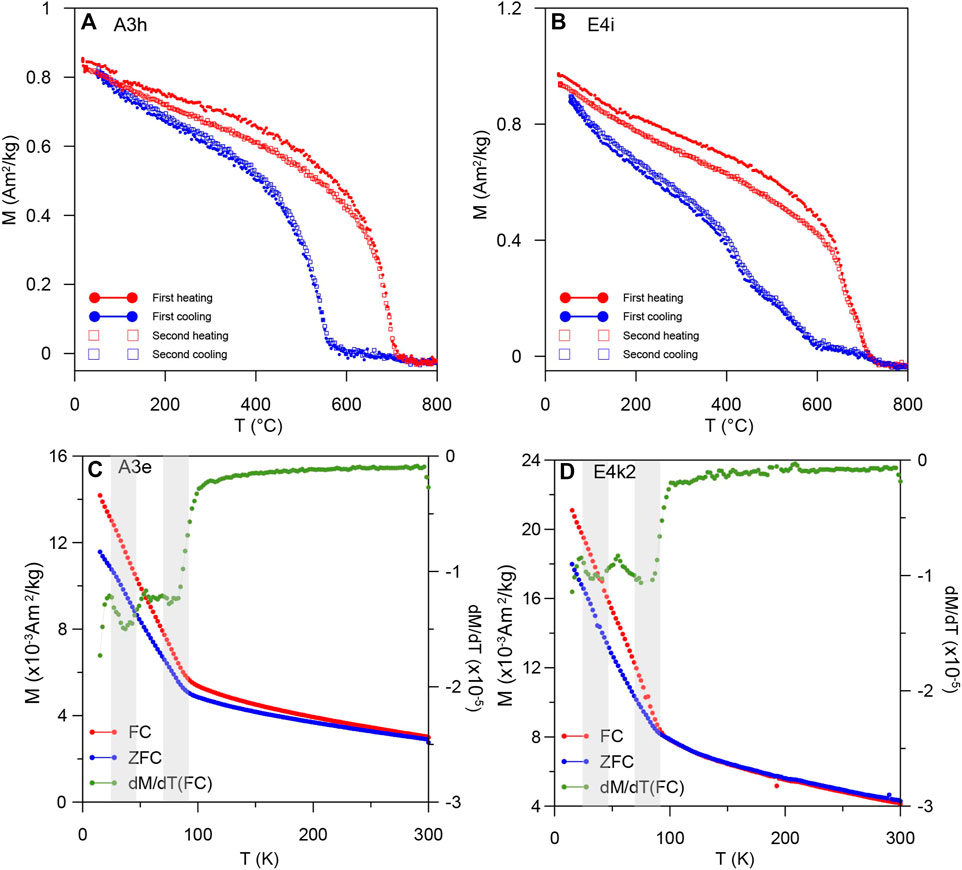
FIGURE 12. (A) and (B) Representative variations of magnetization versus temperature. Specimens are processed in air in an applied field of ∼1 T with heating/cooling rates of 30°C/min. (C) and (D) Low-temperature FC and ZFC curves of representative specimens. Green lines are first-order derivative curves of FC data. Gray areas represent intervals of transition temperatures.
Some low-temperature measurements can help identify magnetic minerals through their transition temperatures, e.g., Verwey transition of magnetite (Verwey, 1939), Morin transition (Morin, 1950) of hematite and Besnus transition of pyrrhotite (Rochette et al., 1990). FC and ZFC curves of representative specimens were measured from 15 K to 300 K with the MPMS to detect possible low-temperature magnetic transitions. An applied field of 2.5 T was used in the experiments. The FC and ZFC curves of two specimens from NWA13788A and NWA13788E show similar variation patterns (Figures 12C, D). An obvious transition occurs at about ∼75 K, close to the magnetic transition temperature ∼60 K of troilite, chromite and daubreelite (Kohout et al., 2007; Cuda et al., 2011; Gattacceca et al., 2011), where the temperature difference is possibly caused by impurity or ion substitution of minerals in the measured specimens. The other transition around 37 K is not obvious in the FC and ZFC curves but can be detected in the first-order derivative curves of FC. Terrestrial magnetic minerals such as pyrrhotite and siderite have low transition or Neél temperatures around 34 K (Kohout et al., 2010) and 37 K (Frederichs et al., 2003), respectively. However, we have not found any lunar magnetic minerals with this transition temperature reported yet. This transition may also be explained by unblocking of superparamagnetic particles in the specimens between 20 and 50 K (Liu et al., 2004).
4.2.3 Paleointensity of the lunar meteorite
The paleointensity results of the specimens NWA13788A3f and NWA13788E4g2 are shown in Figure 13. For the test with a laboratory field of 5 μT (left two columns in Figure 13), the paleointensity values of the two specimens recovered from the ARM-correction method are 11.2 μT and 16.9 μT while those from the IRM-correction method are 4.2 μT and 6.2 μT, respectively. For the test with a laboratory field of 15 μT (right two columns in Figure 13), the paleointensity values recovered from the ARM-correction method are 45.4 μT and 44.6 μT while those from the IRM-correction method are 15.4 μT and 16.4 μT, respectively. In both cases, the IRM-corrected intensities recovered the expected laboratory fields while the ARM-corrected intensities are about 2-3 times the expected fields. The bias in the ARM-correction results is most likely due to inconsistency between the empirical and actual calibration factor of the specimens. Since the calibration factor highly relies on the mineralogy, grain size distribution and magnetic domain structure of the sample (Muxworthy and Williams, 2015; Nagy et al., 2019), it can vary significantly among samples, which leads to failure of the calibration. The actual calibration factor f′ and a of these specimens can be calculated with the recovered paleointensities and the laboratory fields. The f′ values calculated for A3f are 3.00 and 4.05 in the experiment with a laboratory field of 5 μT and 15 μT, while those for E4g2 are 4.52 and 3.99, respectively, with an average of 3.89. The a values calculated for A3f are 2,496 and 3076 μT in the experiment with a laboratory field of 5 μT and 15 μT, while those for E4g2 are 3690 and 3288 μT, respectively, with an average of 3138 μT. The results of paleointensity expeiments in the 5-μT experiment are more scattered but gave comparable results to the 15-μT experiment, indicating the specimens can record weak magnetic field and demonstrating the ability of our measurement system to recover magnetic field intensity from these small specimens. It seems the IRM-corrected method yields much better intensity estimates than the ARM method for the studied meteorite, which is consistent with the results of the previous study of Yu. (2010). However, since conditions could vary a lot among different samples, the most rigorous approach is to employ both methods and cross check the results in actual paleointensity studies.
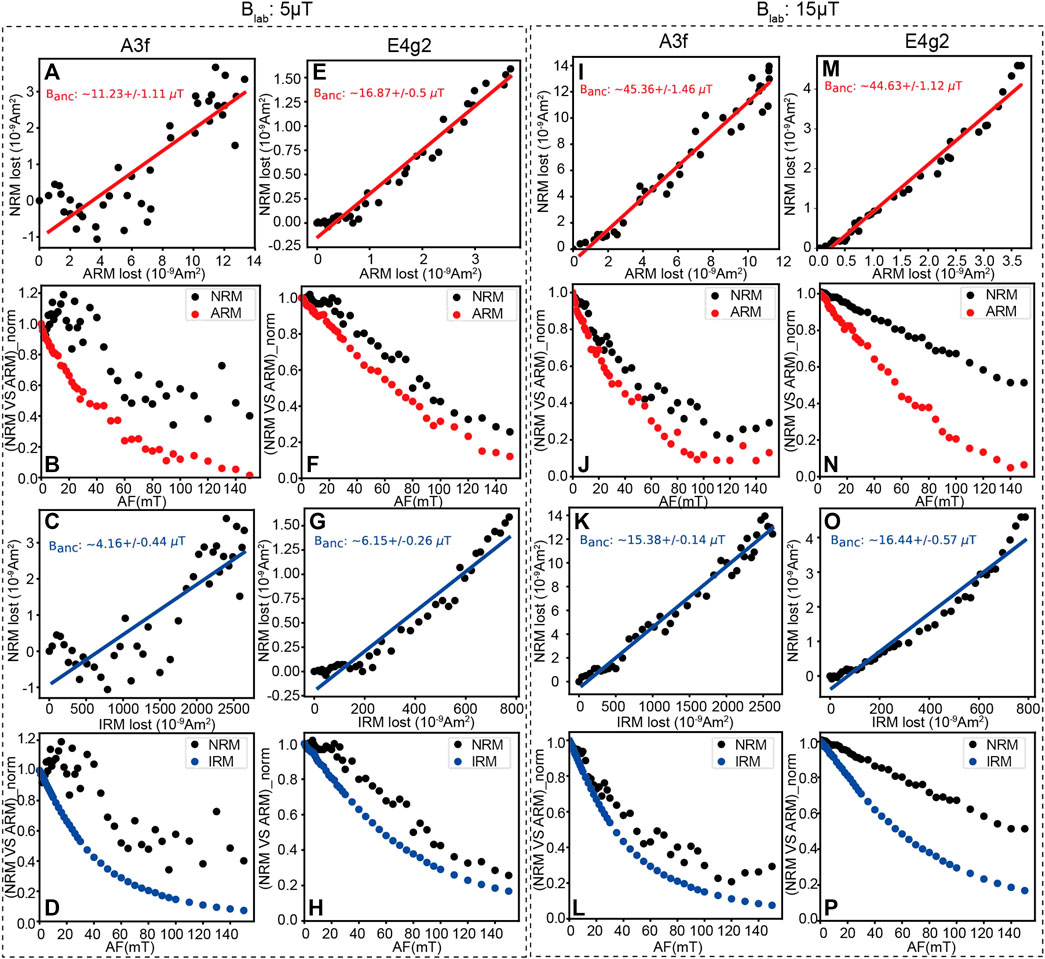
FIGURE 13. Paleointensity results of representative small meteorite specimens from NWA13788A (A–H) and NWA13788E (I–P). Each column shows the ARM-corrected paleointensity (red), the NRM and ARM decay versus AF steps, the IRM-corrected paleointensity (blue), and the NRM and IRM decay versus AF steps of each specimen. The left two columns are results with a lab field of 5 μT and the right two columns are results of the same two specimens but with a lab field of 15 μT.
5 Discussion
Small irregular samples have been used in many paleomagnetic studies, e.g., planetary magnetic and archeomagnetic studies, instead of standard-size samples. In this study, we established a magnetic measurement technique for small rare samples, including designing holders for small rare samples, estimating the reliability and possible uncertainties during magnetic measurements for small samples with terrestrial basalt, and testing our measurement system with small lunar meteorite samples.
The holders were designed with various materials and shapes for different measurements of the rare, small, irregular and weak samples. There are a few advantages of our customized holders. For example, their background magnetic signals are orders of magnitude lower than magnetic signals of the samples. Their sizes and shapes can be designed flexibly according to the sample, making them have wide adaptability. They can fix the sample non-destructively and avoid possible chemical contamination from the glue or cement and physical destruction when being dug out of the stuff, which allows reuse of the rare sample after a non-heating paleomagnetic study. They can keep the sample inside and protect it from exposure contamination and accident fall. They can also keep the sample in the center to avoid influence caused by imprecise measurement position.
The noise level of typical instruments in our lab, e.g., the 2G RAPID magnetometer and MFK1-FA susceptibility meter designed for standard-size samples originally, were evaluated by repeating measurements of a specimen at the same position. The maximum standard deviations of susceptibilities and NRMs for measured 2-mm cubes are 2.4% and 0.3%, respectively, demonstrating the stability of the MFK and RAPID. Taking background magnetic signals of the customized holders and instrument noise together, the precisions of our measurements are 10−12 Am2 for the 2G RAPID magnetometer, ∼−2 × 10⁻⁶ SI for the MFK1-FA susceptibility meter, 10−10 Am2 for the MPMS and 10−9 Am2 for the VSM, which can satisfy the measurement requirement for small weak samples.
Results of the terrestrial basalt samples show that susceptibilities and remanences of small specimens as small as 2-mm cubes are affected by measurement positions, which indicates it is important to keep the specimen position consistent during series of measurements, e.g., in the paleointensity or stepwise demagnetization experiments, to reduce measurement noise. AMS measurement of small specimens, e.g., 2 mm, can be affected evidently by instrument noise if their susceptibilities are too weak. Tests on small meteorite specimens with strong susceptibilities show no noticeable difference among AMS results measured at different positions. The inhomogeneity, mainly uneven distribution of the amount of magnetic minerals in the basalt here, of small specimens (2-mm cubes) can be detected during susceptibility and NRM measurements, which suggests small specimens have higher spatial resolution than standard-size samples. Although data from smaller specimens are more scattered, specimens with various sizes of 2 mm, 5 mm, 1 cm and 2 cm yield comparable mean susceptibilities, NRMs and directions, demonstrating influence factors during magnetic measurements for small specimens can be averaged out and they are generally as reliable as standard-size specimens in recovering magnetic information.
We tested our measurement system and methods with two small specimens from the lunar meteorite NWA13788. The main minerals of NWA13788 are plagioclase, pyroxene, troilite and kamacite according to the microscopic and rock magnetic analyses. Magnetic properties of specimens from the meteorite are inhomogeneous demonstrated by scattered susceptibilities and hysteresis parameters. The samples are relatively thermal stable since susceptibilities before and after heating show limited changes and M-T curves are repeatable in two tests. The IRM-corrected intensities recovered the expected laboratory field, while the ARM corrected intensities are about 2-3 times the expected field, where the latter can be explained by inapplicability of the empirical f′ to the meteorite specimens. Based on the paleointensity experiments, we calculated actual f′ and a values for the lunar meteorite NWA13788 to be 3.89 and 3138 μT on average, which provides new constraints for the empirical values. The paleointensity results of the lunar meteorite demonstrate the reliability of our measurement system to recover magnetic field strength from small weak samples. This research serves as a pre-study and provides technical support for the paleomagnetic studies of the Chang’e-5 returned sample and other extraterrestrial samples in the future.
6 Conclusion
In this study, we established a magnetic measurement technique for small rare samples. We designed holders with various materials and shapes for different measurements of small rare samples, which have low-background magnetic signals and can fix the specimen in the measurement center non-destructively. With these holders, we evaluated the uncertainty and reliability of magnetic measurements for small weak samples. Results of the terrestrial basalt samples show that magnetic signals as susceptibility and remanence of small specimens as small as 2-mm cubes are affected by measurement positions, which reminds us to keep the specimen position consistent during series of measurements. The tested small basalt specimens are inhomogeneous in magnetic minerals distribution, but yield comparable results to standard-size specimens, suggesting the reliability of small specimens in magnetic measurements. The rock magnetic and paleointensity experiments of the lunar meteorite demonstrate the utility of our measurement system in recovering magnetic field information from small weak samples. This study provides technical support for future paleomagnetic studies of the Chang’e-5 returned and other extraterrestrial samples.
Data availability statement
The original contributions presented in the study are included in the article/Supplementary Material, further inquiries can be directed to the corresponding author.
Author contributions
SC designed this work. YH, SC, and HQ prepared the manuscript. YH, MZ, KH, ZS, LD, YF, and KQ conducted the experiments. HQ and SL provides technical support for the equipment.
Funding
This work was supported by the Key Research Program of Chinese Academy of Sciences (ZDBS-SSW-JSC007), the National Natural Science Foundation of China (grants no. 42174088, 42241101, 41974077) and the Institute of Geology and Geophysics, Chinese Academy of Sciences (IGGCAS-202101).
Acknowledgments
The authors thank Lixin Gu, Hongxia Ma, Ruiying Li and Sen Hu for their help in sample preparation and measurements, thank Yongxin Pan and Chenglong Deng for their constructive advice to the design of this work.
Conflict of interest
The authors declare that the research was conducted in the absence of any commercial or financial relationships that could be construed as a potential conflict of interest.
Publisher’s note
All claims expressed in this article are solely those of the authors and do not necessarily represent those of their affiliated organizations, or those of the publisher, the editors and the reviewers. Any product that may be evaluated in this article, or claim that may be made by its manufacturer, is not guaranteed or endorsed by the publisher.
Supplementary material
The Supplementary Material for this article can be found online at: https://www.frontiersin.org/articles/10.3389/feart.2023.1146231/full#supplementary-material
References
Böhnel, H., Michalk, D., Nowaczyk, N., and Naranjo, G. G. (2009). The use of mini-samples in palaeomagnetism. Geophys. J. Int. 179, 35–42. doi:10.1111/j.1365-246x.2009.04260.x
Borradaile, G. J., Almqvist, B. S., and Lucas, K. (2006). Specimen size and improved precision with the Molspin spinner magnetometer. Earth Planet. Sci. Lett. 241, 381–386. doi:10.1016/j.epsl.2005.11.050
Cai, S., Tauxe, L., Deng, C., Pan, Y., Jin, G., Zheng, J., et al. (2014). Geomagnetic intensity variations for the past 8 kyr: New archaeointensity results from Eastern China. Earth Planet. Sci. Lett. 392, 217–229. doi:10.1016/j.epsl.2014.02.030
Cisowski, S. M., Hale, C., and Fuller, M. (1977). On the intensity of ancient lunar fields. Proc. 8th Luar Sci. Conf. 1, 725–750.
Collinson, D. W. (1979). On the possibility of using lunar fines to determine the intensity of the ancient lunar magnetic field. Phys. Earth Planet. Interiors 20, 312–316. doi:10.1016/0031-9201(79)90053-0
Cuda, J., Kohout, T., Tucek, J., Haloda, J., Filip, J., Prucek, R., et al. (2011). Low-temperature magnetic transition in troilite: A simple marker for highly stoichiometric FeS systems. J. Geophys. Res. Solid Earth 116, B11205. doi:10.1029/2011jb008232
Dunlop, D. J. (2002). Theory and application of the Day plot (M<i>rs</i>/M<i>s</i>versusH<i>cr</i>/H<i>c</i>) 1. Theoretical curves and tests using titanomagnetite data. J. Geophys. Res. 107, 2056. doi:10.1029/2001JB000486
Frederichs, T., Von Dobeneck, T., Bleil, U., and Dekkers, M. J. (2003). Towards the identification of siderite, rhodochrosite, and vivianite in sediments by their low-temperature magnetic properties. Phys. Chem. Earth, Parts A/B/C 28, 669–679. doi:10.1016/s1474-7065(03)00121-9
Fuller, M. (1972). The remanent magnetization of lunar soils. Science 178, 154–156. doi:10.1126/science.178.4057.154
Gattacceca, J., Rochette, P., Lagroix, F., Mathé, P. E., and Zanda, B. (2011). Low temperature magnetic transition of chromite in ordinary chondrites. Geophys. Res. Lett. 38, L10203. doi:10.1029/2011gl047173
Gattacceca, J., and Rochette, P. (2004). Toward a robust normalized magnetic paleointensity method applied to meteorites. Earth Planet. Sci. Lett. 227, 377–393. doi:10.1016/j.epsl.2004.09.013
Harrison, R. J., and Feinberg, J. M. (2008). FORCinel: An improved algorithm for calculating first-order reversal curve distributions using locally weighted regression smoothing. Geochem. Geophys. Geosystems 9, Q05016. doi:10.1029/2008gc001987
Ji, X., and Pan, Y. (2011). A review of meteorites magnetism. Prog. Geophys. (in Chinese) 26, 1983–1992.
Ji, X., and Pan, Y. (2012). Magnetic properties of iron-nickel alloys in meteorites: A case study of the jilin chondrite. Chinese Journal of Geophysics (in Chinese) 55, 1973–1979.
Kohout, T., Kosterov, A., Haloda, J., Týcová, P., and Zbořil, R. (2010). Low-temperature magnetic properties of iron-bearing sulfides and their contribution to magnetism of cometary bodies. Icarus 208, 955–962. doi:10.1016/j.icarus.2010.03.021
Kohout, T., Kosterov, A., Jackson, M., Pesonen, L. J., Kletetschka, G., and Lehtinen, M. (2007). Low-temperature magnetic properties of the Neuschwanstein EL6 meteorite. Earth and Planetary Science Letters 261, 143–151. doi:10.1016/j.epsl.2007.06.022
Li, C., Hu, H., Yang, M. F., Pei, Z. Y., Zhou, Q., Ren, X., et al. (2022). Characteristics of the lunar samples returned by the Chang'E-5 mission. National Science Review 9, nwab188. doi:10.1093/nsr/nwab188
Liu, Q., Banerjee, S. K., Jackson, M. J., Chen, F., Pan, Y., and Zhu, R. (2004). Determining the climatic boundary between the Chinese loess and palaeosol: Evidence from aeolian coarse-grained magnetite. Geophysical Journal International 156, 267–274. doi:10.1111/j.1365-246x.2003.02148.x
Mighani, S., Wang, H. P., Shuster, D. L., Borlina, C. S., Nichols, C. I. O., and Weiss, B. P. (2020). The end of the lunar dynamo. Science Advances 6, eaax0883. doi:10.1126/sciadv.aax0883
Morin, F. J. (1950). Magnetic susceptibility of alpha-Fe2O3 and alpha-Fe2O3 with added titanium. Physical Review 78, 819–820.
Mushnikov, N. V., Popov, A. G., Gaviko, V. S., Protasov, A. V., Kleinerman, N. M., Golovnya, O. A., et al. (2022). Peculiarities of phase diagram of Fe-Ni system at Ni concentrations 0 – 20 at.%. Acta Materialia 240, 118330. doi:10.1016/j.actamat.2022.118330
Muxworthy, A. R., and Williams, W. (2015). Critical single-domain grain sizes in elongated iron particles: Implications for meteoritic and lunar magnetism. Geophysical Journal International 202, 578–583. doi:10.1093/gji/ggv180
Nagata, T., Fisher, R. M., and Schwerer, F. C. (1974). Some characteristic magnetic properties of lunar materials. The Moon 9, 63–77. doi:10.1007/bf00565393
Nagata, T., Ishikawa, Y., Kinoshit, H., Kono, M., Syono, Y., and Fisher, R. M. (1970). Magnetic properties of the lunar crystalline rock and fines. Science 167, 703–704. doi:10.1126/science.167.3918.703
Nagy, L., Williams, W., Tauxe, L., Muxworthy, A. R., and Ferreira, I. (2019). Thermomagnetic recording fidelity of nanometer-sized iron and implications for planetary magnetism. Proceedings of the National Academy of Sciences 116, 1984–1991. doi:10.1073/pnas.1810797116
Pick, T., and Tauxe, L. (1993). Geomagnetic palaeointensities during the Cretaceous normal superchron measured using submarine basaltic glass. Nature 366, 238–242. doi:10.1038/366238a0
Rochette, P., Fillion, G., Mattéi, J. L., and Dekkers, M. J. (1990). Magnetic transition at 30–34 kelvin in pyrrhotite: Insight into a widespread occurrence of this mineral in rocks. Earth and Planetary Science Letters 98, 319–328. doi:10.1016/0012-821x(90)90034-u
Rochette, P., Gattacceca, J., Ivanov, A. V., Nazarov, M. A., and Bezaeva, N. S. (2010). Magnetic properties of lunar materials: Meteorites, Luna and Apollo returned samples. Earth and Planetary Science Letters 292, 383–391. doi:10.1016/j.epsl.2010.02.007
Runcorn, S. K. (1975). An ancient lunar magnetic dipole field. Nature 253, 701–703. doi:10.1038/253701a0
Shea, E. K., Weiss, B. P., Cassata, W. S., Shuster, D. L., Tikoo, S. M., Gattacceca, J., et al. (2012). A long-lived lunar core dynamo. Science 335, 453–456. doi:10.1126/science.1215359
Stephenson, A., and Collinson, D. W. (1974). Lunar magnetic field palaeointensities determined by an anhysteretic remanent magnetization method. Earth and Planetary Science Letters 23, 220–228. doi:10.1016/0012-821x(74)90196-4
Strangwa, D. W., Larson, E. E., and Pearce, G. W. (1970). Magnetic studies of lunar samples-breccia and fines. Proceedings of the Apollo 11 Lunar Science Conference 3, 2435–2451.
Suavet, C., Weiss, B. P., and Grove, T. L. (2014). Controlled-atmosphere thermal demagnetization and paleointensity analyses of extraterrestrial rocks. Geochemistry, Geophysics, Geosystems 15, 2733–2743. doi:10.1002/2013gc005215
Tarduno, J. A., Cottrell, R. D., Davis, W. J., Nimmo, F., and Bono, R. K. (2015). A Hadean to Paleoarchean geodynamo recorded by single zircon crystals. Science 349, 521–524. doi:10.1126/science.aaa9114
Tarduno, J. A., Cottrell, R. D., Lawrence, K., Bono, R. K., Huang, W., Johnson, C. L., et al. (2021). Absence of a long-lived lunar paleomagnetosphere. Science Advances 7, eabi7647. doi:10.1126/sciadv.abi7647
Tarduno, J. A., Cottrell, R. D., and Smirnov, A. V. (2002). The Cretaceous superchron geodynamo: Observations near the tangent cylinder. Proceedings of the National Academy of Sciences of the U. S. A. 99, 14020–14025. doi:10.1073/pnas.222373499
Tarduno, J. A., Cottrell, R. D., and Smirnov, A. V. (2006). The paleomagnetism of single silicate crystals: Recording geomagnetic field strength during mixed polarity intervals, superchrons, and inner core growth. Reviews of Geophysics 44, RG1002. doi:10.1029/2005rg000189
Tauxe, L., and Love, J. J. (2003). Paleointensity in Hawaiian scientific drilling project hole (HSDP2): Results from submarine basaltic glass. Geochemistry, Geophysics, Geosystems 4, 8702. doi:10.1029/2001gc000276
Tauxe, L., and Staudigel, H. (2004). Strength of the geomagnetic field in the cretaceous normal superchron: New data from submarine basaltic glass of the troodos ophiolite. Geochemistry, Geophysics, Geosystems 5, Q02H06. doi:10.1029/2003gc000635
Thellier, E., and Thellier, O. (1959). Sur I’intensité du champ magnétique terrestre dans le passé historique et géologique. Annales de Geophysique 15, 285–378.
Tikoo, S. M., Weiss, B. P., Shuster, D. L., Suavet, C., Wang, H. P., and Grove, T. L. (2017). A two-billion-year history for the lunar dynamo. Science Advances 3, e1700207. doi:10.1126/sciadv.1700207
Tikoo, S. M., Weiss, B. R., Cassata, W. S., Shuster, D. L., Gattacceca, J., Lima, E. A., et al. (2014). Decline of the lunar core dynamo. Earth and Planetary Science Letters 404, 89–97. doi:10.1016/j.epsl.2014.07.010
Verwey, E. J. W. (1939). Electronic conduction of magnetite (Fe3O4) and its transition point at low temperatures. Nature 144, 327–328. doi:10.1038/144327b0
Wang, H., Weiss, B. P., Bai, X. N., Downey, B. G., Wang, J., Wang, J., et al. (2017). Lifetime of the solar nebula constrained by meteorite paleomagnetism. Science 355, 623–627. doi:10.1126/science.aaf5043
Weiss, B. P., Gattacceca, J., Stanley, S., Rochette, P., and Christensen, U. R. (2009). Paleomagnetic records of meteorites and early planetesimal differentiation. Space Science Reviews 152, 341–390. doi:10.1007/s11214-009-9580-z
Weiss, B. P., and Tikoo, S. M. (2014). The lunar dynamo. Science 346, 1246753. doi:10.1126/science.1246753
Yu, Y. (2010). Paleointensity determination using anhysteretic remanence and saturation isothermal remanence. Geochemistry, Geophysics, Geosystems 11, Q02Z12. doi:10.1029/2009gc002804
Keywords: tiny rare samples, customized holders, magnetic measurements, paleointensity, lunar meteorite
Citation: Hou Y, Zhang M, He K, Shen Z, Dong L, Fan Y, Qi K, Liu S, Cai S and Qin H (2023) A magnetic measurement technique for small rare samples: Pre-study for Chang’e-5 returned and other extraterrestrial samples. Front. Earth Sci. 11:1146231. doi: 10.3389/feart.2023.1146231
Received: 17 January 2023; Accepted: 20 March 2023;
Published: 30 March 2023.
Edited by:
Yong-Xiang Li, Nanjing University, ChinaReviewed by:
Rory Cottrell, University of Rochester, United StatesTomas Kohout, University of Helsinki, Finland
Eduardo Andrade Lima, Massachusetts Institute of Technology, United States
Copyright © 2023 Hou, Zhang, He, Shen, Dong, Fan, Qi, Liu, Cai and Qin. This is an open-access article distributed under the terms of the Creative Commons Attribution License (CC BY). The use, distribution or reproduction in other forums is permitted, provided the original author(s) and the copyright owner(s) are credited and that the original publication in this journal is cited, in accordance with accepted academic practice. No use, distribution or reproduction is permitted which does not comply with these terms.
*Correspondence: Shuhui Cai, Y2Fpc2h1aHVpQG1haWwuaWdnY2FzLmFjLmNu