 Grigory Dolgikh†
 Vladimir Chupin
- Laboratory Physics of Geospheres, Department Ocean Acoustics, V.I. Il'ichev Pacific Oceanological Institute Far Eastern Branch of Russian Academy of Sciences, Vladivostok, Russia
On the basis of experimental data from laser strainmeters, a laser nanobarograph, and a laser meter of hydrosphere pressure variations, we studied inter-geosphere interaction in microseismic range (2–20 s) and in minute range (4–17 min). We established general patterns of transformation of the Earth’s crust upper layer oscillations into atmospheric oscillations, and atmospheric oscillations—into oscillations of the Earth’s crust upper layer in the specified ranges. Besides, we show that transformation coefficient has seasonal dependence, associated with different elastic characteristics of the Earth’s crust upper layer in winter and summer due to negative winter temperatures and high positive summer temperatures, and also different moisture saturation of the soils.
1 Introduction
At present, studies of the physics of origin, development and transformation of geospheres oscillations and waves in the infrasonic range (from several seconds to 24 h) are a topical area of research, associated primarily with the necessity to determine primary sources of specific oscillations and waves, with origin and development of catastrophic and non-catastrophic geosphere processes and phenomena.
Figure 1 shows a diagram illustrating various wave processes that are excited in different geospheres of the Earth, propagated and transformed in transition zones, while generating oscillatory processes in neighboring geospheres. This can be microseismic oscillations directly caused by tectonic forces, or transforming processes of different frequency ranges generated in the hydrosphere or atmosphere.
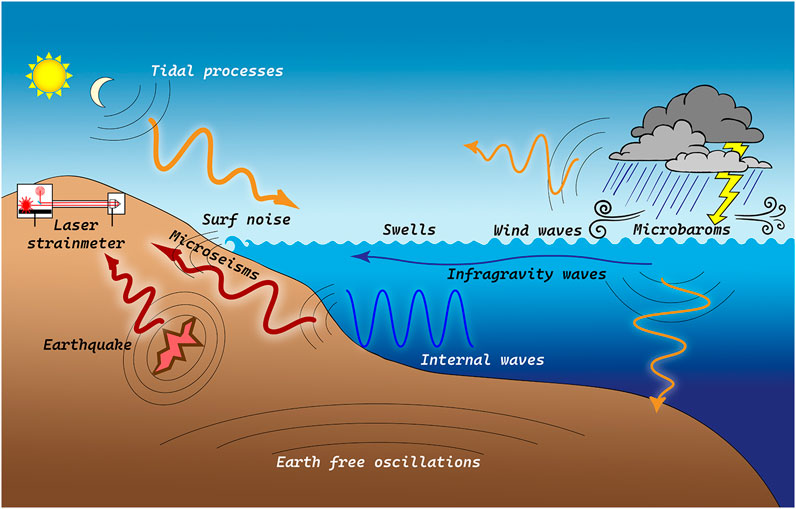
FIGURE 1. Diagram of inter-geosphere interaction of various infrasound processes.
Starting with the range of seconds, we can note that source zones of earthquakes (as a rule, the source zone of an earthquake with magnitude equal to, for example, 6, generates oscillations starting from 15–20 s); minigeoblocks, wind and swell waves, primary and secondary microseisms, generated by them, can be sources of these oscillations. Fundamental works on the nature of origin and development of microseismic waves (2–20 s) are the articles of Hasselmann, 1963; Longuet-Higgins, 1950, stating that progressive and standing sea wind waves excite primary and secondary microseisms, respectively, when they interact with the seabed. Periods of primary microseisms are equal to periods of progressive wind waves, and periods of secondary microseisms are equal to a half-period of progressive sea waves because hydrostatic pressure in a standing sea wave changes twice during one period of a surface sea wave. Periods of primary and secondary microseisms depend on periods of sea wind waves, which are associated with speed and time of wind impact, the area and depth of the basin, over which the wind acts. It is clear that wind waves occur on any water surface, but their parameters depend on the parameters of water areas. In large lakes, wind waves with large periods also arise. So, for example, when analyzing the records of the laser strainmeter, which is installed at the Krasnokamensk geodynamic testing site (Rasskazov et al., 2016), it was found that in microseismic range there are two stable peaks at periods of about 6–7 s and 3–4 s. The second of the peaks is caused by wind waves of the nearby lake Umykey; it disappears in winter period of observations. The peak with the period of 6–7 s always exists; moreover, its amplitude rises abruptly after blasting operations in the mine. Abrupt increase of the amplitude of the peak in microseismic range at the period of 6–7 s can be associated with excitation of the minigeoblock in the area of the laser strainmeter location. It is possible that microseismic waves are excited by atmospheric processes, similar to excitation of the “Infragravity hum of the Earth” by atmospheric pressure pulse beats in resonant and near-resonant cases (Nishida and Kobayashi, 2000).
Of increased interest is studying the nature of origin of the “Infragravity hum of the Earth” (1–15 min), which can be associated with various processes in all geospheres; any of them is fit to explain the origin of oscillations and waves in this frequency range. As it follows from (Kobayashi and Nishida, 1998; Nishida and Kobayashi, 2000; Tanimoto, 2001; Fukao, 2002; Nishida et al., 2002), atmosphere pressure variations lead to excitation of the corresponding elastic oscillations of the Earth’s crust, to excitation of trains of internal sea waves. Another view on the appearance of the “Infragravity hum of the Earth” is associated with sea wave processes: 1) Infragravity sea waves (Alekseev et al., 2003; Rhie and Romanowicz, 2004; Ekstrom, and Ekstrom, 2005; Romanowicz et al., 2005; Webb, 2007); 2) transformation of the energy of sea internal waves into the energy of microdeformations of the Earth’s crust of corresponding period. A special role in origin of oscillations and waves in this frequency range is frequently assigned to the processes, developing in the solid shells of the Earth. It is known that the bulk of the torsional and spheroidal eigen oscillations of the Earth is in this range (1–15 min). We also cannot disregard the eigen oscillations of geoblocks.
In the lower frequency range of periods (from 15 min to several days), the researchers focus their main attention on studying the physics of origin, development and transformation of oscillations and waves, caused by: 1) Eigen oscillations of the Earth (Bullen, 1975; Park et al., 2008; Sobolev, 2013); 2) tidal processes of the atmosphere, hydrosphere and lithosphere; 3) eigen oscillations of certain bays, gulfs, seas and oceans (Dolgikh et al., 2011); 4) large-scale atmospheric processes (Shved et al., 2013) and anthropogenic processes (Guglielmi and Zotov, 2013) It was shown in (Shved et al., 2013) that many oscillations, recorded by vertical seismometers, gravimeters, strainmeters, and tiltmeters are caused by the above motions—atmospheric thermal tide harmonics, eigen oscillations of the atmosphere, Madden-Julian oscillation in the atmosphere-ocean system, atmospheric planetary Rossby waves.
However, we cannot limit ourselves to only specifying primary sources of various wave and non-wave processes, since we are extremely interested in the issues, related to studying the transformation patterns of these processes at the boundaries of geospheres, with their interaction with other different-scale processes and phenomena. Thus, one of the research areas is associated with excitation of atmospheric waves by passing Rayleigh-type waves in the range of periods from 1 to 20 s, generated by earthquakes (Canitano, 2020). However, the same waves are excited by gravity sea waves, in the same range of periods, i.e., from 2 to 20 s. The second, currently very popular, area of research is global warming. For some reason, everyone takes into account only the impact of greenhouse gases; but what about dissipation of energy in the Earth’s crust, in the sea Earth’s crust, due to which temperature of the World Ocean and the atmosphere can increase? There are works, in which these effects are studied at the initial level, for example, (Bowman and Lees, 2018). With increase in storm activity, an increase in the total energy of passing typhoons/cyclones, an increase in the total power of earthquakes, which depend, among other things, on solar activity, the dissipative energy grows, and it entails global warming.
In this paper, we will touch upon some aspects of inter-geosphere interaction in the microseismic range and in the range of the “Infragravity hum of the Earth”.
2 Laser interference systems
Figure 2 shows the layout plan of laser interference measuring systems of the “International Scientific and Educational Geosphere Testing Site,” located at Schultz Cape in the Sea of Japan, which consist of laser strainmeters, a laser nanobarograph and a laser meter of hydrosphere pressure variations. All laser interference systems use frequency-stabilized helium-neon lasers with different long-term stability as a radiation source, and are built on the basis of equal- and unequal-arm Michelson interferometers.
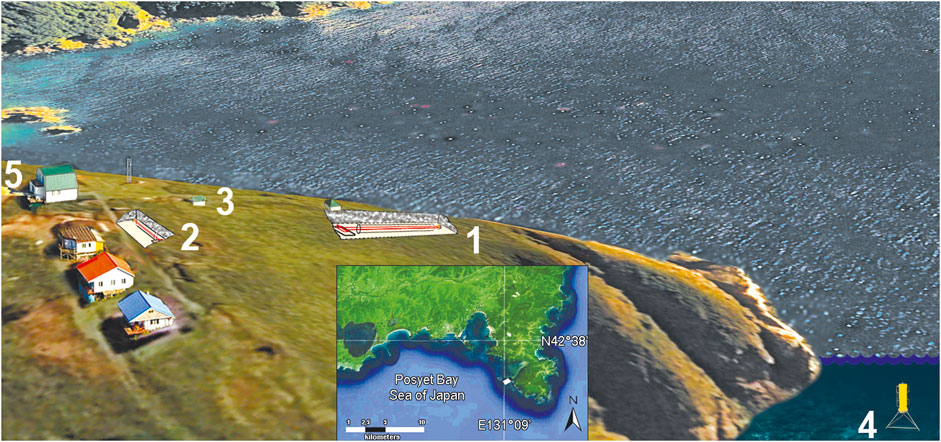
FIGURE 2. Layout plan of laser interference measuring systems. 1–52.5-m laser strainmeter, 2–17.5-m laser strainmeter, 3—laser nanobarograph, 4—laser meter of hydrosphere pressure variations, 5—laboratory building.
Laser strainmeters are built according to the scheme of Michelson interferometer of unequal-arm type and frequency-stabilized lasers with long-term stability in 9–11 decimal places. The 52.5-m laser strainmeter is located in an underground hydro- and thermally insulated room at the depth of 3–5 m from the Earth’s surface. Its measuring arm is 52.5 m long and it is located along a line at the angle of 18° to the “north-south” line. Figure 3 shows a photograph of the central interference unit of this laser strainmeter. The 17.5-m laser strainmeter is located in an underground hydro- and thermally insulated room at the depth of 2–3 m from the Earth’s surface, its measuring arm is 17.5 m long and it is located along a line at the angle of 92° to the measuring arm of the 52.5-m laser strainmeter. Figure 4 shows a photograph of the central interference unit of this laser strainmeter. The interferometry methods, used in these interferometers, allow us to measure displacements at their bases with the accuracy of 10 p.m. in the frequency range from 0 (conventionally) to 1,000 Hz. The dynamic range of all interferometers is significantly expanded by using a level reset system and a feedback system that controls the interferometers’ operation. The 52.5-m and 17.5-m laser strainmeters form the basis of a two-coordinate laser strainmeter, described in (Dolgikh et al., 1998). The optical elements of each laser strainmeter are mounted on two granite abutments, fixed on the ground rock. One abutment of the 52.5-m laser strainmeter is fixed on a natural granite rock, and the other abutment stands on high-density loam. The height of the first abutment is about 1 m, and of the second - about 3 m. All abutments are cone-shaped, wider at the bottom. Both abutments of the 17.5-m laser strainmeter, about 1.5 m high, are mounted on loam.
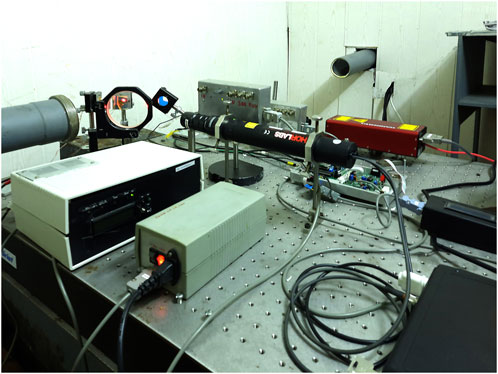
FIGURE 3. Central interference unit of the 52.5-m laser strainmeter.
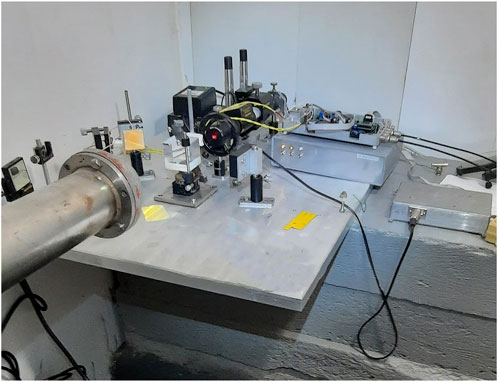
FIGURE 4. Central interference unit of the 17.5-m laser strainmeter.
The laser nanobarograph (Dolgikh et al., 2004) is made according to the scheme of equal-arm type Michelson interferometer, in which a frequency-stabilized helium-neon laser with long-term stability in the ninth decimal place is used as a radiation source. The sensitive element in the laser nanobarograph is a mirror-coated aneroid box, which is a part of the interferometer “cat’s eye” system. In some laser nanobarographs, a small reflecting mirror is mounted onto the block of aneroid boxes instead of spatter. The main technical characteristics of the laser nanobarograph: measurement accuracy of atmosphere pressure variations—50 MPa, operating frequency range—from 0 (conventionally) to 1,000 Hz.
The laser meter of hydrosphere pressure variations (Dolgikh et al., 2009) is made according to the scheme of equal-arm type Michelson interferometer, in which a frequency-stabilized helium-neon laser with long-term stability in the ninth decimal place is used as a radiation source. The sensitive element in this device is a membrane with diameter from 10 to 20 cm and thickness of 1 or 0.5 mm, with a reflecting mirror fixed in its center. The detailed description of the laser meter of hydrosphere pressure variations is given in (Dolgikh et al., 2009). Technical characteristics of modern laser meters of hydrosphere pressure variations are as follows: measuring accuracy of hydrosphere pressure variations is 1 MPa, operating frequency range is from 0 (conventionally) to 1,000 Hz. This device, depending on the set tasks, is installed at various points of the shelf at the depths from 10 to 35 m. In the paper, we analyze the experimental data, obtained both in the time intervals when the laser meter of hydrosphere pressure variations was not installed in the sea, and in the time intervals when the laser meter of hydrosphere pressure variations was installed at the depth of 25 m in the point, specified in Figure 1.
The obtained experimental data sets were transferred via cable lines to the laboratory building (5 in Figure 2), where, after preliminary filtration and decimation, they were recorded on hard computer media with sampling frequency of 1,000 or 2,000 Hz, depending on the tasks of the experiment. Further studies using the fast Fourier transform method allowed us to investigate the dynamics of changes in the spectra of stationary signals generated by powerful natural processes.
3 Processing and analysis of the obtained experimental data
Before studying the patterns of origin, development and transformation of oscillations and waves of the infrasonic range, we carried out experimental works to study transformation patterns of low-frequency hydroacoustic signals, generated in water by low-frequency hydroacoustic radiators operating in the frequency ranges of 19–26 and 30–40 Hz (Dolgikh et al., 2013; Dolgikh et al., 2017), at the “water-bottom” boundary. The most important result of these studies is that at certain critical depths, all hydroacoustic energy, propagating in the water, goes over into the seabed (Dolgikh et al., 2022). In this case, transformation of hydroacoustic energy into seismoacoustic begins from the depths equal to a half-length of a hydroacoustic wave. We assume that this pattern should be true for lower frequencies, i.e., for example, for surface wind waves, and also for internal sea waves. When moving along the shelf of decreasing depth, wind waves (swell waves), starting from the depths equal to a half-length of a wind wave (swell wave), begin to transfer their energy to the upper layer of the sea Earth’s crust. Similar regularities should be true for lower frequency sea waves, for example, sea internal waves. These patterns should be observed during propagation of any progressive sea waves.
Some works, related to studies of inter-geosphere interaction, describe experimental results testifying that, as a rule, energy from atmospheric processes of wave and non-wave nature is transferred both to the Earth’s crust and into the hydrosphere. From the point of view of media impedance (the product of speed and density), this is natural, understandable and simple. It remains only to accurately determine the sources of these processes. The inverse cases are interesting, i.e., transfer of energy from the solid Earth into the atmosphere. There are works on excitation of oscillations in the atmosphere by certain modes of eigen oscillations of the Earth, corresponding to solid shell. Some works, for example, (Canitano, 2020), present the results on excitation of wave processes in the atmosphere by passing Rayleigh waves, caused by crustal earthquakes. Oscillations that occur in the source areas of earthquakes are in the range of periods from several seconds to several tens of a second. The smaller is the magnitude of earthquakes, the smaller is the maximum period of oscillations excited by them. For an earthquake with magnitude of about 5–6, the period of maximum oscillation will be about 20 s. At a recording point, remote from the earthquake, due to dispersion, the period of recorded signals from a particular earthquake gradually decreases, sometimes reaching 10 s. But in this range (10–20 s) there are periods of swell waves that occur during action of the most powerful cyclones. The periods of sea waves depend on the geometric characteristics of the water basins, over which the wind acts, on the magnitude of wind speed and the time of its action over specific water areas. Next, let us analyze the regularities of wind waves origin as a result of cyclones/typhoons’ action and transformation of their energy into waves of neighboring geospheres with corresponding periods.
We will analyze the results, obtained during passage of a particular typhoon over the Sea of Japan. Experimental data from the above mentioned laser interference devices were obtained during passage of Typhoon Hagupit over the Sea of Japan. It originated on 31 July 2020 in the Philippine Sea of the Pacific Ocean, and caused storms in the seas of the Pacific Ocean during its movement. The intensity of the storm peaked when pressure in the center of the cyclone dropped to 975 Pa. The cyclone passed along the east coast of China. When the cyclone entered the Yellow Sea, its rating dropped to a tropical depression, passing into the category of an extratropical cyclone. In this status, the cyclone entered the Sea of Japan on August 6. At the same time, despite extratropical transition, meteorological agencies continued to track Hagupit as a tropical storm until August 12, due to preservation of the vortex structure and maintaining energy balance from the heating water surface of the middle latitudes. We processed the data, received on 6 August 2020. Figure 5 shows successive satellite imagery of wind waves in the Sea of Japan, caused by the typhoon, obtained on that date.
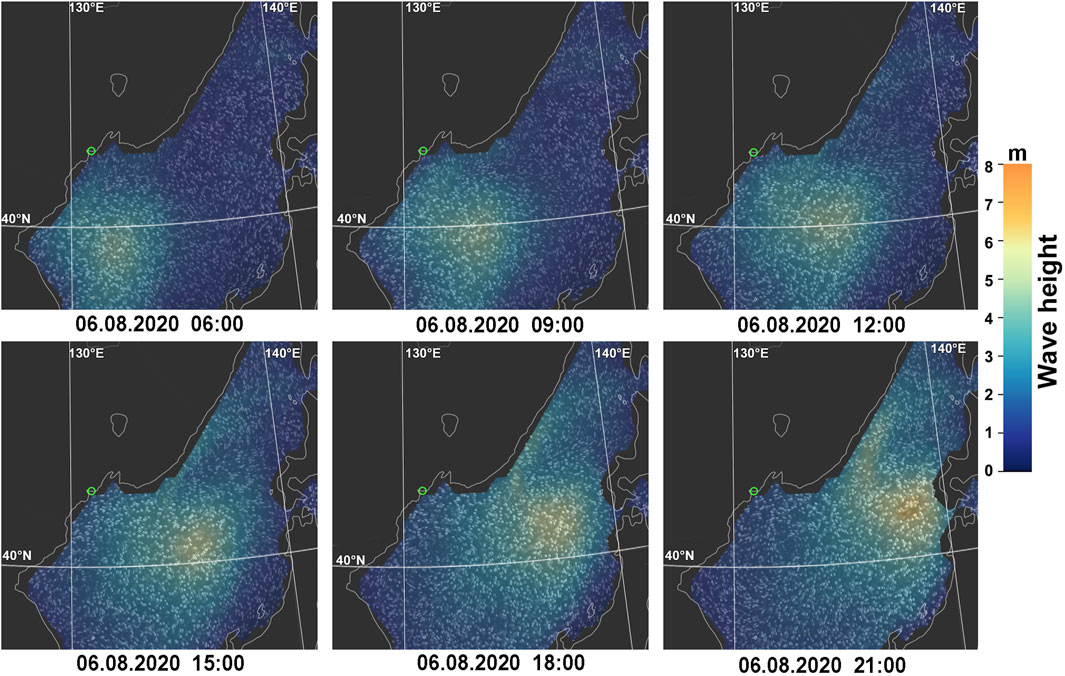
FIGURE 5. Movement of the typhoon over time, 6 August 2020. Wind waves. The green circle is the location of the measuring complex.
The above tropical cyclone caused wind waves in the Sea of Japan, which, after leaving the zone of typhoon action in the form of swell waves, during their propagation and interaction with the seabed on the shelf and in the surf zone, excited primary and secondary microseisms. Primary microseisms are caused by progressive swell waves, the period of which is equal to the period of progressive waves. Secondary microseisms are caused by standing sea waves, the period of which is equal to a half-period of progressive swell waves. In the course of processing, we selected several synchronous fragments of the 52.5-m laser strainmeter (NS), the 17.5-m laser strainmeter (WE), the laser nanobarograph (NAN), and the laser meter of hydrosphere pressure variations (LMHPV) records. When analyzing the results of processing of these devices synchronous records, we focused on studying the nature of origin of disturbances in the atmosphere, the Earth’s crust, and in the water, of microseismic range under consideration, caused by an active typhoon in the Sea of Japan. The results of processing these synchronous record fragments are shown in Table 1.
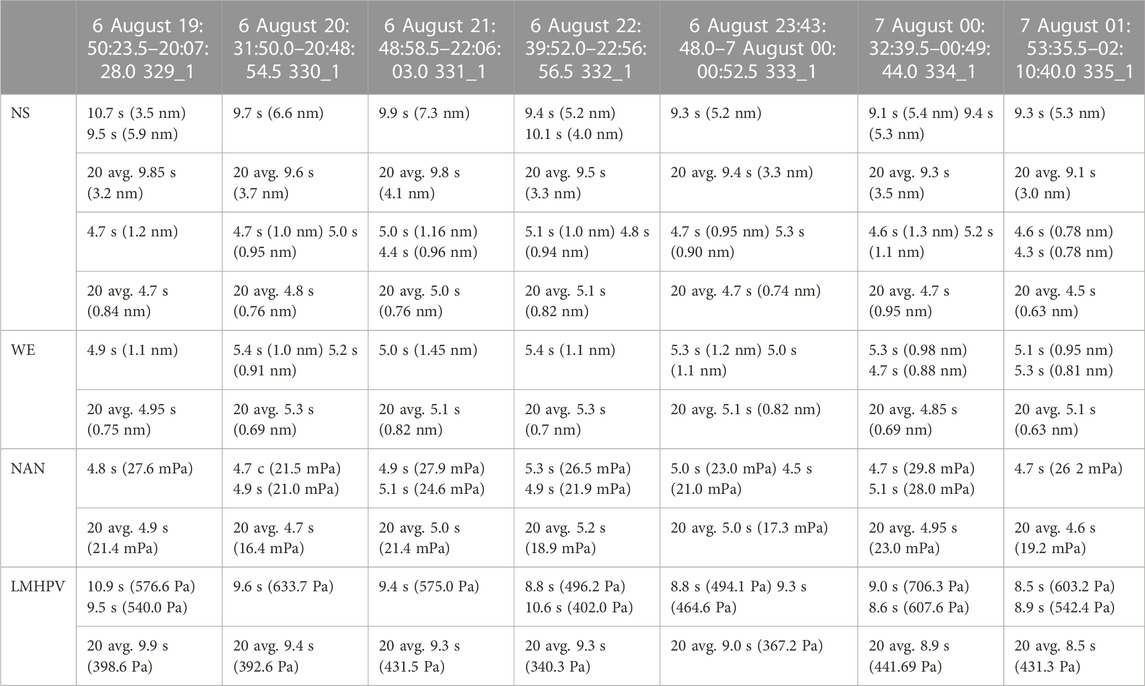
TABLE 1. Results of processing synchronous fragments of laser strainmeters, laser nanobarograph, and laser meter of hydrosphere pressure variations records.
Analyzing the results of processing, we can note the following: 1) In the obtained spectra of the processed records of the 52.5-m laser strainmeter, in microseismic range we identify peaks corresponding to primary and secondary microseisms. At the same time, the amplitudes of primary microseisms are 5–6 times higher than the amplitudes of secondary microseisms. 2) In the obtained spectra of the processed the 17.5-m laser strainmeter records, in microseismic range we identify peaks corresponding to primary and secondary microseisms. At the same time, the amplitudes of secondary microseisms are more pronounced than the amplitudes of primary microseisms. 3) In the spectra of the laser nanobarograph records, we identify maxima corresponding to secondary microseisms. The maxima corresponding to primary microseisms are not identified in the laser nanobarograph records. 4) In the spectra of the laser meter of hydrosphere pressure variations records, we identify maxima corresponding to progressive waves, but no maxima corresponding to standing sea waves. As an example, Figure 6 shows synchronous record sections and their spectra, obtained from spectral processing of experimental data from two laser strainmeters, the laser nanobarograph, and the laser meter of hydrosphere pressure variations, confirming the above. Before spectral processing, all records were processed with Hamming band pass filter in the frequency range of 0.01–2 Hz in order to suppress powerful spectral components beyond the microseismic range. The different background colors in the figure indicate the type of disturbance according to its origin.
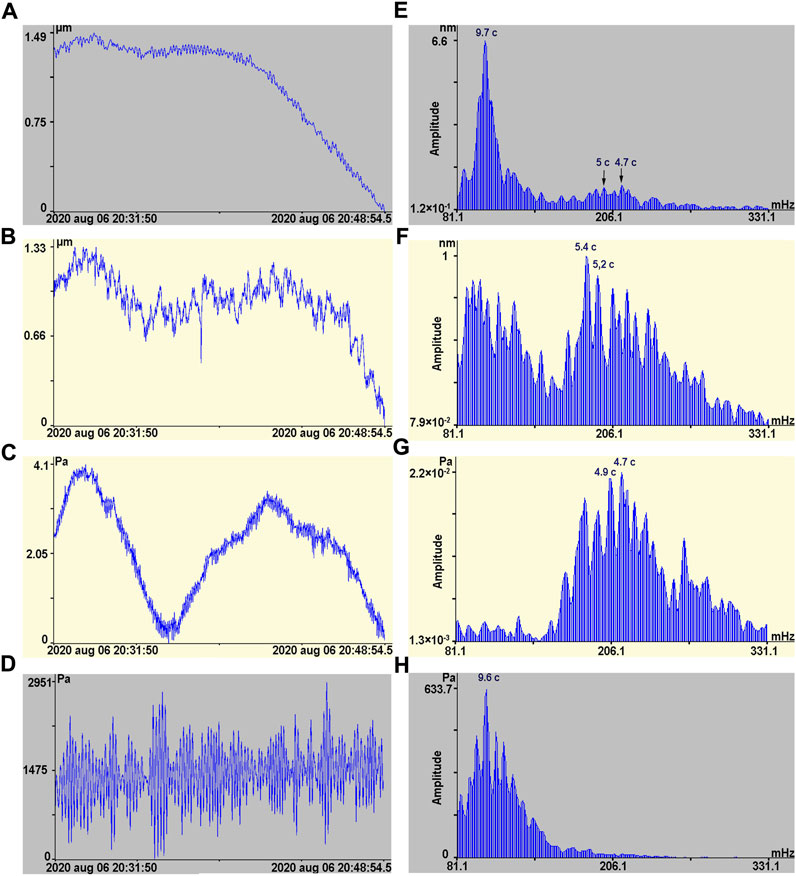
FIGURE 6. Synchronous recording sections: 52.5 m laser strainmeter (A) and its spectrum (E); 17.5 m laser strainmeter (B) and its spectrum (F); laser nanobarograph (C) and its spectrum (G); laser meter of hydrosphere pressure variations (D) and its spectrum (H).
Figure 6A shows the recording section of the 52.5-m laser strainmeter, and Figure 6E shows the calculated spectrum of this recording section. The spectrum shows a powerful peak at the frequency corresponding to the period of 9.7 s (three averages) with an amplitude of 6.6 nm (see Table 1, third column from the left, fragment of the record of August 6, 20:31:50.0–20:48:54.5). As we can see from this table, in the range of secondary microseisms, we identified two peaks with periods of 4.7 and 5.0 s, the amplitudes of which are 1.0 and 0.95 nm, respectively. That is, the amplitudes of secondary microseisms, recorded by the 52.5-m laser strainmeter, are almost seven times lower than the amplitudes of primary microseisms, recorded by this laser strainmeter. Figure 6B shows the recording section of the 17,5-m laser strainmeter, and Figure 6F shows the fragment of the spectrum showing several peaks in the range of primary and secondary microseisms. Moreover, the amplitudes of secondary microseisms are higher than the amplitudes of primary microseisms. Both laser strainmeters confidently register secondary microseisms. The identified amplitudes of secondary microseisms on laser strainmeters are comparable in magnitude. Considering that the laser strainmeter with the arm length of 52.5 m is three times larger than the laser strainmeter with the arm length of 17.5 m, we can determine the approximate direction to the place of secondary microseisms generation, taking into account that they relate to transverse waves. According to the obtained experimental data of the 17.5-m and 52.5-m laser strainmeters and taking into account polarization of secondary microseisms, we determined the direction to the supposed place of their origin. It is at the angle of 22.4° to the axis of the 52.5-m laser strainmeter or 40.4° to the “north-south” line. The place of generation of secondary microseisms, formed as a result of the loading effect of standing gravity sea waves on the seabed, is not in the area of the measuring site. This conclusion was drawn from the fact that in the laser meter of hydrosphere pressure variations records, the maxima, corresponding to standing sea waves, with periods two times smaller than the periods of progressive sea gravity waves, were not identified.
Figure 6C shows a section of the laser nanobarograph recording and Figure 6G shows the fragment of the spectrum obtained by processing the laser nanobarograph recording at the specified time interval (August 6, 20:31:50.0–20:48:54.5), in which there are powerful maxima at several periods, the highest of them belong to the periods of 4.7 and 4.9 s. In the same range, i.e., in the range of secondary microseisms, we identified many peaks in the 17.5-m laser strainmeter record. In the range of secondary microseisms, maxima, corresponding to oscillations in the upper layer of the Earth’s crust, and also maxima, corresponding to atmospheric pressure oscillations, are identified. That is, these oscillations are present both in the atmosphere and in the Earth’s crust. In this case, there may be two variants: 1) Oscillations with these periods are observed in the atmosphere, their energy transforms into oscillations of the upper layer of the Earth’s crust; 2) oscillations with these periods are observed in the upper layer of the Earth’s crust, their energy transforms into atmospheric oscillations. To determine the primary source of these oscillations, let us turn to the spectrum, obtained from processing the laser meter of hydrosphere pressure variations record of the same measurement period, which is shown in Figure 6H. The corresponding oscillogram of the signal is shown in Figure 6D. Analysis of the spectrum graph shows that there are powerful maxima in the range of swell waves (wind waves) with the period of 9.6 s, the energy of which transforms into the energy of the upper layer of the Earth’s crust, generating primary microseisms. There is nothing in the range of standing wind waves. That is, in the sea, near the location of the measuring site, no standing sea waves were detected and no oscillations in atmospheric pressure were detected in this range of periods over the sea, which would otherwise have appeared on the laser meter of hydrosphere pressure variations record. In other words, the primary source of oscillations in the area of secondary microseisms is not in the atmosphere and is not in the water near the measuring site and the place of the laser meter of hydrosphere pressure variations location. The most probable origin of these oscillations in the atmosphere is associated with passing secondary microseisms, recorded by the laser strainmeters. That means that secondary microseisms excited similar atmospheric oscillations. The maxima that were identified in the range of secondary microseisms during processing of the laser nanobarograph records, but not identified in the laser meter of hydrosphere pressure variations records, indicate that they are caused by secondary microseisms that came from their generation zone and are recorded by the laser strainmeters. Basing on the data of the laser nanobarograph and the laser strainmeters, we can determine the ratio of atmospheric pressure amplitudes and microdisplacements. On the average, it is about 0.023 Pa/nm, which is approximately three to four times greater than the value, obtained in (Canitano, 2020) when registering Rayleigh waves from earthquakes and atmospheric disturbances caused by them.
Now we will turn to the lower frequency range in order to clarify the nature of inter-geosphere interaction in the specific frequency range, with simultaneous determination of the primary sources of the identified disturbances. In this part of the paper, we will pay attention to clarification of the primary source of oscillations/waves, identified in the laser nanobarograph and laser strainmeters records after the explosion of Hunga Tonga-Hunga Haʻapai volcano (Dolgikh et al., 2022). After registration of the explosion impulse by the above laser interference systems, the oscillations were recorded at periods of 17 min 04 s, 8 min 32 s, and 4 min 16 s; they were attributed to atmospheric Lamb waves excited by the explosion impulse. On other measuring systems, installed in the Pacific Ocean and the Sea of Japan along the path of the explosion impulse, the disturbances with other periods were recorded. This result can only indicate that atmospheric Lamb waves, which we registered, were excited in the operation zone of the laser interference systems. The source of these oscillations/waves can be the atmospheric layer, which has the main frequency and modes at identified periods. It is clear, that in order to confirm this result, we need to register these oscillations/waves in other time intervals. For this purpose, we processed synchronous fragments of the laser nanobarograph and laser strainmeters records in other periods. In the course of processing relatively “quiet” time intervals, we identified maxima with the indicated periods in the obtained spectra. Sometimes all three at the same time—17 min 04 s, 8 min 32 s, and 4 min 16 s. Figure 7 shows the synchronous fragments of the laser strainmeters and laser nanobarograph records in one of the specified time intervals, when maxima were identified in the records of the laser interference devices in all three periods mentioned above. Even from striking similarity of these graphs, we can state that all changes in this time interval in the Earth’s crust and the atmosphere are caused by a powerful oscillatory process, the source of which is, apparently, in the atmosphere. Let us carry out spectral processing of the specified fragments of the records. The results of spectral processing are shown in Figure 8, and the specified periods and amplitudes are listed in Table 2.
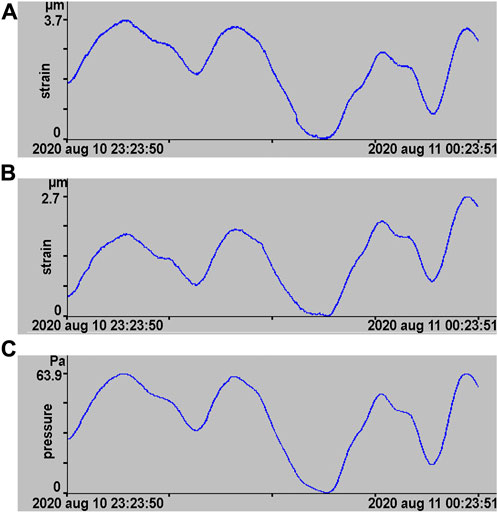
FIGURE 7. Synchronous recording sections of 52.5-m laser strainmeter (A), 17.5-m laser strainmeter (B), laser nanobarograph (C) records.
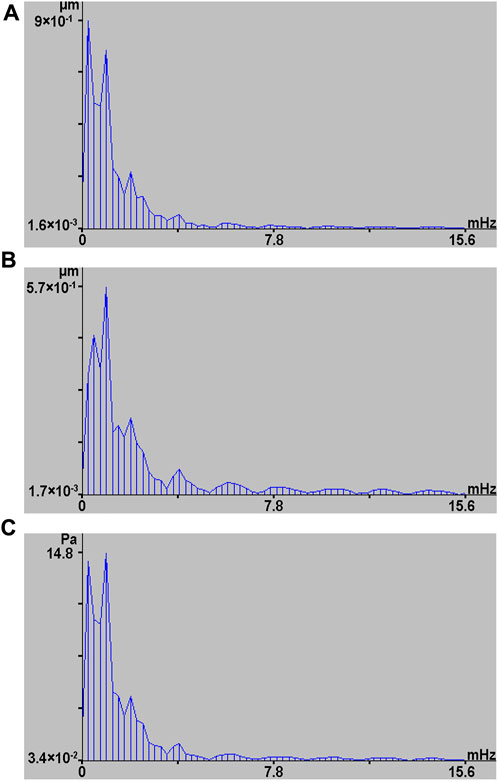
FIGURE 8. Spectra, obtained from processing fragments of the records, shown in Figure 7. 52.5-m laser strainmeter (A), 17.5-m laser strainmeter (B), laser nanobarograph (C).
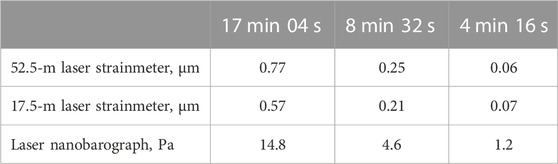
TABLE 2. Periods and amplitudes of the maxima identified in the laser strainmeters and laser nanobarograph records.
From the data, listed in Table 2, we can see that the ratio of the amplitudes of the laser nanobarograph data to that of the laser strainmeters is smaller than the same ratios, obtained in (Dolgikh et al., 2022). This is because the measurements at the above complexes, the results of which are given in Table 2, were carried out in summer, and the measurements, described in (Dolgikh et al., 2022), were carried out in winter. It is primarily due to different characteristics of the elastic parameters of the upper layer of the Earth’s crust in the place of the laser strainmeters location in the summer and winter periods of observations because of different temperatures and moisture saturation of the soil.
Such methods of studying various processes in the ultra-low frequency range not only allow the study of the dynamics of inter-geospheric interaction, but also provide very practical results for the prevention of dangerous processes. For example, the monitoring of signals in real time can allow the implementation of early warning procedures for tsunami waves caused by strong geodynamic processes. As shown in (Dolgikh et al., 2007), when the earthquake source region was more than 5,500 km away from the receiving system, the deformation anomaly, an indicator of tsunami generation (Dolgikh and Dolgikh, 2021), was detected after 19 min 54 s. At the same time, the tsunami reached the nearest coast after 2 h. A recording from an instrument at such a distance from the tsunami source would have provided a warning of a large wave hazard in about 1 h and 25 min. Similar instruments operating close to earthquake-prone areas could have given warnings much earlier.
4 Conclusion
From the analysis of the experimental data, obtained from two laser strainmeters, measuring arms of which are located at the angle of 92° relative to each other, the laser nanobarograph, and the laser meter of hydrosphere pressure variations, we determined the general patterns of transformation of progressive and standing wind waves (swell waves) into primary and secondary microseisms. At the same time, we estimated the transformation coefficients of this transformation, basing on the amplitudes of sea waves and microseisms. We have established that atmosphere microbaroms were formed not by primary, but by secondary microseisms, which were recorded by all laser strainmeters, but formation zone of secondary microseisms was outside of the measuring site. It was confirmed by the data of the laser meter of hydrosphere pressure variations, where powerful maxima were identified at the periods of progressive waves, but there were no maxima at the periods of standing sea waves.
In the minute range of periods, from the laser strainmeters and the laser nanobarograph synchronous records, we identified the maxima at periods of 17 min 04 s, 8 min 32 s, and 4 min 16 s, which we had previously identified from the records of the above laser interference systems. They originated at the systems’ location place during passage of powerful atmospheric impulse, formed as a result of the explosion of Hunga Tonga-Hunga Haʻapai volcano. In the process of analyzing the obtained results, we determined that the most probable origin of these oscillations is associated with excitation of eigen oscillations of the atmospheric layer. It is shown that the coefficient of transformation of oscillations and waves in the minute range of periods at the atmosphere-Earth’s crust boundary in winter and summer periods is different, which is associated with different elastic characteristics of the upper layer of the Earth’s crust.
Data availability statement
The raw data supporting the conclusion of this article will be made available by the authors, without undue reservation.
Author contributions
All authors listed have made a substantial, direct, and intellectual contribution to the work and approved it for publication.
Funding
The work was supported by the grant of Russian Science Foundation, Project No. 22-17-00121, https://rscf.ru/project/22-17-00121/.
Conflict of interest
The authors declare that the research was conducted in the absence of any commercial or financial relationships that could be construed as a potential conflict of interest.
Publisher’s note
All claims expressed in this article are solely those of the authors and do not necessarily represent those of their affiliated organizations, or those of the publisher, the editors and the reviewers. Any product that may be evaluated in this article, or claim that may be made by its manufacturer, is not guaranteed or endorsed by the publisher.
References
Alekseev, A. V., Valentin, D. I., Dolgikh, G. I., Dolgikh, S. G., Kovalev, S. N., Koren, I. A., et al. (2003). Registration of infragravity waves at the hydrosphere-lithosphere boundary using coastal laser strainmeter. Dokl. Earth Sci. 389 (2), 291–293.
Bowman, D. C., and Lees, J. M. (2018). Upper atmosphere heating from ocean-generated acoustic wave energy. Geophys. Res. Lett. 45, 5144–5150. doi:10.1029/2018GL077737
Canitano, A. (2020). Observation and Theory of Strain-Infrasound Coupling during Ground-Coupled Infrasound Generated by Rayleigh Waves in the Longitudinal Valley (Taiwan). Bull. Seismol. Soc. Am. 110 (6), 2991–3003. doi:10.1785/0120200154
Dolgikh, G. I., Dolgikh, S. G., Pivovarov, A. A., Samchenko, A. N., Shvyrev, A. N., Chupin, V. A., et al. (2017). A Hydroacoustic System that Radiates at Frequencies of 19−26 Hz. Instrum. Exp. Tech. 4, 596–599. doi:10.1134/S0020441217030186
Dolgikh, G. I., and Dolgikh, S. G. (2021). Deformation Anomalies Accompanying Tsunami Origination. J. Mar. Sci. Eng. 9, 1144. doi:10.3390/jmse9101144
Dolgikh, G. I., Dolgikh, S. G., Kovalev, S. N., Chupin, V. A., Shvets, V. A., and Yakovenko, S. V. (2007). A Deformation Method for Determining the Tsunami Potential of Earthquakes. Dokl. Earth Sci. 417 (1), 1261–1264. doi:10.1134/S1028334X07080296
Dolgikh, G. I., Dolgikh, S. G., Kovalev, S. N., Koren, I. A., Novikova, O. V., Ovcharenko, V. V., et al. (2004). A laser nanobarograph and its application to the study of pressure-strain coupling. Izvestiya. Phys. Solid Earth 40 (8), 683–691.
Dolgikh, G. I., Dolgikh, S. G., Kovalyov, S. N., Chupin, V. A., Shvets, V. A., and Yakovenko, S. V. (2009). Super-low-frequency laser instrument for measuring hydrosphere pressure variations. J. Mar. Sci. Technol. 14 (4), 436–442. doi:10.1007/s00773-009-0062-5
Dolgikh, G. I., Dolgikh, S. G., and Ovcharenko, V. V. (2022). Initiation of Infrasonic Geosphere Waves Caused by Explosive Eruption of Hunga Tonga-Hunga Ha’apai Volcano. J. Mar. Sci. Eng. 10 (8), 1061. doi:10.3390/jmse10081061
Dolgikh, G. I., Dolgikh, S. G., Pivovarov, A. A., Samchenko, A. N., Chupin, V. A., Shvyryov, A. N., et al. (2013). The feasibility of laser strainmeters for sea floor diagnostics. Dokl. Earth Sci. 452 (1), 971–975. doi:10.1134/s1028334x13090158
Dolgikh, G. I., Dolgikh, S. G., Smirnov, S. V., Chupin, V. A., Shvets, V. A., and Yakovenko, S. V. (2011). Infrasound oscillations in the Sea of Japan. Dokl. Earth Sci. 441 (1), 1529–1532. doi:10.1134/S1028334X11110031
Dolgikh, G. I., Kovalev, S. N., Koren, I. A., and Ovcharenko, V. V. (1998). A Two-Coordinate Laser Strainmeter. Izvestiya. Phys. Solid Earth 34 (11), 946–950.
Ekstrom, G., and Ekstrom, S. (2005). Correlation of Earth’s long-period background seismic radiation with the height of ocean waves. Eos 86 (52). Fall Meet. Suppl. Abstr. S34B-02.
Fukao, Y., Nishida, K., Suda, N., Nawa, K., and Kobayashi, N. (2002). A theory of the Earth’s background free oscillations. J. Geophys. Res. 107 (9), ESE 11-1–ESE 11-10. doi:10.1029/2001JB000153
Guglielmi, A. V., and Zotov, O. D. (2013). On the near-hourly hidden periodicity of earthquakes. Izvestiya, Phys. Solid Earth 49 (1), 1–8. doi:10.1134/S1069351313010047
Hasselmann, K. (1963). A statistical analysis of the generation of microseisms. Rev. Geophys. 1, 177–210. doi:10.1029/rg001i002p00177
Kobayashi, N., and Nishida, K. (1998). Continuous excitation of planetary free oscillations by atmospheric disturbances. Nature 395, 357–360. doi:10.1038/26427
Longuet-Higgins, M. S. (1950). A theory of the origin of microseisms. Phil. Trans. R. Soc. Lond. Ser. A 243, 1–35. doi:10.1098/rsta.1950.0012
Nishida, K., Kobayashi, N., and Fucao, Y. (2000). Resonant Oscillations Between the Solid Earth and the Atmosphere. Science 287, 2244–2246. doi:10.1126/science.287.5461.2244
Nishida, K., Kobayashi, N., and Fukao, Y. (2002). Origin of Earth’s ground noise from 2 to 20 mHz. Geophys. Res. Lett. 29 (10), 52-1–52-4. doi:10.1029/2001GL013862
Park, J., Amoruso, A., Crescentini, L., and Boschi, E. (2008). Long-period toroidal earth free oscillations from the great Sumatra-Andaman earthquake observed by paired laser extensometers in Gran Sasso, Italy. Italy. geophys. J. Int. 178, 887–905. doi:10.1111/j.1365-246X.2008.03769.x
Rasskazov, I.Yu., Dolgikh, G. I., Petrov, V. A., Lugovoy, V. A., Dolgikh, S. G., Saksin, B. G., et al. (2016). Laser Strainmeter in Integrated Geodynamic Monitoring within Streltsov Ore Field. J. Min. Sci. 6, 1052–1059. doi:10.1134/S1062739116061599
Rhie, J., and Romanowicz, B. (2004). Excitation of Earth's continuous free oscillations by atmosphere–ocean–seafloor coupling. Nature 431, 552–556. doi:10.1038/nature02942
Romanowicz, B., Rhie, J., and Colas, B. (2005). Insights into the origin of the Earth’s hum and microseisms. Eos 86 (52). Fall Meet. Suppl. Abstr. S31A-0271.
Shved, G. M., Ermolenko, S. I., Karpova, N. V., Wendt, S., and Jacobi, C. (2013). Detecting global atmospheric oscillations by seismic instruments. Izvestiya, Phys. Solid Earth 49 (2), 278–288. doi:10.1134/S1069351313010138
Sobolev, G. A. (2013). On some properties in the emergence and evolution of the oscillations of the Earth after earthquakes. Izvestiya, Phys. Solid Earth 49 (5), 610–625. doi:10.1134/S106935131305008X/
Tanimoto, T. (2001). Continuous Free Oscillations: atmosphere-Solid Earth Coupling. Ann. Rev. Earth Planet. Sci. 29, 563–584. doi:10.1146/annurev.earth.29.1.563
Keywords: laser interference units, swell waves, wind waves, microseisms, microbaroms, eigen oscillations of the atmosphere, transformation coefficient
Citation: Dolgikh G, Budrin S, Dolgikh S, Chupin V and Shvets V (2023) Inter-geosphere interaction in the infrasonic range. Front. Earth Sci. 11:1146224. doi: 10.3389/feart.2023.1146224
Received: 17 January 2023; Accepted: 28 September 2023;
Published: 10 October 2023.
Edited by:
Franklin Javier Paredes, University of the Western Plains Ezequiel Zamora, VenezuelaReviewed by:
George Hloupis, University of West Attica, GreeceYury Kulchin, Institute of Automation and Control Processes (RAS), Russia
Copyright © 2023 Dolgikh, Budrin, Dolgikh, Chupin and Shvets. This is an open-access article distributed under the terms of the Creative Commons Attribution License (CC BY). The use, distribution or reproduction in other forums is permitted, provided the original author(s) and the copyright owner(s) are credited and that the original publication in this journal is cited, in accordance with accepted academic practice. No use, distribution or reproduction is permitted which does not comply with these terms.
*Correspondence: Vladimir Chupin, Y2h1cGluQHBvaS5kdm8ucnU=
†These authors have contributed equally to this work and share senior authorship
‡These authors have contributed equally to this work and share last authorship