
94% of researchers rate our articles as excellent or good
Learn more about the work of our research integrity team to safeguard the quality of each article we publish.
Find out more
ORIGINAL RESEARCH article
Front. Earth Sci., 24 May 2023
Sec. Volcanology
Volume 11 - 2023 | https://doi.org/10.3389/feart.2023.1144386
This article is part of the Research TopicWomen in Science: Volcanology 2022View all 14 articles
 Vanesa Burgos1,2*
 Susanna F. Jenkins1,2
 Laura Bono Troncoso3Constanza Valeria Perales Moya3
 Mark Bebbington4
 Chris Newhall5Alvaro Amigo3
 Jesús Prada Alonso6
 Benoit Taisne1,2
Determining the eruption frequency-Magnitude (f-M) relationship for data-limited volcanoes is challenging since it requires a comprehensive eruption record of the past eruptive activity. This is the case for Melimoyu, a long-dormant and data-limited volcano in the Southern Volcanic Zone (SVZ) in Chile with only two confirmed Holocene eruptions (VEI 5). To supplement the eruption records, we identified analogue volcanoes for Melimoyu (i.e., volcanoes that behave similarly and are identified through shared characteristics) using a quantitative and objective approach. Firstly, we compiled a global database containing 181 variables describing the eruptive history, tectonic setting, rock composition, and morphology of 1,428 volcanoes. This database was filtered primarily based on data availability into an input dataset comprising 37 numerical variables for 438 subduction zone volcanoes. Then, we applied Agglomerative Nesting, a bottom-up hierarchical clustering algorithm on three datasets derived from the input dataset: 1) raw data, 2) output from a Principal Component Analysis, and 3) weighted data tuned to minimise the dispersion in the absolute probability per VEI. Lastly, we identified the best set of analogues by analysing the dispersion in the absolute probability per VEI and applying a set of criteria deemed important by the local geological service, SERNAGEOMIN, and VB. Our analysis shows that the raw data generate a low dispersion and the highest number of analogues (n = 20). More than half of these analogues are in the SVZ, suggesting that the tectonic setting plays a key role in the clustering analysis. The eruption f-M relationship modelled from the analogue’s eruption data shows that if Melimoyu has an eruption, there is a 49% probability (50th percentile) of it being VEI≥4. Meanwhile, the annual absolute probability of a VEI≤1, VEI 2, VEI 3, VEI 4, and VEI≥5 eruption at Melimoyu is 4.82 × 10⁻⁴, 1.2 × 10⁻³, 1.45 × 10⁻⁴, 9.77 × 10⁻⁴, and 8.3 × 10⁻⁴ (50th percentile), respectively. Our work shows the importance of using numerical variables to capture the variability across volcanoes and combining quantitative approaches with expert knowledge to assess the suitability of potential analogues. Additionally, this approach allows identifying groups of analogues and can be easily applied to other cases using numerical variables from the global database. Future work will use the analogues to populate an event tree and define eruption source parameters for modelling volcanic hazards at Melimoyu.
Forecasting eruptions ideally requires a comprehensive eruption record that is representative of past eruptive behaviour and from which the probability of having a given eruption scenario can be estimated. However, compiling these data can be extremely challenging, especially for volcanoes with limited data due to eruption under-recording. One of these data-limited volcanoes is Melimoyu (Chile), with just two confirmed Holocene eruptions, both VEI 5 (Geoffroy et al., 2018). We consider Melimoyu a long-dormant volcano (i.e., as defined in Burgos et al. (2022a): “an active or potentially active volcano without recorded eruptions within the last 100 years”); the last confirmed eruption took place more than 1,800 years ago. According to the Specific Volcanic Risk Ranking of Active Volcanoes of Chile (SERNAGEOMIN, 2019), Melimoyu is a Volcanic System Type II (i.e., high-risk volcanic system or volcanic system with recent anomalous activity), ranking 28th out of 92 Chilean active volcanoes. The most recent, and only detected unrest at Melimoyu, took place in May 2010, when there was an increase in the seismic activity, leading to the Alert Level being raised to Green Level 2 (GVP, 2010) out of the seven alert levels available at that time (i.e., Green 1 and 2; Yellow 1 and 2; and Red 1, 2, and 3 (Bono, L. and Perales, C. personal communication)).
Estimating how often a data-limited volcano like Melimoyu erupts and assessing its volcanic hazards is challenging since the range of past eruptive styles is not well known (Loughlin et al., 2015). Several factors can prevent us from having comprehensive eruption records, such as historical events and socio-cultural factors, the capacity to conduct geological studies, the presence of submarine volcanism, environmental conditions, and accessibility to the study areas (Siebert et al., 2011; Mead and Magill, 2014; Burgos et al., 2022b). Ideally, we can improve the eruption record by collecting new field data while the volcano is dormant and there is no imminent threat of reactivation. In Melimoyu, a detailed fieldwork campaign was carried out by Geoffroy (2017), which focused on characterising the deposits from the two known Holocene eruptions.
Despite these recent efforts, the data available for Melimoyu are still scarce. The main causes are the high erosion rate in the Patagonian Andes caused by the climatic conditions, especially during glacial periods, resulting in poorly preserved deposits, and the permanent ice cap covering most of Melimoyu’s edifice (Herman and Brandon, 2015; Geoffroy and Kervyn, 2018). In addition, the region of Aysén was occupied only from the late 19th century (Marín, 2014), which could have contributed to the lack of historical accounts of any potential activity in Melimoyu. Therefore, we must rely on analogue volcanoes (i.e., volcanoes we expect to behave similarly and which are identified through shared characteristics) to supplement the eruption record.
Analogue volcanoes have been typically defined based on location, tectonic setting, morphology, magma type, eruption style, or a combination of these factors for 1) assessing local and regional volcanic hazards (e.g., Newhall, 1982; Mastin et al., 2009; Jenkins et al., 2012b; Sandri et al., 2012; 2014; Newhall and Pallister, 2015; Lindsay and Robertson, 2018; Tierz et al., 2020; Tennant et al., 2021); 2) estimating eruption frequency-Magnitude (f-M) relationship (e.g., Solow, 2001; Rodado et al., 2011; Jenkins et al., 2012a; 2022; Runge et al., 2014; Whelley et al., 2015; Sheldrake and Caricchi, 2017; Hayes et al., 2022); 3) conducting probabilistic eruption forecasts (e.g., Marzocchi et al., 2004; Bebbington, 2014; Sheldrake, 2014; Bebbington and Jenkins, 2022), and 4) identifying unrest patterns (e.g., Acocella et al., 2015; Newhall et al., 2017).
One commonly used approach to identify analogues is classifying volcanoes into categorical classes. For example, Whelley et al. (2015) proposed five categories of volcanoes that combined the morphology of the edifice, the state of the conduit, and the dimension of the summit crater. One limitation of using categorical classifications is that the ability to capture the diversity across volcanoes is limited. For example, this method suggests that 55% of the volcanoes in SE Asia (n = 441) are analogues since they classify as semi-plugged stratovolcanoes. Hayes et al. (2022) showed that classifying volcanoes into broad categories result in large uncertainty in the eruption f-M relationship estimations of SE Asia volcanoes, especially when using global analogues. Similarly, Bebbington and Jenkins (2022) demonstrated that intra-eruption forecasting did not improve when using data from analogues identified from categorical classes of morphology or composition instead of the entire dataset once the current activity is accounted for.
Several studies have proposed different quantitative approaches to identifying analogue volcanoes in the last 2 decades. For example, Hone et al. (2007) carried out a cladistic classification of volcanoes in Honshu (Japan) by combining multiple characteristics split into states (e.g., the amount of basalt (compositional type characteristic) is divided into five states that range from none to substantial) and assigning them individually to each volcano. This approach would be time-consuming to apply on a global scale (Hone et al., 2007). Sobradelo et al. (2010) classified analogous calderas into three groups with different geodynamic environments by analysing the caldera area. Tierz et al. (2019) developed VOLCANS, which combines up to five weighted volcanological criteria to obtain an analogy metric. VOLCANS is designed to identify analogues for one target volcano at a time since the analogy metric measures the similarity between a given volcanic system in their database and the target volcano (i.e., it does not provide groups of analogue volcanoes). A limitation of VOLCANS is that the weights assigned to each criterion are selected subjectively by the user. This step can be crucial since the proposed analogues differ depending on the weighting scheme (Tierz et al., 2019), generating notably different eruption probability estimates (Tierz et al., 2020). More recently, Wang et al. (2022) introduced the concept of statistical analogues and proposed using a Weibull renewal process to identify volcanoes with similar inter-eruption repose times. This new approach, which was successfully implemented for forecasting VEI ≥3 eruptions at Tongariro (New Zealand), requires several observations (i.e., eruption dates) to estimate the three model parameters with any degree of precision.
In this study, we propose using hierarchical clustering to identify analogues quantitatively and objectively. Clustering algorithms have been used in volcanology for various applications, such as detecting patterns in seismic data (e.g., Unglert et al., 2016; Duque et al., 2020) or classifying volcanoes based on morphometric data (e.g., Grosse and Kervyn, 2018; Paguican et al., 2021). One of the main challenges when clustering data is that the most used algorithms, such as K-means, PAM, or GMM (Xu and Tian, 2015), require the optimal number of clusters to be selected before the application. To avoid this step, we used AGglomerative NESting (AGNES), a form of bottom-up hierarchical clustering that produces a dendrogram without having to pre-define the number of clusters. This advantage allows us to cut the dendrogram at a height that produces a cluster containing at least 50 potential analogues for Melimoyu. Another important advantage of using AGNES is that the dendrogram can be used to identify analogues for multiple target volcanoes at the same time, which could also help us understand why volcanoes are being grouped in each cluster.
Our application of hierarchical clustering focuses on identifying analogues for Melimoyu with the purpose of estimating the eruption f-M relationship. Finding analogues for data-limited volcanoes can be challenging since we cannot use the eruptive history of other volcanoes to identify analogues, especially if we want to avoid clustering volcanoes based on the number of available eruptions. For this reason, we rely on numerical variables that describe the tectonic setting, morphology, and rock composition to find similar volcanoes with the assumption that these factors control eruption rates and/or reflect the eruptive style and recent eruptive activity (Hughes and Mahood, 2008; Acocella and Funiciello, 2010; Hughes and Mahood, 2011; Acocella, 2014; Whelley et al., 2015; Sheldrake et al., 2020; Weber and Sheldrake, 2022). We compiled 181 variables for 1,428 volcanoes from multiple sources and applied AGNES to a selection of 37 numeric variables describing the rock composition, tectonic setting, and morphology of 438 subduction zone volcanoes (see Section 3.2).
The analysis consisted of three steps. First, a sensitivity analysis was performed using three different datasets to assess how the input data influence the definition of analogues and the performance of the clustering. Then, we compared the dispersion in the absolute eruption probability (i.e., the annual probability of an eruption of a given VEI) from the three sets of potential analogues. Next, the suitability of the analogue volcanoes was assessed by applying specific criteria considered important by SERNAGEOMIN and VB for being an analogue of Melimoyu (see Section 4.3), such as having a history of large explosive eruptions (VEI≥4) in the Holocene. Lastly, the eruption records from the analogues were used to model the eruption f-M relationship given by the absolute and conditional (i.e., relative probability of an eruption of a given VEI, conditional on an eruption has already taken place) probability.
This approach allows us to objectively group volcanoes based on similar volcanic characteristics, assess the goodness of the clustering using quantitative metrics while accounting for expert knowledge, and quantify the uncertainty in our analogue-derived estimates of eruption probabilities. Furthermore, we provide the global database (accessible in Supplementary Material S1) with 181 variables and 1,428 volcanoes so that our approach can be easily applied to other volcanoes or a different selection of variables.
In summary, this paper aims to:
1. Automatically identify analogue volcanoes quantitatively and objectively for Melimoyu.
2. Assess the influence of the input data on the clustering results through a sensitivity analysis.
3. Combine quantitative metrics and expert knowledge to assess analogue suitability.
4. Model the eruption f-M relationship for Melimoyu using eruption records from a selection of analogues.
SERNAGEOMIN will use the set of analogues and the eruption f-M relationship to inform the volcanic hazard matrix and official hazard map for Melimoyu. Future work will explore the application of Melimoyu’s analogues for populating an event tree and identifying eruption source parameters for a probabilistic long-term hazard assessment. The clustering results are also provided to SERNAGEOMIN so that the suitability of different potential analogues can be assessed for other data-limited volcanoes in Chile.
Melimoyu is a 2,408 m high ice-capped composite volcano with a 1-km wide crater summit and several parasitic cinder cones (GVP, 2013). The characteristic oblique subduction in the Chile Triple Junction, crustal thickness, and Liquiñe-Ofqui Fault Zone (LOFZ) (Figure 1A) are responsible for the variable nature of the volcanism, volcanic forms, and rock composition in this area (Cembrano and Lara, 2009; Völker et al., 2011; de Pascale et al., 2021). The LOFZ intra-arc fault system also controls the spatial distribution and the type of volcanism of the southern segment of the Southern Volcanic Zone (SVZ), from Villarrica in the north to Hudson in the south, with contrasting eruptive styles between volcanoes on the compressive side with wide ranges of compositions and volcanoes on the extensive side with more primitive magmas (López Escobar et al., 1995; Gutiérrez et al., 2005; Stern et al., 2007; Cembrano and Lara, 2009; de Pascale et al., 2021). The paleo-seismic Holocene record in the Aysén region shows that the triggering of several Holocene volcanic eruptions could be closely linked to earthquakes from the LOFZ and megathrust earthquakes (Watt et al., 2009; Wils et al., 2018).
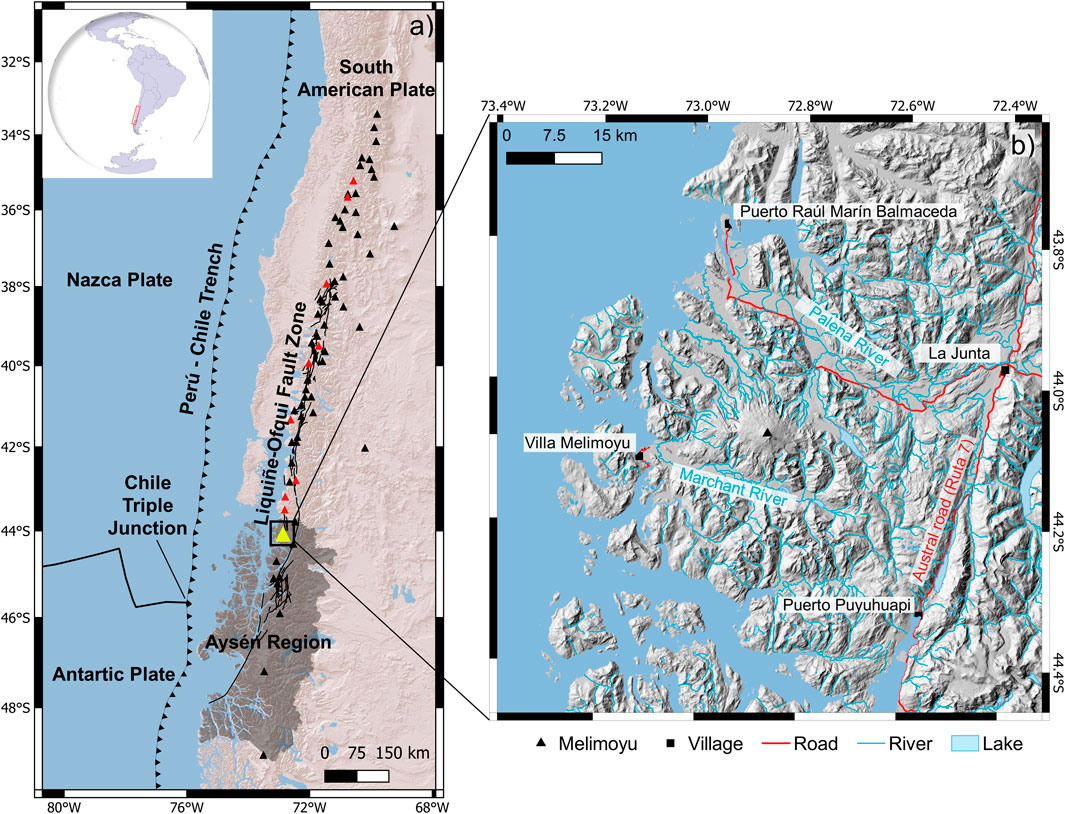
FIGURE 1. Map of the Southern Volcanic Zone (SVZ) (33°–46°S) (A) and surroundings of Melimoyu (B). Holocene volcanoes from the Volcanoes of the World Database (VOTW) are marked with black triangles, Melimoyu is marked with a yellow triangle in (A) and with a black triangle in (B), and analogues of Melimoyu in the SVZ are marked with a red triangle. Aysen region is highlighted in dark grey. Plate boundaries extracted from Bird. (2003), and active and potentially active faults from the Liquiñe-Ofqui Fault Zone (LOFZ) extracted from Maldonado et al. (2021) are represented with black lines. Basemap (A) ESRI Shaded Relief, (B) ALOS PALSAR DEM 12.5 m resolution.
The nearest towns of La Junta [1,431 inhabitants; Instituto Nacional de Estadísticas (2019)] and Puerto Raúl Marín Balmaceda [239 inhabitants; Instituto Nacional de Estadísticas (2019)] are located around 40 km to the east and 33 km to the northwest from the volcano (Figure 1B), respectively, in the sparsely populated region of Aysén [e.g., total population of 103,158 according to the last census from 2017 (Instituto Nacional de Estadísticas, 2019)]. Tephra fall deposits are found around these localities, suggesting that future eruptions could affect the population in this area and disrupt the Carretera Austral (Naranjo and Stern, 2004), which is the only road access to Aysén region (Rojas Hoppe and Subiabre, 1998). The little village of Villa Melimoyu, with around 100 inhabitants (Instituto Nacional de Estadísticas, 2019), located at Marchant River valley around 19 km southwest of the volcano, could also be affected by PDCs or lahars, given the explosive nature of Melimoyu (Naranjo and Stern, 2004; Watt et al., 2009) and the size of the glaciers in the volcanic edifice (Daros Idalino et al., 2020).
The Holocene record from Melimoyu contains two confirmed eruptions: 1) Mm-1 dated around 2.8 ka BP, and 2) Mm-2 dated around 1.6 ka BP (Naranjo and Stern, 2004; Geoffroy et al., 2018). Geoffroy et al. (2018) reported that the column height for Mm-1 and Mm-2 ranged between ∼30–35 km and ∼26–30 km, respectively, establishing that both eruptions had a VEI 5. In addition, several tephra layers found in lakes and rivers in the area, which dated ∼4.6–4.8 ka BP, ∼8.3 ka BP, and before the Last Glacial Maximum at >19,670 BP, have been attributed to Melimoyu due to similarities in the geochemistry, although their origin and size have not been confirmed (Stern et al., 2015; Weller et al., 2017).
The global database (Supplementary Material S1) includes 1,428 volcanoes categorised as Holocene in the VOTW database (v. 4.8.5; 11 February 2020) (GVP, 2013). We excluded 31 volcanoes from the analysis since they were discontinued from the Global Volcanism Program (GVP) Holocene Volcano List as of August 2021 because their evidence of Holocene activity was discarded. Our database contains 181 variables describing general information from each volcano and its Holocene eruption record, rock composition, tectonic setting, and morphology.
General information about each volcano and its Holocene eruptive history was obtained from the VOTW database (GVP, 2013). We included categorical variables describing the tectonic setting, morphology, and rock composition, the volcano location, date of the most recent eruption, range of VEI in the Holocene, number of eruptions as a function of VEI, and number of hazards and processes (i.e., events in GVP terminology).
The composition was compiled from the VOTW database (GVP, 2013) and the EarthChem Portal (http://www.earthchem.org, downloaded on 31 October 2022, using the parameters: Volcano Name = All volcanoes, Age = Holocene (0 Ma—0.01 Ma), Material= Whole rock/rock, and normalization= Major Elements as Reported).
The GVP lists a maximum of five rock types for each volcano, which were extracted by scraping the profiles from their website. Siebert et al. (2011) classified the composition into ten rock types: Andesite/Basaltic Andesite, Basalt/Picro-Basalt, Dacite, Foidite, Phono-tephrite/Tephri-phonolite, Phonolite, Rhyolite, Trachyandesite/Basaltic Trachyandesite, Trachybasalt/Tephrite Basanite, and Trachyte/Trachydacite. This categorical information was transformed into numerical data using a weighting scheme that accounts for the diversity of compositions and the relative abundance. Since the rock types in the GVP are listed in descending order of abundance (Siebert et al., 2011), we assumed that rock type 1 is five times more abundant than rock type 5 and assigned a weight ranging from five to one to each of the up to five rock types. We normalised the weights considering the number of rock types available per volcano and assigned them to each rock type. For example, West Eifel Volcanic Field (Germany) has the following rock types listed in order of descending abundance: Foidite, Trachybasalt/Tephrite Basanite, and Phonolite. Since there are three out of five possible rock types, we add 5, 4, and 3 to a total weight of 12. Then, we assigned 5/12 to Foidite, 4/12 to Trachybasalt/Tephrite Basanite, 3/12 to Phonolite, and zero to the remaining rock types not listed in the West Eifel Volcanic Field GVP profile.
From the dataset downloaded from EarthChem Portal, we filtered the igneous and volcanic samples and extracted the SiO2 wt%, from which we calculated the minimum, maximum, median, mean, mode, standard deviation, and variance across all the available samples per volcano. One limitation we found when downloading data from multiple volcanoes from the EarthChem portal is that the volcano name is not associated with the sample name. Therefore, we assume that a given sample belongs to the nearest volcano. To identify the nearest volcano, we used the distance matrix tool from QGIS, which calculates the distance between objects, setting the nearest target (k) to one. This distance can be saved by selecting the option linear in the output matrix type parameter of the tool. As a result, we have 2,090 samples distributed across 125 volcanoes. The number of samples per volcano ranges from 1 for each of 34 volcanoes to 281 for Vesuvius.
One of the variables compiled for the tectonic setting is the total crustal thickness (excluding the water layer) extracted from the Global Model of Earth’s Crust CRUST1 (Laske et al., 2013). We used the distance matrix tool in QGIS to identify the nearest data point (pair of coordinates set at 1°) from each volcano.
We also calculated the distance to the closest plate boundary classes (i.e., oceanic spreading ridge (OSR), oceanic transform fault (OTF), oceanic convergent boundary (OCB), continental rift boundary (CRB), continental transform fault (CTF), continental convergent boundary (CCB), and subduction zone (SUB)) from each volcano (Bird, 2003). We used the midpoints of each digitisation step [end point of PB2002.dat in Bird (2003)] as the reference point to calculate the distance. We also extracted the plate boundary identifier and the plate boundary class for the closest boundary class.
For volcanoes in subduction zones, we extracted 17 variables from Heuret (2006) describing the relative and absolute movement of plates at the nearest subduction arc segment (e.g., normal component of the subducting velocity), the age of the slab and the thermal parameter. The study by Heuret (2006) only includes non-perturbed subduction zones, which are those distant from a collision zone, ridge, or plateau subduction. Additionally, we used the same arc segment names from Heuret. (2006) to extract the variables slab length, slab pull force, Upper Plate Strain (UPS), and Upper Plate Nature (UPN) from Lallemand et al. (2005).
Lastly, we extracted the depth, dip, strike, and thickness of the slab at each subduction zone volcano from the Slab2 model developed by Hayes et al. (2018), which is available in the USGS ScienceBase catalogue (Hayes, 2018).
To describe the morphology, we used the database from Grosse et al. (2014) and Grosse and Kervyn (2018), which characterises the morphometry of composite, calderas, and shield volcanoes. The variables included in these databases describe the edifice size, profile shape, plan shape, and slope (Grosse et al., 2014). We updated the values in Grosse et al. (2014) with those from Grosse and Kervyn (2018) for volcanoes included in both studies. Seventeen of the 64 variables compiled from these studies are only available for calderas or composite volcanoes with large summit craters.
The input dataset for the clustering contains only volcanoes with data for all the selected variables since we do not allow missing values in the clustering. In addition, we only considered numerical variables in the analysis, excluding 16 categorical variables, three textual variables, and 13 identifiers. We also excluded ten uninformative variables, such as the number of elevation contours in Grosse et al. (2014). As discussed in the introduction, we want to avoid clustering volcanoes based on their degree of completeness, which, in the case of Melimoyu, would presumably produce analogues that are also data-limited volcanoes. Therefore, we excluded 36 variables related to eruptive history or style. We also excluded two sets of coordinates since we want to avoid grouping volcanoes by their proximity. Lastly, since our application of AGNES is targeted at Melimoyu, we excluded 31 variables with missing data for Melimoyu, among which we have the eight variables calculated from the data extracted from EarthChem.
The remaining variables are considered of interest for our case study. Since we do not allow missing data in the clustering and most tectonic setting variables describe characteristics of subduction zones, we automatically exclude volcanoes from other tectonic settings. Therefore, we only retain the distance to the nearest plate boundary (i.e., subduction zone) and exclude the other seven variables that measure the distance to different plate boundary types. Lastly, for variables accounting for duplicated information [e.g., edifice height, basal width, and height/basal width ratio from Grosse et al. (2014)], we preferentially selected variables not calculated as a function of other variables in the database, leading us to exclude 22 variables.
As a result of this filtering, we have 38 numerical variables (10 for rock composition, 14 for tectonic setting, and 14 for morphology) available for 438 subduction zone volcanoes. Note that Foidite is not included in the clustering because none of these volcanoes has records of this rock type in the VOTW database. The input dataset for Melimoyu can be accessed in Supplementary Material S2, and the complete list of 37 variables after excluding Foidite is listed in Table 1 and Figure 3.
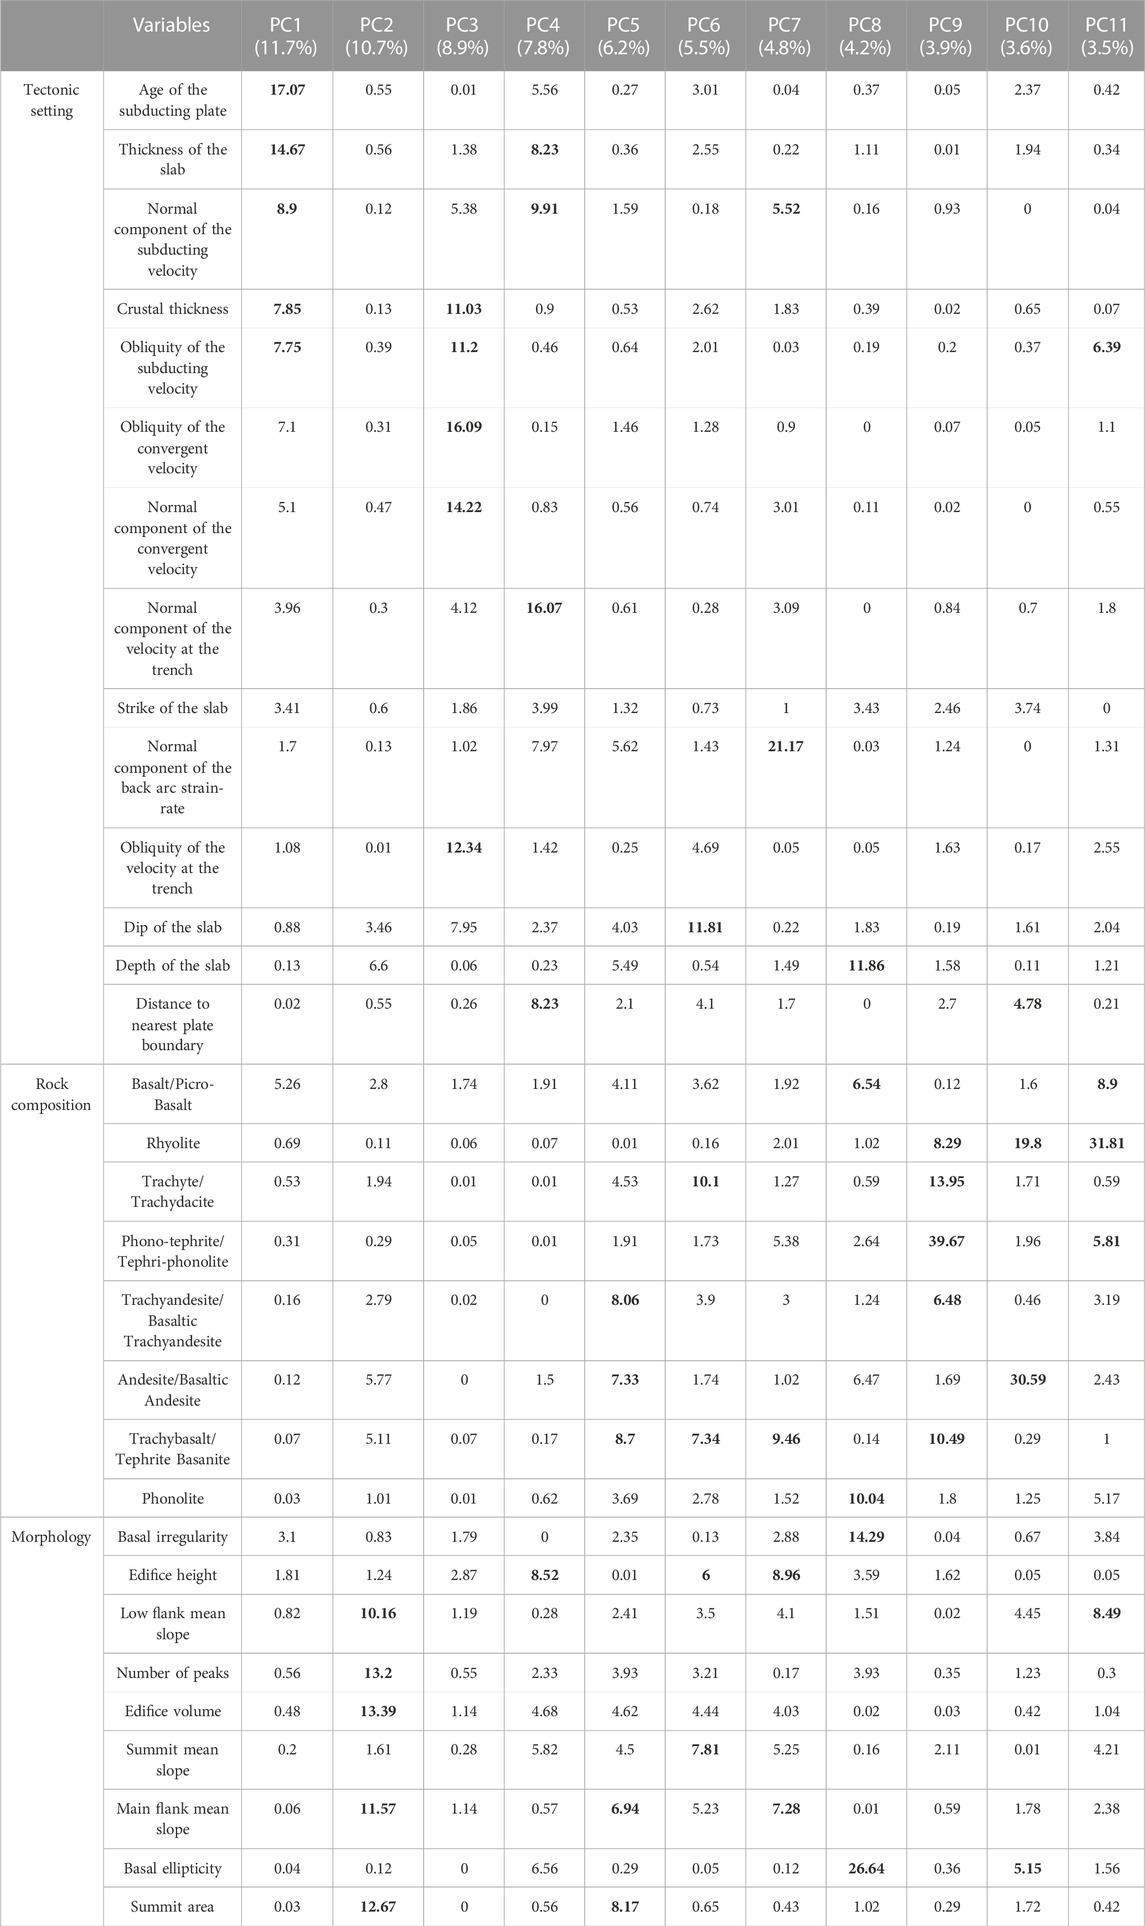
TABLE 1. Variable contribution (%) of each variable to explain the variability for the 11 PCs retained for the analysis. The value in parentheses in the first row indicates the percentage of explained variance by that PC. Values in bold indicate the top 5 variables with the higher contribution to each PC. Variables are grouped by category and ordered by descending contribution in PC 1.
In this study, we used AGNES, a bottom-up hierarchical clustering approach (Kaufman and Rousseeuw, 1991). The main advantage of hierarchical clustering is that it does not require the number of clusters to be pre-defined. We selected agglomerative instead of divisive hierarchical clustering because the former tends to identify smaller clusters (Boehmke and Greenwell, 2019). One disadvantage of agglomerative clustering is that it can be sensitive to outliers and noise, which we try to minimise by standardizing the data and using an appropriate distance metric. Another thing to consider is that the time and space complexity (i.e., computational cost) is high (Tan et al., 2016), which limits the size of the input data.
The first step before applying AGNES is to calculate the (dis)similarity matrix, which contains the distance among pairs of volcanoes. We selected the Manhattan distance metric because it performs better than the Euclidean distance for high-dimensional datasets (Aggarwal et al., 2001), and is less sensitive to outliers (Strauss and Von Maltitz, 2017).
In AGNES, each observation (volcano) starts as a single cluster (leaf). Then, based on the Manhattan distance, the most similar pair of volcanoes are grouped into a bigger cluster (node or branch). Lastly, the most similar clusters are merged iteratively until all the volcanoes are grouped into one big cluster (root). The (dis)similarity between clusters is determined by the linkage method. Some commonly used methods are average linkage, single linkage, complete linkage, and Ward’s linkage (we refer the reader to Kaufman and Rousseeuw (1991) for more details on each method). To select the best linkage method, we ran AGNES using these four methods and retained the results that produced the highest agglomerative coefficient–Ward’s linkage. The agglomerative coefficient describes the strength of the clustering structure, with values closer to 1 indicating a strong clustering structure (Kaufman and Rousseeuw, 1991).
The agglomerative coefficient can be considered a form of internal validation of the clustering since it measures the quality of the clustering structure without reference to external information (Boehmke and Greenwell, 2019). Another form of internal validation is assessing the clustering tendency of the input data (Banerjee and Davé, 2004). The clustering tendency evaluates if the dataset contains an inherent grouping structure. One metric used to assess the clustering tendency is the Hopkins statistic (H), which estimates the probability that the dataset is generated by a random uniform distribution (Lawson and Jurs, 1990). The input data are highly clusterable when H is close to 1. We used the agglomerative coefficient and Hopkins statistic metrics to compare the quality of the clustering results from the sensitivity analysis.
The output of AGNES is a dendrogram, a tree-based representation containing leaves, nodes, and the root. The height of the dendrogram (horizontal axis in Figure 2; Figure 5; Figure 6) represents the distance (i.e., (dis)similarity) between clusters. Note that the height values are not comparable between the dendrograms presented in this study because they are constructed using different input data. Therefore, the height can only be used to interpret the similarity between clusters within their dendrogram. The height at which we cut the dendrogram controls the number of clusters generated. Instead of searching for the optimal number of clusters, which is the main challenge when using other clustering algorithms, we found the height that generates a cluster of at least 50 potential analogues for Melimoyu. In this study, we want to avoid retaining larger numbers of potential analogues so the suitability assessment of individual volcanoes is not excessively time-consuming. Thanks to the flexibility of AGNES, future applications can adjust the number of analogues to fit their goal.
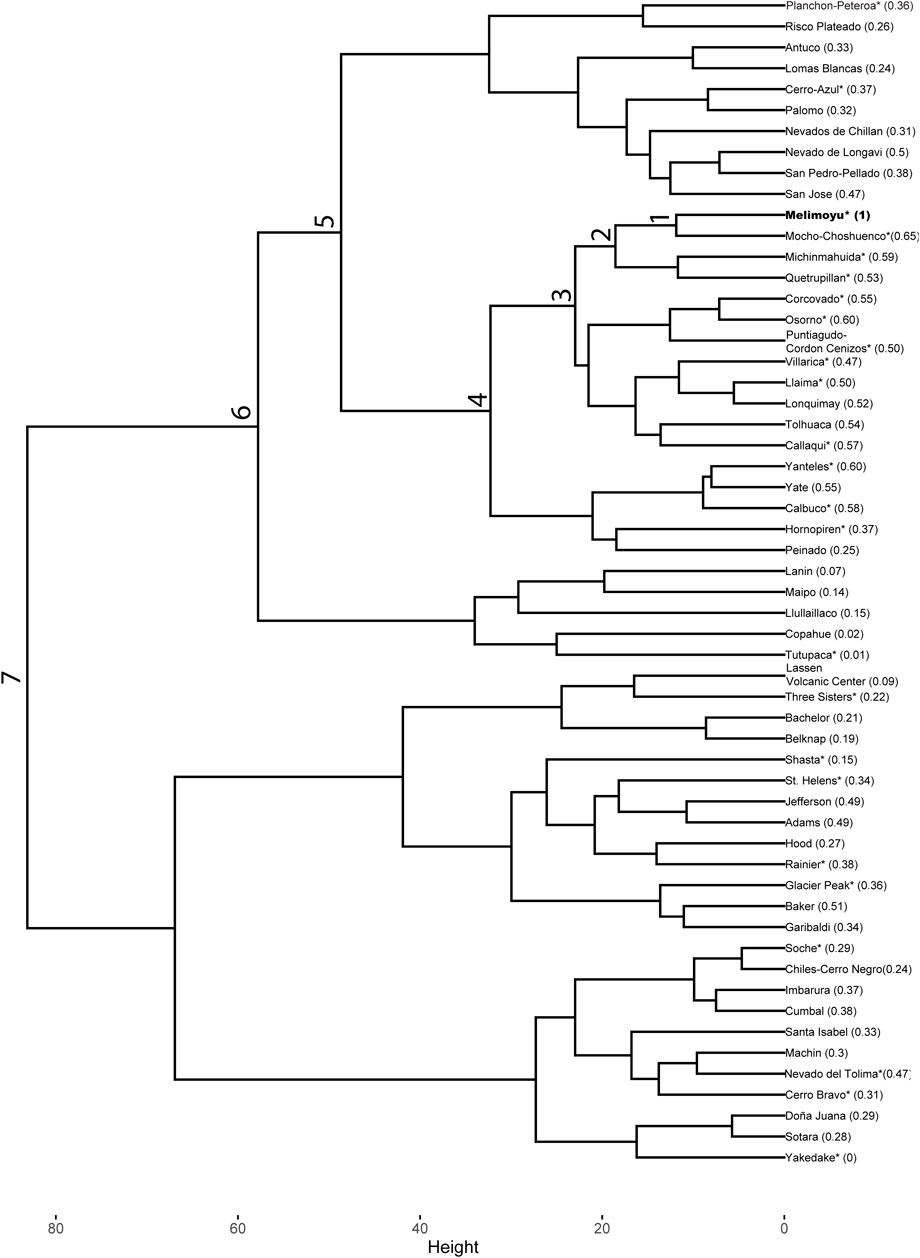
FIGURE 2. Dendrogram generated from the application of AGNES using Ward’s linkage method to the raw dataset. The value in parenthesis shows the normalised Manhattan distance (Mnorm). The closer Mnorm is to 1, the most similar to Melimoyu (highlighted in bold). The node number indicates the different levels of similarity between a given cluster and the smaller cluster that contains Melimoyu (Node 1). The asterisk indicates if a volcano has VEI≥4 Holocene eruptions records in the VOTW or LaMEVE database.
To compare the similarity between Melimoyu and the potential analogues, we normalised the Manhattan distance (Mnorm) via min-max normalisation as follows:
where the maximum, Mmax, and minimum value, Mmin, corresponds to the highest and lowest Manhattan distance, respectively, within the set of potential analogues, including Melimoyu (i.e., Mnorm ranges from 0 for the least similar volcano to 1 for Melimoyu).
We performed a sensitivity analysis on three different input datasets to assess how they change the outcome of the clustering, which are the proposed analogue volcanoes, and the quality of the results in terms of internal validation metrics.
The first application of AGNES was made on the selection of 37 variables. Each variable was standardised (i.e., centred and scaled) so that the distribution of the transformed data, known as z-score, had a mean of 0 and a standard deviation of 1 (Han et al., 2012). Standardising the data is an essential pre-processing step when using clustering models on data measured with different units, covering wide ranges of values, or in the presence of outliers since it has been shown to improve the quality of the clustering (Mohamad and Usman, 2013).
The preparation of the second input dataset consisted of two steps aimed at capturing the most important variables by excluding redundant variables and reducing noise in the data.
Firstly, we removed five redundant variables from the original dataset of 37 variables and standardised the dataset. The redundant variables were identified from the correlation between variables. As almost all the variables are non-normally distributed, we used Kendall’s Tau correlation coefficient (Chen and Popovich, 2002). Lastly, we classified the strength of the correlation as very weak (0<|r|<0.2), weak (0.2≤|r|<0.4), moderate (0.4≤|r|<0.6), strong (0.6≤|r|<0.8), and very strong (0.8≤|r|<1). We used |r|≥0.8 as the threshold to identify which redundant variables should be excluded from the Principal Component Analysis (PCA) so that there are no pairs of very strongly correlated variables in the input data. We remove the variable with the largest mean absolute correlation for very strongly correlated variables via the correlation_threshold function in cytominer R package (Becker et al., 2020). Although PCA can handle redundant variables, we preferred to include this step to ensure that all detrimental redundancies were removed from the dataset.
Secondly, we applied a PCA to the dataset derived from the first step. This approach is used to deal with the ‘curse of dimensionality’ before using clustering algorithms (Assent, 2012) by transforming the original variables into uncorrelated Principal Components (PC) through linear combination (Abdi and Williams, 2010). The PCA helps to improve the interpretability of high-dimensional datasets by reducing the dimensions and capturing the maximum possible variance of the original data. The number of PCs to retain for the analysis is often based on an arbitrary percentage of the cumulative variance. In this study, we used a threshold of 70% since it is a commonly used value (Jollife and Cadima, 2016), although other thresholds could be tested to assess the influence of the variance of the input data on the clustering. The coordinates or scores from each volcano in the retained PCs were used as input data for the clustering.
For the third dataset, we applied a weighting scheme on the raw dataset (i.e., 37 standardised variables) tuned to minimise the dispersion of the absolute probability from the set of potential analogues. With this approach, we acknowledge that each variable is unlikely to have an equal influence on the clustering of volcanoes with analogous eruptive behaviour (i.e., similar eruption f-M relationship).
The steps we followed were:
1. Draw a set of 37 weights from a uniform distribution and normalise so all weights add to one.
2. Apply AGNES using the best linkage method identified from the raw and reduced dataset (Ward’s linkage) with variables weights from step 1.
3. Extract a set of at least 50 potential analogues.
4. Estimate the absolute probability per VEI (i.e., the annual probability of an eruption of a given VEI) (PABS) for each analogue volcano i:
where nij is the number of recorded eruptions of a given VEI j (VEI<=1, VEI 2, VEI 3, VEI 4, and VEI>=5) and tij is the number of years between the Relative Completeness Date (RCD) and 2019. We calculate the regional RCDs (i.e., the most complete portion of the catalogue) from the VOTW database (GVP, 2013) as a function of each VEI j using the most abrupt change point method from Burgos et al. (2022b) and the 31 new regions proposed in their study (Supplementary Material S3).
5. Calculate the Interquartile Range (IQRj) of the absolute probability per VEI for the set of potential analogues, which captures the spread of the probabilities between the 25th and 75th percentile.
6. Calculate the total IQR by adding all IQRj.
7. Use 10,000 vectors of weights to identify the set of weights that minimises the total IQR.
When the target volcano is well-studied and has comprehensive records, this approach can be modified to identify the weights that maximise the similarity of the analogues’ absolute probabilities to the target volcano. We discarded this option for Melimoyu because it only has data to calculate the absolute probability of VEI 5 eruptions, meaning that we would be aiming to find other data-limited volcanoes.
The selection of analogues was made by assessing the dispersion in the absolute probability derived from the potential analogues (Figure 7) and applying criteria deemed as important by SERNAGEOMIN and VB to estimate the eruption f-M relationship for Melimoyu. These criteria were applied after the clustering to 1) avoid introducing subjectivity in the first stage of the analogue identification, and 2) identify potential analogues for other applications (e.g., hazard modelling).
For the purpose of estimating the eruption f-M relationship, a particular volcano had to meet the following criteria to be considered an analogue of Melimoyu:
a) The volcano has confirmed Holocene eruptions with an assigned VEI in the VOTW (GVP, 2013) or LaMEVE database (Crosweller et al., 2012). Otherwise, the eruptive behaviour cannot be evaluated.
b) The volcano is not categorised as frequently active [i.e., “confirmed to have erupted at some point during at least 25 of the past 100 years (since 1921)” (GVP, 2013)] on the set of noteworthy volcanoes of the GVP (https://volcano.si.edu/faq/index.cfm?question=eov_noteworthy). This criterion is especially relevant for estimating the eruption f-M relationship for Melimoyu since there is no evidence of eruptions in the last 100 years. With this criterion, we may be excluding analogue volcanoes that can be used for other purposes (e.g., retrieving eruption source parameters for hazard modelling).
c) The volcano has records of large explosive Holocene eruptions (VEI≥4) in the VOTW (GVP, 2013) or LaMEVE database (Crosweller et al., 2012).
d) The volcano has produced similar compositions to Melimoyu in the past. The GVP lists, in order of descending abundance, the following rock types for Melimoyu: Andesite/Basaltic Andesite, Dacite, and Basalt/Picro-Basalt. Depending on the information available in the GVP, if the volcano has data for:
• Rock types 1, 2 and 3: it must have at least two rock types in common with Melimoyu, and the most abundant rock type must be intermediate or felsic.
• Rock types 1 and 2: it must have both rock types in common with Melimoyu, independently of the order, but the most abundant rock type must be intermediate or felsic.
• Rock type 1: it must be Andesite/Basaltic Andesite.
Once we had the selection of analogues for Melimoyu, we manually updated the start date for those large magnitude eruptions (M≥4) that had corrected dates in the latest version of LaMEVE (retrieved 17 August 2022) (Crosweller et al., 2012). We also included M≥4 Holocene eruptions that were missing in the VOTW database but available in the LaMEVE database.
The updated record of confirmed eruptions since the RCDs from the selection of analogue volcanoes was used to re-calculate the absolute probability per VEI (PABS). The sum of the absolute probabilities per VEI from each analogue gives us the absolute probability of having an eruption of any VEI (P) at a given analogue volcano i:
Using the absolute probability, we calculated the conditional probability PCOND (i.e., the relative probability of a given VEI j, conditional on an eruption occurring) per analogue volcano i as follows:
where k indicates the VEI j with a
The absolute and conditional probabilities from the set of analogues were used to estimate the eruption f-M relationship for Melimoyu as follows:
1. Model the empirical absolute probability P from the set of analogues by a Gamma distribution, as proposed by Solow (2001) and Rodado et al. (2011), with parameters α (shape)>0 and λ (rate)>0 estimated via maximum likelihood. The probability density function of a gamma distribution is given by:
We extract the 5th, 50th, and 95th percentiles from the Cumulative Distribution Function (CDF), which reflects the uncertainty in the absolute probability for Melimoyu.
2. Quantify the variability in the conditional probability PCOND via bootstrapping with replacement (i.e., a datapoint can be included more than once in a resampled dataset). From the empirical conditional probabilities for n analogue volcanoes calculated from Eq. 4, we draw 5,000 bootstrap samples of size n and calculate the average conditional probability per VEI from each resampled dataset. We extract the 5th, 50th, and 95th percentiles from the marginal empirical CDF of the conditional probability for each VEI.
3. Calculate the absolute probability per VEI j for Melimoyu using the percentiles extracted from the modelled probabilities:
The agglomerative coefficient of the hierarchical clustering ranges from 0.778 for the single linkage method to 0.949 for Ward’s linkage method, indicating that the latter is the best linkage method. The agglomerative coefficient close to 1 indicates a strong clustering structure in the dendrogram derived from the raw dataset. This indication of good quality of the clustering is corroborated by the Hopkins statistics (H) of 0.848, which indicates that the raw dataset is highly clusterable.
We cut the dendrogram at the minimum height that contains at least 50 volcanoes, approximately 80, generating a set of 56 potential analogues, including Melimoyu (Figure 2). Within this set of potential analogues, we find seven nodes connected to Melimoyu’s smaller cluster (Node 1), which indicate different levels of similarity (i.e., the higher up in the tree the least similar to Node 1). Forty-two potential analogues are in the region of South America, 13 in Canada and Western United States, and 1 in Honshu (Japan).
Based on the normalised Manhattan distance shown in Figure 2 (i.e., the closer to 1, the more similar to Melimoyu), Mocho-Choshuenco (Chile) is the most similar volcano to Melimoyu (Mnorm=0.65) and therefore, the best analogue when using this method. The dendrogram captures this similarity since it is the first volcano to be grouped with Melimoyu. Osorno, Yanteles, Michinmahuida, Calbuco, and Callaqui, also located in Chile, follow closely with relatively similar distances.
Using Kendall’s Tau correlation coefficient to assess the relationship between the variables, the correlation matrix shown in Figure 3 shows that several variables describing the morphology of the base and the summit’s edifice are very strongly correlated. Since we aim to exclude redundant variables (i.e., |r|≥0.8), the following variables are not considered for the PCA: minor and major basal axis, basal width, basal area, and summit width.
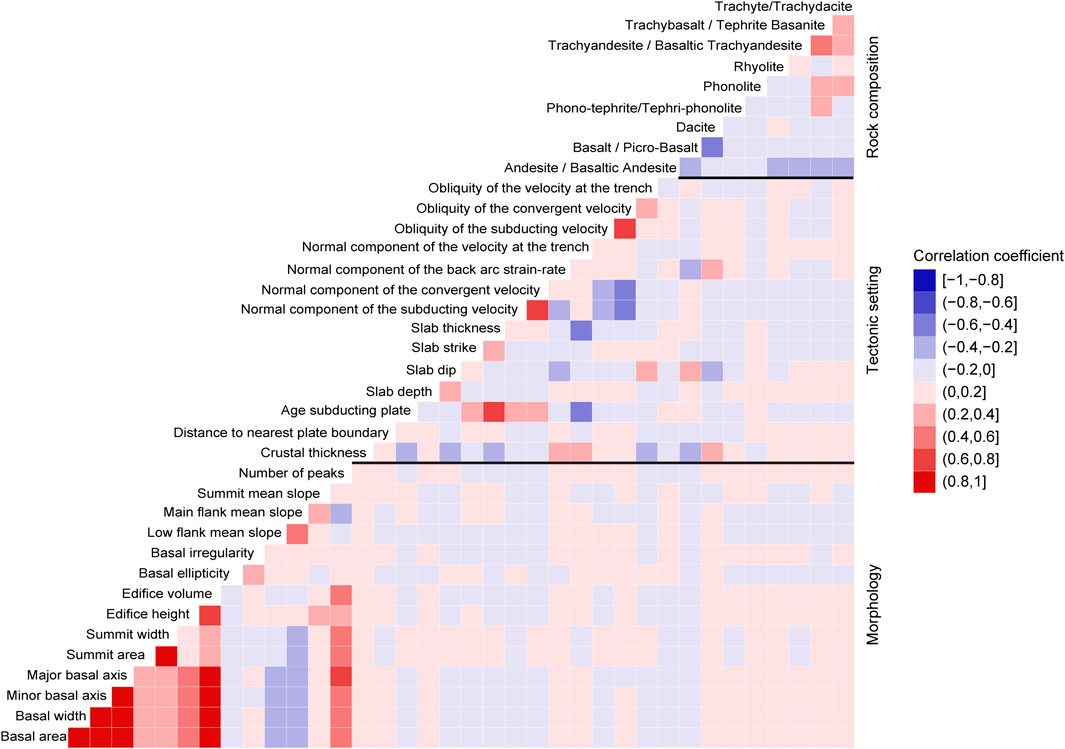
FIGURE 3. Kendall’s Tau correlation coefficient plot. Blue values indicate a negative correlation, and red values a positive correlation. The variables are grouped into three main categories: morphology, tectonic setting, and rock composition.
Other variables with a strong positive correlation are the age of the subducting plate and slab thickness, normal convergent and subducting velocity components, and the convergent and subducting obliquity. For the rock composition, we observe that Trachy-Andesite/Basaltic Trachyandesite and Trachybasalt/Tephrite Basanite have a moderate positive correlation. In contrast, Basalt/Picro-Basalt and Dacite have a moderate negative correlation. Basalt/Picro-Basalt and Dacite also show a weak correlation with the crustal thickness, slab dip, and the normal component of the back arc strain-rate.
The standardised dataset of 32 variables (without redundant variables) was used as input for the PCA. The results of the PCA show that the first two components explain around 22% of the variance (Figure 4). We require 11 PCs to capture at least 70% of the variance, which is one of the commonly used thresholds in PCA (Jollife and Cadima, 2016). Furthermore, the 11 PCs have an eigenvalue (i.e., variance retained by each PC) higher than one, indicating that they account for more variance than the original variables. The new spatial projection (Figure 4) does not show any obvious spatial clusters of volcanoes, which can be due to the low variance retained by PC 1 and 2. A low variance in the main PCs could indicate that our dataset does not lie within a two-dimensional linear subspace. One solution we explored was using non-linear dimensionality reduction techniques [(e.g., UMAP; (McInnes et al., 2020)]. However, these techniques required tuning hyper-parameters by looking at how the data is distributed in the space, leading to a biased selection that could influence the clustering results.
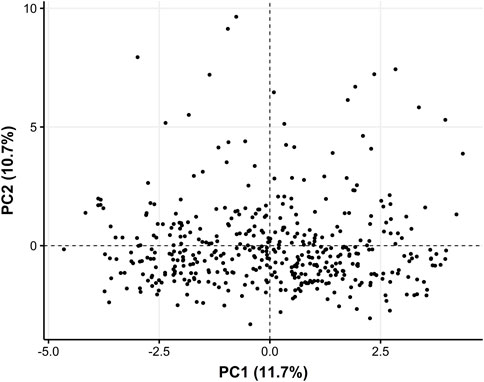
FIGURE 4. Representation of individual volcanoes projected in the PC1 and PC2. The value in parentheses indicates the percentage of explained variance by that PC.
Table 1 shows the percentage with which each variable contributes to explaining the variability in each PC (e.g., the age of the subducting plate explains ∼17% of the variability in PC1). We observe that variables describing the tectonic setting (e.g., age of the subducting plate, slab thickness, normal component of the subducting velocity, crustal thickness, and obliquity of the subducting velocity) contribute the most in accounting for the variability in PC1. In contrast, variables describing the volcano morphology (e.g., edifice volume, number of peaks, summit area, low flank mean slope, and main flank mean slope) have the highest contributions in PC2. Lastly, we observe that the composition contributes more to the later PCs.
The reduced dataset containing the coordinates of 438 volcanoes at the 11 PCs was used as input data for AGNES. The agglomerative coefficient ranges from 0.885 for single linkage method to 0.944 for Ward’s linkage method. As we did for the raw dataset, we select the hierarchical clustering results from Ward’s linkage method since it generates the strongest clustering structure. In addition, the Hopkins statistic (H=0.836) indicates that the reduced dataset is highly clusterable.
We cut the resulting dendrogram (Figure 5) at an approximate height of 40, producing a cluster of 51 volcanoes, including Melimoyu. This dendrogram contains groups of volcanoes with seven different levels of similarity relative to the smaller cluster containing Melimoyu (Node 1). Twenty-one potential analogues are in the region of Mexico, Guatemala, Nicaragua, Costa Rica, and Panama; 14 in South America; 13 in El Salvador and Honduras; 2 in Luzon; 1 in North Luzon, Central Philippines, Mindanao, and SE Asia; and 1 in Canada and Western United States. The volcano with the highest normalised Manhattan distance (i.e., best analogue) (Mnorm=0.73) is Tolhuaca (Chile). Other volcanoes with relatively high distance values (e.g., Mnorm=0.60–0.66) are Lonquimay, Callaqui, Mocho-Choshuenco, and Llaima.
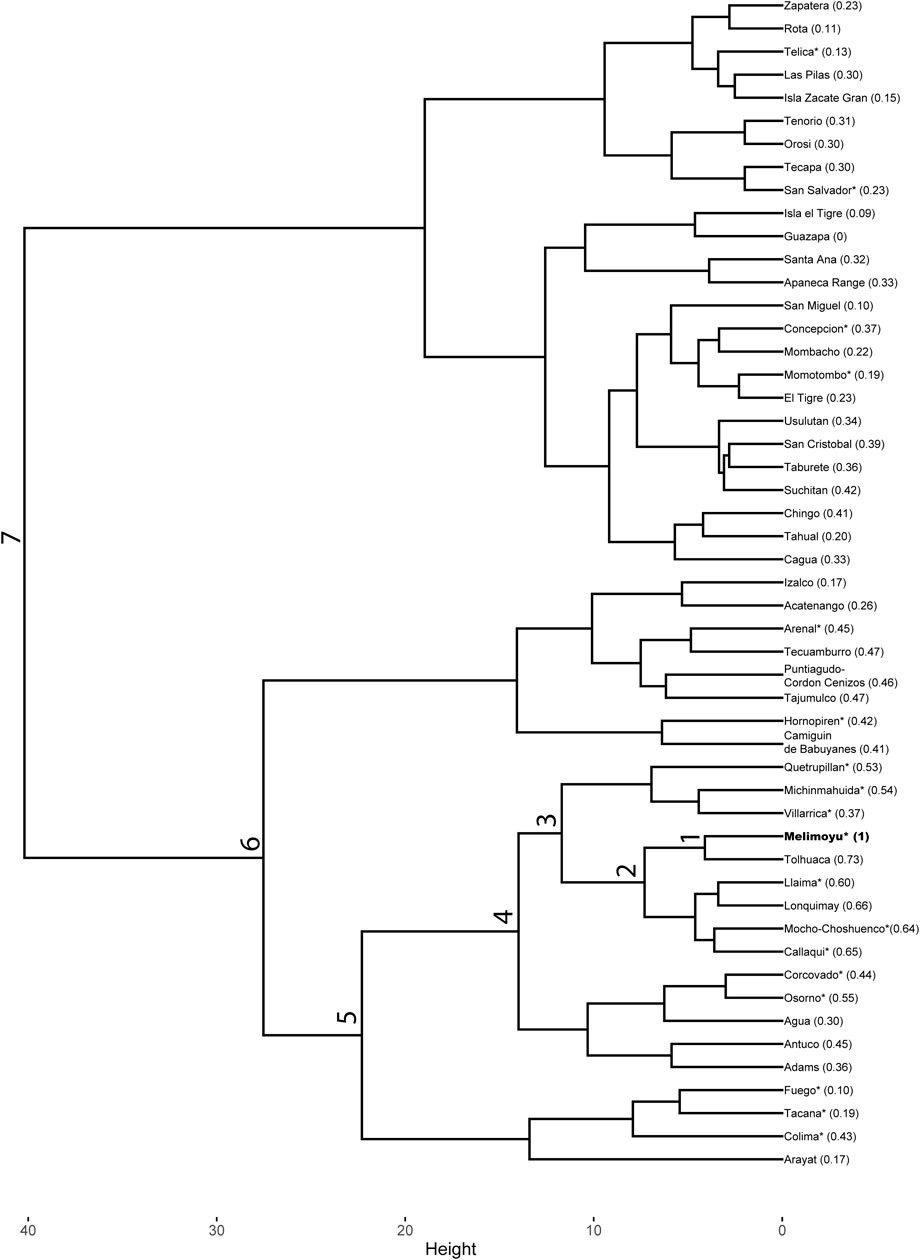
FIGURE 5. Cut dendrogram generated from the application of AGNES using Ward’s linkage method to the reduced dataset. The value in parenthesis shows the normalised Manhattan distance (Mnorm). The closer Mnorm is to 1, the most similar to Melimoyu (highlighted in bold). The node number indicates the different levels of similarity between a given cluster and the smaller cluster that contains Melimoyu (Node 1). The asterisk indicates if a volcano has VEI≥4 Holocene eruptions records in the VOTW or LaMEVE database.
To optimize the set of weights that minimise the spread in calculated absolute eruption probabilities across the set of analogues, we first need to account for the completeness of the eruption record. The most complete portion of the VOTW database was identified by calculating regional RCDs as a function of VEI≤1, VEI 2, VEI 3, VEI 4, and VEI ≥5 using the change point method from Burgos et al. (2022b). The RCDs (Supplementary Material S3) define the time windows required for estimating absolute probabilities for the set of potential analogues. The resulting RCDs range from a few centuries [e.g., 1979 for VEI 3 eruptions in Africa (northern, western, central)] to thousands of years (e.g., 4700 BCE for VEI 4 eruptions in New Zealand), and they are highly variable across regions and eruption sizes.
We use Ward’s linkage method, which produced the highest agglomerative coefficients in the previous two datasets, instead of testing the four linkage methods to reduce the computation time in optimising the weighting scheme. The complete set of weights that generates the set of analogues with the lowest total IQR (0.01214) is available in Supplementary Material S4. Another 11 weighting schemes that can also be found in Supplementary Material S4 produce similar IQR (0.1224). We will focus on the results derived from the weighting scheme that produces the lowest IQR. We observe that the three most ‘important’ variables (i.e., top 3 highest weights) are the obliquity of the velocity at the trench, the basal irregularity, and the normal component of the convergent velocity.
The dendrogram obtained from the weighted dataset has an agglomerative coefficient of 0.947 and a Hopkins statistic of 0.833, indicating a strong clustering. We cut the dendrogram at an approximate height of 2 generating a set of 61 volcanoes, including Melimoyu (Figure 6). We find seven levels of similarity relative to the smaller cluster containing Melimoyu (Node 1). Fifty-nine potential analogues are in the region of South America; 1 in Luzon; and 1 in North Luzon, Central Philippines, Mindanao, and SE Asia. The most similar volcano based on the normalised distance metric is Mocho-Choshuenco (Mnorm = 0.62). Other similar volcanoes are Michinmahuida, Callaqui, Calbuco, and Osorno, with a normalised distance ranging from 0.54 to 0.58.
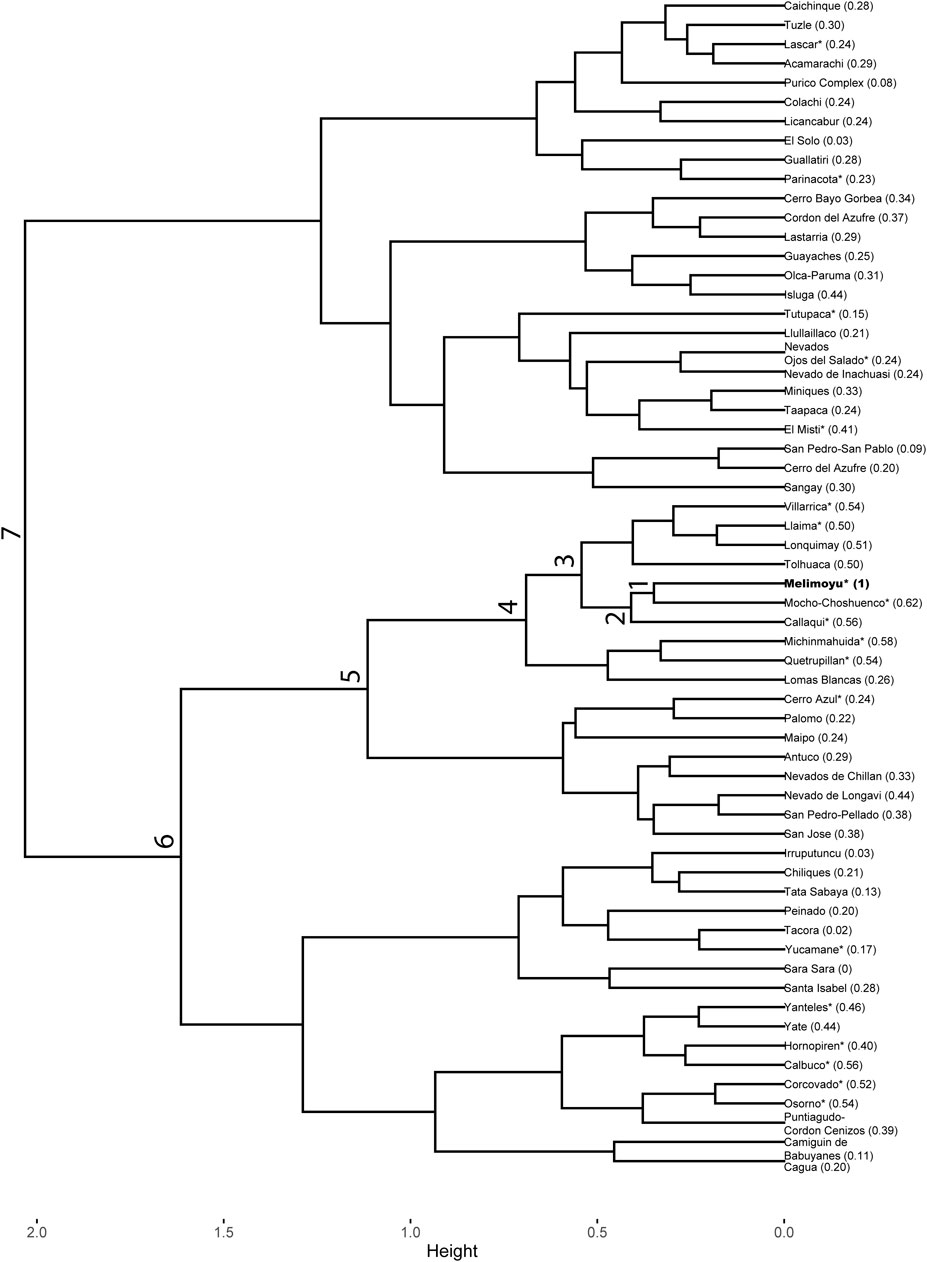
FIGURE 6. Cut dendrogram generated from the application of AGNES using Ward’s linkage method to the weighted dataset. The value in parenthesis shows the normalised Manhattan distance (Mnorm). The closer Mnorm is to 1, the most similar to Melimoyu (highlighted in bold). The node number indicates the different levels of similarity between a given cluster and the smaller cluster that contains Melimoyu (Node 1). The asterisk indicates if a volcano has VEI≥4 Holocene eruptions records in the VOTW or LaMEVE database.
The sensitivity analysis shows that the quality of the results, in terms of clustering performance, is very similar for the three datasets, with slightly higher values of the agglomerative coefficient and Hopkins statistic for the raw dataset. In the three cases, these internal validation metrics indicate inherent clustering in the data and a strong clustering structure in the dendrograms. These results were obtained using Ward’s linkage method, which groups clusters with minimum total-within variance, known for its tendency to produce compact clusters (Kaufman and Rousseeuw, 1991).
A comparison of the potential analogues derived from the sensitivity analysis shows that 13 volcanoes are present in the three sets of potential analogues (Antuco, Callaqui, Corcovado, Hornopiren, Llaima, Michinmahuida, Mocho-Choshuenco, Osorno, Lonquimay, Puntiagudo-Cordon Cenizos, Quetrupillan, Tolhuaca, and Villarrica), all of them located in the SVZ. In addition, another 14 volcanoes are present in the sets derived from the raw and weighted dataset, two in the sets derived from the reduced and weighted dataset, and one in the sets derived from the raw and reduced dataset.
As a first step for selecting the analogues for Melimoyu, we analyse the dispersion in the absolute probabilities per VEI estimated from each set of potential analogues (Figures 2, 5, 6). The dispersion in the absolute probability shown in Figure 7 informs us about the difference in the eruptive behaviour between the volcanoes in the three sets of potential analogues. The absolute probabilities for all the potential analogues generated from the three different input datasets can be found in Supplementary Material S5. As expected, the set of potential analogues derived from the weighted dataset, which was tuned to obtain the lowest aggregate IQR, produced lower uncertainties, except for VEI≥5 eruptions. In contrast, the set of analogues from the reduced dataset produced the most dispersed absolute probabilities, indicating that the volcanoes proposed as analogues have notably different recurrence rates per VEI class. These results could indicate that the retained PCs did not preserve the information that is more important for constructing clusters of similar volcanoes. Meanwhile, the dispersion from the analogues derived from the raw dataset is between that of the other two datasets. We observe that the absolute probability decreases with the eruption size, with a difference of several orders of magnitude between some volcanoes with VEI≤1 and VEI≥5.
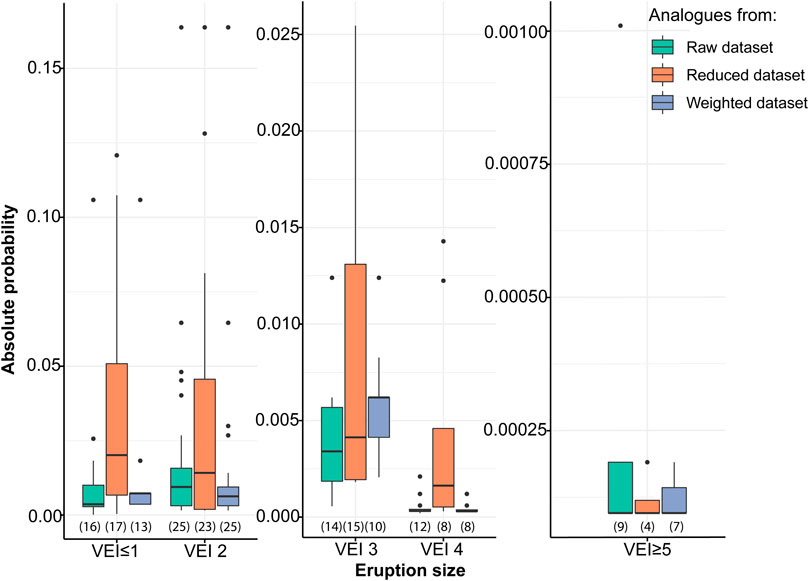
FIGURE 7. Comparison of the absolute annual probability
After analysing the dispersion in Figure 7, we apply the criteria for being an analogue of Melimoyu (Section 4.3). In addition to Melimoyu, we find that 20 out of 55 volcanoes, 8 out of 50 volcanoes, and 13 out of 60 volcanoes obtained from the raw dataset, reduced dataset, and weighted dataset, respectively, meet these criteria (see Supplementary Material S5 for the three lists of potential analogues).
Due to the large dispersion in the absolute probability and the low number of volcanoes meeting the criteria, we discard the set of potential analogues derived from the reduced dataset. The other two sets of potential analogues have a similar range of absolute probabilities, although the dispersion is slightly lower for the analogues derived from the weighted dataset (Figure 7). However, more volcanoes derived from the raw database meet the criteria for being analogues. Therefore, we retain the results from the raw dataset and conclude that it contains the best selection of analogues to calculate the empirical eruption f-M relationship for Melimoyu.
The selection of 20 analogues that meet the criteria, ordered from more to less similar (i.e., highest to lowest normalised Manhattan distance in Figure 8), are Mocho-Choshuenco, Yanteles, Michinmahuida, Calbuco, Callaqui, Corcovado, Quetrupillán, Nevado del Tolima, Rainier, Cerro Azul, Hornopirén, Glacier Peak, Planchón-Peteroa, St. Helens, Cerro Bravo, Doña Juana, Soche, Three Sisters, Shasta, and Yakedake. These volcanoes are located in the regions of South America (n = 14), Canada and Western United States (n = 5), and Honshu (n = 1).
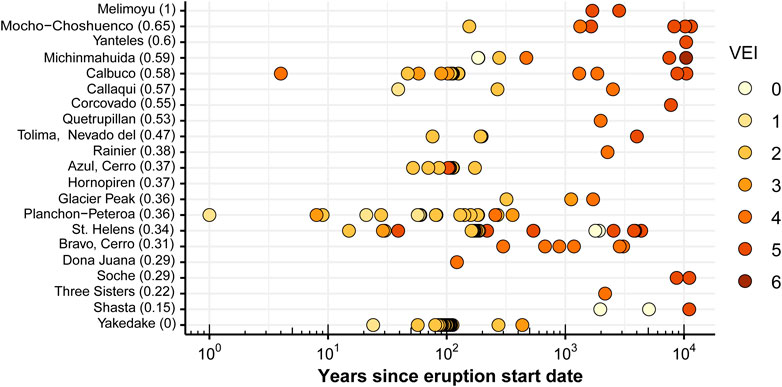
FIGURE 8. Confirmed eruptions within the most complete eruption record from the analogue selection. These data were used for estimating the absolute and conditional probabilities in Figure 9. Volcanoes are listed in descending order of Mnorm in parenthesis (i.e., more to less similar to Melimoyu). The origin of the x-axis corresponds to 2019.
The eruption records from the selection of analogues derived from the raw dataset are used to calculate the empirical eruption f-M relationship (Figure 8). All the 20 analogues, except for Hornopirén, have at least one confirmed eruption within the complete portion of the eruption record (i.e., since the RCD in Table 2). From a total of 133 eruptions produced by all these volcanoes since the regional RCDs, nine eruptions missing in the VOTW database were added from LaMEVE, and the start date from 11 eruptions was updated with the corrected radiocarbon dates from LaMEVE. As a result of these modifications, we changed the RCD for VEI≥5 eruptions in South America, which was defined as the oldest eruption in the region (i.e., from −8,460 to −9,941). Therefore, the VEI≥5 absolute probabilities estimated for volcanoes in South America are slightly higher than those estimated with the updated RCD (e.g., 1.9 × 10⁻⁴ vs. 1.7 × 10⁻⁴ for Michinmahuida in tabs “Analogues raw dataset” and “Analogue selection” in Supplementary Material S5).
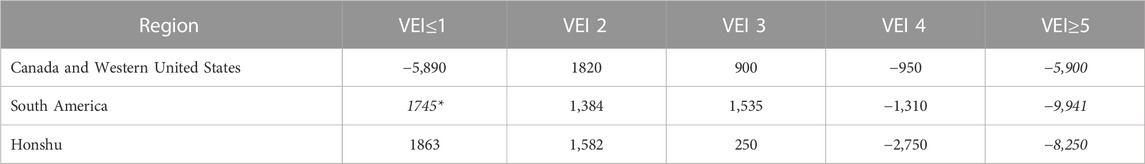
TABLE 2. Relative Completeness Dates (RCDs) used to calculate the probabilities in Figure 8. Dates in regular font indicate that the RCD corresponds to the most abrupt change point, dates in cursive indicate that the RCD corresponds to the oldest eruption, and dates with an asterisk in cursive indicate that the RCD correspond to an alternative change point. See Burgos et al. (2022b) for the method.
The eruption record presented in Figure 8 and the RCDs in Table 2 were used to estimate the absolute and conditional probability for each analogue (Figure 9). We observe that, with the exception of VEI≤1, the absolute probability decreases as the eruption size increases (Figure 9A). The absolute probability varies up to one order of magnitude between analogues, except for VEI≤1 and VEI 5 eruptions, which vary up to two orders of magnitude. Following the trend observed in Figure 9A, the overall range of conditional probabilities decreases for larger VEIs (Figure 9B). We observe that several volcanoes, such as Corcovado, have a 100% conditional probability of VEI 4 or VEI≥5 eruptions because they do not have records from other eruption sizes within the complete portion of the catalogue (Figure 8).
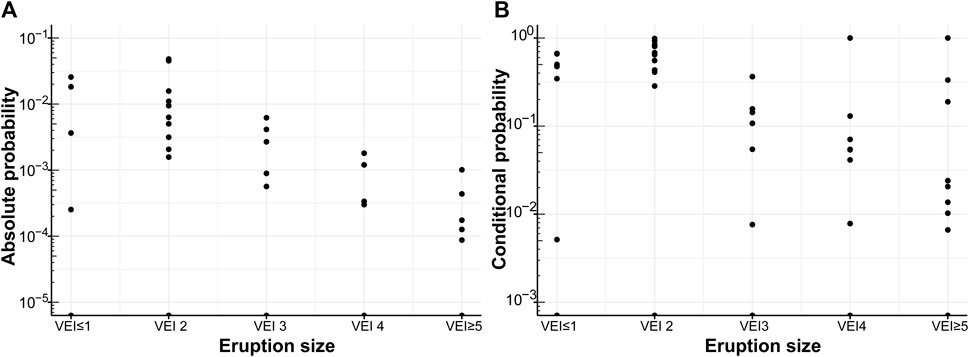
FIGURE 9. Absolute (A) and conditional probability (B) per VEI from each volcano in the analogue selection with eruption data within the complete portion of the catalogue. The number of data points for VEI≤1, 2, 3, 4, and ≥5 is 6, 10, 6, 11, and 11, respectively.
The eruption f-M relationship and eruption probability estimate for Melimoyu is shown in Figure 10 and Table 3. The absolute probability of having an eruption of any VEI at Melimoyu can be modelled by the gamma distribution in Figure 10A with shape parameter (α) 0.369 and rate (β) 32.96. The 5th, 50th, and 95th percentiles extracted from the CDF give an absolute probability of 6.55 × 10⁻⁶, 3.68×10⁻³, and 4.78 × 10⁻², respectively. The low value of the median probability (i.e., on average, one eruption every 272 years) reflects the low frequency of eruptions at Melimoyu, indicating that long periods of dormancy are common across the selection of analogues.
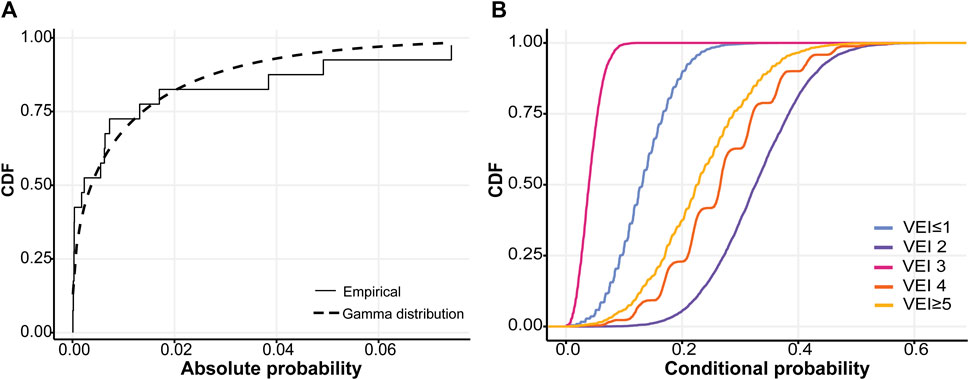
FIGURE 10. Cumulative Distribution Function (CDF) of the absolute probability of an eruption of any VEI (A) and empirical CDF of the conditional probability of a VEI given there is an eruption (B).
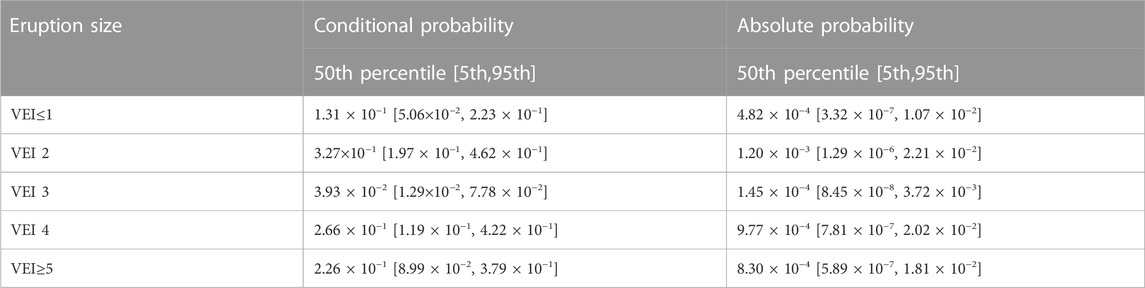
TABLE 3. Conditional and absolute probability of having an eruption of a given VEI at Melimoyu.
Meanwhile, the empirical CDFs in Figure 10B derived from bootstrap sampling show that the median conditional probability is the highest for VEI 2 eruptions, likely because it is the default value assigned in the VOTW database to explosive eruption without detailed descriptions (Siebert et al., 2011). The lowest conditional probabilities correspond to VEI 3 followed by VEI≤1, which might be explained by the lower number of volcanoes (n = 6) with records from eruptions of these sizes. Assuming that an eruption occurs at Melimoyu, there is a 49% probability that the VEI is equal to or larger than four (50th percentile of the conditional probability) (Table 3). The distribution of the conditional probabilities derived from the analogue volcanoes captures the tendency to produce large explosive eruptions at Melimoyu.
By multiplying the absolute and conditional probability, we obtain the absolute probability of an eruption of a given VEI, which ranges from 1.45 × 10⁻⁴ for VEI 3 eruptions to 1.2 × 10⁻³ for VEI 2 eruptions (Table 3). The absolute probability for VEI 4 and VEI≥5 eruptions is similar, with a median average recurrence interval given by the inverse of the absolute probability of 1,024 and 1,204 years, respectively.
One limitation of hierarchical clustering is that it does not allow for missing values in the input data, limiting our application to complete cases (i.e., we only include volcanoes without missing data for the selected variables). Therefore, the variables and number of potential analogues used as input in the clustering are limited by the available data for each volcano. For example, when searching analogues for Melimoyu, only volcanoes in subduction zones are considered potential analogues since we include variables in the clustering that are only descriptive of this tectonic setting (e.g., the geometry of the slab). This is not considered a significant limitation in this study since the tectonic setting plays a key role in factors such as the magma budget, plumbing system configuration, and the rock composition, which partly controls the eruption style and recurrence in volcanic arcs (Acocella, 2014; Sheldrake and Caricchi, 2017; Sheldrake et al., 2020; Weber and Sheldrake, 2022). Similarly, the morphometric variables included in the global database are available only for shields, calderas, and composite volcanoes (Grosse et al., 2014; Grosse and Kervyn, 2018). Other volcano types are not included in the analysis, even though composite volcanoes, like Melimoyu, often have secondary volcanic features, such as parasitic cones and fissures. Unfortunately, these secondary features are rarely characterised and not included in global databases.
Not considering volcanoes in other tectonic settings or with different morphologies does not mean that they cannot be analogues of Melimoyu. These volcanoes could have been included in the clustering at the expense of excluding numerical variables that capture the variability across volcanoes within subduction zones and across composite and shield volcanoes. However, increasing the number of volcanoes included in the input data implies reducing the number of input variables since few are available across all volcanoes. For example, only the primary volcano type and tectonic setting from the VOTW database (GVP, 2013), which are categorical variables, the crustal thickness from Laske et al. (2013), and the distance to plate boundaries from Bird (2003) are available for the 1,428 volcanoes listed in the global database. Even the variable rock type 1 from the VOTW database is missing for 76 out of 1,428, meaning that rock composition would not be considered in the clustering if we included all the volcanoes. A potential solution would be to identify the input dataset that maximises the number of variables and volcanoes.
The flexibility of AGNES and the straightforward application allow us to adjust the variables based on the available data for future applications of this approach to other target volcanoes. The number of variables for target volcanoes with data mostly limited to categorical information can be increased by transforming these variables into numerical variables via one-hot encoding or gathering new data (e.g., spreading rate for mid-ocean ridges or morphometric parameters for other volcano types). Alternatively, other clustering algorithms that allow combining categorical and numerical variables could be tested (e.g., k-prototypes), although they require pre-defining the number of clusters, adding another level of iteration.
The dendrograms from the raw and weighted dataset (Figures 2, 6) indicate that the most similar volcano, and, therefore, best analogue, is Mocho-Choshuenco (Chile). Mocho-Choshuenco is a compound stratovolcano covered by glaciers, located 460 km from Melimoyu. The morphology of both volcanoes is very similar (Figures 11E,H), except for the summit area and edifice height (Figures 11G,H). The difference in the summit area can be explained by the fact that Grosse et al. (2014) calculated the morphology of the summit of Mocho-Choshuenco including both peaks. Like Melimoyu, Mocho-Choshuenco also has parasitic craters and basaltic scoria cones on the flanks, indicating monogenetic volcanism (Rawson et al., 2015). Both volcanoes have similar values for multiple parameters of the tectonic setting [e.g., crustal thickness, slab dip, slab depth, and normal component of the velocity of the subducting plate (Figures 11A–D)]. We also see a strong similarity in the rock composition, with the rock types included in the GVP being identical in both volcanoes.
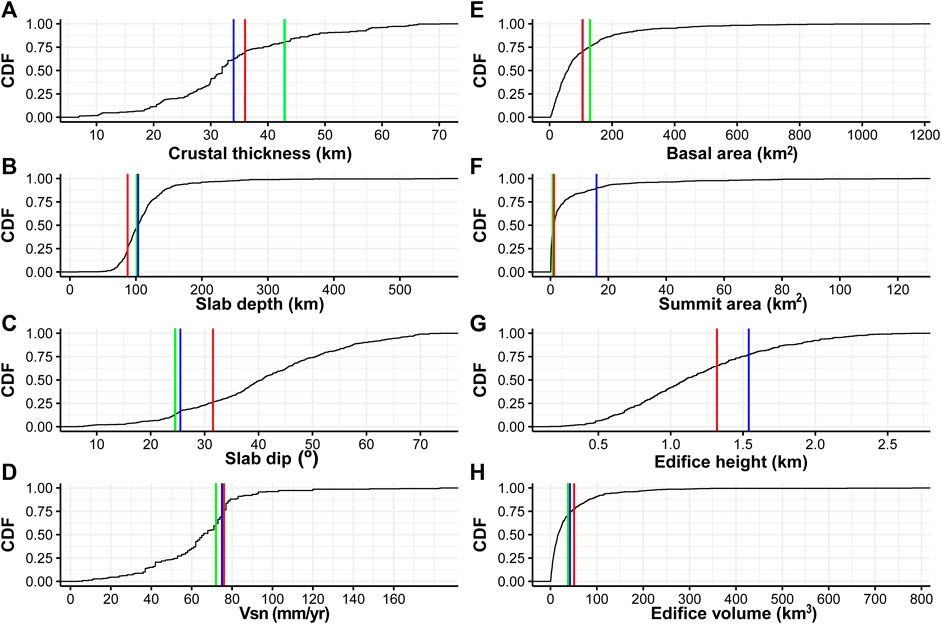
FIGURE 11. Empirical CDF for a selection of tectonic setting parameters (A–D) and morphological parameters (E–H) from the 438 subduction zone volcanoes included in the input dataset of the clustering. The red, blue, and green lines indicate the value for Melimoyu, Mocho-Choshuenco, and Tolhuaca, respectively. Note: x-axes are in different scales.
The VOTW database only reports two confirmed Holocene eruptions from Mocho-Choshuenco, the most recent in 1937 of unknown eruption size. The previous eruption, reported from historical observations in 1864, was classified as a VEI 2. Both eruptions were reported for Mocho stratovolcano. In addition, LaMEVE reports another three Holocene eruptions dated in 1265 BP ± 110, 1580 BP±115, and 8202 BP±220, with a Magnitude of 4.6 (VEI 4), 5 (VEI 5), and 5.3 (VEI 5), respectively. Close to the Holocene boundary, there are two more Plinian eruptions dated in 10189 BP ±1,361 and 11391 ± 1,002, of Magnitude (M) 5.3 (VEI 5), and 5.7 (VEI 5), respectively. In addition to the data reported in the global databases, Rawson et al. (2015) report at least 34 post-glacial explosive eruptions, making Mocho-Choshuenco one of the most hazardous volcanoes from Chile in terms of the capacity to produce Plinian eruptions.
Using the reduced dataset as input, the dendrogram (Figure 5) shows that the most similar volcano to Melimoyu is Tolhuaca (Chile). Tolhuaca is a snow-capped stratovolcano in the vicinity of Lonquimay, also a potential analogue, 648 km from Melimoyu. We observe similar morphometric variables of Tolhuaca and Melimoyu (Figures 11E–H). Regarding the tectonic setting variables, both volcanoes share similar values of slab depth, slab dip, and normal component of the velocity of the subducting plate (Figures 11B–D). The composition from the GVP indicates that Tolhuaca produces mostly Andesite/Basaltic Andesite and Basalt/Picro-Basalt, although there is evidence of Dacites (Polanco et al., 2000). According to the VOTW database, Tolhuaca has four confirmed eruptions in the Holocene, the most recent corresponding to the post-glacial (after 4000 BCE) basaltic activity (VEI 0) from the Pumehua volcanic trend located in the NW flank of Tolhuaca (Naranjo (pers, comm. 2000) in Melosh et al. (2012)). The remaining eruptions have been classified as VEI 3. There is no evidence of historical eruptions, but there is currently fumarolic activity at the summit (Polanco et al., 2000; Sanchez-Alfaro et al., 2016).
The selection of the 20 analogues for Melimoyu derived from the raw dataset was made by assessing the similarity in the eruptive behaviour reflected in the dispersion of the absolute probability (Figure 7) and filtering the set of potential analogues with the set of criteria in Section 4.3. The variability in the results obtained from different input datasets shows the importance of combining expert knowledge with quantitative and objective approaches when assessing the suitability of analogue volcanoes.
From the 55 potential analogues in Figure 2, 14 volcanoes were excluded because they lack confirmed eruptions in the VOTW and LaMEVE database or only have eruptions without VEI, and we cannot use them to estimate an eruption f-M relationship. Therefore, 25% of the set of potential analogues are data-limited volcanoes. This could be seen as a limitation in our approach since we are not excluding volcanoes with scarce records from the clustering by not considering the eruptive history when defining analogues. However, we think this is an advantage of our approach since it allows for finding potential analogues for data-limited volcanoes and identifying where future geological studies could focus, assuming that these analogues have similar eruptive behaviour, and we are missing eruptions from these data-limited volcanoes. Furthermore, by not accounting for the eruptive behaviour in the input data, we can also identify analogues for potentially active volcanoes. This advantage is especially important for regions where eruptions from potentially active volcanoes are relatively frequent. This is the case for the volcanic region of South America, where nearly 40% of all the Holocene volcanoes are potentially active, and on average, a potentially active volcano has its First Recorded Eruption in the Holocene (FRESH) every 8 years (Burgos et al., 2022a).
The criteria for filtering volcanoes into the analogue selection were defined with the goal of finding suitable analogues for estimating the empirical eruption f-M relationship. This approach led to excluding Llaima and Villarrica, two frequently active volcanoes with a history of large explosive eruptions (VEI≥4) in the Holocene. Due to their current persistent activity and open-vent state (Witter et al., 2004; Ruth et al., 2016), they cannot be considered analogues of Melimoyu in terms of eruption recurrence, especially from small explosive eruptions in Villarrica (see outlier for VEI≤1 and 2 eruptions from the raw dataset in Figure 7). However, the activity in Villarrica and Llaima has shifted between predominantly explosive to effusive and explosive episodes over time (Lara and Clavero, 2004; Lohmar et al., 2005; Lohmar et al., 2006; Schindlbeck et al., 2014). These changes in eruption regimes suggest that Villarrica and Llaima might be in a different life stage than Melimoyu, meaning they could be analogues over longer timeframes covering regime changes with varying activity levels.
New methods for identifying analogues could integrate a temporal component to account for volcanic system life stages and cyclical changes, moving from a static to a dynamic analogue concept. Future work could explore the possibility of identifying ‘timeless’ and ‘contemporary’ analogues depending on whether the variables used remain constant or change within time windows shorter than the geological time scale (e.g., tectonic setting vs. morphology).
Despite the differences in the current eruptive behaviour, the eruption history from volcanoes like Villarrica and Llaima can be useful for probabilistic modelling of volcanic hazards at Melimoyu, providing data that inform the range of eruption characteristics that may be expected in the future. For example, eruption source parameters to model scenarios lacking in Melimoyu’s records (e.g., effusive, or low explosive eruptions).
Ten out of 20 of the analogues, including Melimoyu, are in the SVZ (Figure 1A), suggesting that the characteristics of the tectonic setting strongly control the clustering. The influence that the Chile Triple Junction and the LOFZ have in the nature and distribution of volcanism in the SVZ (López Escobar et al., 1995; Gutiérrez et al., 2005; Stern et al., 2007; Cembrano and Lara, 2009; de Pascale et al., 2021), may explain why numerous volcanoes in this area share similar characteristics with Melimoyu.
Similarities in the tectonic setting are also observed among the volcanic arcs where the 20 analogues are located (Cascades, Northern Andes, Southern Andes, and Honshu). The range of some tectonic setting variables for our analogues, such as the age of the subducting plate (from 10 to 42 Ma) or the crustal thickness (from ∼32 to 54 km), seems large. However, this range is relatively small compared to the global values from all the volcanic arcs (∼5–156 Ma; ∼6–73 km). The similarity in these values from analogues in distinct geographic settings shows that the clustering can identify patterns in the data describing the tectonic setting while making distinctions among volcanic arcs.
Numerous studies have discussed the role tectonics play in the volcanism of subduction zones (e.g., Hughes and Mahood, 2008; Hughes and Mahood, 2011; Acocella. 2014; Sheldrake et al., 2020). Heuret and Lallemand (2005) and Lallemand et al. (2005) discussed the relationship between the different components of subduction zones, some of which have also been found among the 438 volcanoes from our study (Figure 3) (e.g., age of the subducting plate and the slab thickness). The importance of the tectonic setting in the generation of different magma compositions (Hughes and Mahood, 2008; Sobradelo et al., 2010; Hughes and Mahood, 2011; Sheldrake et al., 2020) is also reflected in the weak correlation between the crustal thickness, slab dip, the normal component of the back arc strain-rate, and the presence of Basaltic and Dacitic magmas (Figure 3). The age of the subducting plate, slab and crustal thickness, subducting velocity, and convergence obliquity were also highlighted by the PCA as variables contributing the most to explaining the variance in PC1 (Table 1). Some of these variables also had more importance (i.e., higher weights in Supplementary Material S4) when producing the minimum dispersion in the absolute probability from the analogues derived from the weighted dataset (Figure 7).
The conditions of the tectonic setting are key to developing long-lived and large plumbing systems capable of generating large-magnitude explosive and caldera-forming eruptions (de Silva, 2008; Hughes and Mahood, 2008; Hughes and Mahood, 2011; Weber and Sheldrake, 2022). According to Sheldrake et al. (2020), the crustal thickness, the age of the subducting plate, and the convergent obliquity influence the production of large-magnitude eruptions (4≤M≤7). Their study establishes that volcanic arcs can be classified into two groups with a distinct potential of having large magnitude eruptions based on the parameter H (i.e., a combination of the age of the slab and movement of the subduction plate). High-H regime volcanic arcs, characterised by low obliquity and moderate slab ages, are more likely to generate large-magnitude eruptions. The probability of producing large-magnitude eruptions in these volcanic arcs is strongly controlled by the convergent obliquity. In contrast, in low-H regimes, volcanic arcs with low mantel productivity and oblique convergence, the probability of generating large magnitude eruptions is lower and increases with the crustal thickness. Honshu arc, where Yakedake is located, is classified as High-H regime by Sheldrake et al. (2020). In contrast, the Cascades, Northern Andes, and Southern Andes arcs, where 19 analogues are located, are classified by Sheldrake et al. (2020) as low-H regimes and have notably similar slopes of the eruption f-M relationship (2.5<α<3 in their Figure 9D). These findings further support our decision to consider these volcanoes as analogues and explain why many potential analogues can produce large explosive eruptions.
Using eruption records from multiple analogues allows for defining the uncertainty around the eruption f-M relationship estimations for Melimoyu. Relying on a small selection of analogues, as we do in this study, instead of global analogues defined from broad categories, has been proven effective for reducing the uncertainty in the probability estimations (Hayes et al., 2022). However, we must be cautious when interpreting the range of probabilities given by the eruption f-M relationship since, for some eruption sizes, the difference between the 5th and 95th percentile can be of several orders of magnitude (Table 3). This uncertainty can result from the variability in the eruption recurrence resulting from distinct eruptive behaviour or different degrees of data completeness among volcanoes, which is partially accounted for by using only eruption records since the RCD.
The discrepancies in the eruption data reported for Mocho-Choshuenco in the VOTW database, the LaMEVE database, and Rawson et al. (2015) show the importance of not relying only on global databases when assessing the volcanic hazard at individual volcanoes. While we used all available eruption data for Melimoyu and restricted our calculation of eruption probability to only the most complete portion of the VOTW database for all the analogues, we still recognise that the eruption probabilities presented in this study may have been under-estimated if eruption records are missing from any of the analogues. Differences among sources further support our decision to exclude the eruptive history from the VOTW database in the clustering input. Under-reporting in global databases can limit the ability of methods that define analogues based on eruption data from the VOTW database or LaMEVE (e.g., Tierz et al., 2019; Wang et al., 2022) to capture all or even the most appropriate analogues.
Identifying analogues for data-limited volcanoes is essential to reduce the uncertainty of volcanic hazard assessments. Analogues have been typically defined using categorical information and broad classes, which can lead to numerous analogues and large uncertainties in probability estimations. We have combined an objective and quantitative approach to identify groups of analogues that include Melimoyu, our volcano target of study, using agglomerative hierarchical clustering with an assessment of suitability based on the dispersion of probability estimates and expert knowledge.
This algorithm was applied to 37 variables describing the tectonic setting, rock composition, and morphology of 438 subduction zone volcanoes, including Melimoyu. A sensitivity analysis was performed using a raw, reduced, and weighted dataset to assess how the potential analogues change with the input data. We found that applying a PCA before the clustering (i.e., reduced dataset) generates a group of potential analogues with highly dispersed absolute probabilities. In contrast, the dispersion for the absolute probability estimated from the analogues derived from the raw and weighted dataset is lower. As expected, the dispersion is the lowest for the analogues from the weighted dataset since the weights were tuned to minimise the variability in the absolute probabilities across the set of analogues.
After applying the set of criteria deemed as important by SERNAGEOMIN and VB for modelling the eruption f-M relationship for Melimoyu (i.e., available eruption data, history of large explosive eruptions, not frequently active, and a similar range of magma composition), we retain 20 analogues from the raw dataset, eight from the reduced dataset, and 13 from the weighted dataset. Considering the dispersion and the number of volcanoes that meet the criteria, we select the set of 20 volcanoes from the raw dataset as the best analogues for Melimoyu. The clustering of these volcanoes is strongly controlled by the characteristics of the tectonic setting at the volcanic arcs where they are located, which plays a key role in the eruption f-M relationships (Sheldrake et al., 2020). Furthermore, the influence of the Liquiñe-Ofqui Fault Zone on the volcanism of the Southern Volcanic Zone in Chile (Cembrano and Lara, 2009; Völker et al., 2011; de Pascale et al., 2021) explains why most of the analogues are from this area.
The eruption f-M relationship modelled from the analogue’s eruption data reflects the low frequency of eruptions at Melimoyu and the history of highly explosive eruptions. For example, the probability of an eruption of any VEI is 3.68 × 10⁻³ (50th percentile) (i.e., average recurrence interval of ∼272 years), which indicates long periods of recurrence between eruptions. Additionally, the conditional probability distribution indicates that in the event of an eruption at Melimoyu, there is a 49% probability that it will have a VEI≥4 (50th percentile), reflecting the potential for large explosive eruptions at Melimoyu. Lastly, the product of the absolute and the conditional probability produces an annual probability of 4.8 × 10⁻⁴, 1.2 × 10⁻³, 1.5 × 10⁻⁴, 9.8 × 10⁻⁴, and 8.3 × 10⁻⁴ (50th percentile) for VEI≤1, VEI 2, VEI 3, VEI 4, and VEI≥5 eruptions at Melimoyu, respectively.
The eruption f-M relationship presented in this study constitutes an important step towards preparing the official hazard map for Melimoyu. In addition, the probabilities and the analogues reported in this study will be used by SERNAGEOMIN to establish the recurrence of different eruptive scenarios that could be expected if Melimoyu reactivates. Future work will explore using the proposed analogues for Melimoyu to build a probabilistic event tree and define ESP for modelling volcanic hazards.
This study shows that using quantitative variables when defining analogues is essential to capture the diversity among volcanoes, helping to find smaller groups of volcanoes within broad categories and reducing the uncertainty in the eruption f-M relationship estimates. This approach can be combined with other proposed methods and expert knowledge to fine-tune the selection of analogues. Furthermore, the agglomerative hierarchical clustering can be easily applied to other volcanoes allowing the user to select multiple variables from the global database made available here.
The datasets presented in this study can be found in online repositories. The names of the repository/repositories and accession number(s) can be found in the article/Supplementary Material.
VB, SJ, LB, CP, MB, CN, AA, and BT contributed to the project idea, goals, and objectives. VB developed the methodology with input from SJ, LB, CP, MB, JP, and BT. VB processed the data, analysed the results, prepared the figures, and wrote the manuscript. All authors listed have made a substantial, direct, and intellectual contribution to the work and approved it for publication.
This research was supported by the Earth Observatory of Singapore via its funding from the National Research Foundation Singapore and the Singapore Ministry of Education under the Research Centres of Excellence initiative. This work comprises EOS contribution number 504. MB was supported by the Resilience to Nature’s Challenges Volcano program, New Zealand (contract number GNS-RNC047).
We are grateful to the reviewers for their thoughtful and constructive comments which improved the manuscript, and to Nico Fournier and Valerio Acocella for their editorial handling of the manuscript. We would also like to thank Pablo Tierz, Tom Sheldrake, Elly Tennant, and Christina Widiwijayanti for the fruitful discussions about volcanic analogues. We are also grateful to Constanza Jorquera Flores for the insightful meetings about Melimoyu. Previous versions of this manuscript are published online in the form of thesis (Burgos, 2022) and preprint (Burgos et al., 2023).
The authors declare that the research was conducted in the absence of any commercial or financial relationships that could be construed as a potential conflict of interest.
All claims expressed in this article are solely those of the authors and do not necessarily represent those of their affiliated organizations, or those of the publisher, the editors and the reviewers. Any product that may be evaluated in this article, or claim that may be made by its manufacturer, is not guaranteed or endorsed by the publisher.
The Supplementary Material for this article can be found online at: https://www.frontiersin.org/articles/10.3389/feart.2023.1144386/full#supplementary-material
AGNES, AGglomerative NESting; CDF, Cumulative Distribution Function; GVP, Global Volcanism Program; f-M, frequency-Magnitude; IQR, Interquartile Range; LOFZ, Liquiñe-Ofqui Fault Zone; M, Magnitude; PC, Principal Component; PCA, Principal Component Analysis; PDC, Pyroclastic Density Current; RCD, Relative Completeness Date; SVZ, Southern Volcanic Zone; VEI, Volcanic Explosivity Index; VOTW, Volcanoes of the World.
Abdi, H., and Williams, L. J. (2010). Principal component analysis. Wiley Interdiscip. Rev. Comput. Stat. 2, 433–459. doi:10.1002/wics.101
Acocella, V., di Lorenzo, R., Newhall, N., and Scandone, R. (2015). An overview of recent (1988 to 2014) caldera unrest: Knowledge and perspectives. Rev. Geophys. 53, 896–955. doi:10.1002/2015rg000492
Acocella, V., and Funiciello, F. (2010). Kinematic setting and structural control of arc volcanism. Earth Planet Sci. Lett. 289, 43–53. doi:10.1016/j.epsl.2009.10.027
Acocella, V. (2014). Structural control on magmatism along divergent and convergent plate boundaries: Overview, model, problems. Earth Sci. Rev. 136, 226–288. doi:10.1016/j.earscirev.2014.05.006
Aggarwal, C. C., Hinneburg, A., and Keim, D. A. (2001). “On the surprising behavior of distance metrics in high dimensional space,” in Database theory — icdt 2001. Editors J. van den Bussche, and V. Vianu (Berlin, Heidelberg: Springer), 420–434. doi:10.1007/3-540-44503-X_27
Assent, I. (2012). Clustering high dimensional data. WIREs Data Min. Knowl. Discov. 2, 340–350. doi:10.1002/widm.1062
Banerjee, A., and Davé, R. N. (2004). “Validating clusters using the Hopkins statistic,” in IEEE international conference on fuzzy systems (Budapest: Spinger), 149–153. doi:10.1109/FUZZY.2004.1375706
Bebbington, M. S., and Jenkins, S. F. (2022). Intra-eruption forecasting using analogue volcano and eruption sets. J. Geophys Res. Solid Earth 127. doi:10.1029/2022JB024343
Bebbington, M. S. (2014). Long-term forecasting of volcanic explosivity. Geophys J. Int. 197, 1500–1515. doi:10.1093/gji/ggu078
Becker, T., Goodman, A., McQuin, C., Rohban, M., and Singh, S. (2020). cytominer: Methods for image-based cell profiling_. Avaliable At: https://CRAN.R-project.org/package=cytominer.
Bird, P. (2003). An updated digital model of plate boundaries. Geochem. Geophys. Geosystems 4, 1027. doi:10.1029/2001GC000252
Boehmke, B., and Greenwell, B. (2019). “Hierarchical clustering,” in Hands-on machine learning with R (New York: Chapman and Hall/CRC). doi:10.1201/9780367816377
Burgos, V., Jenkins, S. F., Bebbington, M., Newhall, C., and Taisne, B. (2022b). A new perspective on eruption data completeness: Insights from the first recorded EruptionS in the Holocene (FRESH) database. J. Volcanol. Geotherm. Res. 431, 10764. doi:10.1016/j.jvolgeores.2022.107648
Burgos, V., Jenkins, S. F., Bebbington, M., Newhall, C., and Taisne, B. (2022a). What is the probability of unexpected eruptions from potentially active volcanoes or regions? Bull. Volcanol. 84, 97. doi:10.1007/s00445-022-01605-0
Burgos, V., Jenkins, S. F., Bono Troncoso, L., Perales Moya, C. V., Bebbington, M., Newhall, C., et al. (2023). Identifying analogues for Melimoyu, a long-dormant and data-limited volcano in Chile, through hierarchical clustering. ArXiv. doi:10.31223/X57M15
Burgos, V. (2022). Overcoming data scarcity for probabilistic eruption forecasting at data-limited volcanoes. Doctoral thesis. Singapore: Nanyang Technological University. doi:10.32657/10356/166192
Cembrano, J., and Lara, L. (2009). The link between volcanism and tectonics in the southern volcanic zone of the Chilean Andes: A review. Tectonophysics 471, 96–113. doi:10.1016/j.tecto.2009.02.038
Chen, P. Y., and Popovich, P. M. (2002). Correlation: Parametric and nonparametric measures. Thousand Oaks: SAGE Publications, Inc, 07–139.
Crosweller, H. S., Arora, B., Brown, S. K., Cottrell, E., Deligne, N. I., Guerrero, N. O., et al. (2012). Global database on large magnitude explosive volcanic eruptions (LaMEVE). J. Appl. Volcanol. 1, 4. doi:10.1186/2191-5040-1-4
Daros Idalino, F., Kellem da Rosa, K., Ferrando Acuña, F., Kozhikkodan Veettil, B., Cardia Simões, J., and Souza, E. (2020). Recent glacier variations on mount Melimoyu (44°50’s-72°51’W), Chilean patagonia, using sentinel-2 data. Geocarto Int. 35, 1199–1213. doi:10.1080/10106049.2018.1557262
de Pascale, G. P., Froude, M., Penna, I., Hermanns, R. L., Sepúlveda, S. A., Moncada, D., et al. (2021). Liquiñe-Ofqui’s fast slipping intra-volcanic arc crustal faulting above the subducted Chile Ridge. Sci. Rep. 11, 7069–7112. doi:10.1038/s41598-021-86413-w
de Silva, S. (2008). Arc magmatism, calderas, and supervolcanoes. Geology 36, 671–672. doi:10.1130/focus082008.1
Duque, A., González, K., Pérez, N., and Benítez, D. S. (2020). “Understanding the cotopaxi volcano activity with clustering-based approaches,” in IEEE Colombian conference on applications in computational intelligence, communications in computer and information science. Editors A. D. Orjuela-Cañón, J. Lopez, J. D. Arias-Londoño, and J. C. Figueroa-García (Cham: Springer International Publishing), 3–15. doi:10.1007/978-3-030-69774-7
Geoffroy, C. A., Alloway, B. v., Amigo, À., Parada, M. A., Gutierrez, F., Castruccio, A., et al. (2018). A widespread compositionally bimodal tephra sourced from Volcán Melimoyu (44° S, Northern Patagonian Andes): Insights into magmatic reservoir processes and opportunities for regional correlation. Quat. Sci. Rev. 100, 141–159. doi:10.1016/j.quascirev.2018.09.034
Geoffroy, C. (2017). Eruptive parameters and pre-eruptive processes for late Holocene activity centred at Melimoyu Volcano, Southern Chile (44°05’ S). Master thesis. Santiago de Chile: Universidad de Chile.
Grosse, P., Euillades, P. A., Euillades, L. D., and van Wyk de Vries, B. (2014). A global database of composite volcano morphometry. Bull. Volcanol. 76, 784–816. doi:10.1007/s00445-013-0784-4
Grosse, P., and Kervyn, M. (2018). Morphometry of terrestrial shield volcanoes. Geomorphology 304, 1–14. doi:10.1016/j.geomorph.2017.12.017
Gutiérrez, F., Gioncada, A., González Ferran, O., Lahsen, A., and Mazzuoli, R. (2005). The Hudson Volcano and surrounding monogenetic centres (Chilean Patagonia): An example of volcanism associated with ridge-Trench collision environment. J. Volcanol. Geotherm. Res. 145, 207–233. doi:10.1016/j.jvolgeores.2005.01.014
Global Volcanism Program (2010). “Report on Melimoyu (Chile),” in Weekly volcanic activity report, 9 june-15 june 2010. Editor Sennert, S. K. (Smithsonian Institution and US Geological Survey). Available at: https://volcano.si.edu/showreport.cfm?wvar=GVP.WVAR20100609-358052.
Han, J., Kamber, M., and Pei, J. (2012). “Data preprocessing,” in Data mining: Concepts and techniques (Morgan kaufmann), 83–124. doi:10.1016/B978-0-12-381479-1.00003-4
Hayes, G. P., Moore, G. L., Portner, D. E., Hearne, M., Flamme, H., Furtney, M., et al. (2018). Slab2, a comprehensive subduction zone geometry model. Science 362, 58–61. doi:10.1126/science.aat4723
Hayes, G. (2018). Slab2: A comprehensive subduction zone geometry model. Avaliable At: https://www.sciencebase.gov/catalog/item/5aa1b00ee4b0b1c392e86467 (accessed 11 8, 21).
Hayes, J. L., Jenkins, S. F., and Joffrain, M. (2022). Large uncertainties are pervasive in long-term frequency-magnitude relationships for volcanoes in southeast Asia. Front. Earth Sci. 10, 1–19. doi:10.3389/feart.2022.895756
Herman, F., and Brandon, M. (2015). Mid-latitude glacial erosion hotspot related to equatorial shifts in southern Westerlies. Geology 43, 987–990. doi:10.1130/G37008.1
Heuret, A. (2006). Dynamique des zones de subduction: étude statistique globale et approcheanalogique. Tectonique. Université Montpellier II - Sciences et Techniques du Languedoc.
Heuret, A., and Lallemand, S. (2005). Plate motions, slab dynamics and back-arc deformation. Phys. Earth Planet. Interiors 149, 31–51. doi:10.1016/j.pepi.2004.08.022
Hone, D. W. E., Mahony, S. H., Sparks, R. S. J., and Martin, K. T. (2007). Cladistic analysis applied to the classification of volcanoes. Bull. Volcanol. 70, 203–220. doi:10.1007/s00445-007-0132-7
Hughes, G. R., and Mahood, G. A. (2011). Silicic calderas in arc settings: Characteristics, distribution, and tectonic controls. Bull. Geol. Soc. Am. 123, 1577–1595. doi:10.1130/B30232.1
Hughes, G. R., and Mahood, G. A. (2008). Tectonic controls on the nature of large silicic calderas in volcanic arcs. Geology 36, 627–630. doi:10.1130/G24796A.1
Instituto Nacional de Estadísticas (2019). Síntesis de Resultados censo 2017. Región de Ayesén. Available at: https://regiones.ine.cl/documentos/default-source/region-xi/banco-datos-r11/estad%C3%ADsticas-demogr%C3%A1ficas-y-vitales/s%C3%ADntesis-censo-2017-ays%C3%A9n.pdf?sfvrsn=1d185950_6.
Jenkins, S. F., Biass, S., Williams, G. T., Hayes, J. L., Tennant, E., Yang, Q., et al. (2022). Evaluating and ranking Southeast Asia’s exposure to explosive volcanic hazards. Nat. Hazards Earth Syst. Sci. 22, 1233–1265. doi:10.5194/nhess-22-1233-2022
Jenkins, S., Magill, C., McAneney, J., and Blong, R. (2012a). Regional ash fall hazard I: A probabilistic assessment methodology. Bull. Volcanol. 74, 1699–1712. doi:10.1007/s00445-012-0627-8
Jenkins, S., McAneney, J., Magill, C., and Blong, R. (2012b). Regional ash fall hazard II: Asia-pacific modelling results and implications. Bull. Volcanol. 74, 1713–1727. doi:10.1007/s00445-012-0628-7
Jollife, I. T., and Cadima, J. (2016). Principal component analysis: A review and recent developments. Philosophical Trans. R. Soc. A Math. Phys. Eng. Sci. 374, 20150202. doi:10.1098/rsta.2015.0202
Kaufman, L., and Rousseeuw, P. J. (1991). “Chapter 5: Agglomerative nesting (program AGNES),” in Finding groups in data: An introduction to cluster analysis (Hoboken, New Jersey: John Wiley & Sons, Inc.), 199–252.
Lallemand, S., Heuret, A., and Boutelier, D. (2005). On the relationships between slab dip, back-arc stress, upper plate absolute motion, and crustal nature in subduction zones. Geochem. Geophys. Geosystems 6, 917. doi:10.1029/2005GC000917
Lara, L. E., and Clavero, J. (2004). Villarrica Volcano (39.5 S), southern Andes, Chile, jorge Clavero. Santiago: Servicio Nacional de Geología y Mineria.
Laske, G., Masters, G., Ma, Z., and Pasyanos, M. (2013). “Update on CRUST1.0: A 1-degree global model of Earth’s crust,” in EGU general assembly (Vienna, Austria: EGU), 2658.
Lawson, R. G., and Jurs, P. C. (1990). New index for clustering tendency and its application to chemical problems. J. Chem. Inf. Comput. Sci. 30, 36–41. doi:10.1021/ci00065a010
Lindsay, J. M., and Robertson, R. E. A. (2018). Integrating volcanic hazard data in a systematic approach to develop volcanic hazard maps in the lesser antilles. Front. Earth Sci. (Lausanne) 6, 42. doi:10.3389/feart.2018.00042
Lohmar, S., Parada, M. . Á., Robin, C., Gerbe, M. C., Deniel, C., Gourgaud, A., et al. (2006). Origin of postglacial ¨Mafic¨ ignimbrites at Llaima and Villarrica volcanoes (Southern Andes, Chile): Assimilation of plutonics rocks as one of the triggering factors? Simp. Sudam. Geol. Isotópica (SSAGI) 5, 417–421.
Lohmar, S., Robin, C., Parada, M. A., Gourgaud, A., Lopez-Escobar, L., Moreno, H., et al. (2005). “The two major postglacial (13-14,000 BP) pyroclastic eruptions of Llaima and Villarrica volcanoes (southern Andes): A comparison,” in 6th international symposium on andean geodynamics (Barcelona: Spinger), 442–445.
López Escobar, Á., Cembrano, J., and Moreno, H. (1995). Geochemistry and tectonics of the Chilean southern Andes basaltic quaternary volcanism (37-46°S). Andean Geol. 22, 219–234. doi:10.5027/andgeoV22n2-a06
Loughlin, R. S. J., Brown, S. K., Jenkins, S. F., and Vye-Brown, C. (2015). Global volcanic hazards and risk, global volcanic hazards and risk. Cambridge: Cambridge University Press. doi:10.1017/CBO9781316276273
Maldonado, V., Contreras, M., and Melnick, D. (2021). A comprehensive database of active and potentially-active continental faults in Chile at 1:25,000 scale. Sci Data 8, 20. doi:10.1038/s41597-021-00802-4
Marín, A. (2014). Palena, Quitralco y Melimoyu: Intentos fallidos de colonización en el litoral de la Región de Aysén (1889-1983). Rev. Austral Ciencias Sociales 27, 137–156. doi:10.4206/rev.austral.cienc.soc.2014.n27-06
Marzocchi, W., Sandri, L., Gasparini, P., Newhall, C., and Boschi, E. (2004). Quantifying probabilities of volcanic events: The example of volcanic hazard at Mount Vesuvius. J. Geophys Res. Solid Earth 109, 1–18. doi:10.1029/2004JB003155
Mastin, L. G., Guffanti, M., Servranckx, R., Webley, P., Barsotti, S., Dean, K., et al. (2009). A multidisciplinary effort to assign realistic source parameters to models of volcanic ash-cloud transport and dispersion during eruptions. J. Volcanol. Geotherm. Res. 186, 10–21. doi:10.1016/j.jvolgeores.2009.01.008
McInnes, L., Healy, J., and Melville, J. (2020). Umap: Uniform manifold approximation and projection for dimension reduction. arXiv preprint arXiv:1802.03426.
Mead, S., and Magill, C. (2014). Determining change points in data completeness for the Holocene eruption record. Bull. Volcanol. 76, 874. doi:10.1007/s00445-014-0874-y
Melosh, G., Moore, J., and Stacey, R. (2012). “Natural reservoir evolution in the Tolhuaca geothermal field, southern Chile,” in PROCEEDINGS, thirty-sixth workshop on geothermal reservoir engineering (California: Stanford University).
Mohamad, I. B., and Usman, D. (2013). Standardization and its effects on K-means clustering algorithm. Res. J. Appl. Sci. Eng. Technol. 6, 3299–3303. doi:10.19026/rjaset.6.3638
Naranjo, J. A., and Stern, C. R. (2004). Holocene tephrochronology of the southernmost part (42°30’-45°S) of the andean southern volcanic zone. Rev. Geol. Chile 31, 225–240. doi:10.4067/S0716-02082004000200003
Newhall, C. G. (1982). A method for estimating intermediate and long-term risks from volcanic activity, with an example from Mount St. Helens, Washington (No. 82-396). US Geological Survey.
Newhall, C. G., Costa, F., Ratdomopurbo, A., Venezky, D. Y., Widiwijayanti, C., Win, N. T. Z., et al. (2017). WOVOdat – an online, growing library of worldwide volcanic unrest. J. Volcanol. Geotherm. Res. 345, 184–199. doi:10.1016/j.jvolgeores.2017.08.003
Newhall, C. G., and Pallister, J. S. (2015). “Using multiple data sets to populate probabilistic volcanic event trees,” Volcanic hazards, risks, and disasters. Editors J. F. Shroder, and P. Papale (Elsevier Inc), 203–232. doi:10.1016/B978-0-12-396453-3.00008-3
Paguican, E. M., Grosse, P., Fabbro, G. N., and Kervyn, M. (2021). Morphometric classification and spatial distribution of Philippine volcanoes. J. Volcanol. Geotherm. Res. 418, 107251. doi:10.1016/j.jvolgeores.2021.107251
Polanco, E., Naranjo, J., Young, S., and Moreno, H. (2000). “Volcanismo Explosivo Holoceno en la Cuencia del Alto Biobio, Andes del Sur (37°45’-38°30’S),” in IX congreso geológico chileno (Puerto Varas: Spinger).
Rawson, H., Naranjo, J. A., Smith, V. C., Fontijn, K., Pyle, D. M., Mather, T. A., et al. (2015). The frequency and magnitude of post-glacial explosive eruptions at Volcán Mocho-Choshuenco, southern Chile. J. Volcanol. Geotherm. Res. 299, 103–129. doi:10.1016/j.jvolgeores.2015.04.003
Rodado, A., Bebbington, M., Noble, A., Cronin, S., and Jolly, G. (2011). On selection of analog volcanoes. Math. Geosci. 43, 505–519. doi:10.1007/s11004-011-9345-6
Rojas Hoppe, C., and Subiabre, A. (1998). La Carretera Austral Entre Puerto Montt y La Junta (Región Sur de Chile) y Sus Amenazas Naturales. Cuad. Geogr. Rev. Colomb. Geogr. 7, 50–69.
Runge, M. G., Bebbington, M. S., Cronin, S. J., Lindsay, J. M., Kenedi, C. L., and Moufti, M. R. H. (2014). Vents to events: Determining an eruption event record from volcanic vent structures for the Harrat Rahat, Saudi Arabia. Bull. Volcanol. 76, 804–816. doi:10.1007/s00445-014-0804-z
Ruth, D. C. S., Cottrell, E., Cortés, J. A., Kelley, K. A., and Calder, E. S. (2016). From passive degassing to violent strombolian eruption: The case of the 2008 eruption of Llaima volcano, Chile. J. Petrol. 57, 1833–1864. doi:10.1093/petrology/egw063
Sanchez-Alfaro, P., Reich, M., Arancibia, G., Pérez-Flores, P., Cembrano, J., Driesner, T., et al. (2016). Physical, chemical and mineralogical evolution of the Tolhuaca geothermal system, southern Andes, Chile: Insights into the interplay between hydrothermal alteration and brittle deformation. J. Volcanol. Geotherm. Res. 324, 88–104. doi:10.1016/j.jvolgeores.2016.05.009
Sandri, L., Jolly, G., Lindsay, J., Howe, T., and Marzocchi, W. (2012). Combining long- and short-term probabilistic volcanic hazard assessment with cost-benefit analysis to support decision making in a volcanic crisis from the Auckland Volcanic Field, New Zealand. Bull. Volcanol. 74, 705–723. doi:10.1007/s00445-011-0556-y
Sandri, L., Thouret, J. C., Constantinescu, R., Biass, S., and Tonini, R. (2014). Long-term multi-hazard assessment for El Misti volcano (Peru). Bull. Volcanol. 76, 771–826. doi:10.1007/s00445-013-0771-9
Schindlbeck, J. C., Freundt, A., and Kutterolf, S. (2014). Major changes in the post-glacial evolution of magmatic compositions and pre-eruptive conditions of Llaima Volcano, Andean Southern Volcanic Zone, Chile. Bull. Volcanol. 76, 830–922. doi:10.1007/s00445-014-0830-x
SERNAGEOMIN (2019). Ranking de Riesgo Específico de Volcanes Activos de Chile 2019. Sernageomin. Available at: https://www.sernageomin.cl/wp-content/uploads/2020/07/2Ranking-2019_Tabla_Final.pdf.
Sheldrake, T., and Caricchi, L. (2017). Regional variability in the frequency and magnitude of large explosive volcanic eruptions. Geology 45, 111–114. doi:10.1130/G38372.1
Sheldrake, T. E., Scutari, M., and Caricchi, L. (2020). Tectonic controls on global variations of large-magnitude explosive eruptions in volcanic arcs. Front. Earth Sci. (Lausanne) 8, 1–14. doi:10.3389/feart.2020.00127
Sheldrake, T. (2014). Long-term forecasting of eruption hazards: A hierarchical approach to merge analogous eruptive histories. J. Volcanol. Geotherm. Res. 286, 15–23. doi:10.1016/j.jvolgeores.2014.08.021
Sobradelo, R., Geyer, A., and Martí, J. (2010). Statistical data analysis of the CCDB (Collapse Caldera Database): Insights on the formation of caldera systems. J. Volcanol. Geotherm. Res. 198, 241–252. doi:10.1016/j.jvolgeores.2010.09.003
Solow, A. R. (2001). An empirical bayes analysis of volcanic eruptions. Math. Geol. 33, 95–102. doi:10.1023/A:1007514410745
Stern, C. R., De Porras, M. E., and Maldonado, A. (2015). Tefrocronología en curso superior del valle del río Cisne (44°S), Chile Austral. Andean Geol. 42, 173–189. doi:10.5027/andgeoV42n2-a02
Stern, C. R., Moreno, H., López-Escobar, L., Clavero, J. E., Lara, L. E., Naranjo, J. A., et al. (2007). “Chilean volcanoes,” in The geology of Chile (London: Geological Society of London). doi:10.1144/GOCH.5
Strauss, T., and Von Maltitz, M. J. (2017). Generalising ward’s method for use with manhattan distances. PLoS One 12, 01682888–e168321. doi:10.1371/journal.pone.0168288
Tan, P. N., Steinbach, M., and Kumar, V. (2016). Introduction to data mining. New Delhi: Pearson Education India.
Tennant, E., Jenkins, S. F., Winson, A., Widiwijayanti, C., Gunawan, H., Haerani, N., et al. (2021). Reconstructing eruptions at a data limited volcano: A case study at gede (west java). J. Volcanol. Geotherm. Res. 418, 107325. doi:10.1016/j.jvolgeores.2021.107325
Tierz, P., Clarke, B., Calder, E. S., Dessalegn, F., Lewi, E., Yirgu, G., et al. (2020). Event trees and epistemic uncertainty in long-term volcanic hazard assessment of rift volcanoes: The example of aluto (Central Ethiopia). Geochem. Geophys. Geosystems 21, 9219. doi:10.1029/2020GC009219
Tierz, P., Loughlin, S. C., and Calder, E. S. (2019). Volcans: An objective, structured and reproducible method for identifying sets of analogue volcanoes. Bull. Volcanol. 81, 76. doi:10.1007/s00445-019-1336-3
Unglert, K., Radić, V., and Jellinek, A. M. (2016). Principal component analysis vs. self-organizing maps combined with hierarchical clustering for pattern recognition in volcano seismic spectra. J. Volcanol. Geotherm. Res. 320, 58–74. doi:10.1016/j.jvolgeores.2016.04.014
Völker, D., Kutterolf, S., and Wehrmann, H. (2011). Comparative mass balance of volcanic edifices at the southern volcanic zone of the Andes between 33°S and 46°S. J. Volcanol. Geotherm. Res. 205, 114–129. doi:10.1016/j.jvolgeores.2011.03.011
Wang, T., Bebbington, M., Cronin, S., and Carman, J. (2022). Forecasting eruptions at poorly known volcanoes using analogs and multivariate renewal processes. Geophys Res. Lett. 49, 1–14. doi:10.1029/2021gl096715
Watt, S. F. L., Pyle, D. M., and Mather, T. A. (2009). The influence of great earthquakes on volcanic eruption rate along the Chilean subduction zone. Earth Planet Sci. Lett. 277, 399–407. doi:10.1016/j.epsl.2008.11.005
Weber, G., and Sheldrake, T. E. (2022). Geochemical variability as an indicator for large magnitude eruptions in volcanic arcs. Sci. Rep. 12, 15854. doi:10.1038/s41598-022-19902-1
Weller, D. J., de Porras, M. E., Maldonado, A., Méndez, C., and Stern, C. R. (2017). Holocene tephrochronology of the lower Río Cisnes valley, southern Chile. Andean Geol. 44, 229–248. doi:10.5027/andgeov44n3-a01
Whelley, P. L., Newhall, C. G., and Bradley, K. E. (2015). The frequency of explosive volcanic eruptions in Southeast Asia. Bull. Volcanol. 77, 1. doi:10.1007/s00445-014-0893-8
Wils, K., van Daele, M., Lastras, G., Kissel, C., Lamy, F., and Siani, G. (2018). Holocene event record of Aysén fjord (Chilean patagonia): An interplay of volcanic eruptions and crustal and megathrust earthquakes. J. Geophys Res. Solid Earth 123, 324–343. doi:10.1002/2017JB014573
Witter, J. B., Kress, V. C., Delmelle, P., and Stix, J. (2004). Volatile degassing, petrology, and magma dynamics of the Villarrica Lava Lake, Southern Chile. J. Volcanol. Geotherm. Res. 134, 303–337. doi:10.1016/j.jvolgeores.2004.03.002
Keywords: analogues, data-limited, eruption probability, frequency-magnitude relationship, long-dormant, hierarchical clustering, principal compoment analysis
Citation: Burgos V, Jenkins SF, Bono Troncoso L, Perales Moya CV, Bebbington M, Newhall C, Amigo A, Prada Alonso J and Taisne B (2023) Identifying analogues for data-limited volcanoes using hierarchical clustering and expert knowledge: a case study of Melimoyu (Chile). Front. Earth Sci. 11:1144386. doi: 10.3389/feart.2023.1144386
Received: 14 January 2023; Accepted: 09 May 2023;
Published: 24 May 2023.
Edited by:
Nico Fournier, GNS Science, New ZealandReviewed by:
Chaochao Gao, Zhejiang University, ChinaCopyright © 2023 Burgos, Jenkins, Bono Troncoso, Perales Moya, Bebbington, Newhall, Amigo, Prada Alonso and Taisne. This is an open-access article distributed under the terms of the Creative Commons Attribution License (CC BY). The use, distribution or reproduction in other forums is permitted, provided the original author(s) and the copyright owner(s) are credited and that the original publication in this journal is cited, in accordance with accepted academic practice. No use, distribution or reproduction is permitted which does not comply with these terms.
*Correspondence: Vanesa Burgos, YnVyZzAwMDFAZS5udHUuZWR1LnNn
Disclaimer: All claims expressed in this article are solely those of the authors and do not necessarily represent those of their affiliated organizations, or those of the publisher, the editors and the reviewers. Any product that may be evaluated in this article or claim that may be made by its manufacturer is not guaranteed or endorsed by the publisher.
Research integrity at Frontiers
Learn more about the work of our research integrity team to safeguard the quality of each article we publish.