 Haozhe Geng1
 Yu Wu
Yu Wu
95% of researchers rate our articles as excellent or good
Learn more about the work of our research integrity team to safeguard the quality of each article we publish.
Find out more
ORIGINAL RESEARCH article
Front. Earth Sci. , 23 February 2023
Sec. Environmental Informatics and Remote Sensing
Volume 11 - 2023 | https://doi.org/10.3389/feart.2023.1142167
This article is part of the Research Topic Groundwater-Induced Geological Disasters in Underground Engineering: Theoretical, Experimental, and Numerical Approaches View all 12 articles
The application of energy storage technology can solve the problems of randomness and volatility in the development and use of renewable energy, such as wind and solar energy, and effectively improve energy utilization. Rock heat storage is one of the primary forms of sensible heat storage. The heat storage efficiency and heat storage capacity of rock packed bed are important indicators to measure the energy storage effect of a rock energy storage system. This paper takes CO2 as the heat-carrying medium and broken granite grains as the packed bed matrix of the energy storage system. It establishes a porous medium thermal-hydraulic-mechanical coupling model of the broken rock bed. The heat injection and production process of the large-sized rock bed heat storage system is simulated using the COMSOL finite element software, and the heat storage efficiency and heat storage capacity of the broken rock bed is analyzed under different fluid injection pressures and injection temperatures. The results show that: 1) With the increase of CO2 injection pressure, the heat storage and heat production speed of the heat storage system will increase, and the heat storage rate changes from two stages of “low rise - slow decline” to four stages of “rapid increase—stability—rapid decrease—stability”; 2) With the increase of CO2 injection temperature, the maximum heat storage capacity of the rock bed heat storage system will increase. Due to the increase in the temperature gradient between CO2 and the rock bed, the heat storage and the heat production time of the heat storage system will increase, and its speed will decrease.
To achieve the strategic goal of “carbon peaking and carbon neutralization,” the development and utilization of renewable energy have become the top priority of China’s energy strategy. With the rapid development of renewable clean energy, wind and solar energy have become relatively mature and large-scale used renewable clean energy. The number and scale of installed power generation using them have increased year by year. However, wind power generation and solar power generation are not stable enough due to the influence of seasons and the duration of sunshine, which has caused the phenomenon of large-scale “wind abandonment” and “sunshine abandonment” (Ha and Saha, 2004; Piwko et al., 2009). The key to solving the problem of “wind abandonment” and “light abandonment” is to solve the randomness and volatility of wind and solar power generation. Establishing large-scale energy storage systems can effectively solve this problem (Li et al., 2016). Rock is an ideal medium for heat storage with the advantages of low cost, a wide range of sources, and a large heat exchange area. The study of rock heat storage is important for solar energy storage, wind/photovoltaic grid-connected operation, and deep peaking of thermoelectric units (Liu et al., 2018).
Scholars have conducted numerous researches on rock packed bed seepage and heat transfer characteristics. BU (BU, 2012), Wang, M. L. (Wang et al., 1992) conducted seepage experiments on broken rock mass and studied the relationship between the permeability coefficient of broken rock mass and its state of pressure and porosity. Yang Wei (YANG et al., 2015) deduced the pressure field distribution law of one-dimensional steady gas seepage based on the gas permeability test of broken sandstone under pressure, and concluded that the degree of rock fragmentation is non-regular under different axial stresses, and the higher the degree of fragmentation, the lower the gas permeability. Markevich (Markevich and Cecilio 2015) measured the stability of the seepage process by varying the diameter, size, and proportion of the broken rock grains separately, calculated the Reynolds number of the packed structure, and analyzed its turbulent flow state. SHANG (SHANG, 2017) obtained the variation of seepage parameters of the broken coal rock mass under different surrounding pressures based on the triaxial seepage experiment by numerical simulation. Schumann (SCHUMANN, 1929) proposed an analytical method for solving the thermal interaction problem between a flowing fluid and a porous medium. Furnas (FURNAS, 1930) proposed that rock can be used as an ideal heat storage material for packed bed and then conducted a heat-transfer experiment on the heat-transfer flow characteristics of the packed bed. It was proposed that the effective heat-transfer coefficient increases with the increase of fluid flow when the heat-transfer fluid flows through a packed bed filled with broken solids. Ergun (ERGUN, 1952) and Allen (ALLEN et al., 2013; ALLEN et al., 2014) found that the shape and arrangement of the grains affect the heat transfer in the packed bed by influencing heat radiation, heat convection, and axial heat conductivity in the packed bed. Zavattoni (Zavattoni et al., 2011) analyzed the influence of axial porosity distribution or thickness effect of packing on overall heat transfer through numerical simulation.
Scholars have also conducted much research on the mechanistic aspects of thermal-hydraulic-mechanical coupling in rock. Terzaghi (TERZAGHI, 1943) first proposed the hydraulic-mechanical coupling problem and the consolidation theory of soil, and built the basic theoretical framework for the hydraulic-mechanical coupling problem. Biot (BIOT, 1941; BIOT, 1954) proposed the three-dimensional consolidation theory and extended it to the dynamic analysis of anisotropic porous media. Savage (SAVAGE and BRADDOCK, 1982) proposed the generalized Biot theory, which mainly applies to elastic and isotropic media. Chen (CHEN and TEUFEL, 1997) established a dual pore fluid flow model based on Biot theory and proposed that the critical coupling factor is the pore volume variation of the matrix, fracture, and dual continuum and the relevant effective stress law. Vaziri (VAZIRI, 1988) deduced the theoretical expressions based on the elastic and thermal properties of multiphase soil system, and developed a set of finite element programs to meet the complex three-field coupling under the specified displacement and fluid pressure conditions. Tortike (TORTIKE and ALI, 1987; TORTIKE and ALI, 1991) established a three-dimensional thermal-hydraulic-mechanical coupling mathematical model of an elasto-plastic rock mass and conducted numerical simulation research, which concluded that the geomechanical response depends mainly on temperature variation, pressure variation, and local material response. Gatmiri (GATMIRI and DELAGE, 1997) proposed the concept of thermal porosity state surface, including the influence of thermal effect and stress state on volume change, and proposed a fully thermal-hydraulic-mechanical coupling theory for saturated porous media. Currently, most of the research on the thermal-hydraulic-mechanical coupling mechanism of rock is based on Terzaghi’s effective stress principle and Biot’s three-dimensional soil consolidation theory.
CO2 as a heat transfer fluid has certain thermophysical and chemical properties (Li and Dai, 2014), is more chemically stable than water, is a weak solvent for rock minerals, has very low corrosion, and has lower viscosity and better fluidity (Pruess, 2008; Atrens et al., 2010). In 2000, Brown first proposed the use of supercritical CO2 as a heat transfer fluid in enhanced geothermal systems (Brown, 2000; Pruess, 2006). And the use of CO2 for fluid loss during heat storage and recovery can indirectly achieve the purpose of sequestering CO2. At present, CO2 has achieved good results in oil drive (Leena, 2008), fracturing (WANG et al., 2020) and drilling (SHEN et al., 2010), and most of the research as heat transfer fluid is focused on geothermal extraction (WU et al., 2021), but there is less research in using CO2 for heat storage.
In this paper, based on the above theory and mechanism research, aiming at the law of rock mass deformation, fluid flow, and heat transfer in the process of heat injection, a thermal-hydraulic-mechanical coupling mathematical model describing the energy storage process of the rock packed bed is established. The heat injection and production process of the rock bed heat storage system is simulated using COMSOL finite element software, and the effect of fluid injection pressure and temperature on the heat storage capacity and heat storage efficiency of the heat storage system is studied.
During heat injection and production, the heat-carrying gas flows through the rock packed bed and exchanges heat with the rock. The stress and strain of the rock changes due to thermal expansion, which changes the pore structure of the packed bed, thus affecting the gas seepage movement. The change of the gas seepage also affects the convective heat exchange between rock and gas. At the same time, the change in gas temperature will change its density, viscosity, and other properties, affecting the gas seepage movement. The gas pore pressure will also change, affecting the stress-strain structure of the packed bed. Therefore, in the process of heat injection and production of rock bed, the seepage movement of heat-carrying gas, rock deformation, and heat transfer involves the mutual coupling of the hydraulic field, mechanical field, and thermal field.
The schematic diagram of the experimental system is shown in Figure 1. The heat storage tank is filled with broken granite grains to form a rock packed bed, and axial pressure is applied to the packed bed to maintain a certain energy storage density. In the heat injection experiment, the gas is injected into the storage tank through the heating device, and the high-temperature gas exchanges heat with the rock packed bed, and the heat is stored in the rock packed bed. In the heat production experiment, the low-temperature gas is injected directly into the storage tank, and the heat is extracted from the rock packed bed through heat exchange. Four temperature sensors are set inside the heat storage tank to record the axial temperature distribution inside the bed during the heat injection and production.

FIGURE 1. Schematic diagram of the experimental system.
Air and CO2 are used as heat-carrying gases, respectively. Figure 2 shows the temperature changes at each measuring point in the heat storage tank in the two groups of heat injection experiments. It can be seen that when CO2 is used as heat-carrying gas, the temperature at T1 of the broken rock packed bed starts to increase within 0.5 h of heat injection. At 0.5 h of heat injection, the temperature at T2 also starts to increase, and the temperature at T3 and T4 starts to increase at 1.5 h. At 5 h of heat injection, the temperature difference at T1 of the broken rock packed bed reached about 20°C, and it also increased by nearly 10°C at the bottom T4. When air was used as the heat-carrying gas, the temperature at T1 and T2 of the broken rock packed bed changed at 1 h of heat injection, and at 3 h of heat injection, the temperature at T3 and T4 of the broken rock packed bed started to change. At 5 h of heat injection, the temperature difference at T1 of the broken rock packed bed is about 5°C, and the temperature difference at T4 is less than 1°C. It indicates that the heat-carrying capacity of CO2 is much larger than air under the same conditions. Therefore, using CO2 as the heat-carrying medium in heat injection and production is more appropriate.
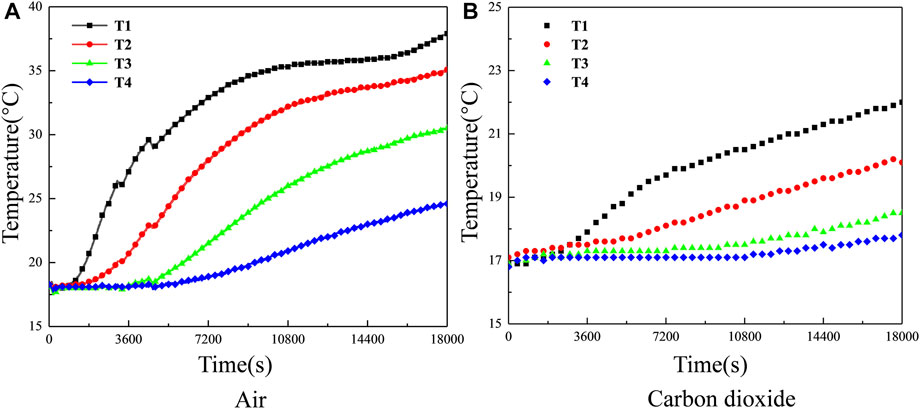
FIGURE 2. Temperature change of each measuring point in heat injection experiments through different heat-carrying gas (A) Air (B) Carbon dioxide.
The mutual coupling relationship of the temperature field, hydraulic field, and mechanical field involved in the heat storage system’s heat injection and production process is shown in Figure 3.
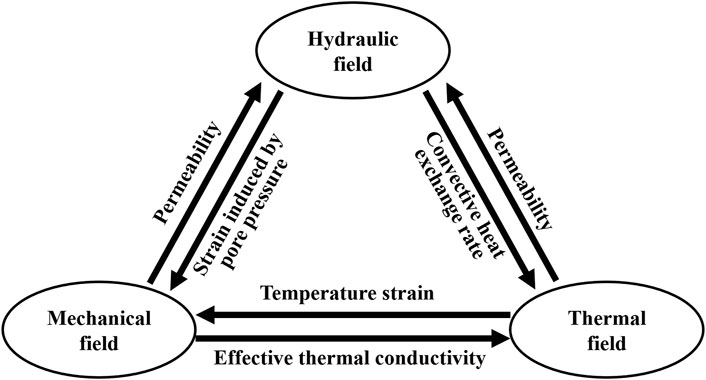
FIGURE 3. Thermal-hydraulic-mechanical coupling in the heat storage system.
The coupling between the three fields of THM is realized through the seepage motion of heat-carrying fluid, the deformation of broken rock, and the heat transfer between fluid and solid. Therefore, the governing equations of each physical field should be determined first.
According to the Terzaghi principle of effective stress (TERZAGHI, 1943), the stress of rock mass is:
where:
The relationship between effective stress and strain affected by temperature effect is (BIOT, 1954):
where:
The relationship between stress and strain affected by temperature effect and fluid pressure is as follows:
The relationship between displacement and strain under small deformation, and deformation geometry equation is:
without considering the inertial force effect, the equation of conservation of momentum is:
Through combination with Formula 3, 4, 5, 6, the stress field governing equation considering temperature, pressure, and displacement is obtained:
where:
According to the law of conservation of mass, the fluid flow governing equation of porous media can be expressed as:
where:
Since the fluid flow in porous media does not conform to Darcy flow, the Erugun non-Darcy flow permeability model equation was used (AKGIRAY and SAATCL, 2001):
where:
Substitute Formula 9 into Formula 8 to get:
Fourier heat conduction considering seepage can be expressed as:
where:
The heat generated during the deformation of the porous media matrix is (JIANG, 2011):
where:
The heat energy conservation equation of convection and heat conduction in porous media can be expressed as:
where:
Considering the heat exchange between gas and rock, it is assumed that the heat equilibrium is maintained between the gas and the rock, and the thermal equilibrium equation is:
where:
Combined with 15, 16, the heat transfer control equation of porous media is obtained as follows:
In order to verify the correctness of the model, the previously completed laboratory experiment (Wu et al., 2022) was set as a reference, the geometric model with the same size as the experiment was established, and the boundary conditions and related parameters with the same conditions were set.
Figure 4 shows the geometric model and the selected measuring point position. The model size is set to be consistent with the size of the heat storage tank in the experiment (150 mm × 350 mm). 3 mm wide fluid inlet and fluid outlet are set at the center of the upper and lower boundaries of the model. The model is solved by COMSOL Multiphysics software. The solution modules include the solid mechanics module under the structural mechanics branch, the free and porous media flow module and the porous media heat transfer module. The location of the measuring points corresponded to the location of the temperature sensors placed in the heat storage tank in the experiment.
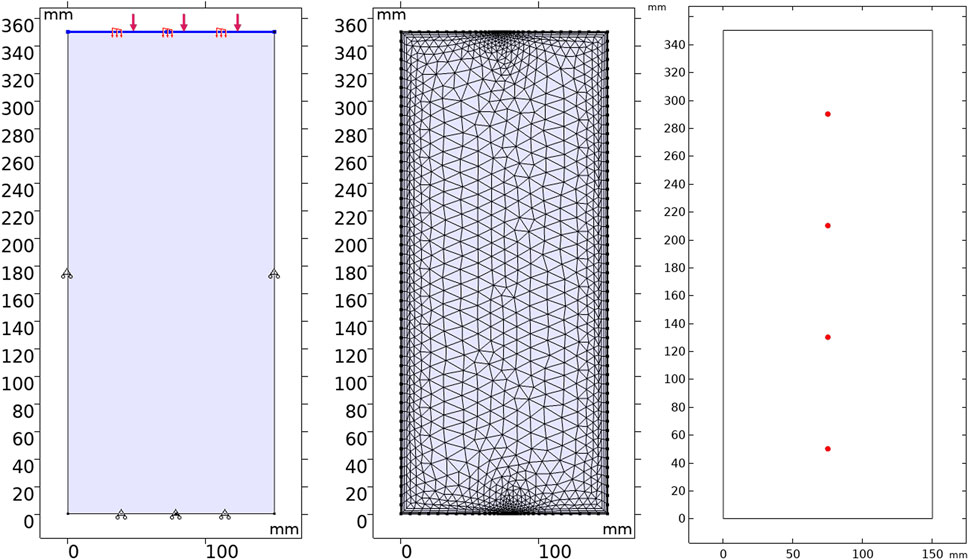
FIGURE 4. Geometric model and the selected measuring point position.
Mechanical field boundary conditions: axial force is applied to the upper boundary of the model, and the rest of the boundaries are set as fixed boundaries to limit the boundary displacement.
Hydraulic field boundary conditions: The model’s fluid inlet boundary and fluid outlet are set as the inflow and outflow boundary, respectively. The rest of the boundary is set as the zero flux boundary.
Thermal field boundary conditions: the inlet boundary is set as the temperature boundary, the outlet boundary is set as the outflow boundary, and the rest are thermally insulated.
After reading the relevant literature (Shu et al., 2020; Dong et al., 2021), the thermophysical parameters of CO2 and rock mass are determined, and the relevant parameters in the model are shown in Table 1. The temperature distribution in the model after different times of heat injection and production is shown in Figure 5. It can be seen that the high-temperature region in the heat storage system gradually increases with the increase of heat injection time. When the heat injection proceeds to 18,000 s, the heat storage system is divided into three regions: high, medium, and low temperature. After 18,000 s, the heat production starts, the high-temperature region of the heat storage system gradually moves down, and the low-temperature region gradually occupies the entrance region and expands.
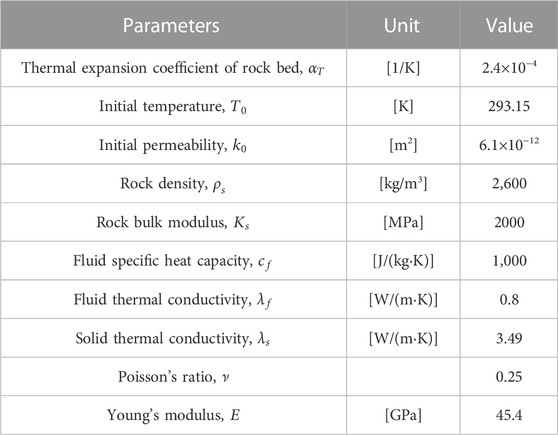
TABLE 1. Related parameters in model.
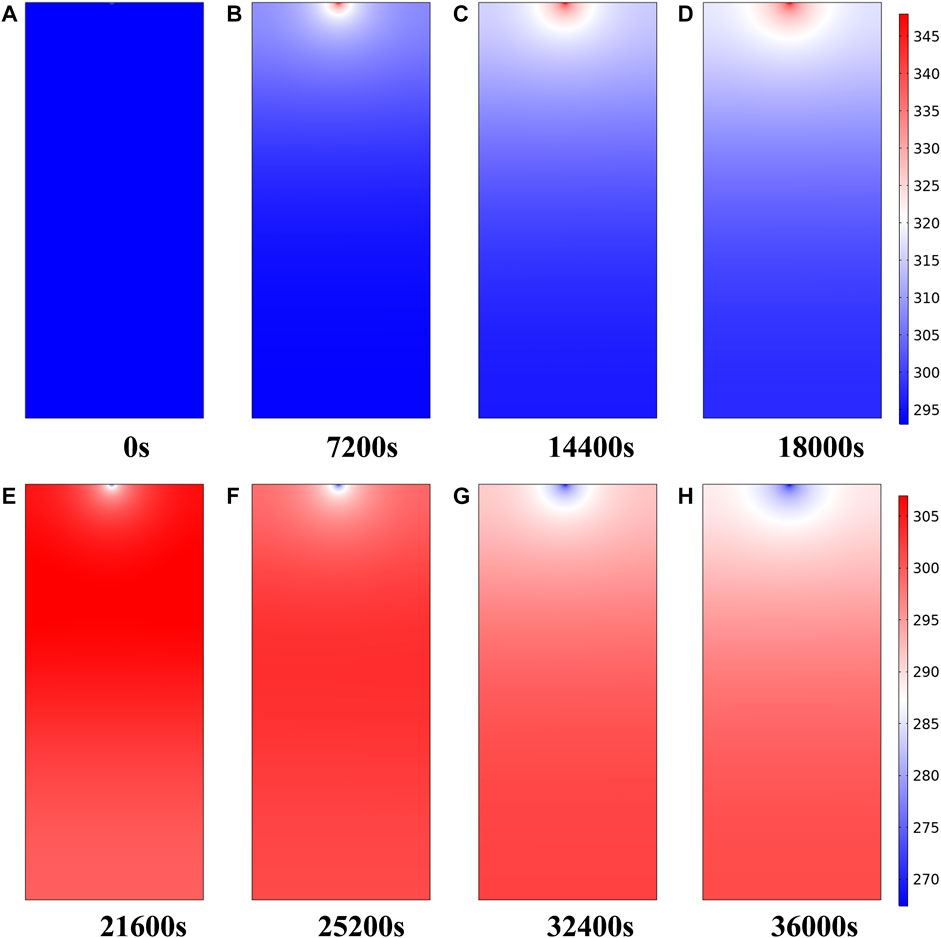
FIGURE 5. Temperature distribution in the model during heat injection and production at different times (A) 0 s (B) 7200 s (C) 14000 s (D) 18000 s (E) 21600 s (F) 25200 s (G) 32400 s (H) 36000 s.
The calculation results were compared with the experimental results to verify the correctness of the model. Figures 6A, B shows the temperature variation curves with time at each measuring point during the heat injection process obtained from the model and experimental calculations. By comparing the two plots, it can be seen that the range and trend of temperature variation at each measuring point calculated by the model are in general agreement with those obtained from the experiment. In the 3 h heat injection process, the temperature at T1 increases first in the experiment and simulation, but the experimental curve increases at about 0.5 h after the heat injection experiment starts. It is considered that after the start of the heat injection experiment, the gas needs to pass through a long pipeline to reach the heat storage tank through the heating equipment, and it takes some time for the gas to heat the pipeline. With the heat transferred to the lower part of the heat storage tank, the temperature at T2, T3, and T4 also started to increase, and the range and trend of the simulated and experimental curves were basically the same in the following 2.5 h. After the heat injection experiment, the experimental pipeline is reconnected to conduct the heat production experiment, and the time without gas injection is about 10 min. It is the reason why the experimental curve appeared to fall first and then rise, while the simulation was only set to stop for 10 min, so the curve did not fluctuate. In the following heat production, the temperature at T1 of both the simulative and experimental curves dropped sharply, and the temperature at T2, T3, and T4 increased first and then decreased. The curves of T1 intersected with the curves of T2, T3, and T4, and the declining process of T2 also intersected with the rising T3 and T4 curves, respectively.
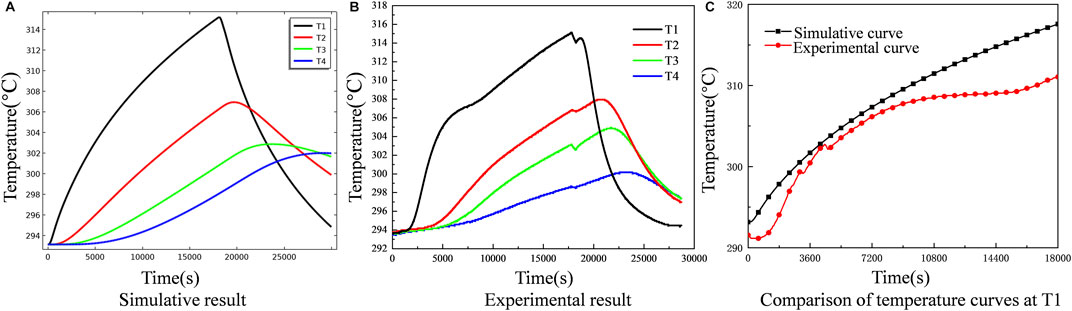
FIGURE 6. Temperature curve and comparison of measuring points in experiment and simulation (A) Experimental result (B) Simulative result (C) Comparison of temperature at T1.
The temperature change at measurement point T1 during 5 h of heat injection was taken for detailed numerical comparison, as shown in Figure 6C. It can be seen that the process of heating the gas flow line at the beginning of the experiment has a slight effect on the temperature increase of the packed bed. However, the temperature change in the middle period is in good agreement with the simulated temperature curve. The fluctuation of the experimental curve in the later period is because the gas flow is too fast during the experiment, and the actual outlet temperature of the heating equipment does not reach the set temperature, causing the gas temperature at the inlet of the heat storage tank to fluctuate. The temperature of the measuring points in the experiment and simulation are in general agreement in terms of value, change range and change trend, which fully demonstrates the correctness of the model.
The geometric model is shown in Figure 7. The plane model is a rectangular interface with a length of 100 m, a width of 50 m, and a thickness of 5 m (z-direction). The blue line segment on the model’s left side is the injection port, and the red line segment on the right side is the flow outlet, both of which are set to 1 m. The model is solved by COMSOL Multiphysics software. The solution modules include the structural mechanics module, the groundwater flow module, and the heat transfer module. According to the previous introduction, it is known that the operation of the heat storage system is to “cut the peak and compensate the valley,” which is mainly divided into the heat injection stage and the heat production stage. Therefore, in order to study the thermal-hydraulic-mechanical coupling law in different stages, the heat injection and production processes are simulated separately.
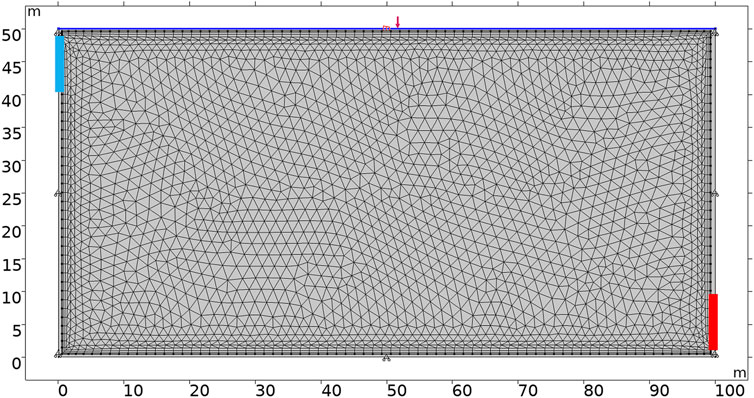
FIGURE 7. Geometric model of large-sized heat storage system.
In this model, an axial load is applied to the upper boundary, and the rest boundaries are set as fixed boundaries. For heat transfer, all boundaries are insulated except for the inflow and outlet. The physical and mechanical parameters of the rock bed and fluid in the model are shown in Table 1.
The outlet of the model is connected to the atmosphere, and the outlet pressure is 1 atm. The initial temperature of the rock bed heat storage system is set to 20°C. It is assumed that the heat storage system operates continuously 24 h a day, and the system operates for 360 days as a cycle. In the spring and summer of the peak electricity abandonment period, the electricity is converted into thermal energy storage, and the heat is injected for 180 days at a temperature of 200°C. In the autumn and winter of the peak electricity consumption period, the stored heat energy is produced and converted into electricity again. The heat is produced for 180 days at a temperature of 10°C.
The numerical simulation scheme is shown in Table 2.

TABLE 2. Numerical simulation scheme.
As shown in Figure 8, the heat storage capacity of the rock bed heat storage system at 1–4 MPa CO2 injection pressure changes with the heat injection time. It can be seen from the figure that the heat storage capacity increases gradually with the increase of injection pressure during the same 180 days of injection time, but its growth rate is different at different injection pressures. 1 MPa has the lowest growth rate, and at the 180th day of heat injection, the heat storage capacity of the system differs from other injection pressures by nearly 3 MW·h. When the fluid injection temperature is the same, the time for the system to reach temperature equilibrium is different under different injection pressures. The higher the injection pressure, the shorter the time for the rock bed to reach temperature equilibrium. It is because the heat-carrying capacity of CO2 increases with the increase of injection pressure. Without considering the amount of CO2 injected, higher injection pressure will reduce the time to reach the overall heat equilibrium of the rock bed heat storage system. However, in practical projects, in order to meet the demand for economic benefits, it is necessary to select appropriate injection pressure to avoid energy waste. In this model, 2 MPa is the appropriate injection pressure.
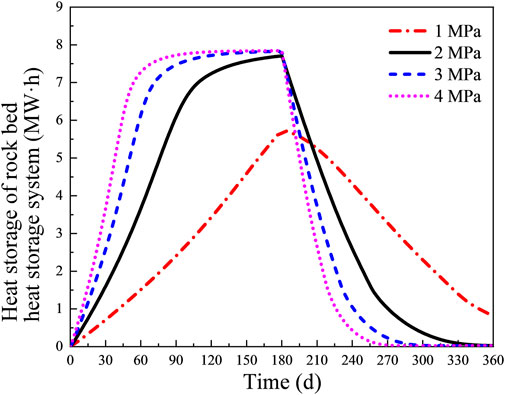
FIGURE 8. The change of rock bed heat storage with time under different CO2 injection pressures.
Under the same injection pressure, the change of the heat storage capacity can be roughly divided into four stages, namely, “rapid increase—stability—rapid decrease—stability.” 1 MPa injection pressure has only two stages, “slowly increase and slowly decrease,” without a stable stage. In the actual operation of the heat storage system, it can be divided into two modes: low injection pressure and high injection pressure. Although the total amount of heat storage is lower at low injection pressure, the heat input and output are relatively smooth. Under high injection pressure, the operation mode of the rock bed heat storage system can be set to four stages “heat storage—heat preservation—heat extraction—shutdown.” Choosing different operation modes according to different needs to achieve the purpose of economic operation.
Figures 9, 10 show the temperature distribution nephogram of the rock bed when the heat storage system operates for 45 days, 135 days, 225 days, and 315 days under the injection pressure of 1 MPa–4 MPa, respectively. It can be seen that after increasing the injection pressure of CO2, the diffusion rate of the high-temperature region becomes faster. At 1 MPa injection pressure, there is still nearly half of the initial-temperature region in the rock bed at 45 days of injection time, while at 2 MPa injection pressure, the temperature of nearly 1/2 of the region is already above 400 K for the same injection time. When the injection pressure is increased to 3 MPa, the high-temperature region has grown to 2/3, and at an injection pressure of 4 MPa, the rock bed has roughly reached temperature equilibrium. Similarly, when the rock bed heat storage system was in operation for 225 days, i.e., 45 days of heat production, the temperature nephogram shows a “saddle” distribution at 1 MPa injection pressure, with the left injection region and the right wall region being the low-temperature regions, and the middle region of the bed still having a higher temperature. With the increase of injection pressure, the cold fluid pushes the high-temperature region towards the outlet direction at the same heat production time. The rock bed is divided into three regions: high-temperature region, low-temperature region and thermocline. When the heat storage system operates for 315 days, the temperature of the rock bed basically decreases to 300 K at 2–4 MPa injection pressure, and the heat production process basically ends. In practical engineering, the design of the heat storage system can be optimized to extract the heat in the upper right region.
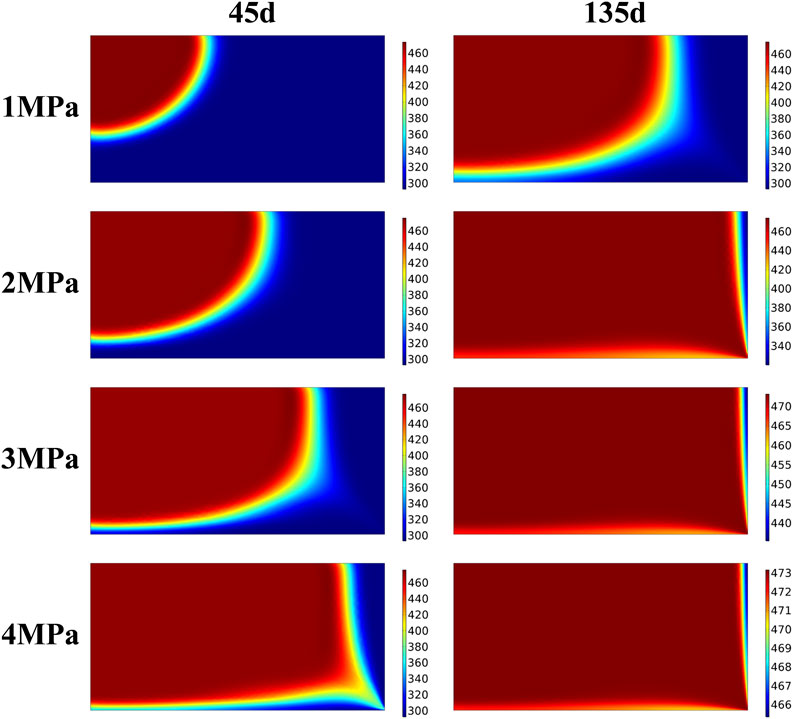
FIGURE 9. Temperature distribution of the system during heat injection at different injection pressures.
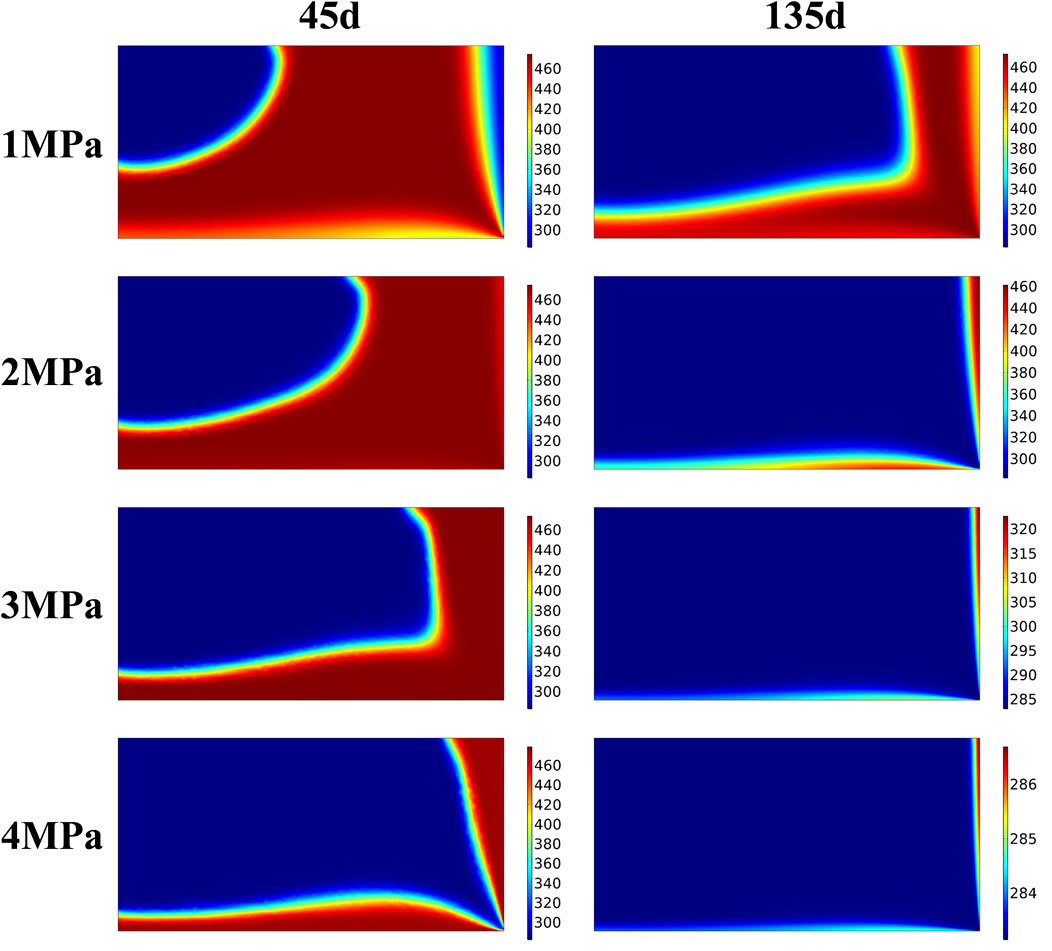
FIGURE 10. Temperature distribution of the system during heat production at different injection pressures.
Figure 11 shows the variation of the heat storage capacity of the rock bed heat storage system with the heat injection time at different CO2 injection temperatures under 2 MPa injection pressure. It can be seen that, in the same 180-day heat injection time, the heat energy storage capacity gradually increases with the increase of injection temperature. The trend of the heat energy storage curve of the rock bed under different injection temperatures is roughly the same during the 180-day heat injection process, rising steadily first, reaching the upper limit of the heat energy storage capacity, and then entering the stable stage. In the 180-day heat production time, it is smoothly decreasing first and slowly decreases at last.
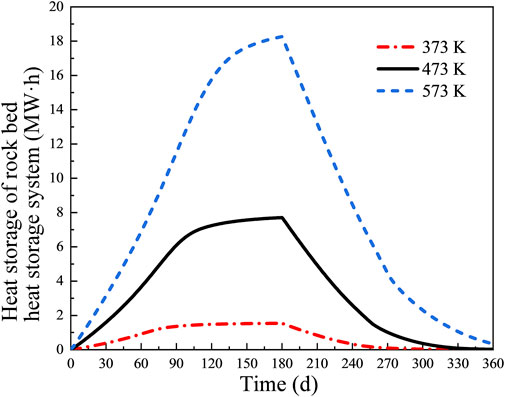
FIGURE 11. The change of rock bed heat storage with time under different CO2 injection temperatures.
At the injection temperature of 373 K, the heat storage system basically reaches saturation at 90 days of heat injection, and the maximum heat storage capacity is 2 MW·h; at the injection temperature of 473 K, the rock bed heat storage system also basically reaches saturation at 90 days, and the maximum heat storage capacity is 8 MW·h; when the injection temperature is 573 K, the increase rate of heat storage capacity in the heat storage system starts to slow down at 150 days, and the maximum heat storage is about 18 MW·h. The above results are due to the fact that increasing the injection temperature increases the temperature gradient between CO2 and the rock bed, which increases the time to reach heat equilibrium in the rock bed, and the stored heat increases simultaneously. In the actual heat storage system, it is necessary to choose a suitable injection temperature according to the injection pressure, which can reduce the time of heat storage of the whole system on the one hand, and avoid the waste of heat-carrying gas on the other hand, so as to achieve the maximum economic benefit.
Figures 12, 13 show the temperature distribution nephograms of the rock bed heat storage system with injection temperatures of 373 K, 473 K, and 573 K at 45 and 90 days of heat injection and 45 and 90 days of heat production, respectively. It can be seen that the proportion of the high-temperature region decreases with the increase of the injection temperature in the same heat injection time. It is because the increase in injection temperature increases the temperature gradient between CO2 and rock increase, which increases the time for the rock bed to reach heat equilibrium. In the same heat production time, because the heat production gas temperature is the same, the difference in temperature nephogram is related to the highest temperature reached in heat injection. The bulge direction of the low-temperature region during heat production is basically the same as that during heat injection when using low heat injection temperature. In contrast, at high heat injection temperature, the bulge direction of the low-temperature region during heat production tends to the right wall, which is especially obvious on the 45th day of heat production at 473 K and 573 K. It is because the increase of heat injection temperature increases the temperature gradient between CO2 and rock, thus increasing the thermal strain of rock and the deformation of the rock bed under thermal action, which leads to the change of the gas flow direction during heat production.
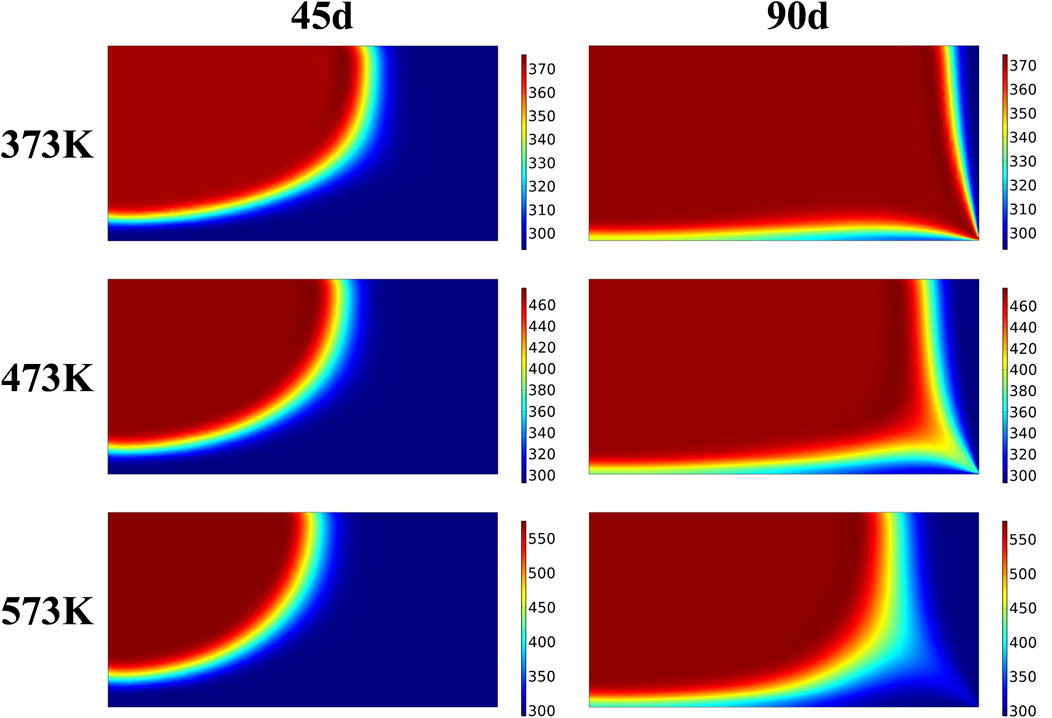
FIGURE 12. Temperature distribution of the system during heat injection at different injection temperatures.
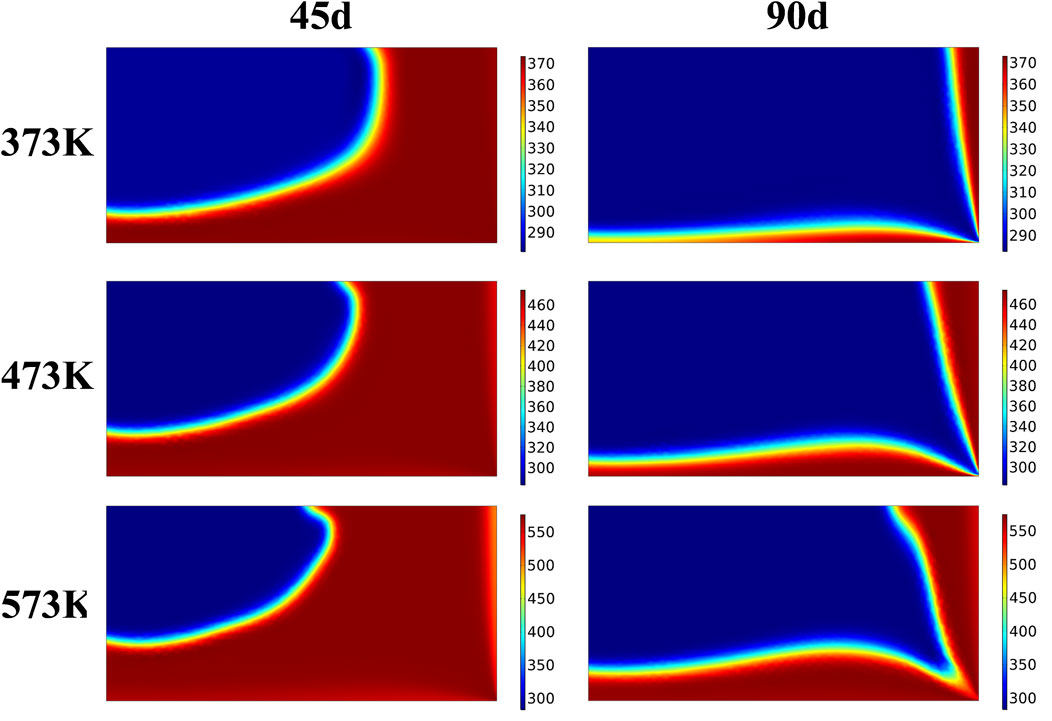
FIGURE 13. Temperature distribution of the system during heat production at different injection temperatures.
In this paper, a thermal-hydraulic-mechanical coupling model of porous media for broken rock bed is established, and the correctness of the model is verified by comparing it with an experiment. This paper simulated the heat injection and production process of a large-sized rock bed heat storage system, analyzed the influence of CO2 injection pressure and temperature on the heat storage efficiency and heat storage capacity of broken rock bed, respectively, and obtained the following conclusions:
(1) A porous media model was established based on the control equations of porous media deformation, seepage and heat transfer, and the heat injection and production process under the actual experimental condition was simulated. The numerical values and trends obtained from the simulation and experiment are in good agreement, which is of great significance for the simulation and analysis applicable to the field conditions and large-sized rock bed heat storage system.
(2) Using the thermal-hydraulic-mechanical coupling model to simulate the heat injection and production process of a large-sized rock bed thermal storage system. The results show that, with the increase of CO2 injection pressure, the time for the rock bed to reach the maximum heat storage capacity during heat injection decreases, and the time for heat production of the heat storage system also decreases. When the injection temperature is certain, the maximum heat storage capacity of the rock bed heat storage system is also certain. With the increase in CO2 injection temperature, the maximum heat storage capacity of the rock bed heat storage system increases, but the temperature gradient between CO2 and the rock bed increases, leading to an increase in heat injection and heat production time.
(3) When the CO2 injection pressure is low, the input and output of heat storage in the rock bed are relatively smooth, and the heat storage capacity only has two stages of “slow rise—slow fall,” so the heat storage system can be designed to operate in two stages of “heat storage—heat production” all year round, and the problem of low heat storage capacity can be solved by increasing the CO2 injection temperature. When the CO2 injection pressure is high, the heat storage capacity of the heat storage system has four stages “rapid increase—stability—rapid decrease—stability”. So under higher injection pressure, the operation mode of the rock bed heat storage system can be changed to “heat storage—heat preservation—heat production—shutdown”. Therefore, it is possible to choose different operation modes according to the actual demand to achieve the purpose of economic operation.
The raw data supporting the conclusion of this article will be made available by the authors, without undue reservation.
HG and YW designed the study and wrote the manuscript. HG, YW, GH, and YH obtained and analyzed data for the research. HG, DL, and HZ prepared the figures. All authors contributed to the discussion of research results and manuscript revision.
This work was supported by the National Natural Science Foundation of China (Grant No. 51674247).
The authors thank State Key Laboratory for Geomechanics and Deep Underground Engineering for providing experimental equipment. It is also grateful for the financial support provided by the National Natural Science Foundation of China.
The authors declare that the research was conducted in the absence of any commercial or financial relationships that could be construed as a potential conflict of interest.
All claims expressed in this article are solely those of the authors and do not necessarily represent those of their affiliated organizations, or those of the publisher, the editors and the reviewers. Any product that may be evaluated in this article, or claim that may be made by its manufacturer, is not guaranteed or endorsed by the publisher.
Akgiray, O., and Saatcl, A. M. (2001). A new look at filter backwash hydraulics. Water Sci. Technol. Water Supply 1 (2), 65–72. doi:10.2166/ws.2001.0022
Allen, K. G., Von Backstr, M. T. W., and Kr Ger, D. G. (2013). Packed bed pressure drop dependence on particle shape, size distribution, packing arrangement and roughness. Powder Technol. 246, 590–600. doi:10.1016/j.powtec.2013.06.022
Allen, K. G., Von Backstr, M. T. W., and Kr Ger, D. G. (2014). Packed rock bed thermal storage in power plants: Design considerations. Energy Procedia 49, 666–675. doi:10.1016/j.egypro.2014.03.072
Atrens, A. D., Gurgenri, H., and Rudolph, V. (2010). Electricity generation using a carbon-dioxide thermosiphon. Geothermics 39, 161–169. doi:10.1016/j.geothermics.2010.03.001
Biot, M. A. U. R. I. C. E. A. (1941). General theory of three-dimensional consolidation. J. Appl. Phys. 12 (2), 155–164. doi:10.1063/1.1712886
Biot, M. A. U. R. I. C. E. A. (1954). Theory of stress-strain relations in anisotropic viscoelasticity and relaxation phenomena. J. Appl. Phys. 25 (11), 1385–1391. doi:10.1063/1.1721573
Brown, D. (2000). “A hot dry rock geothermal energy concept utilizing supercritical CO2 instead of water[C] IIAnon,” in Proceedings of the Twenty-Fifth Workshop on Geothermal Reservoir Engineering (Stanford, CA, USA: Stanford University), 6.
Bu, W. (2012). Experimental study of permeability of broken rock sampled from strata containing faults[J]. J. Exp. Mech. 27 (04), 469–473.
Chen, H. Y., and Teufel, L. W. (1997). Coupling fluid-flow and Geomechanics in dual-porosity modeling of naturally fractured reservoirs [M]. oil field.
Dong, X., Geng, H. Z., Hao, G., Li, P., Teng, Y., Zhang, W., et al. (2021). Numerical simulation on heat recovery efficiency of different working fluids in high-temperature rock mass[J]. Geofluids 2021, 1468825.
Furnas, C. C. (1930). Heat transfer from a gas stream to a bed of broken solids—ii1,2. Industrial Eng. Chem. 22 (7), 721–731. doi:10.1021/ie50247a008
Gatmiri, B., and Delage, P. (1997). A formulation of fully coupled thermal-hydraulic-mechanical behaviour of saturated porous media—numerical approach. Int. J. Numer. Anal. Methods Geomechanics 21 (3), 199–225. doi:10.1002/(sici)1096-9853(199703)21:3<199::aid-nag865>3.0.co;2-m
Ha, L. T., and Saha, T. K. (2004). “Investigation of power loss and voltage stability limits for large wind farm connections to a subtransmission network[C],” in Power Engineering Society General Meeting (IEEE).
Jiang, Tao (2011). Damage analysis of water injection layer and casing based on thermal hydraulic mechanical coupling model[D]. Northeast Petroleum University, Daqing, China.
Li, J. L., Jin, W. T., Hui, D., and Zhang, Y. (2016). The typical application and technology trend of large-scale energy storage in renewable energy generation [J]. Electr. Energy Manag. Technol. (14), 7.
Li, S., and Dai, Y. (2014). Thermo-economic comparison of Kalina and CO2 transcritical power cycle for low temperature geothermal sources in China[J]. Appl. Therm. Eng. 70 (1), 139–152. doi:10.1016/j.applthermaleng.2014.04.067
Liu, G. J., Han, L. P., Wang, Y. P., and Jiang, J. Z. (2018). Research progress of solid thermal storage technology [J]. Appl. Energy Technol. (03), 1–4.
Markevich, N. J., and Cecilio, C. B. (2015). Through-flow analysis for rockfill dam stability evaluations[C] Waterpower'91: A New View of Hydro Resources. Sam Francisco:ASCE, 1991, 1734–1743.
Piwko, R., Miller, N., Sanchez-Gasca, J., Yuan, X., Dai, R., and Lyons, J. (2009). “Integrating large wind farms into weak power grids with long transmission lines[C],” in 2006 CES/IEEE 5th International Power Electronics and Motion Control Conference (IEEE).
Pruess, K. (2006). Enhanced geothermal systems(EGS) using CO2 as working fluid: A novel approach for generating renewable energy with simultaneous sequestration of carbon[J]. Ceother-mics 35, 351–367. doi:10.1016/j.geothermics.2006.08.002
Pruess, K. (2008). On production behavior of enhanced geothermal systems with CO2 as working fluid[J]. Energy Convers. Manag. 49, 1446–1454. doi:10.1016/j.enconman.2007.12.029
Savage, W. Z., and Braddock, W. A. (1982). A model for hydrostatic consolidation of Pierre shale. Int. J. Rock Mech. Min. Sci. Geomechanics Abstr. 28 (5), 345–354. doi:10.1016/0148-9062(91)90073-u
Schumann, T. E. W. (1929). Heat transfer: A liquid flowing through a porous prism. J. Frankl. Inst. 208 (3), 405–416. doi:10.1016/s0016-0032(29)91186-8
Shang, H. (2017). Experimental study on fluid-solid coupling seepage stability of broken coal and rock[D]. Xi'an University of Science and Technology, Xi’an, China. (in Chinese).
Shen, Z., Wang, H., and Li, G. (2010). Feasibility analysis of coiled tubing drilling with supercritical carbon dioxide. Petroleum Explor. Dev. 37 (06), 743–747. doi:10.1016/s1876-3804(11)60008-6
Shu, B., Zhu, R., Elsworth, D., Dick, J., Liu, S., Tan, J., et al. (2020). Effect of temperature and confining pressure on the evolution of hydraulic and heat transfer properties of geothermal fracture in granite. Appl. Energy 272, 115290. doi:10.1016/j.apenergy.2020.115290
Tortike, W. S., and Ali, S. M. F. (1987). A framework for multiphase nonisothermal fluid flow in a deforming heavy oil reservoir[Z].
Tortike, W. S., and Ali, S. (1991). Prediction of oil sand failure due to steam-induced stresses [J]. J. Can. Petroleum Technol. 30 (01), 87–96.
Vaziri, H. H. (1988). Coupled Fluid Flow And Stress Analysis Of Oil Sands Subject To Heating[J]. Journal of Canadian Petroleum Technology 27 (05).
Wang, H. Z., Li, G. S., Zheng, Y., Sepehrnoori, K., Shen, Z. H., Yang, B., et al. (2020). Research status and prospects of supercritical CO2 fracturing technology[J]. Acta Pet. Sin. 41 (01), 116–126.
Wang, M. L., Miao, S., Maji, A. K., and Hwang, C. L. (1992). Effect of water on the consolidation of crushed rock salt: Engineering mechanics, 531–534.
Wu, Y., Geng, H. Z., Hao, G., and Li, D. (2022). Experimental study on heat exchange efficiency of rock bed heat storage system based on broken rock mass. ENERGY Rep. 8, 12456–12465. doi:10.1016/j.egyr.2022.08.274
Wu, Y., Li, P., Hao, Y., Wanniarachchi, A., and Peng, S. H. (2021). Experimental research on carbon storage in a CO2-Based enhanced geothermal system[J]. Renew. Energy, 175.
Yang, W., Wang, S., and Chen, J. (2015). Preliminary study on laws of steady state seepage of gas in over-broken rock mass[J]. Coal Technol. 34 (006), 189–191. (in Chinese).
Keywords: heat storage system, rock packed bed, thermal hydraulic mechanical couple, heat storage efficiency, heat storage capacity
Citation: Geng H, Wu Y, Hao G, Hao Y, Li D and Zhou H (2023) Numerical study on heat storage efficiency of broken rock mass under different CO2 injection conditions. Front. Earth Sci. 11:1142167. doi: 10.3389/feart.2023.1142167
Received: 11 January 2023; Accepted: 13 February 2023;
Published: 23 February 2023.
Edited by:
Danqi Li, Curtin University, AustraliaReviewed by:
Zhengyang Song, University of Science and Technology Beijing, ChinaCopyright © 2023 Geng, Wu, Hao, Hao, Li and Zhou. This is an open-access article distributed under the terms of the Creative Commons Attribution License (CC BY). The use, distribution or reproduction in other forums is permitted, provided the original author(s) and the copyright owner(s) are credited and that the original publication in this journal is cited, in accordance with accepted academic practice. No use, distribution or reproduction is permitted which does not comply with these terms.
*Correspondence: Yu Wu, d3V5dUBjdW10LmVkdS5jbg==
Disclaimer: All claims expressed in this article are solely those of the authors and do not necessarily represent those of their affiliated organizations, or those of the publisher, the editors and the reviewers. Any product that may be evaluated in this article or claim that may be made by its manufacturer is not guaranteed or endorsed by the publisher.
Research integrity at Frontiers
Learn more about the work of our research integrity team to safeguard the quality of each article we publish.