 Hailong Zhou1
 Chenglong Ge
95% of researchers rate our articles as excellent or good
Learn more about the work of our research integrity team to safeguard the quality of each article we publish.
Find out more
ORIGINAL RESEARCH article
Front. Earth Sci. , 20 February 2023
Sec. Environmental Informatics and Remote Sensing
Volume 11 - 2023 | https://doi.org/10.3389/feart.2023.1140038
This article is part of the Research Topic Advances in Development and Utilization of Underground Space, volume II View all 13 articles
The mud powder in the manufactured sand will have an influence on the indicators of the manufactured sand concrete (MSC), and the methylene blue value can quantitatively indicate the mud powder content. To demonstrate the impact of MB values on the performance and microstructural characteristics of the manufactured sand concrete, the paper designed five high-strength MSC proportions at five MB values by controlling the clay powder content. On this basis, the workability, chloride migration coefficient, relative dynamic modulus of elasticity (P), mass loss rate (η), and dry shrinkage rate of MSC concrete were tested under five mix ratios, and the relationship between concrete microstructure, fractal characteristics, and compressive strength (fcc) was analyzed by combining SEM technology and fractal theory. The experiment showed that: the higher the MB, the lower the fluidity of the MSC, and the cohesiveness gradually increases, while the water retention remains basically unchanged. In addition, the chloride migration coefficient gradually increases, the P after 300 freeze-thaw cycles first increases and then gradually decreases, while the η and drying shrinkage first decreases and then gradually increases, and the MB value corresponding to the turning point of these three changes are all 1.10. With MB values of 0.85 and 1.10, the degree of hydration of MSC is higher and the overall structural compactness is better. The higher the MB value, the more inadequate the hydration of concrete, and the mineral components such as fly ash that have not been hydrated inside gradually increase, which leads to the gradual decrease of the overall structure compactness. In addition, when the MB value is small, the SEM image texture of concrete is relatively simple, the fractal dimension value is small, and the corresponding fcc is large. When the MB value is large, the texture of the SEM image is complex, the fractal dimension is large, and the corresponding fcc is small.
The MS will produce mud powder in the mining and processing process, and the fine powder particles below 75 μm are composed of stone powder MS. It has been shown that the right amount of stone powder has an improving effect on the performance of MSC (Wang et al., 2021; Zheng et al., 2021; Elik and Marar, 1996). However, unlike stone powder, mud powder will adversely affect the working performance, mechanical properties, and durability of concrete due to its characteristics, which is also an important reason for controlling the content of mud powder in MS in engineering applications (Xiao et al., 2020; Che et al., 2021).
At present, the relevant scholars mainly use methylene blue (MB) value to characterize the silt content in MC, and systematically study the working performance and mechanical properties of MSC under different MB values. Wang et al. (2009) investigated the workability and mechanical properties of MSC with different MB values. Research indicates that the MSC compatibility, flexural strength, and 7 d fcc all gradually decreased with the MB increase, but the 28d fcc remained the same. Gui et al. (2011) investigated the compatibility of MSC with different stone dust contents and MB values in MS. Research indicates that when the MB value < 1, the appropriate amount of stone powder in the MS helps to improve the compatibility of MSC; MB value ≥ 1, the stone powder content should be controlled < 5% to ensure the workability of MSC. Deng et al. (2021) investigated the fcc of MSC at different MB values and pointed out that the highest point of 3d fcc of MSC occurs at MB value 0.75 and the highest point of 7d fcc of MSC occurs at MB value 1.5. Zhou et al. (2016) investigated the freezing resistance and strength of MSC with different MB values, and the results showed that increasing the MB value would not have a negative effect on the fcc of C30 MSC, but would reduce the fcc and freezing resistance of C60 MSC. Sun et al. (2021) discussed the fcc and carbonation of MSC at different MB values, and the results showed that the fcc of MSC shows a trend of slowly increasing and then rapidly decreasing with the MB value, the modulus of elasticity decreased gradually, and the carbonation depth became deeper gradually. Xia et al. (2021) found that as the MB value increased, MSC indicators such as electrical flux rate and chloride ion diffusion coefficient showed a tendency to increase first and then decrease. The research shows that there are large differences in the performance of different strength grades of MSC at different MB values (Wang et al., 2012). At present, there are fewer systematic studies on the effect of MB value on the performance of MSC, especially for high-strength MSC.
In addition, the deterioration of MSC properties is the macroscopic manifestation of the internal microstructure change. Therefore, it is of significance to study the internal structure changes of concrete from a micro perspective for understanding the deterioration mechanism of concrete during service. At present, related scholars commonly use the SEM method to investigate the hydration products and internal structure change pattern of concrete from a microscopic perspective (Mouret et al., 1999; Diamond and Huang, 2001). Shen et al. (2021) used the SEM technique to analyze the evolution of internal concrete defects under external load. Yang et al. (2012) used the SEM technique to photograph the transition zone at the concrete interface and observed the evolution of the hydration reaction of aggregates and pastes at various ages. Wang et al. (2005) studied the micro-crack characteristics of concrete at different temperatures using SEM technology. Li et al. (2022) revealed the mechanism of salt and frost deterioration of wind-cured sand concrete using the SEM technique. Patil et al. (2018) studied the microstructure of bagasse ash concrete with SEM technology. Khonsari et al. (2018) revealed the effect of swollen perlite aggregates on the number, shape, and distribution of concrete pores by SEM images. From the existing results, most studies are mainly based on the qualitative description of the apparent morphology characteristics of concrete by SEM, which fails to quantitatively characterize the change characteristics and trends of internal structure. With the development of digital image processing technology, combined with SEM images and fractal theory, establishing quantitative relationships between internal pores and macroscopic mechanical properties of concrete from the microscopic point of view, to realize the purpose of microscopic service to the macroscopic (Zhang et al., 2021; Han et al., 2022).
To explore the influence of MB value on the performance and microstructure characteristics of MSC, the mix proportion of high strength MSC under five MB values was designed by controlling the content of mud powder. On this basis, the effects of MB value on the working performance, chloride penetration resistance, salt freezing resistance, and dry shrinkage of MSC were studied through the working performance test of fresh concrete, chloride penetration resistance test, salt freezing resistance test, and shrinkage test of hardened concrete under five mixing ratios. Secondly, combined with SEM technology and the differential box dimension method, the fractal dimension of the surface of concrete hydration products was quantitatively calculated, the variation law of fractal dimension with MB value was analyzed, and the relationship between fractal dimension and fcc of concrete was established.
Test materials mainly include the following:
(1) The cement is Jidong P·O42.5 grade cement, 28 d fcc is 54.2 MPa, density is 3,030 kg/m2, and volume stability is qualified.
(2) Metakaolin was produced by Inner Mongolia Super Brand Building Materials Co., Ltd., with a density of 2.67 g/cm3.
(3) The fineness of fly ash is 9.1% and the water requirement ratio is 92%.
(4) The coarse and fine aggregates are all produced by Inner Mongolia Lutong Stone Co., Ltd. The parent rock is basalt. The MS is sieved and washed by a 75 μm square-hole sieve. The fineness modulus is 3.5, the bulk density is 1,582 kg/m3, the crushing index is 16.3%, and the stone powder content is 1.6%.
(5) Mud powder used in Zhuozi Mountain gravel field local soil, through 75 μm square hole sieve, liquid limit WL=40%, plastic limit WP=19%.
(6) Additives used in Inner Mongolia Hengzhong Engineering Materials Co., Ltd. Polycarboxylate superplasticizer, water reduction rate of 30%.
(7) The mass fraction of methylene blue (C16H18ClN3S·3H2O) was greater than 95%.
Experiment to explore the effect of clay powder content on the performance and fractal characteristics of MSC, five different concrete proportions of MSC with different clay powder content were designed as shown in Table 1 Proportion of MSC The mud powder contents selected in the experiment were 0%, 0.5%, 1.0%, 1.5%, and 2.0%, respectively. The MB values under the corresponding conditions were 0.85, 1.10, 1.35, 1.70, and 2.00, respectively, measured by the methylene blue test. In addition, Table 1 Proportion of MSC also shows the fcc and tensile strength (fts) of MSC at 28 d age under the above five mixing ratios.
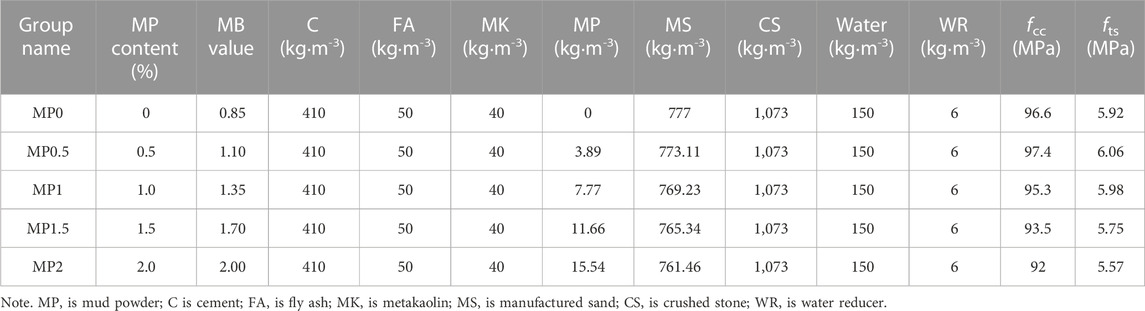
TABLE 1. Proportion of MSC.
Based on this, this paper carried out macro tests such as chloride ion penetration test, salt freezing test, and drying shrinkage test of MSC under the above mix ratio, and used SEM technology to test the microstructure of MSC at 28 d. Among them:
(1) Anti-chlorine ion penetration test using rapid chloride migration coefficient method (or RCM method). The specimen was a cylinder of Φ100 mm × 50 mm. Under standard maintenance conditions for 84 d, the anti-chlorine ion permeation grade is set to RCM-Ⅴ. The voltage selected during the test was 60V, and the test lasted for 96 h.
(2) Fast freezing method was used in the salt-freezing test, and the specimen was a prism of 100 mm × 100 mm × 400 mm. The salt-freeze test was carried out after curing for 28 days under standard curing conditions. The freezing and thawing medium was 3% NaCl solution, and the freezing resistance grade was F300. The η and P were measured every 25 times.
(3) Shrinkage test using contact method, the specimen is 100 mm × 100 mm × 515 mm prism. The length of specimens was measured at 3 d, 7 d, 14 d, 28 d, 60 d, 90 d, and 120 d.
(4) For microstructure tests, field emission scanning electron microscopy was used to observe the microscopic morphology of hydration products in concrete specimens with five groups of MB values at 28 d age.
Table 2 Test results of workability of MSC under different MB values. Indicates the fresh concrete workability at different MB values. Table 2 test results of workability of MSC under different MB values. Indicates that both the slump and extension of fresh concrete mixes show an overall trend of gradual decrease with the MB value. When the MB value increased from 0.85 to 2.00, the slump decreased by 25% from 220 mm to 165 mm. The expansion is reduced by 16% from 500 mm to 420 mm. Hence, the higher the MB value, the worse the flowability of the fresh concrete mix. Table 2 test results of workability of MSC under different MB values. Reveals that the higher the MB value, the greater the cohesiveness of the fresh concrete mix increases, while the water retention remains largely unchanged.
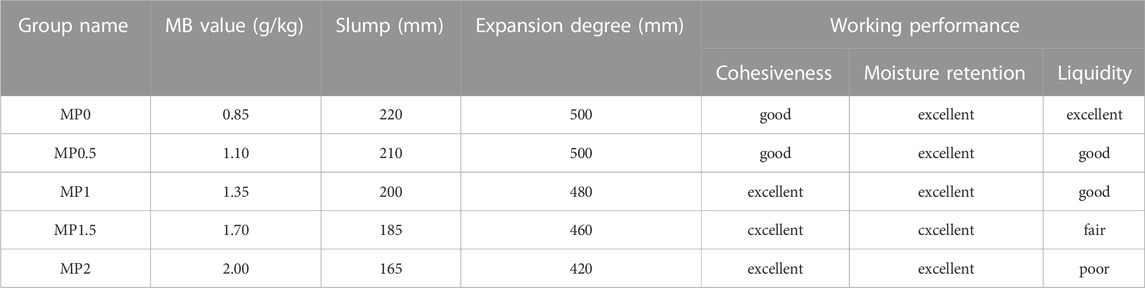
TABLE 2. Test results of workability of MSC under different MB values.
The main reasons for this phenomenon are: Firstly, the mud powder itself has strong water absorption; Secondly, the mud powder can adsorb the molecules of the polycarboxylate superplasticizer into its interlayer structure, reducing the molecular weight of the superplasticizer, which weakens the water-reducing efficiency of the water-reducing agent. In the case of unchanged water consumption and water-reducing agent dosage, with the increase of mud powder content, the free water inside the slurry gradually decreases, and the effective water consumption for fresh concrete mixing also decreases accordingly, and the cohesiveness of the mix increases. At this time, the flow resistance between the materials inside the slurry increases, which leads to the deterioration of its fluidity. Therefore, The more the content of mud powder (MB value), the slump and expansion of fresh concrete mixes are gradually reduced.
The impermeability of concrete refers to the difficulty of resisting the diffusion, penetration, or migration of liquids, gases, or ions in concrete by external effects such as pressure, ion concentration differences, and electric fields. Most studies use the concrete chloride migration coefficient to characterize its impermeability, and the chloride migration coefficient is also an important indicator to describe the compactness of concrete. In general, the smaller the chloride migration coefficient, the better the permeability of the concrete and the higher the degree of compactness. The chloride migration coefficient of concrete obtained using the RCM method can be calculated according to Eq. 1.
where DRCM is the chloride permeability coefficient of concrete (m2/s), U is the absolute voltage (V), T is the average value of the initial temperature and the end temperature of the anode solution (°C), L is the thickness of the specimen (mm), Xd is the chloride penetration depth (mm), t is the test duration (h).
The specific results that can be obtained using Eq. 1 are shown in Figure 1 Test results of chloride permeability coefficient of MSC. After analysis, the chloride migration coefficient increased from 0.884 × 10⁻¹² m2/s to 1.408 × 10⁻¹² m2/s when the MB value increased from 0.85 to 2.00, which increased by 59.28%. That is the chloride migration coefficient of the MSC gradually increases with increasing MB value, which is consistent with the conclusion obtained by Xia et al. (2021).
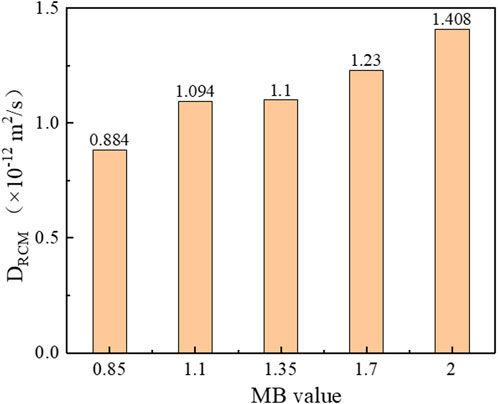
FIGURE 1. Test results of chloride permeability coefficient of MSC.
The above phenomenon shows that the MB value, the more permeable the concrete is, and the less dense it becomes. This is because the mud powder is an expansive clay, the mixing of mud powder will make the concrete wet expand and dry shrinkage, thus affecting the bonding of cementitious materials and aggregates, causing micro-cracks inside the concrete, which in turn makes the concrete less compact and more permeable (Liu et al., 2015).
P and η are the main indicators of the frost resistance of concrete. Salt freeze resistance tests were carried out on concrete specimens (age 28 days) at different MB values using the fast freeze method; the P and η of the specimens were measured every 25 cycles, and the results are shown in Figure 2. The P and η can be calculated according to Eqs 2, 3.
where P is the relative dynamic elastic modulus after n cycles of freezing and thawing, f0 and fn are the initial transverse fundamental frequency and the transverse fundamental frequency (Hz) after n cycles of freezing and thawing, respectively.
where η is the mass loss rate, m0 and mn are initial mass and mass (g) after n cycles of freezing and thawing, respectively.
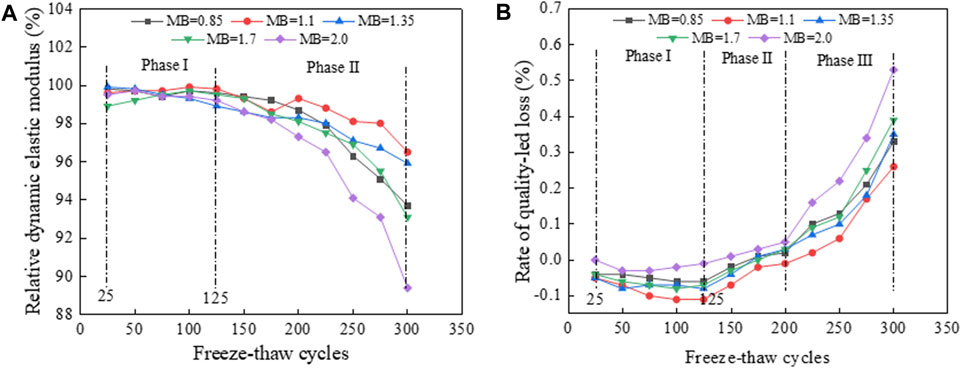
FIGURE 2. Variation of P and η of MSC with freeze-thaw cycles: (A) P, (B) η.
From Figure 2A, it can be seen that the P can be divided into two stages in general as the number of freeze-thaw cycles n increases. (1) For n ≤ 125 cycles, the internal pore structure of the specimen is unaffected by the n, and thus the P does not change with the increase in the n. (2) For n > 125 cycles, the P decreases gradually with the increase of the n. This indicates that after a certain n (125 cycles), the specimens gradually produce microcracks caused by freeze-thaw action, and the number of microcracks gradually increases with the increase of the n. In addition, after 300 freeze-thaw cycles, the P of the specimens showed an overall increase with the increase of MB value and reached the maximum value at the MB value of 1.10, and then gradually decreased.
From Figure 2B, it can be seen that the η, in general, can be divided into three stages as the n increases. Stage I: negative decreasing stage. n ≤ 125 times, the η is negative, and its absolute value increases with the increase of the n. From the previous analysis, it can be seen that when n ≤ 125 times, the internal pore structure of the specimen is basically not affected by the freeze-thaw cycle, so the quality of the specimen does not change with the increase in the n. On the contrary, due to the existence of water absorption of mineral admixture and the initial tiny pores inside the specimen, the specimen continuously absorbs the water in the environment during the freeze-thaw process, and its quality gradually increases with the increase of the n, which leads to the increasing absolute value of the specimen quality loss rate. Stage II: Negative increase stage. 125 < n < 200 times, the quality loss rate is still negative, but its absolute value gradually decreases with the increase in the n. This is because after the n exceeds 125, the surface of the specimen starts to shed due to the freeze-thaw action, which leads to the reduction of the specimen quality. However, the mass of the specimen shedding at this stage is relatively small, and the mass after the freeze-thaw cycle is still larger than its initial mass. Therefore, the η in this stage is still negative. Stage III: positive increasing stage. n ≥ 200 times, the mass of the specimen after freeze-thaw cycles is less than its initial mass, and the total mass shed in this stage increases gradually with the increase of the n. Therefore, the η at this stage is positive and increases gradually with the n. In addition, after 300 freeze-thaw cycles, the η of the specimens showed an overall decrease with the increase of MB value and reached the minimum value at the MB value of 1.10, and then gradually increased again. It indicates that the surface of the MSC at different MB values showed some peeling phenomenon after 300 freeze-thaw cycles, but the surface morphology remained relatively intact, as shown in Figure 3.
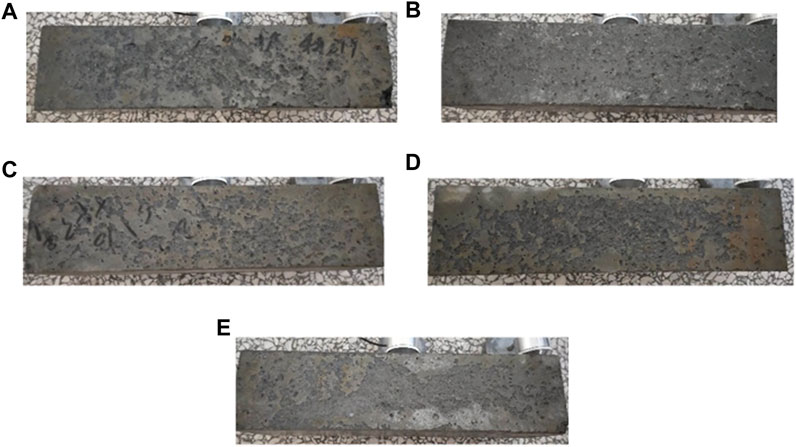
FIGURE 3. Surface morphology of MSC after 300 cycles of salt freezing: (A) MB=0.85, (B) MB=1.1, (C) MB=1.35, (D) MB=1.7, (E) MB=2.0.
The changes in P and η can be seen that the appropriate amount of mud powder can effectively improve the salt freezing resistance of the mechanism sand concrete, but the content of mud powder will reduce the salt freezing resistance of the machine when it exceeds a certain value. From the test results, the best MB value can be determined as 1.10 for the ratio designed in this paper, and the corresponding mud powder content is 0.5%.
Concrete is prone to shrinkage during hardening, leading to cracking. Cracking not only accelerates the entry of corrosive substances into the material but also causes the overflow of hydration products within the material. Especially in the northern region, long-term seasonal freeze-thaw cycles will accelerate the development of material microstructure damage, resulting in a decline in the overall stability and durability of concrete. Research on concrete shrinkage mostly revolves around drying shrinkage, and the drying shrinkage rate is commonly used to evaluate its shrinkage.
Figure 4 shows the variation of drying shrinkage of concrete specimens with age under different mixing ratios. As the age increases, the shrinkage evolution process of concrete under different MB values can be divided into three stages: rapid shrinkage, slow shrinkage, and shrinkage balance (Zhao et al., 2018). ① In the rapid shrinkage stage (age ≤ 28 d), the drying shrinkage rate of this stage is relatively large, and the shrinkage amount can account for 75% of the total shrinkage, or even higher. Therefore, the drying shrinkage of concrete mainly occurs in the early stage. ② Slow shrinkage stage (28 d < age < 90 d), the shrinkage deformation rate of this stage is slow, and the shrinkage process lasts longer. ③ Shrinkage balance stage (age ≥ 90 d), the shrinkage process of this stage is close to stability, and the relative humidity inside the concrete and the environment reaches equilibrium. When the ambient humidity is lower than the internal relative humidity of concrete, the shrinkage process will restart until the internal and external relative humidity balance is reached again.

FIGURE 4. Variation of drying shrinkage rate of MSC with age and MB value: (A) age, (B) MB value.
In addition, when the age is the same, the drying shrinkage of concrete decreases first, and reaches the minimum value when the MB value is 1.10 (mud powder content is 0.5%), and then gradually increases. This shows that an appropriate amount of mud powder can inhibit the drying shrinkage process of concrete; on the contrary, when the mud powder content is too high, it will promote the development of the concrete drying shrinkage process. The reasons for this phenomenon can be explained from the following two aspects: 1) an Appropriate amount of mud powder can fill the pores between aggregates, which has played a certain optimization role in the internal porosity, thereby reducing the drying shrinkage of concrete; 2) However, mud powder belongs to clay minerals, which is loose and porous, and has good water absorption performance. The excessive content of mud powder will make cement absorb too much water in the hydration process, and the water content of concrete after hardening is relatively large. When the internal relative humidity of concrete is greater than the environmental humidity, the surface moisture evaporates, the internal moisture diffuses to the surface, and the moisture adsorbed by mud powder is released, increasing the dry shrinkage of concrete.
To study the timeliness of concrete shrinkage deformation, based on a large number of test results, scholars have established many prediction models for calculating the shrinkage strain of concrete under different conditions (An et al., 2001). Among them, the hyperbolic prediction model given by the China Academy of Construction Sciences is the most widely used (Lv et al., 2004), and its expression is:
where, εs(t) is the drying shrinkage of concrete at time t; a and b are the material test constants.
Eq. 4 is used to fit the dry shrinkage rate of MSC under different MB values in Figure 4, and the results are shown in Table 3 Analysis results of shrinkage of MSC (hyperbolic function) under different MB values. The predicted results are close to the experimental results, with a large correlation coefficient R and the error is relatively small. It indicates that the relationship between the dry shrinkage rate of MSC and age under the condition of mix proportion in this test can be described by the hyperbolic function expressed in Eq. 4.
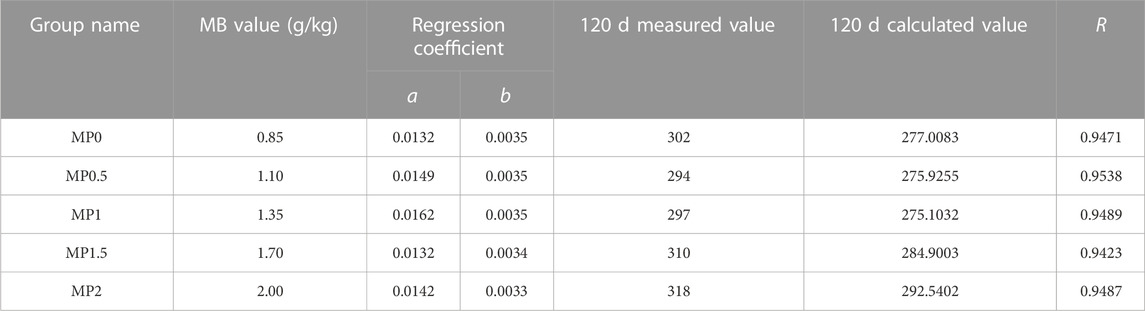
TABLE 3. Analysis results of shrinkage of MSC (hyperbolic function).
Fractal is a method for characterizing or describing irregular, self-similar, and scale-invariant objects or phenomena. The quantitative parameters characterizing the fractal properties of objects or phenomena are generally called fractal dimensions. The spatial distribution of concrete microstructure can be qualitatively seen from SEM images, but it cannot be quantitatively described. Combined with fractal theory, the distribution of concrete microstructure satisfies a certain fractal law, and the fractal analysis can effectively quantify and compare the complexity of the microstructure. Therefore, based on the information contained in SEM images, the spatial distribution of concrete microstructure can be quantitatively characterized by fractal dimension. At present, the methods for calculating fractal dimension mainly include box dimension, Hausdorff dimension, similarity dimension, Brownian motion algorithm, and differential box dimension (Yang et al., 2009). Because differential box dimension DB has good accuracy and applicability and can meet the requirements of computational efficiency and dynamic characteristics, it is often used as a measure of image surface texture roughness.
The digital image obtained by using the scanning electron microscope equipment is a grayscale image, which can be regarded as a three-dimensional space (x, y, z). Where x and y denote the position of the pixel in the image plane and z denotes the grayscale value of the pixel. Therefore, the gray values constitute a concave and convex surface, and the spatial distribution of each pixel color can reflect the texture characteristics of the image. According to the fractal theory, the fractal dimension is an important parameter for the quantitative portrayal of non-smooth, non-regular, broken, and other extremely complex fractals, characterizing the complexity and roughness of the fractals. That is to say, the larger the fractal dimension, the more complex and rough the fractals are; conversely, the smaller the fractal dimension, the simpler and smoother the fractals are. The fractal dimension combines spatial information and color information of images simply and organically, which effectively reflects the complexity of material structure.
When calculating fractal dimension based on a grayscale SEM image, the traditional method is to convert it into a black and white pixel image by binarization. For SEM images, each gray value in the image represents the corresponding information. After binarization processing, the characteristics of cementitious materials, hydration products, holes, and cracks cannot be effectively expressed, which affects the data analysis results. Therefore, this paper directly calculates the fractal dimension by using the difference box dimension based on the gray image of concrete SEM. The main idea of this method is as follows (Sarkar and Chaudhuri, 1994): For an M × M image, it can be regarded as a surface (x, y, z) in three-dimensional space, where (x, y) represents the position in the surface and z is the gray value at that position. The plane is divided into several grids of L × L, let r=L/M, and each grid is a box of L × L × h. h represents the gray value of each box and satisfies G/h=M/L. G represents the total gray level. Assuming that in the (i, j) grid, the maximum and minimum image gray levels are box l and box k respectively, then:
The total number of boxes needed to cover the whole image is:
The fractal dimension is:
For a series of L, the specific values of logNr and log (1/r) can be obtained, and then the least square method is used for linear regression analysis in the double logarithmic coordinate system. The linear slope obtained by regression is the difference box dimension DB.
Figure 5 shows the SEM images of MSC under different MB values (5,000 ×) and the difference box dimension DB calculated by a double logarithmic coordinate system. When the MB value is small, the hydration degree of MP0 and MP0.5 groups is high, and the structure formed by hydration is close, containing C-S-H gel, which makes the cement particles and other hydration products closely connected to form a dense whole with a strong spatial structure. The degree of hydration of the MP1∼MP2 group gradually decreases with the increase of MB value, and the mineral components such as fly ash that have not completed hydration inside gradually increase, and cracks appear on the concrete surface. This is because the clay powder itself is not active, and the addition of too much clay powder has an inhibiting effect on the hydration of the cementitious material, resulting in an increase in unhydrated fly ash particles. Due to the poor bonding effect between fly ash and hydration products, which in turn causes cracks to appear at the junction of the two, affecting the overall structural compactness.
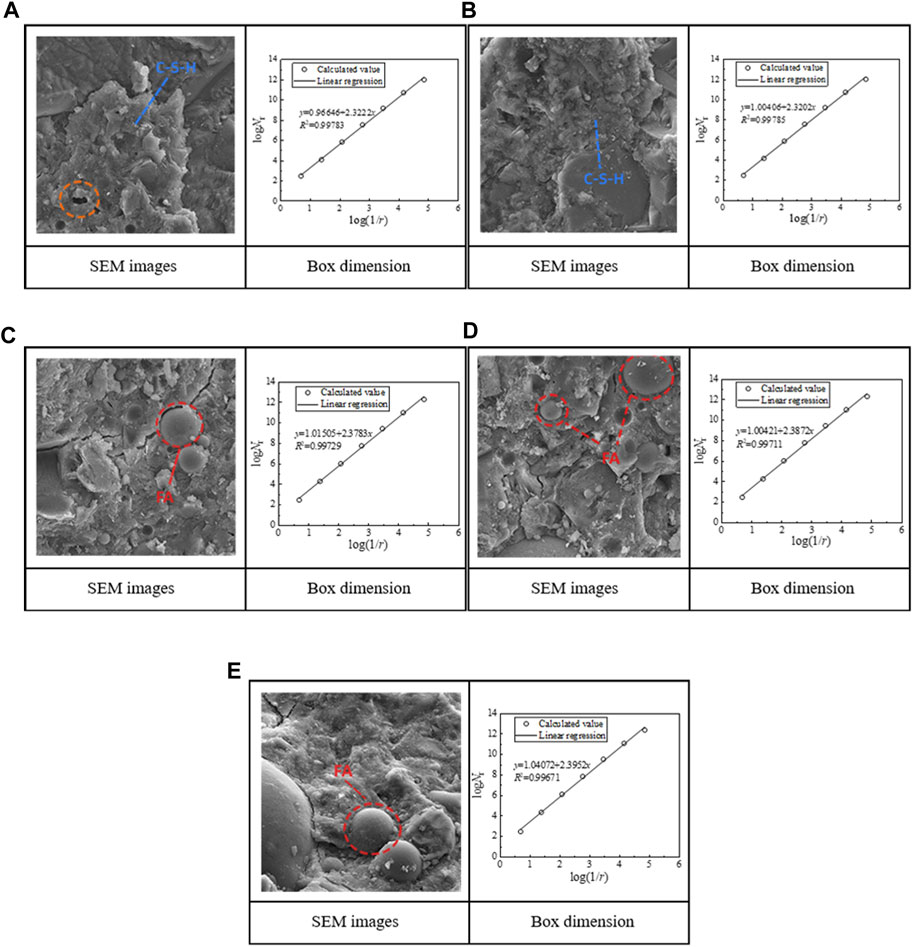
FIGURE 5. SEM images and fractal dimension of MSC: (A) MP0, (B) MP0.5, (C) MP1, (D) MP1.5, (E) MP2.0.
In addition, it can be seen from Figure 5 that the fractal dimensions of MSC under different MB values are between 2.3202 and 2.3952, and the fitting degree of the differential box dimension method to the fractal dimension of the MSC surface is above 0.996, indicating that the surface morphology of MS coagulation under different MB values has good fractal characteristics. When the MB value is 0.85 and 1.10, the hydration degree of the MP0 and MP0.5 groups is higher, the microscopic appearance is relatively flat, and the texture of the SEM image is simple. The fractal dimension of these two groups of images is relatively small and close to 2.3222 and 2.3202, respectively. Then, with the increase of MB value, the hydration degree of the MP1.0 → MP2.0 group decreased gradually, and there were a large number of unhydrated fly ash in the concrete, and the internal began to appear micro cracks. At this time, the SEM image showed complex texture, and the fractal dimension of the image was larger, which were 2.3783, 2.3872, and 2.3952, respectively.
The above analysis shows that the fractal dimension can quantitatively explain the changing trend of MSC structure under different MB values, and can better reflect the influence of mud powder on the hydration degree and structure of concrete. The hydration degree of concrete not only affects the microstructure of concrete but also affects its macroscopic mechanical properties. To quantitatively analyze the influence of the microstructure of concrete on its strength, Figure 6 shows the variation of fcc of MSC with fractal dimension. It can be seen that as an important feature of geometric objects, fractal dimension can not only quantitatively describe the microstructure of concrete hydration products, but also show a good correlation with the variation law of fcc. After fitting, the relationship between the fractal dimension and fcc of concrete can be described by the exponential function represented by Eq. 8, and the correlation coefficient is 0.9772.
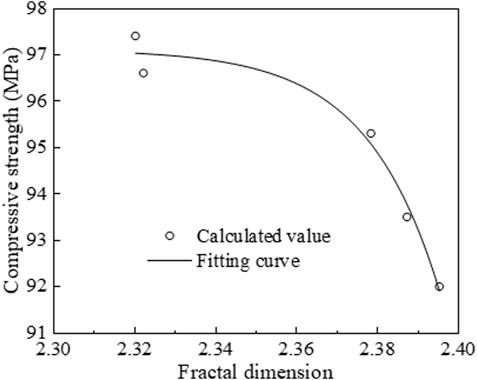
FIGURE 6. Relationship between fractal dimension and compressive strength under different mud powder content.
(1) With the increase of MB value, the MSC collapse and extension are gradually decreased, and the cohesiveness is gradually increased, while the water retention is unchanged. In addition, with the increase of MB value, the migration coefficient of chloride ions of MSC increases gradually. After 300 freeze-thaw cycles, the P first increased and then gradually decreased, while the η and drying shrinkage rate first decreased and then gradually increased, and the MB values corresponding to the turning points of the P, η, and drying shrinkage rate were 1.10.
(2) With the increase of n, the change law of P can be divided into two stages basically unchanged and gradually decreased. The change process of η can be divided into three stages: negative value reduction, negative value increase, and positive value increase. At the same time, with the increase of age, the shrinkage evolution process of concrete can be divided into three stages: rapid shrinkage, slow shrinkage, and shrinkage balance, and the drying shrinkage mainly occurs in the rapid shrinkage stage, which accounts for more than 75% of the total shrinkage.
(3) When the MB value is 0.85 and 1.10, the hydration degree of concrete is high, and hydration forms a large number of C-S-H gel, which makes cement particles and other hydration products closely connected to form a solid dense whole of spatial structure. With the increase of MB value, the hydration degree of concrete gradually decreases, and the mineral components such as fly ash that are not hydrated in the interior gradually increase, cracks appeared at the junction of fly ash and hydration products, and the overall structural compactness gradually decreased.
(4) The fractal dimension can quantitatively characterize the effect of MB values on the hydration and structure of concrete and shows a good correlation with the variation pattern of its fcc. When the MB value is small, the SEM image texture of concrete is relatively simple, the fractal dimension value is small, and the corresponding fcc is large. When the MB value is large, the texture of the SEM image is complex, the fractal dimension is large, and the corresponding fcc is small.
The original contributions presented in the study are included in the article/Supplementary Material, further inquiries can be directed to the corresponding author.
HZ provides guidance for experimental and theoretical research, conceives and designs research methods, and supports the project economically. CG completed data collection, data analysis, and paper drafting. YC assists with data collection. XS provides experimental materials and equipment for this study.
National Natural Science Foundation of China (51569021), the Natural Science Foundation of Inner Mongolia (2020MS05076), and the Key Project of Scientific Research in Higher Education Institutions of Inner Mongolia Autonomous Region (NJZZ16057).
XS was employed by Inner Mongolia Road and Bridge Group Co., Ltd.
The remaining authors declare that the research was conducted in the absence of any commercial or financial relationships that could be construed as a potential conflict of interest.
All claims expressed in this article are solely those of the authors and do not necessarily represent those of their affiliated organizations, or those of the publisher, the editors and the reviewers. Any product that may be evaluated in this article, or claim that may be made by its manufacturer, is not guaranteed or endorsed by the publisher.
An, M. Z., Zhu, J. S., and Qian, W. Z. (2001). Autogenous shrinkage problem of high performance concrete. J. Build. Mater. 2001 (2), 159–166. doi:1007-9629(2001)02-0159-08
Che, D. L., Wang, J. J., Ding, Z. W., Ma, B., and Zhang, Y. H. (2021). Research on the performance of manufactured sand concrete with different stone powder content. E3S Web Conf. 283, 01044. doi:10.1051/e3sconf/202128301044
Deng, L., Shen, J. R., Lu, S. J., Wang, K. G., and Xie, D. Y. (2021). “Study on how to determine the methylene blue (MB) value of machine-made sand and its effects on admixture dosage and compressive strength of concrete,” in 4th international conference on civil, architecture, and environment research (Zhuhai, China: IOP Publishing). doi:10.1088/1755-1315/676/1/012104
Diamond, S., and Huang, J. (2001). The ITZ in concrete – A different view based on image analysis and SEM observations. Cem. Concr. Compos. 23 (2-3), 179–188. doi:10.1016/s0958-9465(00)00065-2
Elik, T., and Marar, K. (1996). Effects of crushed stone dust on some properties of concrete. Cem. Concr. Res. 26 (7), 1121–1130. doi:10.1016/0008-8846(96)00078-6
Gui, M. M., Zeng, C. S., Gong, M. Z., and Jun, Z. P. (2011). Effect of stone dust and MB value for manufactured sand on workability of self-compacting concrete and model analysis. Appl. Mech. Mater. 1366 (71-78), 3821–3826. doi:10.4028/www.scientific.net/AMM.71-78.3821
Han, X., Wang, B., and Feng, J. J. (2022). Relationship between fractal feature and compressive strength of concrete based on MIP. MIP Constr. Build. Mater. 322 (7), 126504. doi:10.1016/J.CONBUILDMAT.2022.126504
Khonsari, S. V., Eslami, E., and Anvari, A. (2018). Fibrous and non-fibrous Perlite concretes experimental and SEM studies. Eur. J. Environ. Civ. Eng. 22 (2), 138–164. doi:10.1080/19648189.2016.1182083
Li, Y. G., Zhang, H. M., Chen, S. J., Hu, D. W., and Gao, W. (2022). Multi-scale deterioration mechanism of salt freezing of aeolian sand concrete. Acta Mater. Compos. Sin. 40 (0), 1–12. doi:10.13801/j.cnki.fhclxb.20220607.004
Liu, Z. A., Zhou, M. K., and Yao, X. K. (2015). Study on harmfulness and evaluation of fine powder in manufactured sand. J. Build. Mater. 18 (1), 150–155. doi:10.3969/j.issn.1007-9629.2015.01.027
Lv, Y. F., Liu, L. X., and Luo, W. H. (2004). Experimental study on shrinkage performance of commercial concrete. J. Zhengzhou Univ. ( Eng. Ed. ) 25 (3), 65–69. doi:1671-6833(2004)03-0065-05
Mouret, M., Bascoul, A., and Escadeillas, G. (1999). Microstructural features of concrete in relation to initial temperature—SEM and ESEM characterization. Cem. Concr. Res. 29 (3), 369–375. doi:10.1016/S0008-8846(98)00160-4
Patil, C., Kalburgi, P. B., Patil, M. B., and Prakash, K. B. (2018). An investigation on the micro structural and elemental composition of sugarcane bagasse ash blended concrete using SEM and EDS technique. Int. J. Eng. Manuf. 8 (3), 54–66. doi:10.5815/ijem.2018.03.05
Sarkar, N., and Chaudhuri, B. B. (1994). An efficient differential box-counting approach to compute fractal dimension of image. IEEE Trans. Syst. Man, Cybern. 24 (1), 115–120. doi:10.1109/21.259692
Shen, J. R., Xu, Q. J., and Liu, M. Y. (2021). Statistical analysis of defects within concrete under elevated temperatures based on SEM image. Constr. Build. Mater. 293 (1), 123503. doi:10.1016/J.CONBUILDMAT.2021.123503
Sun, H., You, Y., Guan, Q. F., Wang, J., and Zhou, Y. X. (2021). Study on the influence of MB value of manufactured sand on carbonation performance of concrete. Concrete 2021 (11), 89–92. doi:10.3969/j.issn.1002-3550.2021.11.019
Wang, J. G., Zhou, H. L., Ge, C. L., and Chen, Y. (2021). Influence of stone powder on working performance and mechanical properties of high-strength manufactured sand concrete. Eng. J. Drainage Irrigation Mach. 39 (8), 804–810. doi:10.3969/j.issn.1674-8530.21.0002
Wang, J. L., Niu, K. M., Tian, B., and Sun, L. Q. (2012). Effect of methylene blue (MB)-value of manufactured sand on the durability of concretes. J. Wuhan Univ. Technol. Engl. Ed. Mater. Sci. 27 (6), 1160–1164. doi:10.1007/s11595-012-0622-0
Wang, J. L., Yang, Z. F., Niu, K. M., Ke, G. J., and Zhou, M. K. (2009). Influence of MB-value of manufactured sand on the shrinkage and cracking of high strength concrete. J. Wuhan Univ. Technology-Mater. Sci. Ed 24 (2), 321–325. doi:10.1007/s11595-009-2321-z
Wang, X. S., Wu, B. S., and Wang, Q. Y. (2005). Online SEM investigation of microcrack characteristics of concretes at various temperatures. Cem. Concr. Res. 35 (7), 1385–1390. doi:10.1016/j.cemconres.2004.07.015
Xia, J. L., Gao, Y. P., Zhang, P. X., Guan, Q. F., Wang, J., and Zhou, Y. X. (2021). Effect of MB value of manufactured sand on electric flux and chloride diffusion coefficient of concrete. Archit. Sci. 37 (3), 78–84. doi:10.13614/j.cnki.11-1962/tu.2021.03.013
Xiao, C., Guo, Y. G., Li, B., Zhou, M. K., Li, B. X., Liu, Z., et al. (2020). Coupled effects of the content and methylene blue value (MBV) of microfines on the performance of manufactured sand concrete. Constr. Build. Mater. 240, 117953. doi:10.1016/j.conbuildmat.2019.117953
Yang, H. C., Cheng, M. Y., and Wang, J. P. (2012). An investigation on the interfacial transition zone in concrete using SEM. Adv. Mater. Res. 1616 (446-449), 166–170. doi:10.4028/www.scientific.net/AMR.446-449.166
Yang, Y. C., Peng, R. D., and Zhou, H. W. (2009). Fractal dimension calculation method of three-dimensional space digital image. J. China Univ. Min. Technol. 38 (2), 251–258. doi:1000-1964(2009) 02-0251-08
Zhang, Y. C., Zhang, Z. R., Zhou, J. H., Zhao, L., and Liu, J. X. (2021). Application of fractal theory in concrete research. J. Phys. Conf. Ser. 1865 (3), 032014. doi:10.1088/1742-6596/1865/3/032014
Zhao, W. H., Su, Q., Wang, W. B., Niu, L., and Liu, T. (2018). Experimental study on the effect of water on the properties of cast in situ foamed concrete. Adv. Mater. Sci. Eng. 2018, 1–11. doi:10.1155/2018/7130465
Zheng, S. Y., Liang, J. L., Hu, Y. J., Wei, D. Y., Lan, Y. F., Du, H. L., et al. (2021). An experimental study on compressive properties of concrete with manufactured sand using different stone powder content. Ferroelectrics 579 (1), 189–198. doi:10.1080/00150193.2021.1903257
Keywords: MB value, manufactured sand concrete, working performance, durability, fractal characteristics
Citation: Zhou H, Ge C, Chen Y and Song X (2023) Study on performance and fractal characteristics of high-strength manufactured sand concrete with different MB values. Front. Earth Sci. 11:1140038. doi: 10.3389/feart.2023.1140038
Received: 08 January 2023; Accepted: 08 February 2023;
Published: 20 February 2023.
Edited by:
Yuwei Zhang, Xi’an University of Architecture and Technology, ChinaReviewed by:
Kai Wei, Southwest Jiaotong University, ChinaCopyright © 2023 Zhou, Ge, Chen and Song. This is an open-access article distributed under the terms of the Creative Commons Attribution License (CC BY). The use, distribution or reproduction in other forums is permitted, provided the original author(s) and the copyright owner(s) are credited and that the original publication in this journal is cited, in accordance with accepted academic practice. No use, distribution or reproduction is permitted which does not comply with these terms.
*Correspondence: Chenglong Ge, ODkzMjYxNzEwQHFxLmNvbQ==
Disclaimer: All claims expressed in this article are solely those of the authors and do not necessarily represent those of their affiliated organizations, or those of the publisher, the editors and the reviewers. Any product that may be evaluated in this article or claim that may be made by its manufacturer is not guaranteed or endorsed by the publisher.
Research integrity at Frontiers
Learn more about the work of our research integrity team to safeguard the quality of each article we publish.