 Xuejiao Zhou1
 Haihai Hou
- 1College of Environmental Science and Engineering, Liaoning Technical University, Fuxin, China
- 2College of Mining, Liaoning Technical University, Fuxin, China
The influence of coalification on coal structure evolution in middle ranked coals is significant for physical assessment of coalbed methane (CBM) reservoirs, which provides insights on the intrinsic connection between coalification jump and pore heterogeneity. A total of 26 middle-ranked coals were samples covering Liupanshui Coalfield in Guizhou Province, Anhe Coalfield in Henan Province, Huaibei Coalfield in Anhui Province, Sanjiang Basin in Heilongjiang Province, Ordos Basin in Shaanxi Province and Qinshui Basin in Shanxi Province. Based on a series of experiments including vitrinite reflectance, coal maceral identification, nitrogen adsorption and the pore fractal method, the inner link between physical property parameters of coal reservoirs and coal rank was revealed. The results show that the coal maceral in middle rank coals is dominated by vitrinite and inertinite and two types of adsorption pores are divided according to the nitrogen adsorption/desorption curves along with pore size distribution. The specific surface area is positively correlated with total pore volume, micropore volume and negatively correlated with averaged pore size and transitional pore volume. The coal samples with low average pore sizes have relatively high total pore volume, specific surface area and micropore volume per unit nm. With the increase of coal rank, the fluctuating points of micropore and transitional pore volume correspond to 1.16%–1.19%, 1.41%–1.43% and 1.86%–1.91% of Ro, max, respectively. The boundary of Ro, max corresponding to the second coalification jump can be more specifically defined as 1.16%–1.19% from the established nominal range of 1.1%–1.3%. The pore fractal dimension DNA1 and DNA2 increase with increasing specific surface area. Furthermore, the DNA2 has a negative correlation with micropore volume and averaged pore size, indicating that the coal with smaller average pore diameter and lower micropore content has a more complex pore structure.
1 Introduction
The study on the pore structure evolution of coals will provide a scientific reference and foundation for exploration and development of coalbed methane (CBM). Therefore, a couple of investigations on pore structure evolution controlled by coalification have been reported recently (Li et al., 2017; Xin et al., 2019; Hou et al., 2020; 2021). Coalification is a complex non-linear change process, including the change of physical, chemical and structural reactivity of organic matter, which can be further divided into dehydration, asphaltization, deasphaltization and graphitization (Zhou et al., 2018; Tao et al., 2018). Generally, there are four jumps in the whole coalification process. The first one occurs at the long flame coal stage (Cdaf=75–80%, Vdaf=43%, Ro,max=0.5–0.6%), which is characterized by the peeling off of oxygen-containing functional groups and the generation of CO2 and H2O. The second one occurs at the fat coal to coking coal (Cdaf=87%,Vdaf=29%, Ro,max=1.1–1.3%), which is characterized by the shortening of hydrogen-rich side chains and the decrease of coal density, porosity and moisture content. The tertiary coalification jump occurs from bituminous coal to anthracite (Cdaf=91%, Vdaf=8%, Ro,max=2.2–2.5%), which results in the increase of the pore and moisture content. The fourth coalification jump is in the boundary between anthracite and graphite (Cdaf=93.5%, Vdaf=4%, Ro,max=3.7–4.0%). At this stage, the ratio of hydrogen content to carbon atom decreases sharply, and the orientation and condensation degree of aromatic units increase quickly. However, a few scholars believe that there are six jumps in the whole process of coalification, and the vitrinite reflectivity (Ro, max) is 0.5%–0.6%, 1.1%–1.2%, 1.4%–1.5%, 2.2%–2.3%, 2.8%–2.9% and 3.7%–3.9% (Zhou et al., 2018).
In terms of influence of coalification on pore structure evolution, it is obtained that the micropore volume, specific surface area, total pore volume, fractal dimension of adsorption pore first increase, then decrease and finally increase with the increase of coal rank (Gurdal and Yalcin, 2001), and the maximum and minimum values occur at 0.58%–0.59% and 0.65%–0.66%, respectively (Hou et al., 2020). Compared with bituminous coal, lignite has a higher inertinite content, a larger pore volume, a better connectivity and a larger specific surface area (Tao et al., 2018). During the first coalification jump, coal molecules polycondensation occurs and coal matrix compacts with a rapidly decrease of water, pore volume, porosity and permeability. With the increase of coal rank, the specific surface area decreases rapidly. However, unlike middle and high rank coal, the adsorption amount of CH4 from lignite varies with the material composition (Tao et al., 2018). With the increase of coal rank, the average pore size first increases and then decreases (Li et al., 2017). For the similar coal rank, bright coals usually have relatively high pore size and pore complexity increases with increasing coal rank (Clarkson and Bustin, 1999; Zhao et al., 2016). Microscopic images show that low-rank coal has irregular pore shapes, whereas middle-rank coal has round tissue pores and gas pores, and high-rank coal has flattened pores and more gas pores (Li et al., 2017). Based on the Mercury injection results, coal porosity decreases from brown coal (43.35%), bituminous coal (24.76%) to anthracite (4.56%) and coal surface area decreases from bituminous coal, anthracite to brown coal (Qin et al., 2020). Mineral substance and coal rank are important factors affecting the pore size and volume of micropores, meso-pores and macropores in coal (Mastalerz et al., 2008). With the increase of coal rank, macropore volume decreases and micropore volume increases. Minerals can result in the increase or decreases of surface area and mesopore volume, depending to the changes of coal macerals (Mastalerz et al., 2008; Hou et al., 2023).
The pore fractal dimension of coal and shale can largely reflect the pore structure, adsorption and seepage ability of reservoir (Pyun and Rhee, 2004; Hou et al., 2018). A fractal permeability model was established by Mercury injection method and Kozeny-Carman equation (Cai et al., 2016), and the permeability of permeable pores of different rank coals were calculated. It shows that the pore structure of middle-rank coal is more uniform than that of low-rank coal and high-rank coal. Based on Fourier transform infrared spectroscopy (FTIR) and pyrolysis, the variation of functional groups and coalification jump were characterized and the heterogeneous aromatic compounds have a great change from low rank coal to high rank coal (Li et al., 2016). Zhou et al. (2018) proposed that the gradual breaking of chemical bonds is to reach a specific threshold activation energy, which represents the “jump” of coalification and chemical composition.
With regard to the evolution of coal pore structure caused by coalification jump, domestic and foreign scholars have analyzed the material composition, pore fracture evolution characteristics, and the change law of pore specific surface area, pore diameter and pore volume. However, these relationships with middle coal rank are lack of enough researches. In this study, it will provide a theoretical basis for studying the control effect of coalification jump on pore structure evolution and has an important significance for exploration and development of coalbed methane.
2 Experiment and methods
2.1 Sampling locations
In this study, 26 coal samples were collected from 6 coalfields or basins (Table 1; Figure 1), namely, Liupanshui coalfield in Guizhou (3), Huaibei coalfield in Anhui (3), Anhe coalfield in Henan (8), Sanjiang Basin in Heilongjiang (5), Ordos Basin in Shaanxi (5) and Qinshui Basin in Shanxi (2). The regional geological structure of Liupanshui Basin in Guizhou Province is dominated by interstitial-type folds with complex geological conditions, and the recoverable coal seam is usually distributed along the anticlinal axis or wing. The coal-bearing strata are mainly located in Late Permian including ZG, SXP and WJZ. The Anhe Coalfield in Henan Province is located at the eastern Taihang Mountains, with the main coal-bearing strata of Carboniferous and Permian. The coal samples in Anhe Coalfield consist of ZK-21-9-1, ZK-21-9-2, ZK-21-9-3, ZJ, HL, JK, LK and EK. The Huaibei Coalfield in Anhui Province is located in the South-central part of the North China Plate, bounded by Shungeng Mountain in the south and Tanlu fault in the east. The Permian is the main coal-bearing strata in Huaibei coalfield, including coal samples from WG, GB and HZ. The Sanjiang Coalfield is located in the northeast of Songliao Basin. The samples from SJB-1 to SJB-5 were taken from Chengzihe Formation in the Lower Cretaceous. The coal samples from Ordos Basin were collected in Lower Permian Shanxi Formation from OB-1 to OB-5, and the Qinshui Basin samples were collected in No.15 coal seam of Taiyuan Formation from QSB-1 to QSB-2.
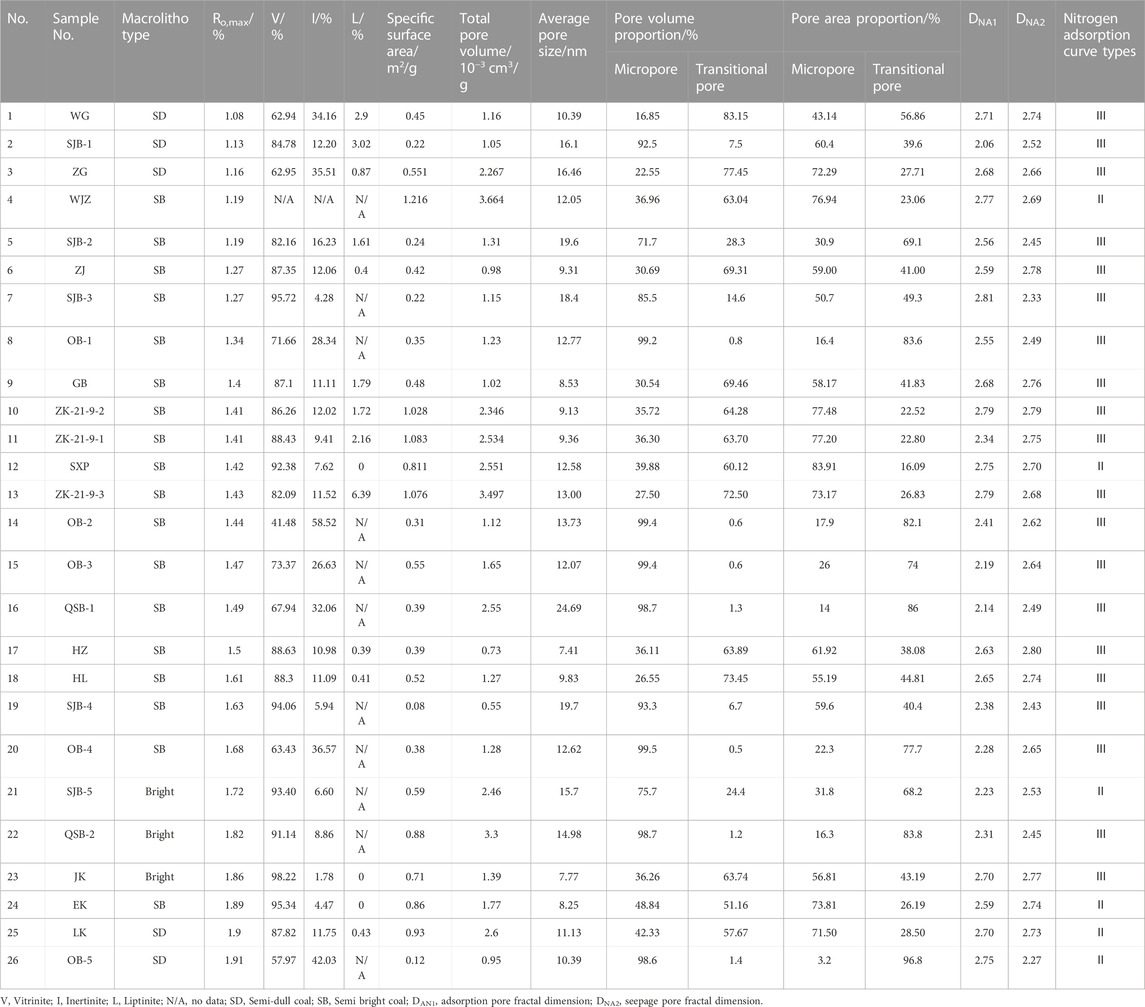
TABLE 1. Experimental results of macrolithotype, vitrinite reflectance, coal maceral, and nitrogen adsorption of the coal samples.
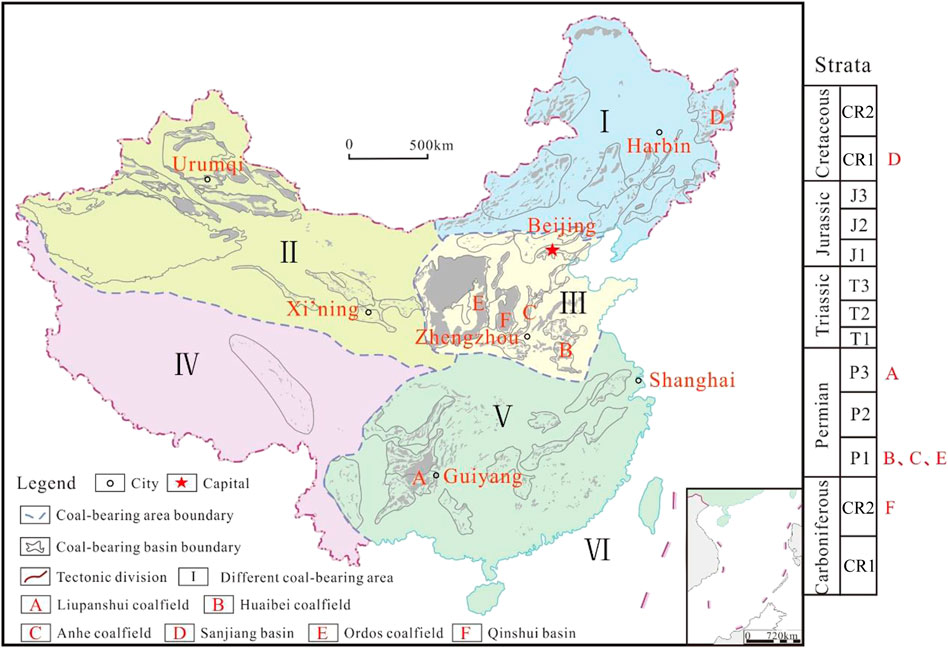
FIGURE 1. Sampling location and corresponding to coal-bearing strata in China (C1 = Early Carboniferous; C2 = Late Carboniferous; P1 = Early Permian; P3 = Late Permian; T1 = Early Triassic; T2 = Middle Triassic; T3 = Late Triassic; J1 = Early Jurassic; J2 = Middle Jurassic; J3 = Late Jurassic; CR1 = Early Cretaceous; CR2 = Late Cretaceous).
2.2 Method
(1) Experimental method
For coal maceral identification and reflectance measurements, coal samples were crushed to powders with diameter less than 1 mm for microscopic observation. Coal macerals, including vitrinite, inertinite, and liptinite, were observed for all the samples with 500 valid points using an OLYMPUS X51 photometer microscope. Maximum vitrinite reflectance (Ro,max) measurement was performed by oil immersion with a refractive index of 1.518 at 23°C. The low pressure nitrogen adsorption (LPNA) tests were performed using a Quantachrome NOVA 2000e analyzer, which can be obtained the pore parameters including specific surface area and pore volume. It should be noted that pore size smaller than 2 nm cannot be characterized by LPNA, which can be detected by CO2 adsorption experiment.
(2) Fractal method
The fractal analyses of adsorption and seepage pores were analyzed based on the adsorption curves of low pressure nitrogen adsorption (LPNA) and the injection curves of Mercury intrusion porosimetry (MIP) (Hou et al., 2020). The equation for calculating fractal dimensions of LPNA can be shown as follows (Wang et al., 2015):
where V is the adsorbed gas volume at the equilibrium pressure P; Po is the saturation gas pressure; and A is the slope between
3 Results
3.1 Coal petrology and vitrinite reflectance test
In terms of macrolithotypes, most of samples are semi-bright coals and a few parts are semi-dull and bright coals (Table 1). The vitrinite reflectance of samples ranges from 1.08% to 1.91% with an average of 1.49%, and the samples belong to middle ranked coals. The vitrinite, inertinite and liptinite content are in the range of 41.48%–98.22%, 1.78%–58.52% and 0%–6.39%, with the average value of 81%, 18.07% and 1.47%, respectively (Table 1; Figure 2). Generally, the vitrinite contents in middle rank coals are higher than those in low rank coals whereas the inertinite contents in middle rank coals are lower than those in low rank coals (Hou et al., 2017). However, coal maceral content should be determined by the depositional environment of peat not the coalification (Dai et al., 2020). With the increase of coalification degree, the lignin fiber tissue of higher plants was enhanced by gelation effect, and the content of gelated substances with humic acid and asphaltene increased, resulting in the increase of vitrinite content. It should be noted that the coal samples with higher vitrinite contents usually have lower inertinite contents and vice versa (Figure 2).
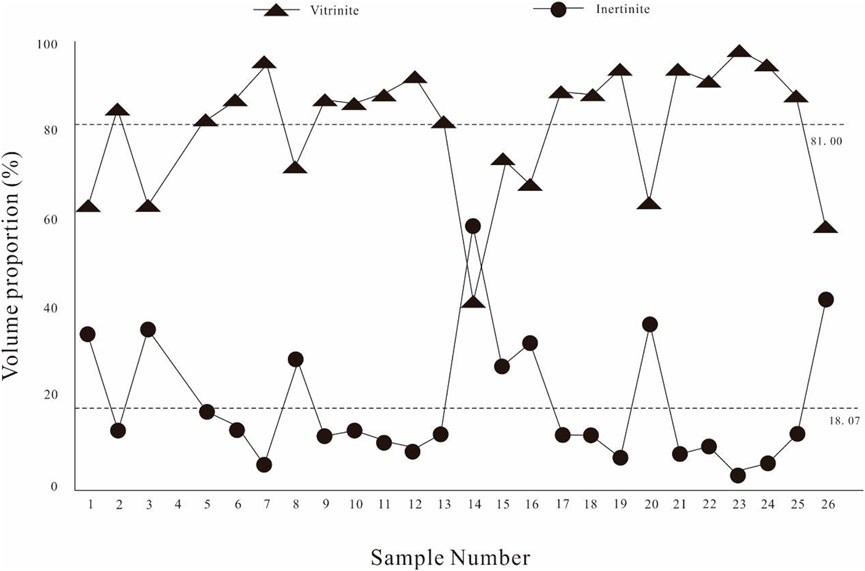
FIGURE 2. The change of vitrinite and inertinite of coal samples in the study area.
3.2 Specific surface area, pore volume and pore structure
The pore system in coals can be further subdivided into micropore (pore size <10 nm), transitional pore (10 nm < pore size <100 nm), mesopore (100 nm < pore size <1000 nm) and macropore (pore size >1000 nm). The specific surface area of coal samples ranges from 0.12 to 1.216 m2/g with an average of 0.571 m2/g, which is generally lower than that of low ranked coals (Xin et al., 2019; Wang, 2020). The total pore volume of coal samples ranges from 0.55 × 10⁻³ to 3.664×10⁻³ cm3/g with an average of 1.784×10⁻³ cm3/g, which is positively correlated with specific surface area (Figure 3A). The average pore size of coal samples ranges from 7.41 to 32.47 nm with an average of 13.77 nm, which is also positive with specific surface area (Figure 3B). The micropore volume has the greatest proportion ranging from 16.85% to 99.5% with an average of 60.47% and the second proportion is transitional pore ranging with an average of 39.26%. The micropore surface proportion is positively correlated with BET (Figure 3C), whereas transitional pore surface proportion is negatively correlated with BET (Figure 3D). The micropore volume per unit nm (MI) = (micropore volume)/(pore size range corresponding to micropore), is in the range of 0.94–233.91 × 10⁻⁶ cm3/(gnm) with an average of 82.53 × 10⁻⁶cm3/(gnm). The MI of coal samples is positively correlated with specific surface area and total pore volume (Figures 3E, F), indicating that MI has an important effect on surface area and pore volume of middle rank coals. In addition, there is negative correlation between MI and average pore size (Figure 3G), suggesting that the coal samples with relatively low pore size have high MI and specific surface area and pore volume.
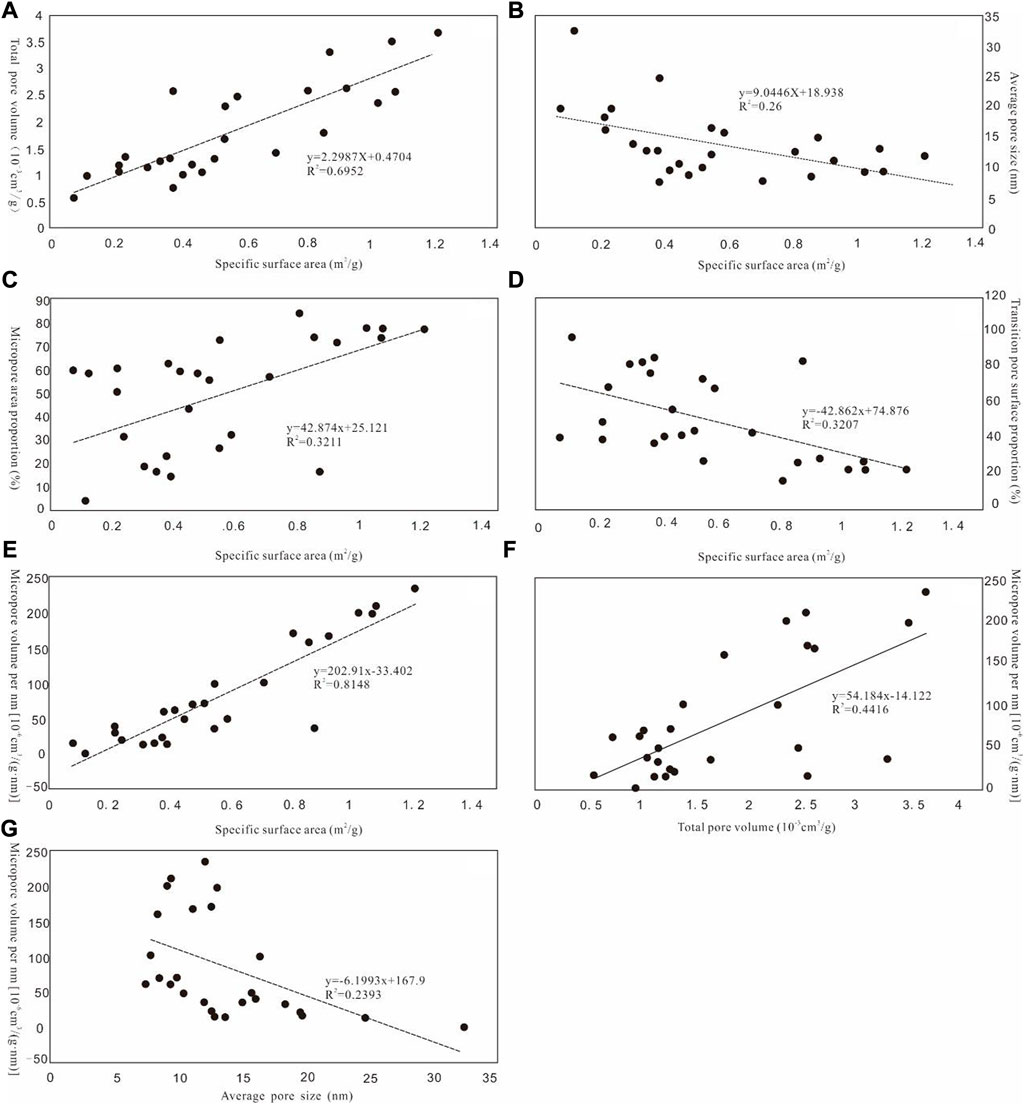
FIGURE 3. Relationships among total pore volume, average pore diameter, pore surface proportion, specific surface area and micropore volume per unit nm. ((A): total pore volume vs. specific surface area; (B): average pore size vs. specific surface area; (C): micropore area proportion vs. specific surface area; (D): transitional pore surface proportion vs. specific surface area; (E): micropore volume per nanometer vs. specific surface area; (F): micropore volume per nanometer vs. total pore volume; (G): micropore volume per nanometer vs. average pore size).
3.3 Nitrogen adsorption curve types
The experimental principle of low temperature liquid nitrogen adsorption in coal conforms to the theory of adsorption and condensation of pore materials (Yan et al., 1986). Therefore, we can judge the pore types through the characteristics of nitrogen adsorption/desorption curves. According to the nitrogen adsorption results of coal samples, the obtain nitrogen adsorption curves are mainly type Ⅱ and type Ⅲ.
The EK and LK coal samples belong to typical type Ⅱ curve (Figure 4). Specifically, the pore structure represented by type Ⅱ mainly developed micropores, and the pore morphology was mainly open parallel plate slit capillary pores (Tang et al., 2013). The relative pressure of those pores during evaporation is lower than that during condensation, which can generate hysteresis rings due to different relative pressures during evaporation and condensation. The coal samples with type Ⅱ usually have relatively high specific surface area (1.216 m2 g−1) and total pore volume (3.664 × 10⁻³ mL g-1), and the contribution to surface area and total pore volume mainly comes from micropores (Figures 4B, D). Compared with type Ⅰ, transitional pore volume obviously increases (Table 1) for type Ⅱ and the pores are beneficial to adsorption, desorption and diffusion of coalbed methane (Yao et al., 2008).
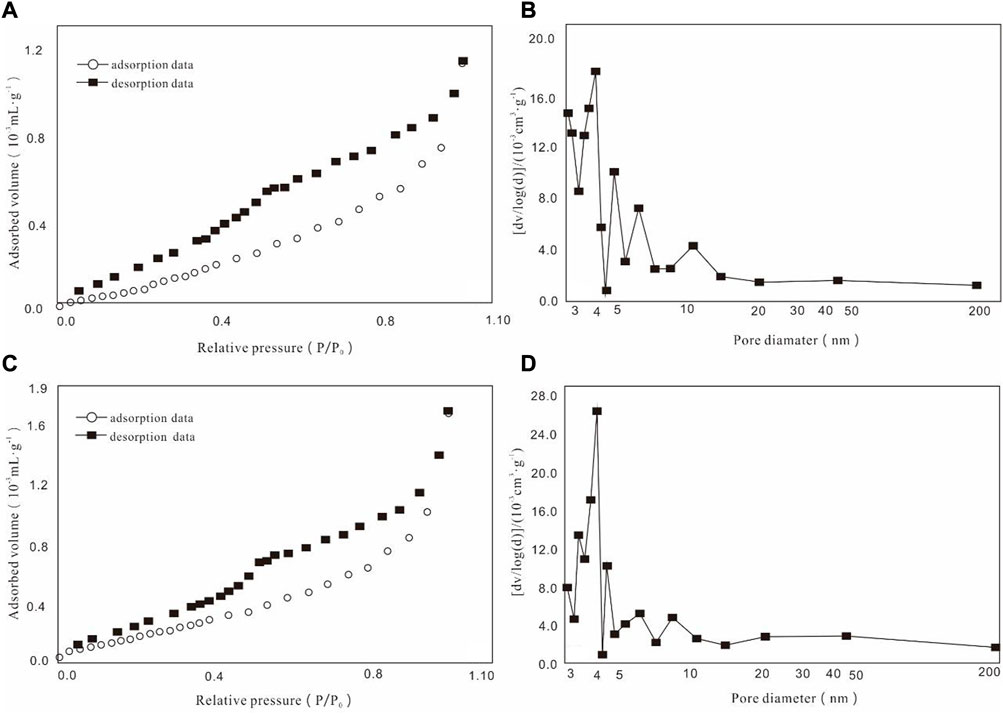
FIGURE 4. Characteristics of adsorption pore of type Ⅱ. ((A): absorbed volume vs. relative pressure of EK; (B): [dv/log(d)]) vs. pore diameter of EK; (C): absorbed volume vs. relative pressure of LK; (D): [dv/log(d)]) vs. pore diameter of LK).
The ZK21-9-1 and ZK21-9-2 coal samples belong to typical type Ⅱ curve (Figure 5). The pore structure represented by this type is a standard “bimodal” structure, with high content of transitional pores and micropores (Figures 5B, D). This pore type mainly includes open inclined slate-slit capillary pores (Tang et al., 2013). The coal samples with type Ⅲ usually have relatively low total pore volumes (1.719 × 10⁻³ mL g−1) and specific surface areas (0.553 m2 g−1), which has a great influence on diffusion and desorption of coalbed methane. Specifically, higher transitional pore proportion can increase desorption capacity and this “bimodal” structure may affect the gas efficient diffusion.
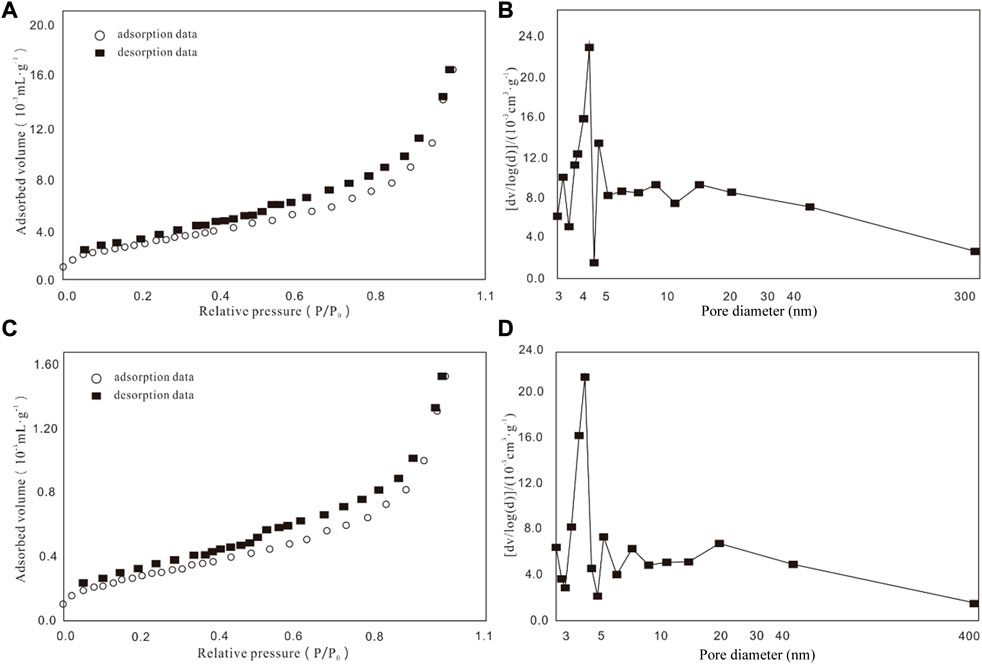
FIGURE 5. Characteristics of adsorption pore of type Ⅲ. ((A): absorbed volume vs. relative pressure of ZK 21-9-1; (B): [dv/log(d)]) vs. pore diameter of ZK 21-9-1; (C): absorbed volume vs. relative pressure of ZK 21-9-2; (D): [dv/log(d)]) vs. pore diameter of ZK 21-9-2).
4 Discussion
4.1 Influence of coalification jump on pore structure parameters
The evolution of the pore structure during the vitrinite reflectance period from 1.1% to 1.9% was analyzed by studying the changes in specific surface area, pore volume, and pore heterogeneity. With the increase of coal rank, micropore volume per unit nm shows a low-high-low-high-low-high trend, whereas transitional pore volume per unit nm shows a high-low-high-low-high-low trend (Figure 6). The various inflection point corresponds to Ro,max of 1.16%–1.19%, 1.41%–1.43% and 1.86%–1.91%, which is consistent with the second coalification jump, the third coalification jump and the boundary of middle-high rank coals (Hou et al., 2014; Zhou et al., 2018). Specifically, a large amount of methane gas was released during the second coalification jump, resulting in more micropore on organic surface due to the effects of pore pressure difference (Hou et al., 2020; Zhang et al., 2020). In the low rank coals, the decrease of moisture and porosity results in the decrease of transitional pores when Ro,max between 1.41% and 1.43% (Figure 6B). With the rapid increase of coal specific surface area and pore volume in high low rank coals, the volume proportion of micropores and pores increases to some degree (Figure 6).
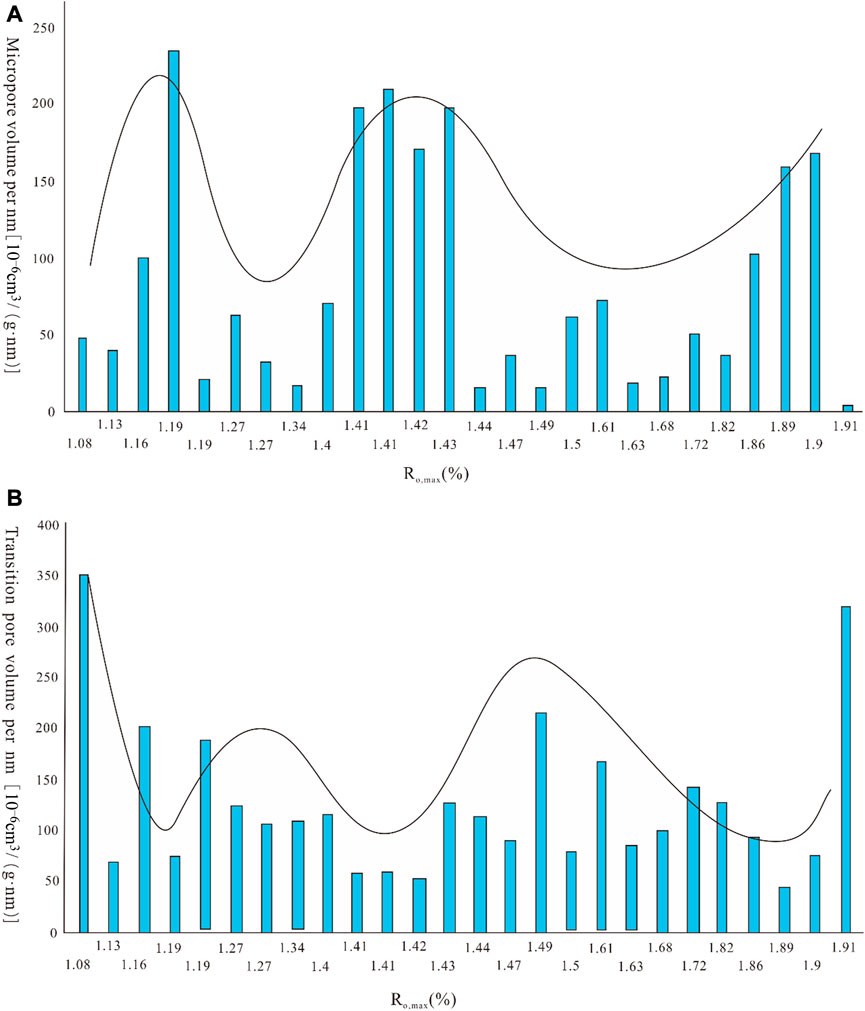
FIGURE 6. Micropore volume and transitional pore volume changes with the increase of Ro, max. ((A): micropore volume per nanometer vs. Ro, max; (B): transitional pore volume per nanometer vs. Ro, max).
There is a good positive correlation between specific surface area and total pore volume of the coal samples (Table 1). The degree of coal metamorphism has a great influence on the total pore volume and specific surface area. With the increase of the degree of coal metamorphism, the specific surface area and total pore volume of coal sample increase sharply around the second coalification jump with corresponding to Ro,max about 1.16%–1.19% (Figure 7). With the increase of coal rank, the variation of specific surface area and pore volume shows a low-high-low-high-low-high rule, which is according with the variation of micropore and transitional pore volume (Figure 6). Previous investigation showed that the Ro,max was defined to be between 1.1% and 1.3% during the second coalification jump (Kędzior, 2015), which can be further limited to 1.16%–1.19% of Ro,max in this study. The average pore size corresponding to Ro,max of 1.16%–1.19% is 16.04nm, which is obviously higher than that of the whole coal samples (Table 1). This indicates that the pore structure of middle rank coals is relatively simple with higher specific surface area and total pore volume (Figure 7). For the types of nitrogen adsorption curves, a small number of type Ⅱ samples are found corresponding to Ro,max mainly between 1.16% and 1.19%, 1.41%–1.43% and 1.86%–1.91% (Table 1), indicating that coalification jump also has a certain influence on the types of adsorption curves.
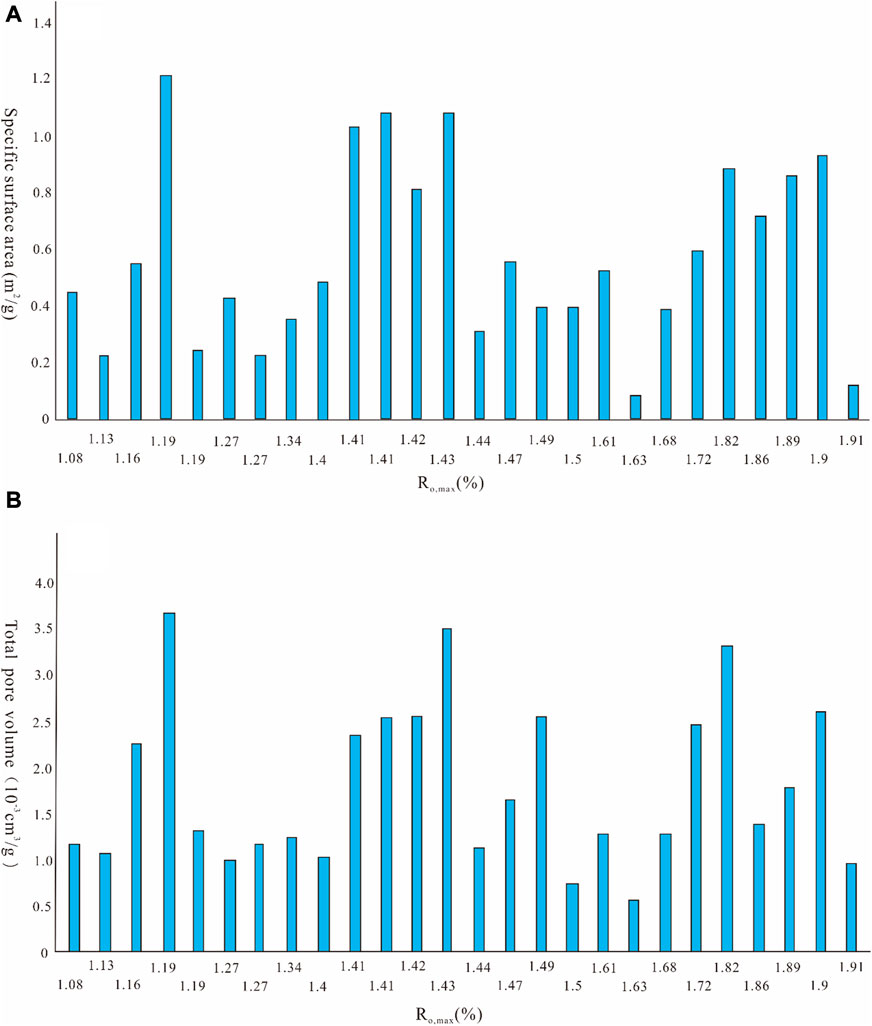
FIGURE 7. The specific surface area and total pore volume changes with the increase of Ro, max. ((A): specific surface area vs. Ro, max; (B): total pore volume vs. Ro, max).
4.2 Influence of coalification jump on pore heterogeneity
(1) Calculation of fractal dimension of coal adsorption pore
The hysteresis loop occurs in the desorption and adsorption curves when the relative pressure is about 0.5, which shows that there are great differences in the morphology and size of the pores around this relative pressure. The double logarithmic curves have different slopes between the two relative pressure segments with a high fitting degree (Figure 8), indicating that there are two different pore fractal dimensions DNA1 and DNA2 in the two relative pressure segments. According to the calculation results, the DNA1 is relatively low with ranging from 2.06 to 2.81 with an average of 2.54, and the change of DNA1 is not obvious with the increase of Ro,max. However, the average DNA1 corresponding to Ro,max of 1.16%–1.19%, 1.41%–1.43% and 1.86%–1.91% is 2.167, 2.67 and 2.69, which is higher than the average value of the coal samples. This indicates that DNA1 is consistent with the variation of micropore content, representing the fractal dimension of pore surface roughness. The value of DNA2 is relatively high ranging from 2.27 to 2.80 with an average of 2.62. Previous studies have shown that DNA2 represents the fractal dimension of coal pore structure complexity (Cui and Sun, 2020), and coalification jump may improve the complexity of coal pore structure based on the relationship between DNA2 and Ro,max.
(2) The relationship between fractal dimension and pore parameters
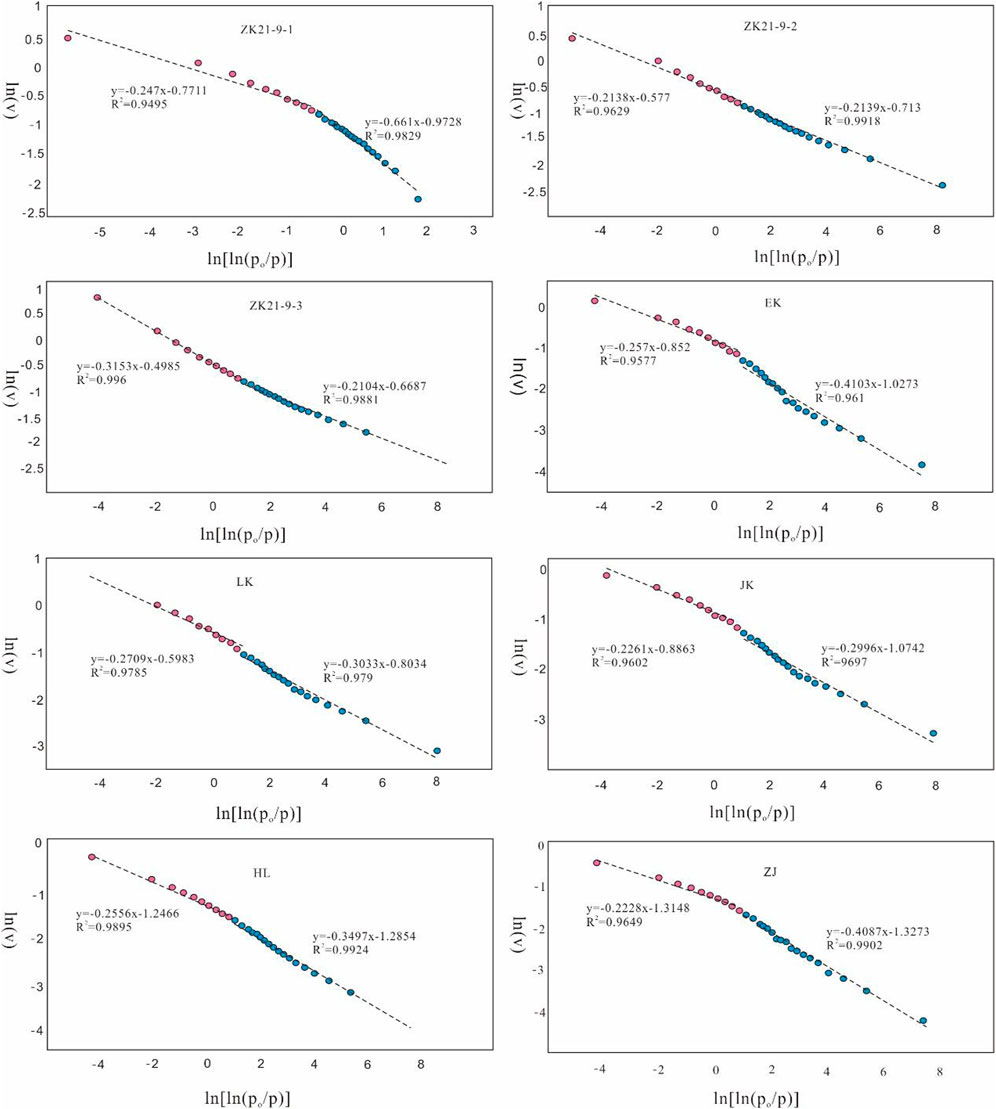
FIGURE 8. Double logarithm curve of adsorption volume and relative pressure of liquid nitrogen.
According to the analysis of the relationship between the pore fractal dimension and pore structure parameters of middle rank coals (Figure 9), the fractal dimension of coal pore DNA1 and DNA2 gradually increase with the increase of specific surface area (Figures 9A, B). However, it is worth noting that if DNA1 is separated with the boundary of 2.35, the positive correlation between DNA1 and the specific surface area will be more significant (Figure 9A), indicating that the clustering analysis of some parameters is the prerequisite for the study on the pore homogeneity (Hou et al., 2021). That means that coals with a higher surface roughness are slightly different with those with a lower surface roughness for the correlation between DNA1 and the specific surface area, however, the internal controlling factors need a further study. There is a positive correlation between DNA2 and specific surface area, suggesting that the coals with more complex pore structures usually correspond to both higher specific surface areas and higher pore volumes. Due to the good positive correlation between specific surface area and total pore volume in middle coal rank (Figure 3A), the total pore volume and methane adsorption capacity of coal become stronger with the increase of pore structure complexity (Yao et al., 2008). During different coal ranks, there is a negative correlation between DNA2 and micropore volume proportion and average pore size (Figures 9C, D), suggesting that coal samples with lower pore size and lower micropore volume usually correspond to more complex pore structure. Therefore, the reflectance of vitrinite can be used to analyze the pore surface structure characteristics, and the complexity of pore structure can be reflected according to the average pore size of coal to some degree. For the correlation between DNA2 and coal rank, generally, there is a high-low-high-low trend of DNA2 with increasing Ro,max (Figure 9E). Furthermore, the first inflection point corresponds to 1.1%–1.3% of Ro,max, and the second coalification jump has a great influence on the pore structure evolution.
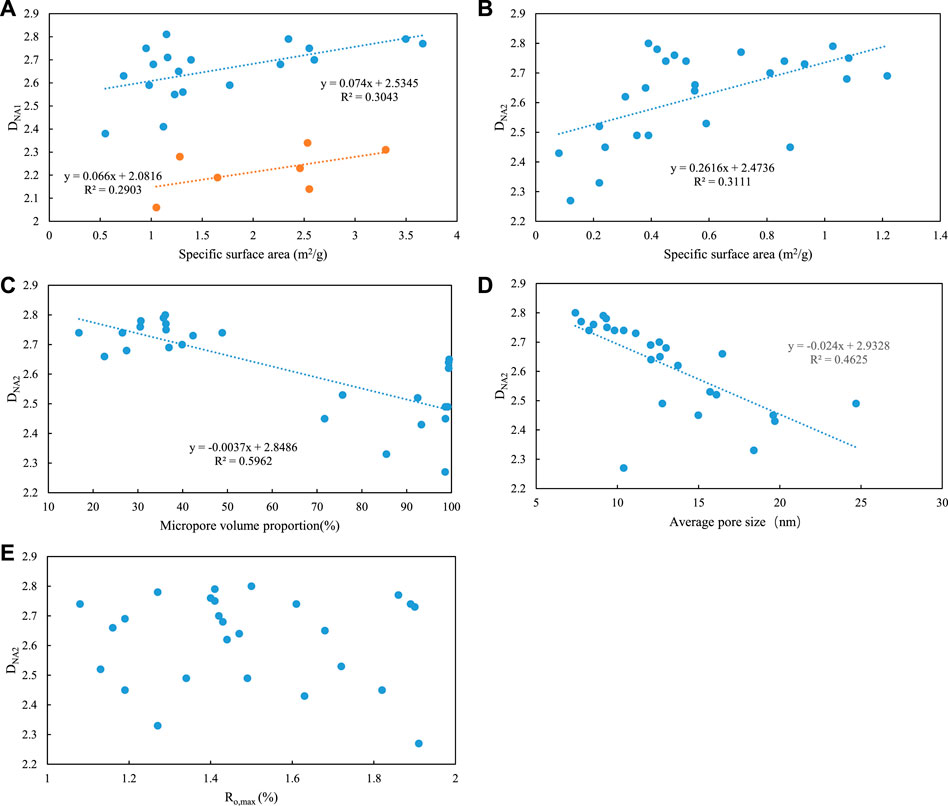
FIGURE 9. Relationships between several pore structures and DNA1, DNA2 of the coal samples. ((A): DNA1 vs. specific surface area; (B): DNA2 vs. specific surface area; (C): DNA2 vs. micropore volume proportion; (D): DNA2 vs. average pore size; (E): DNA2 vs. Ro, max).
5 Conclusion
In this paper, vitrinite reflectance, coal maceral identification and low-temperature liquid nitrogen adsorption experiments were carried out on 26 middle-rank coal samples from Liupanshui Coalfield, Anhe Coalfield, Huaibei Coalfield, Sanjiang Basin, Ordos Basin and Qinshui Basin. Pore fractal dimension was used to characterize the heterogeneity of adsorption pores (pore size <100 nm) and seepage pores (pore size >100 nm). The internal relationship between the degree of coalification and the physical property parameters and heterogeneity of coal reservoir is revealed. The results show that 1) Vitrinite and inertinite are the main macerals in the middle rank coal samples. According to the liquid nitrogen adsorption/desorption curve and pore size distribution characteristics, type Ⅱ and type Ⅲ were identified for adsorption pores. 2) The specific surface area of coal samples is proportional to the total pore volume and the micropore volume, and inversely proportional to the average pore size and the transitional pore volume. The coal samples with lower average pore size have higher micropore volume per nanometer, specific surface area and total pore volume. 3) With the increase of coal rank, the fluctuating points of micropore and transitional pore volume correspond to 1.16%–1.19%, 1.41%–1.43% and 1.86%–1.91%, respectively. The boundary of Ro, max corresponding to the second coalification jump can be more specifically defined as 1.16%–1.19% from the established nominal range of 1.1%–1.3%. 4) The pore fractal dimension DNA1 and DNA2 increase with increasing specific surface area. The DNA2 has a negative correlation with micropore volume and averaged pore size, indicating that the coal with smaller average pore diameter and lower micropore content has a more complex pore structure.
Data availability statement
The original contributions presented in the study are included in the article/Supplementary Material, further inquiries can be directed to the corresponding author.
Author contributions
XZ, Methodology, Investigation, Software, Writing; HH, Conceptualization, Investigation, Resources, Writing—original draft; Writing—review and editing; HL, Software, Investigation.
Funding
This research was supported by the National Natural Science Foundation of China (42102223), the China Postdoctoral Science Foundation (2021M693844; 2022T150284), the China Geological Survey Project (DD20160204-3), and the discipline innovation team of Liaoning Technical University (LNTU20TD-14; LNTU20TD-30).
Conflict of interest
The authors declare that the research was conducted in the absence of any commercial or financial relationships that could be construed as a potential conflict of interest.
Publisher’s note
All claims expressed in this article are solely those of the authors and do not necessarily represent those of their affiliated organizations, or those of the publisher, the editors and the reviewers. Any product that may be evaluated in this article, or claim that may be made by its manufacturer, is not guaranteed or endorsed by the publisher.
References
Cai, Y. D., Liu, D. M., Pan, Z. J., Che, Y., and Liu, Z. H. (2016). Investigating the effects of seepage-pores and fractures on coal permeability by fractal analysis. Transp. Porous Media 111 (2), 479–497. doi:10.1007/s11242-015-0605-7
Clarkson, C. R., and Bustin, R. M. (1999). The effect of pore structure and gas pressure upon the transport properties of coal: A laboratory and modeling study. 1. Isotherms and pore volume distributions. Fuel 78 (11), 1333–1344. doi:10.1016/s0016-2361(99)00055-1
Cui, Z. Z., and Sun, W. (2020). Study on pore structure of tight sandstone based on high pressure mercury and nuclear magnetic resonance—take Shanxi Formation and shihezi Formation in sulige gas field as examples. Unconv. Oil Gas 7 (2), 49–55.
Dai, S. F., Bechtel, A., Eble, C. F., Flores, R. M., French, D., Graham, I. T., et al. (2020). Recognition of peat depositional environments in coal: A review. Int. J. Coal Geol. 219, 103383. doi:10.1016/j.coal.2019.103383
Gurdal, G., and Yalcin, M. N. (2001). Pore volume and surface area of the Carboniferous coals from the Zonguldak basin (NW Turkey) and their variations with rank and maceral composition. Int. J. Coal Geol. 48 (1-2), 133–144. doi:10.1016/s0166-5162(01)00051-9
Hou, H. H., Qin, Q. H., Shao, L. Y., Liang, G. D., Tang, Y., Zhang, H. J., et al. (2021). Study on the applicability of reservoir fractal characterization in middle-high rank coals with NMR: Implications for pore-fracture structure evolution within the coalification process. ACS Omega 6 (48), 32495–32507. doi:10.1021/acsomega.1c03904
Hou, H. H., Shao, L. Y., Li, Y. H., Li, Z., Zhang, W. L., and Wen, H. J. (2018). The pore structure and fractal characteristics of shales with low thermal maturity from the Yuqia Coalfield, northern Qaidam Basin, northwestern China. Front. Earth Sci. 12 (1), 148–159. doi:10.1007/s11707-016-0617-y
Hou, H. H., Shao, L. Y., Tang, Y., Li, Y. N., Liang, G. D., Xin, Y. L., et al. (2023). Coal seam correlation in terrestrial basins by sequence stratigraphy and its implications for palaeoclimate and palaeoenvironment evolution. J. Earth Sci. 34 (2), 1–15.
Hou, H. H., Shao, L. Y., Tang, Y., Wang, S., Wang, X. T., and Liu, S. (2014). Study on coalbed methane genetic types and formation models of low rank coal in China. China Min. Mag. 23 (7), 66–69.
Hou, H. H., Shao, L. Y., Tang, Y., Zhao, S., Yuan, Y., Li, Y. N., et al. (2020). Quantitative characterization of low-rank coal reservoirs in the southern Junggar Basin, NW China: Implications for pore structure evolution around the first coalification jump. Mar. Petroleum Geol. 113, 104165. doi:10.1016/j.marpetgeo.2019.104165
Kędzior, S. (2015). Methane contents and coal-rank variability in the upper silesian coal basin, Poland. Int. J. Coal Geol. 139, 152–164. doi:10.1016/j.coal.2014.09.009
Li, W., Zhu, Y. M., Wang, G., and Jiang, B. (2016). Characterization of coalification jumps during high rank coal chemical structure evolution. Fuel 185, 298–304. doi:10.1016/j.fuel.2016.07.121
Li, Y., Zhang, C., Tang, D. Z., Gan, G., Niu, X. L., Wang, K., et al. (2017). Coal pore size distributions controlled by the coalification process: An experimental study of coals from the Junggar, Ordos and Qinshui basins in China. Fuel 206, 352–363. doi:10.1016/j.fuel.2017.06.028
Mastalerz, M., Drobniak, A., Strapoc, D., Acosta, W. S., and Rupp, J. (2008). Variations in pore characteristics in high volatile bituminous coals: Implications for coal bed gas content. Int. J. Coal Geol. 76 (3), 205–216. doi:10.1016/j.coal.2008.07.006
Pyun, S. I., and Rhee, C. K. (2004). An investigation of fractal characteristics of mesoporous carbon electrodes with various pore structures. Electrochimica Acta 49 (24), 4171–4180. doi:10.1016/s0013-4686(04)00361-5
Qin, L., Li, S. G., Zhai, C., Lin, H. F., Zhao, P. X., Yan, M., et al. (2020). Joint analysis of pores in low, intermediate, and high rank coals using mercury intrusion, nitrogen adsorption, and nuclear magnetic resonance. Powder Technol. 362, 615–627. doi:10.1016/j.powtec.2019.12.019
Tang, S. H., Zhang, J. P., and Wu, M. J. (2013). The pore structure characteristics about the sapropelic coal. Nat. Gas. Geosci. 24 (2), 247–251.
Tao, S., Chen, S. D., Tang, D. Z., Zhao, X., Xu, H., and Li, S. (2018). Material composition, pore structure and adsorption capacity of low-rank coals around the first coalification jump: A case of eastern junggar basin, China. Fuel 211, 804–815. doi:10.1016/j.fuel.2017.09.087
Wang, M., Xue, H. T., Tian, S. S., Wilkins, R. W. T., and Wang, Z. W. (2015). Fractal characteristics of Upper Cretaceous lacustrine shale from the Songliao basin, NE China. Mar. Petroleum Geol. 67, 144–153. doi:10.1016/j.marpetgeo.2015.05.011
Wang, Z. W. (2020). Microscopic pore structure and the seepage characteristics in tight sandstone reservoir of the 8th member of lower shihezi Formation in linxing area of east Ordos Basin. Unconv. Oil Gas 7 (1), 59–64.
Xin, F. D., Xu, H., Tang, D. Z., Yang, J. S., Chen, Y. P., Cao, L. K., et al. (2019). Pore structure evolution of low-rank coal in China. Int. J. Coal Geol. 205, 126–139. doi:10.1016/j.coal.2019.02.013
Yan, J. M., Zhang, Q. Y., and Gao, J. Q. (1986). Adsorption and condensation. Beijing: China Science Press.
Yao, Y. B., Liu, D. M., Tang, D. Z., Tang, S. H., and Huang, W. H. (2008). Fractal characterization of adsorption-pores of coals from North China: An investigation on the CH4 adsorption capacity of coal. Int. J. Coal Geol. 73 (1), 27–42. doi:10.1016/j.coal.2007.07.003
Zhang, Y., Li, Y., Wang, Y. B., Wang, Z. S., Zhao, S. H., and Han, W. L. (2020). SAXS-based nano-scale pore structure characteristics of coals with different metamorphic degrees. Coal Geol. Explor. 49 (6), 142–150.
Zhao, J. L., Xu, H., Tang, D. Z., Mathews, J. P., Li, S., and Tao, S. (2016). Coal seam porosity and fracture heterogeneity of macrolithotypes in the Hancheng Block, eastern margin, Ordos Basin, China. Int. J. Coal Geol. 159, 18–29. doi:10.1016/j.coal.2016.03.019
Keywords: coalbed methane, pore structure, middle rank coals, coalification jump, nitrogen adsorption
Citation: Zhou X, Hou H and Li H (2023) Influence of coalification on pore structure evolution in middle-ranked coals. Front. Earth Sci. 11:1139852. doi: 10.3389/feart.2023.1139852
Received: 07 January 2023; Accepted: 17 February 2023;
Published: 01 March 2023.
Edited by:
Hongjian Zhu, Yanshan University, ChinaReviewed by:
Peng Qiao, University of Chinese Academy of Sciences, ChinaKun Yu, China University of Mining and Technology, China
Copyright © 2023 Zhou, Hou and Li. This is an open-access article distributed under the terms of the Creative Commons Attribution License (CC BY). The use, distribution or reproduction in other forums is permitted, provided the original author(s) and the copyright owner(s) are credited and that the original publication in this journal is cited, in accordance with accepted academic practice. No use, distribution or reproduction is permitted which does not comply with these terms.
*Correspondence: Haihai Hou, aG91bWVuc2loYWlAMTYzLmNvbQ==