 Yankun Sun1
 Yufan Wang
 Mengqi Zhang
94% of researchers rate our articles as excellent or good
Learn more about the work of our research integrity team to safeguard the quality of each article we publish.
Find out more
ORIGINAL RESEARCH article
Front. Earth Sci. , 20 March 2023
Sec. Atmospheric Science
Volume 11 - 2023 | https://doi.org/10.3389/feart.2023.1138985
This article is part of the Research Topic Asian Monsoon: Drivers and Forcings in a Changing Climate View all 5 articles
Northeast China (NEC) is a major crop base in East Asia, and summer drought is one of the climate extremes that significantly influences NEC agricultural production. Therefore, understanding the response of NEC summer drought to global warming is of significance. In this study, based on observation and large-ensemble simulations of the Community Earth System Model (CESM-LE), the variabilities in summer extreme consecutive dry days (CDDs) over NEC are investigated in the present and future climate. In the observation, the NEC summer extreme CDDs showed an increasing trend during the past half century and experienced a significant interdecadal change around the middle 1990s, which is mainly due to the change in the anticyclone over Lake Baikal-Northeast Asia. The anticyclone-related anomalous downward motion and moisture divergence provided favorable conditions for increased summer CDDs over NEC. The CESM-LE multimember ensemble (MME) simulation could reproduce the change in NEC summer extreme CDDs and its related atmospheric circulations, indicating that the observed change in NEC summer extreme CDDs could be largely contributed by anthropogenic forcing. In the future warmer climate, the NEC summer extreme CDDs are projected to show interdecadal variability, which increase by approximately 6.7% in the early 21st century (2020–2030), then decrease by approximately 0.3% in the middle to late 21st century (2040–2080), and further increase by approximately 2.1% in the late 21st century (2085–2100). In addition, the projected changes in the anticyclone over Lake Baikal-Northeast Asia show a similar feature to that of the NEC summer extreme CDDs, which might further provide some confidence in the projection of the NEC summer extreme CDDs due to the physical connection between CDDs and anticyclone in the future.
Northeast China (NEC) is a major crop production base in China. Summer is the critical period of crop growth over NEC, and drought during this period significantly affects the agricultural production and ecosystem over this region, resulting in large economic losses. For instance, the Liaoning and Jilin Provinces of NEC suffered from severe summer drought in 2014, resulting in direct economic losses of over 13.5 billion RMB (Duan et al., 2014). In the summer of 2018, a severe drought occurred in Liaoning Province, with drought days exceeding 60 days in the western part of the province, resulting in more than 5000 square kilometers of farmland suffering from drought (Zhang Y. et al., 2018; http://news.cctv.com/2018/08/03/ARTIOnrBafkI0Lz3gTxqfkxV180803.shtml). Therefore, it is important to understand the summer drought variability over NEC in both present and future climate.
Previous studies on NEC summer drought have mainly focused on seasonal-mean precipitation variability and revealed several influencing factors, including the East Asian summer monsoon (Sun et al., 2007; Han et al., 2014; Zhang, 2015), spring Arctic sea ice concentration (Wu et al., 2009b; Li et al., 2018; Chen et al., 2022b), Eurasian snow cover (Wu et al., 2009a; Han et al., 2014; Zhang et al., 2016), El Niño-Southern Oscillation (ENSO; Han et al., 2017; Wang and Li, 2020; Liu et al., 2021), North Atlantic Oscillation (Sun and Wang, 2012; Du et al., 2020), soil moisture over the area south of Lake Baikal (Zeng et al., 2019).
The precipitation amount can be used to monitor and assess dry conditions on the monthly or seasonal timescale to some extent, but cannot adequately reflect the drought features on the daily timescale. As a common drought index, consecutive dry days (CDDs) can directly reflect the accumulated days of persistent precipitation deficit, a basic feature of drought, and has been widely used by researchers to investigate drought variabilities (e.g., Nastos and Zerefos, 2009; Nakaegawa et al., 2014; Kong et al., 2015; Ye and Fetzer, 2019; Zeng and Sun, 2021, 2022; Teshome et al., 2022). It is also one of 27 extreme climate indices recommended by the Expert Team on Climate Change Detection and Indices (ETCCDI; Alexander et al., 2006; Zhang et al., 2011). In terms of the summer CDDs over NEC, the spatial and temporal characteristics of maximum CDDs are the focus (e.g., Wang et al., 2011; Liang et al., 2016; Wang et al., 2017; Zhang et al., 2019). In climatology, the duration of maximum CDDs over NEC increased from the eastern to the western part and showed an increasing trend at almost all stations from 1961 to 2013 (Li et al., 2015; Liang et al., 2016). In addition to the summer maximum CDDs over NEC, the prolonged CDDs over NEC in wet season (May–September) exhibited an increasing trend from the 1960s to the 2010s, which is related to the change of a ridge over Northeast Asia (Lei and Duan, 2011; Kong et al., 2015). Zhang et al. (2019) showed that the occurrence of summer prolonged CDDs over northern China has exhibited a decadal increase since the 1990s, which is further associated with the anticyclone anomaly over Northeast Asia induced by Eurasian teleconnection pattern and Silk Road pattern.
Due to the importance of CDDs for agriculture and ecosystems, CDD variabilities over China in a warming climate have received attention (e.g., Zhou et al., 2014; Xu et al., 2018; Zhang and Zhou, 2019; Veiga and Yuan, 2021; Zhu et al., 2021; Xu et al., 2022). It has been reported that the maximum CDDs shows an overall decreasing trend over China in the 21st century, and the magnitude of the decrease varies during different periods in the future (Xu et al., 2015; Qin and Xie, 2016; Ai et al., 2022). For example, the annual maximum CDDs over China are projected to decrease under all representative concentration pathways (RCPs) by 2–3 days in the early 21st century, 3–4 days in the middle 21st century, and 4–6 days in the late 21st century (Xu et al., 2015). The spring maximum CDDs over China are projected to decrease by 1.5% in the early 21st century, 5.0% in the middle 21st century, and 3.5% in the late 21st century under the shared socioeconomic pathways (SSPs) low-forcing scenario (Ai et al., 2022). The aforementioned studies mainly focused on the projections of CDDs on the countrywide scale, and few studies have investigated the future changes in summer extreme CDDs over NEC and related atmospheric circulations. Since the projections of CDDs show large uncertainty in China (Li et al., 2016a; Chen et al., 2022a; Xu et al., 2022), the assessment of underlying physical processes associated with the changes in CDDs can further constrain CDDs projections and make the projections more reliable.
Therefore, this study aimed to investigate the characteristics of summer extreme CDDs over NEC in a warming climate using observation and Community Earth System Model Large Ensemble (CESM-LE, Kay et al., 2015) simulations. Furthermore, the physical processes responsible for the change in NEC summer extreme CDDs are explored to further refine confidence in the extreme CDDs projection. In the presence of internal climate variability, it is insufficient to use single realizations of climate models for comparison with observation and future prediction (Kay et al., 2015). The CESM-LE multimember ensemble (MME) simulations, which efficiently reduce the uncertainties from internal variability and represent the externally forced response, make the projection more reliable (e.g., Nath et al., 2018; Wang et al., 2019; Cao and Yin, 2020).
The paper is structured as follows. Section 2 introduces the observation and simulation data, and used methods in this study. Section 3 investigates the variability in NEC summer extreme CDDs and its related atmospheric circulations in observation. In Section 4, the performance of CESM-LE in capturing the observed change in NEC summer extreme CDDs and its related atmospheric circulations is first evaluated, and then future changes in NEC summer extreme CDDs are further projected based on CESM-LE simulations. Section 5 gives the discussion and conclusion.
The daily precipitation dataset at 699 stations in China is provided by the National Meteorological Information Center of China Meteorological Administration (http://data.cma.cn), which covers the 1960 to 2019. This dataset has been strictly quality controlled before release. The stations with missing values for more than 10% of any year or 1% of the whole period are excluded, and the remaining missing records are filled by their climatological value, which is consistent with previous studies (e.g., Sun and Ao, 2013; Hong et al., 2020; Zeng and Sun, 2021). Accordingly, a total of 96 stations over NEC (38°−54°N, 115°−135°E) are selected. The monthly atmospheric circulation dataset is derived from the Japanese 55-year Reanalysis Project (JRA-55), which has a horizontal resolution of 1.25°×1.25° and 37 vertical pressure levels and covers the period from 1958 to the present (Kobayashi et al., 2015). The atmospheric reanalysis data from European Center for Medium-Range Weather Forecasts Reanalysis 5 (ERA5; Hersbach et al., 2020) are also used. The two reanalysis datasets achieve consistent results, and only results of JRA-55 are shown. The variables analyzed in this study include the geopotential height, horizontal winds, vertical velocity, and specific humidity.
According to the definition of ETCCDI, a day with precipitation less than 1 mm is considered a dry day in both the observation and CESM-LE simulations. The duration of CDDs is defined as the number of consecutive dry days. Similar to previous studies (Kong et al., 2015; Zeng and Sun, 2022), the threshold of extreme CDD at a station is determined as the 90th percentile of the CDD duration in the summers during 1960–2019. Extreme CDDs are defined as CDDs with durations greater than the threshold.
The CESM-LE simulations are used in this study to evaluate and project the variabilities in summer extreme CDDs over NEC and its related atmospheric circulations. The CESM-LE simulations are performed using the fully coupled CESM version 1, which has a horizontal resolution of 0.9°×1.25° and 30 hybrid sigma pressure levels and covers the period of 1920–2100 (historical simulation for 1920–2005 and RCP 8.5 simulation for 2006–2100). The CESM-LE includes 35 ensemble members, and each member is subjected to identical external forcing but starts from slightly different atmospheric initial conditions; therefore, the ensemble spread is attributed to the internal climate variability. Such a design of the CESM-LE experiment enables the assessment of climate change in the presence of internal variability (Kay et al., 2015) and is widely used to investigate the influence of internally generated climate variability and externally forced responses in the climate change (e.g., Li J. et al., 2016; Merrifield et al., 2017; Bellomo et al., 2018; Nath et al., 2018; Zheng et al., 2018).
Summer refers June to August in this study. The statistical significance was estimated by the Student’s t-test. The moving t-test is applied to analyze the interdecadal change in the extreme CDDs and atmospheric circulations. The effective degree of freedom (Nd) is calculated using the following formula (Bretherton et al., 1999):
where N is the original sample size of the time series,
Figure 1 displays the spatial distribution of the threshold of summer extreme CDDs and climatology of accumulated days of extreme CDDs (CDDA) over NEC during 1960−2019. Both the threshold and accumulated days generally increase from the eastern part to the western part of NEC. The low values are located in the southeastern part of Jilin Province, with a threshold below 7 days and accumulated days below 20 days. The high values are located in southwestern NEC, including southern Liaoning Province and parts of Inner Mongolia, with a threshold above 10 days and accumulated days above 26 days. Such a CDDA distribution is closely related to the climatology of summer precipitation over NEC. Large (small) precipitation amount and frequency are located over eastern (western) NEC (figure not shown), which is related to the impacts of the East Asian summer monsoon and Changbai Mountain topography (Sun et al., 2007; Zhang et al., 2010; Shen et al., 2011; He et al., 2020). The normalized time series of CDDA over NEC (CDDA index) shows an increasing trend during the past half century (Figure 2A). In addition, the CDDA index exhibits a significant interdecadal change around the middle 1990s, according to the 11-year and 13-year moving t-test. (Figure 2B). The consistent result obtained by moving t-test with two different window lengths indicates a robust interdecadal change of CDDA index around the middle 1990s. The regression of extreme CDDs against the CDDA index shows a spatial consistency, with a significant increase over most areas of NEC (Figure 2C). This result implies that droughts have significantly increased over NEC during the last two decades. In addition, it should also be noted that the linear trend of summer precipitation over NEC is negligible during 1960−2019 (Supplementary Figure S1), which suggests that the variability of summer extreme CDDs of NEC is different from that of summer precipitation; therefore, the existing understanding of summer precipitation does not explain well the variability of summer extreme CDDs of NEC.
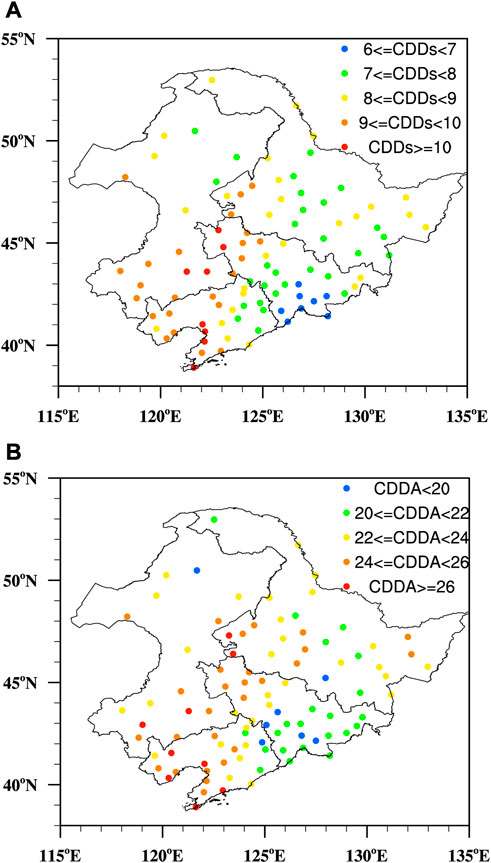
FIGURE 1. (A) The spatial distribution of the threshold (unit: day) of the summer extreme CDDs over NEC during 1960−2019. (B) The climatology of accumulated days of the summer extreme CDDs (CDDA; unit: day) over NEC during 1960−2019.
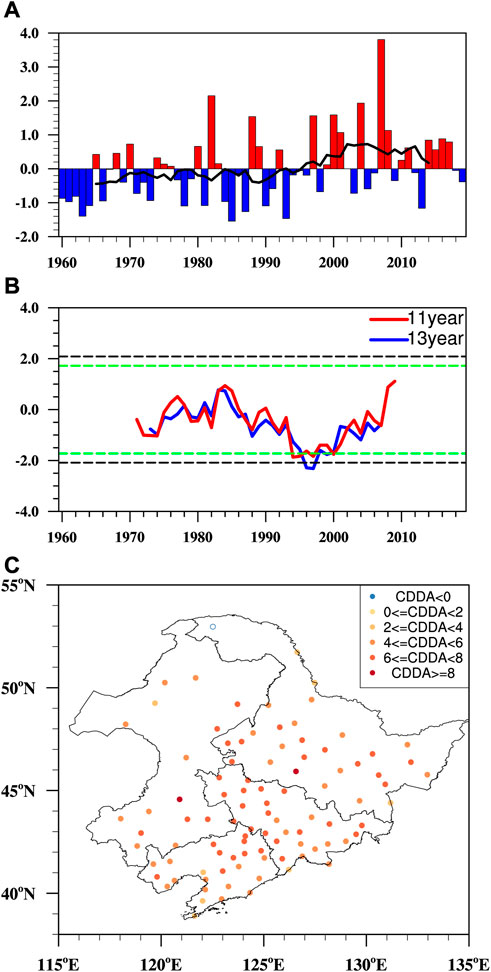
FIGURE 2. (A) The normalized time series of the CDDA index (bar) and the corresponding 11-year running mean (line) during 1960−2019. (B) The moving t-test of the CDDA index during 1960−2019, with window lengths of 11-year (red line) and 13-year (blue line). The green (black) horizontal dashed lines indicate the 90% (95%) confidence level. (C) Regression of summer CDDA anomalies (unit: day) against the normalized CDDA index during 1960−2019. The solid dots indicate that the anomalies are significant at the 95% confidence level.
Furthermore, the physical processes responsible for the interdecadal change in the CDDA over NEC are investigated from the perspective of the climate. Figure 3 shows the regressions of the summer atmospheric circulation anomalies against the normalized CDDA index during 1960−2019. At 850 hPa, there is a significant anomalous anticyclone located in Lake Baikal-Northeast Asia, with anomalous westerlies (easterlies) along its north (south) flank (Figures 3A, B). Such an anomalous anticyclone could also be seen at mid- and high-levels, indicating a quasi-barotropic structure (Supplementary Figure S2). Corresponding to the anomalous anticyclone, significant downward motion and moisture divergence are observed over most areas of NEC (Figures 3C, D). Such atmospheric circulation anomalies provide favorable background conditions for CDDs over NEC. The above regressions are also carried out using the detrended data, and similar results are obtained (Supplementary Figure S3). The above analysis indicates that the anticyclone over Lake Baikal-Northeast Asia could be a key circulation system responsible for the change in summer extreme CDDs over NEC.
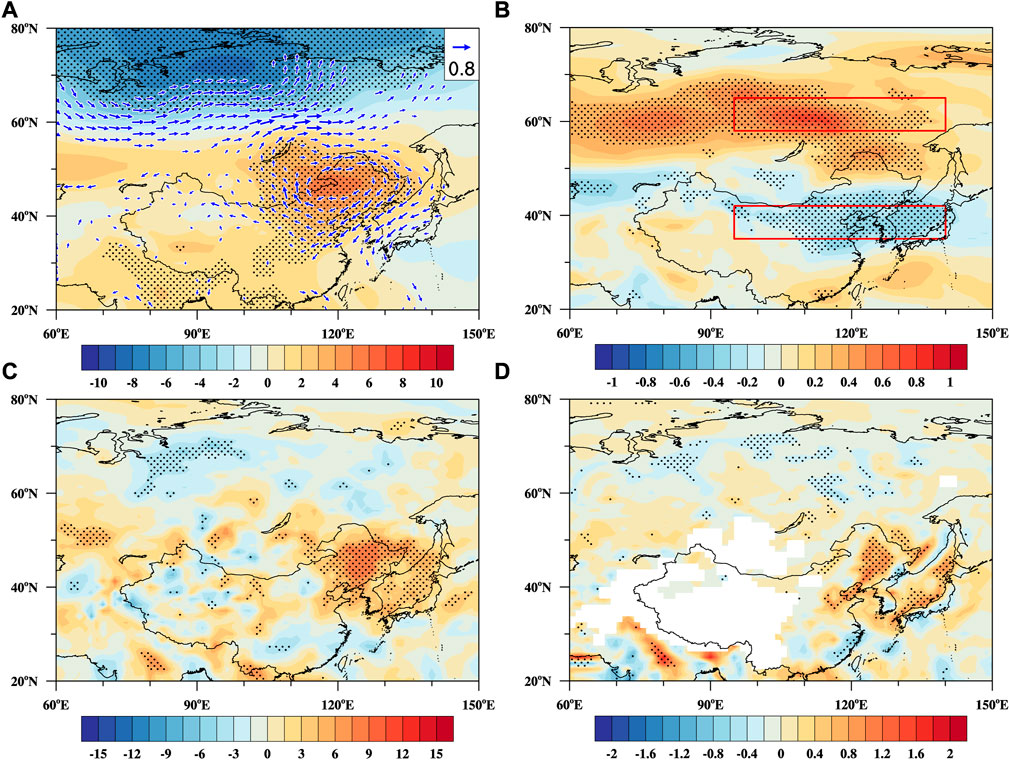
FIGURE 3. Regressions of summer anomalous (A) 850 hPa geopotential height (shading; unit: gpm) and horizontal wind (vector; unit: m s−1), (B) 850 hPa zonal wind (unit: m s−1), (C) 500 hPa vertical velocity (unit: 10–3 Pa s−1), and (D) moisture divergence vertically integrated from the surface to 850 hPa (unit: 10–5 kg m−2 s−1) against the normalized CDDA index during 1960−2019. Stippled regions and vectors indicate that the anomalies are significant at the 95% confidence level. The red boxes in (B) indicate the regions used to define the zonal wind index (ZWI).
Furthermore, the difference in 850 hPa zonal winds between 58°−65°N, 95°−140°E and 35°−42°N, 95°−140°E (boxes in Figure 3B) is defined as a zonal wind index (ZWI), which is used to represent the anticyclone variability. The correlation coefficient between the CDDA index and ZWI is 0.55 during 1960−2019, which is significant at the 99% confidence level. The normalized time series of ZWI also exhibits an increasing trend and a significant interdecadal change around the middle 1990s, based on the 11-year and 13-year moving t-test (Figure 4). This index analysis further indicates the close relationship between summer extreme CDDs over NEC and the anticyclone over Lake Baikal-Northeast Asia.
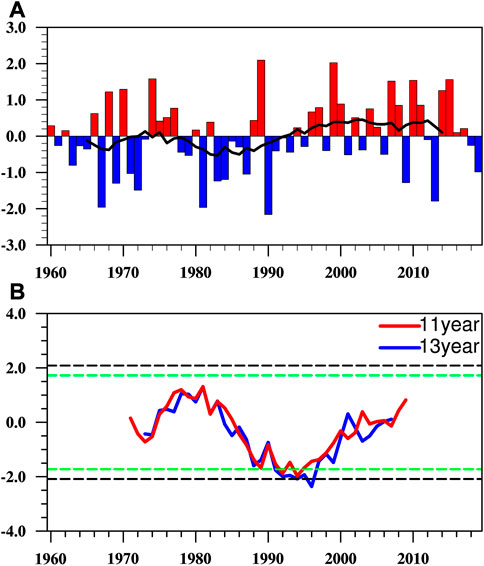
FIGURE 4. (A) The normalized time series of the ZWI (bar) and the corresponding 11-year running mean (line) during 1960−2019. (B) The moving t-test of the ZWI during 1960−2019, with window lengths of 11-year (red line) and 13-year (blue line). The green (black) horizontal dashed lines indicate the 90% (95%) confidence level.
First, changes in summer extreme CDDs over NEC and the related atmospheric circulations are evaluated in CESM-LE simulations in the historical period of 1960–2019. When calculating the CDDA index in the CESM-LE simulations, the grids outside of Northeast China were excluded. The CESM-LE MME generally underestimates the threshold of summer extreme CDDs and climatology of CDDA, and the spatial distributions of the two are relatively uniform over the Northeast China (Supplementary Figure S4). The NEC area-averaged threshold of summer extreme CDDs is approximately 5 days, and the area-averaged climatology of CDDA is approximately 15 days in CESM-LE MME. As shown in Figure 5A, the CESM-LE MME captures the increasing trend and interdecadal change in the CDDA index in observation. The interdecadal change is somewhat earlier than the observation, with an abrupt shift from negative-phase to positive-phase approximately 1990, which is significant based on the moving t-test. The correlation coefficient between the CDDA index in observation and CESM-LE MME is 0.29 during 1960–2019, which is significant at the 95% confidence level. After removing the variability in the interannual time scale using the 11-year running mean, the correlation coefficient between the CDDA index in observation and CESM-LE MME increases to 0.80. This result suggests the capability of CESM-LE to reproduce the changes in CDDA in the observation, particularly the long-term changes.
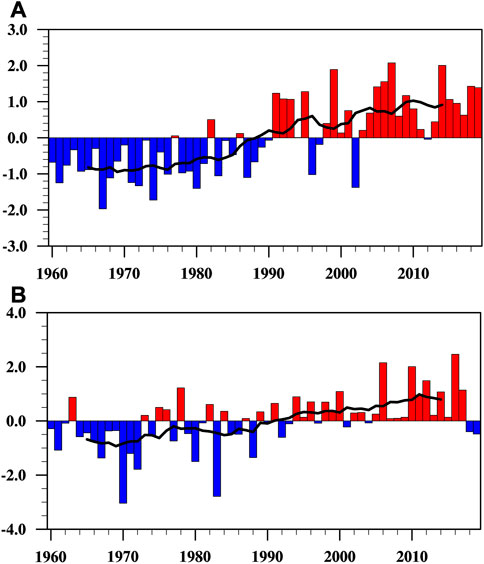
FIGURE 5. The bars indicate normalized time series of (A) CDDA index in the CESM-LE MME and (B) ZWI-LE during 1960–2019. The lines indicate 11-year running mean for the corresponding time series.
Regressions of atmospheric circulation anomalies against the normalized CDDA index are performed using CESM-LE MME during 1960–2019 (Figure 6). An anomalous anticyclone could also be seen over Lake Baikal-Northeast Asia, accompanied by strengthened (weakened) westerlies along its northern (southern) edge (Figure 6A,B). It is also noticed that the simulated anticyclone is somewhat shifted eastward compared with observation, which is consistent with the eastward shift of the center location of CDDA anomalies over NEC in simulation (figure not shown). Nevertheless, in the simulation, corresponding to the anticyclone, there are also descending motion and moisture divergence over NEC, which favor the occurrence of CDDs over the region (Figure 6C,D). Similar results can also be obtained based on the detrended data (Supplementary Figure S5).
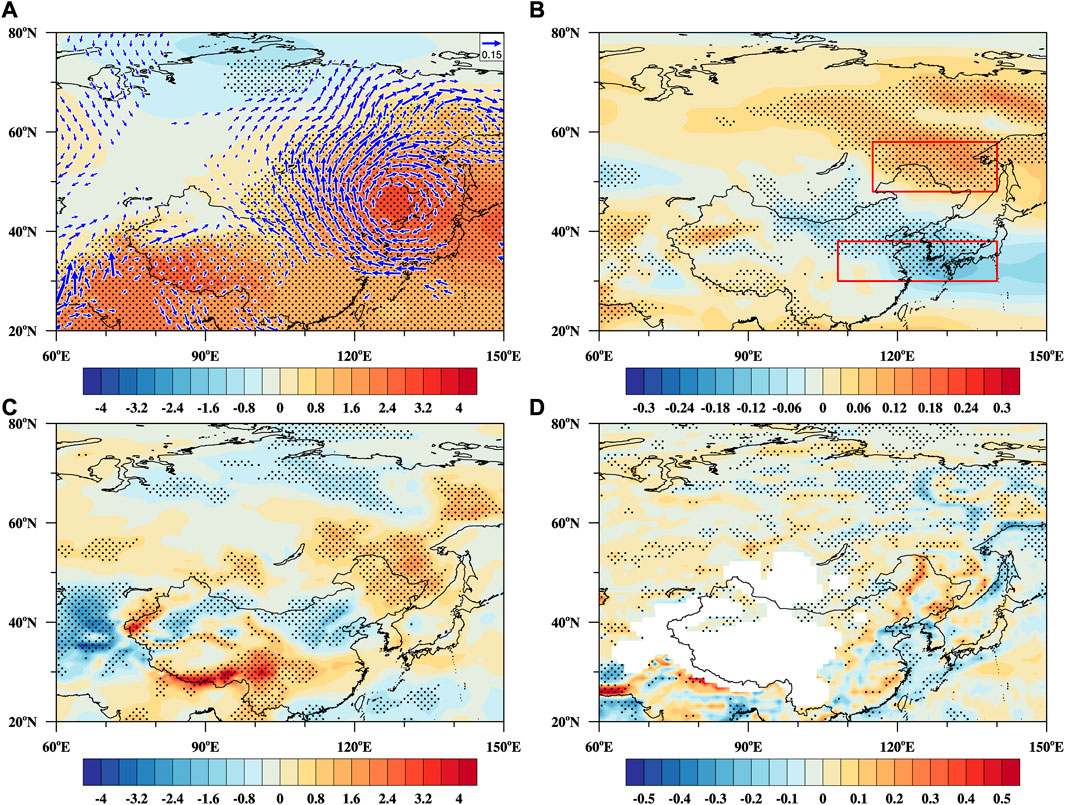
FIGURE 6. Regressions of summer anomalous (A) 850 hPa geopotential height (shading; unit: m) and horizontal wind (vector; unit: m s−1), (B) 850 hPa zonal wind (unit: m s−1), (C) 500 hPa vertical velocity (unit: 10–3 Pa s−1), and (D) moisture divergence vertically integrated from the surface to 850 hPa (unit: 10–5 kg m−2 s−1), against the normalized CDDA index in the CESM-LE MME during 1960−2019. Stippled regions and vectors indicate that the anomalies are significant at the 95% confidence level. The red boxes in (B) indicate the regions used to define the ZWI-LE.
Similar to the observation, a zonal wind index in CESM-LE (ZWI-LE) is defined as the difference in 850 hPa zonal wind between 48°−58°N, 115°−140°E and 30°−38°N, 108°−140°E (boxes in Figure 6B). The ZWI-LE is also calculated by slightly modified the regions and the result is not sensitive to the selection of the ZWI-LE region. The correlation coefficient between the CDDA index in CESM-LE MME and ZWI-LE is 0.44 during 1960–2019, which is significant at the 99% confidence level. The normalized ZWI-LE displays an increasing trend and a significant interdecadal change approximately 1990, consistent with that of the CDDA index in CESM-LE (Figure 5B). This result indicates that the anticyclone over Lake Baikal-Northeast Asia is also a key system responsible for the changes in NEC summer extreme CDDs in CESM-LE simulations, consistent with the results from observation. The above analysis implies that the changes in NEC summer extreme CDDs and its relationship with atmospheric circulations can be reproduced by the CESM-LE MME simulation, to a large extent. Therefore, it is reasonable to project the changes in NEC summer extreme CDDs in the future based on the CESM-LE simulations.
Figure 7A shows the changes in the CDDA index during 1960–2100 relative to the present climate (1960–2019, consist with the period of observation). The CDDA index shows obvious interdecadal variability during 1960–2100, with three significant interdecadal changes (Figure 7B). In the historical period, a significant interdecadal increase occurs approximately 1990, as mentioned above. The projected CDDA index increases in the early 21st century, then fluctuates around the zero line, and further increases in the late 21st century. There are two significant interdecadal changes around the early 2030s and middle 2080s. The CDDA is projected to increase by approximately 6.7% in the early 21st century (2020–2030). During the middle to late 21st century (2040–2080), CDDA remains at a similar level to the present climate, with a relatively small decrease of approximately 0.3%. In the late 21st century (2085–2100), CDDA is projected to increase by approximately 2.1%. This result indicates that the CDDA over NEC is projected to show interdecadal changes in the 21st century.
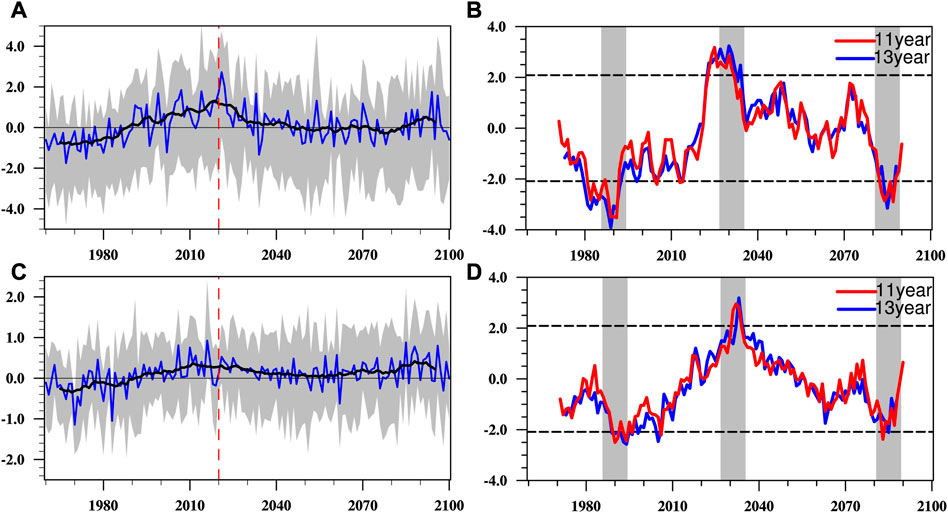
FIGURE 7. The blue lines indicate the (A) CDDA index in the CESM-LE MME and (C) ZWI-LE during 1960–2100 relative to the present climate (1960–2019). The shadings in (A,C) indicate the ensemble spread ranging from the 25th to 75th quantiles. The black lines indicate the 11-year running mean of the corresponding time series. The moving t-test of the (B) CDDA index in the CESM-LE MME and (D) ZWI-LE during 1960−2100, with window lengths of 11-year (red line) and 13-year (blue line). The black horizontal dashed lines indicate the 95% confidence level. The shadings in (B,D) indicate the period of significant interdecadal change.
The relationship between CDDA and atmospheric circulations is further examined during 2071–2100 in the CESM-LE MME. As shown in Figure 8, the anomalous anticyclone over Lake Baikal-Northeast Asia is also a key system, that is, related to the change in the CDDA of NEC by inducing downward motion and moisture divergence over NEC. This result means that the relationship between the CDDA and anticyclone over Lake Baikal-Northeast Asia is stable during the historical period and late 21st century in the CESM-LE simulations. Therefore, the change in the anomalous anticyclone over Lake Baikal-Northeast Asia is further examined during 1960–2100 to constrain the projection of the CDDA (Figure 7C). The ZWI-LE shows a similar feature to that of the CDDA index in the present and future warmer climates, at approximately 1990, the early 2030s and the middle 2080s (Figure 7D). This result might further provide some confidence in the CDDA projection by assessing the underlying physical processes.
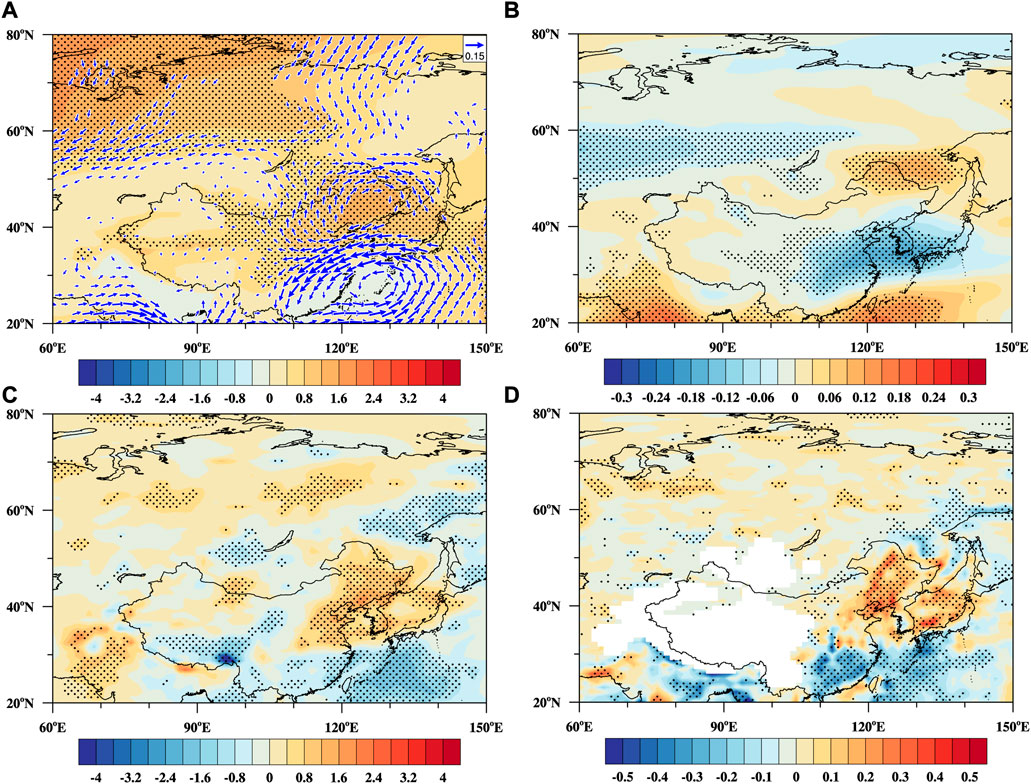
FIGURE 8. Regressions of summer anomalous (A) 850 hPa geopotential height (shading; unit: m) and horizontal wind (vector; unit: m s–1), (B) 850 hPa zonal wind (unit: m s–1), (C) 500 hPa vertical velocity (unit: 10–3 Pa s–1), and (D) moisture divergence vertically integrated from the surface to 850 hPa (unit: 10–5 kg m–2 s–1), against the normalized CDDA index in the CESM-LE MME during 2071–2100. Stippled regions and vectors indicate that the anomalies are significant at the 95% confidence level.
In this study, the possible mechanisms responsible for the CDDA variability over NEC are investigated from the perspective of climate. On the seasonal timescale, the anticyclone-related moisture divergence and downward motion are unfavorable for precipitation, which provide favorable background conditions for the occurrence of CDDs. However, there are differences in the variability and influencing factors of precipitation amount and extreme CDDs. The correlation coefficient between NEC summer precipitation index and CDDA index is −0.69 during 1960−2019, explaining less than half of the total variance. In addition, although both the decreased summer precipitation and CDDA over NEC are related to an anomalous anticyclone over Lake Baikal-Northeast Asia, there are still differences in the intensity and significant scale of the anticyclone associated with the two indices of the NEC summer precipitation and CDDA (figure not shown). In addition, the CDDA is an extreme climate index, which is generally related to the frequency of precipitation; while the precipitation amount is related to both of frequency and intensity of precipitation. The differences in the influencing factors of extreme CDDs and precipitation amount might be related to the frequency and intensity of anticyclone-induced moisture and dynamic conditions, which cannot be well analyzed on the seasonal timescale. Therefore, to more deeply understand the different physical processes responsible for the NEC summer precipitation and extreme CDDs, analysis from the synoptic timescale is needed in the future.
Under a warming scenario, in which greenhouse gas concentrations continue to increase, extreme events of temperature and precipitation show an increasing trend over many regions of the world (e.g., Chen, 2013; Rajczak et al., 2013; Li et al., 2016b; Pohl et al., 2017; Xu et al., 2017; Qin et al., 2021). Previous studies have shown that the annual and seasonal average CDDs over China show a decreasing trend in the 21st century (e.g., Zhou et al., 2014; Xu et al., 2015; Wu et al., 2020; Ai et al., 2022; Xu et al., 2022). However, the results of this study indicate that the summer extreme CDDs over NEC does not show a linear trend in the future warmer climate but is projected to show interdecadal variability in the 21st century. This means that global warming could also enhance the interdecadal change in regional climate extremes, and thus the regional diversity of extreme events should be noted in the changing climate.
The MME simulation represents externally forced responses (e.g., Bellomo et al., 2018; Nath et al., 2018; Zheng et al., 2018; Wang et al., 2019; Cao and Yin, 2020). The similarity between observations and CESM-LE MME simulations in this study indicates that the change in summer extreme CDDs over NEC could be largely contributed by anthropogenic climate change. Additionally, the internal decadal variability could also influence the atmospheric anomalies over Lake Baikal-Northeast Asia (e.g., Zhu et al., 2016; Zhang Z. et al., 2018). The positive phase of AMO and negative phase of PDO can induce anticyclonic anomalies over Lake Baikal-Northeast Asia through exciting the Silk Road pattern over Eurasia and Pacific-East Asian teleconnection (Hong et al., 2017; Hong et al., 2020; Zhang et al., 2020; Yang et al., 2021). The Indian Ocean SST warming can also excite anomalous high pressure over Lake Baikal-Northeast Asia through inducing Pacific–Japan pattern (Chen et al., 2019, 2021). Therefore, to what extent the NEC summer extreme CDDs are influenced by external forcing needs to be detected and attributed in future studies. Additionally, previous studies revealed that the anthropogenic forcing has impact on the decadal variability in the climate system, such as the AMO (Booth et al., 2012; Qin et al., 2022), the PDO (Dong and Zhou, 2014), and Indian Ocean SST (Dong and McPhaden, 2017; Hua et al., 2022). These studies indicate that the anthropogenic forcing might lead to the decadal change in anticyclonic anomalies over Lake Baikal-Northeast Asia and NEC summer extreme CDDs, through affecting decadal variability in the aforementioned SST patterns. The detailed mechanism for the influence of the anthropogenic forcing on NEC summer extreme CDDs should be systematically studied in the future.
Internal climate variability has influences on the climate change projections, being an important source of uncertainty especially at regional and decadal scales (Hawkins and Sutton, 2009; Deser et al., 2014, 2020). The initial-condition large ensemble is therefore designed to quantify the forced response and internal variability in climate system, and the large ensemble mean makes the projection more reliable by efficiently reducing the uncertainties from internal variability (Kay et al., 2015; Nath et al., 2018; Wang et al., 2019; Deser et al., 2020). Currently, the CESM-LE has been widely used for climate change projections (e.g., Zhao et al., 2019; Cao and Yin, 2020; Nath and Luo, 2021). Our analysis show that the CESM-LE simulations can generally reproduce the observed variability in summer extreme CDDs over NEC and its-related atmospheric circulations during the historical period. The reasonable simulation of the present climate provides us with confidence that the CESM-LE MME could make a more reliable projection for the future change in NEC summer extreme CDDs. However, there is still a limitation of using only CESM-LE for projection, and further study needs to be performed using more model simulations in the future.
This study investigated the characteristics of summer extreme CDDs over NEC in the changing climate based on observation and CESM-LE simulations. The physical processes responsible for the change in extreme CDDs are further investigated. The changes in atmospheric circulations related to extreme CDDs are further assessed to constrain the projection of extreme CDDs.
In observation, the CDDA over NEC displays an increasing trend during 1960–2019, with a significant interdecadal change around the middle 1990s. The change in CDDA is closely related to an anomalous anticyclone over Lake Baikal-Northeast Asia, which induces downward motion and divergence of water vapor over NEC, providing favorable background conditions for the occurrence of CDDs over the region. Further analysis indicates that the anticyclone over Lake Baikal-Northeast Asia also experienced an interdecadal enhancement around the middle 1990s. The CESM-LE simulations perform well in reproducing the observed change in the CDDA of NEC and its relationship with large-scale atmospheric circulations.
Under the future warmer climate, the CDDA of NEC is projected to show interdecadal variability in the 21st century, with two significant changes around the early 2030s and middle 2080s. The CDDA is projected to increase by approximately 6.7% in the early 21st century (2020–2030). In the middle to late 21st century (2040–2080), the CDDA maintains a similar value to the present climate, with a slight decrease of approximately 0.3%. In the late 21st century (2085–2100), the CDDA is projected to increase by approximately 2.1%. Further analysis indicates that the relationship between the CDDA over NEC and atmospheric circulations could be stable in the present and 21st century in CESM-LE simulations. The projected anomalous anticyclone over Lake Baikal-Northeast Asia shows a similar feature to the CDDA over NEC, which might provide some confidence in the projection of summer extreme CDDs over NEC.
The original contributions presented in the study are included in the article/Supplementary Material, further inquiries can be directed to the corresponding author.
YS: conceptualization, supervision, writing review and editing; YW: writing original draft, formal analysis, data curation; MZ: supervision, writing review and editing, conceptualization; ZZ: software, methodology.
This study was supported by the National Natural Science Foundation of China (Grant 42105018).
The authors declare that the research was conducted in the absence of any commercial or financial relationships that could be construed as a potential conflict of interest.
All claims expressed in this article are solely those of the authors and do not necessarily represent those of their affiliated organizations, or those of the publisher, the editors and the reviewers. Any product that may be evaluated in this article, or claim that may be made by its manufacturer, is not guaranteed or endorsed by the publisher.
The Supplementary Material for this article can be found online at: https://www.frontiersin.org/articles/10.3389/feart.2023.1138985/full#supplementary-material
Ai, Y. W., Chen, H. P., and Sun, J. Q. (2022). Model assessments and future projections of spring climate extremes in China based on CMIP6 models. Int. J. Climatol. 42, 4601–4620. doi:10.1002/joc.7492
Alexander, L. V., Zhang, X., Peterson, T. C., Caesar, J., Kumar, K., Gleason, B., et al. (2006). Global observed changes in daily climate extremes of temperature and precipitation. J. Geophys. Res. Atmos. 111, 051099–D11063. doi:10.1029/2005JD006290
Bellomo, K., Murphy, L. N., Cane, M. A., Clement, A. C., and Polvani, L. M. (2018). Historical forcings as main drivers of the Atlantic multidecadal variability in the CESM large ensemble. Clim. Dyn. 50, 3687–3698. doi:10.1007/s00382-017-3834-3
Booth, B. B. B., Dunstone, N. J., Halloran, P. R., Andrews, T., and Bellouin, N. (2012). Aerosols implicated as a prime driver of twentieth-century North Atlantic climate variability. Nature 484, 228–232. doi:10.1038/nature10946
Bretherton, C. S., Widmann, M., Dymnikov, V. P., Wallace, J. M., and Blade, I. (1999). The effective number of spatial degrees of freedom of a time-varying field. J. Clim. 12, 1990–2009. doi:10.1175/1520-0442(1999)012<1990:TENOSD>2.0.CO;2
Cao, B. F., and Yin, Z. C. (2020). Future atmospheric circulations benefit ozone pollution control in Beijing-Tianjin-Hebei with global warming. Sci. Total Environ. 743, 140645. doi:10.1016/j.scitotenv.2020.140645
Chen, C. A., Hsu, H. H., Liang, H. C., Chiu, P. G., and Tu, C. Y. (2022a). Future change in extreme precipitation in East Asian spring and Mei-yu seasons in two high-resolution AGCMs. Weather Clim. Extrem. 35, 100408. doi:10.1016/j.wace.2022.100408
Chen, D., Gao, Y., Zhang, Y., and Wang, T. (2022b). Effects of spring Arctic sea ice on summer drought in the middle and high latitudes of Asia. Atmos. Ocean. Sci. Lett. 15, 100138. doi:10.1016/j.aosl.2021.100138
Chen, H. P. (2013). Projected change in extreme rainfall events in China by the end of the 21st century using CMIP5 models. Chin. Sci. Bull. 58, 1462–1472. doi:10.1007/s11434-012-5612-2
Chen, R. D., Wen, Z. P., and Lu, R. Y. (2019). Influences of tropical circulation and sea surface temperature anomalies on extreme heat over Northeast Asia in the midsummer of 2018. Atmos. Ocean. Sci. Lett. 12, 238–245. doi:10.1080/16742834.2019.1611170
Chen, R. D., Wen, Z. P., Lu, R. Y., and Liu, W. J. (2021). Interdecadal changes in the interannual variability of the summer temperature over Northeast Asia. J. Clim. 34, 8361–8450. doi:10.1175/JCLI-D-21-0115.1
Deser, C., Lehner, F., Rodgers, K. B., Ault, T., Delworth, T. L., DiNezio, P. N., et al. (2020). Insights from Earth system model initial-condition large ensembles and future prospects. Nat. Clim. Change 10, 277–286. doi:10.1038/s41558-020-0731-2
Deser, C., Phillips, A. S., Alexander, M. A., and Smoliak, B. V. (2014). Projecting North American climate over the next 50 years: Uncertainty due to internal variability. J. Clim. 27, 2271–2296. doi:10.1175/JCLI-D-13-00451.1
Dong, L., and McPhaden, M. J. (2017). Why has the relationship between Indian and Pacific Ocean decadal variability changed in recent decades? J. Clim. 30, 1971–1983. doi:10.1175/JCLI-D-16-0313.1
Dong, L., and Zhou, T. J. (2014). The formation of the recent cooling in the eastern tropical pacific ocean and the associated climate impacts: A competition of global warming, IPO, and AMO. J. Geophys. Res. 119, 11272–11287. doi:10.1002/2013JD021395
Du, Y. B., Zhang, J., Zhao, S. W., and Chen, H. S. (2020). Impact of the eastward shift in the negative-phase NAO on extreme drought over northern China in summer. J. Geophys. Res. 125, e2019JD032019. doi:10.1029/2019JD032019
Duan, H. X., Wang, S. P., Feng, J. Y., and Zeng, D. W. (2014). Drought events and its influence in summer of 2014 in China [in Chinese]. J. Arid. Meteor. 32, 872–880. doi:10.11755/j.issn.1006-7639(2014)-05-0872
Han, J. P., Liu, G., and Xin, Y. F. (2014). A dipole pattern of summer precipitation over mid-high latitude Asia and related snow cover anomalies in the preceding spring. Atmos. Ocean. Sci. Lett. 7, 364–368. doi:10.1080/16742834.2014.11447191
Han, T. T., Wang, H. J., and Sun, J. Q. (2017). Strengthened relationship between eastern ENSO and summer precipitation over northeastern China. J. Clim. 30, 4497–4512. doi:10.1175/JCLI-D-16-0551.1
Hawkins, E., and Sutton, R. (2009). The potential to narrow uncertainty in regional climate predictions. Bull. Amer. Meteorol. Soc. 90, 1095–1108. doi:10.1175/2009BAMS2607.1
He, B. H., Sun, J. Q., Yu, E. T., Wang, H. J., Zhang, M. Q., and Hua, W. (2020). Simulation study on the influence of the great khingan strip and Changbai Mountain on summer rainfall in Northeast China [in Chinese]. Clim. Environ. Res. 25, 268–280. doi:10.3878/j.issn.1006-9585.2020.19189
Hersbach, H., Bell, B., Berrisford, P., Hirahara, S., Horanyi, A., Munoz-Sabater, J., et al. (2020). The ERA5 global reanalysis. Quart. J. Roy. Meteor. Soc. 146, 1999–2049. doi:10.1002/qj.3803
Hong, H. X., Sun, J. Q., and Wang, H. J. (2020). Interdecadal variation in the frequency of extreme hot events in Northeast China and the possible mechanism. Atmos. Res. 244, 105065. doi:10.1016/j.atmosres.2020.105065
Hong, X. W., Lu, R. Y., and Li, S. L. (2017). Amplified summer warming in europe–west Asia and Northeast Asia after the mid-1990s. Environ. Res. Lett. 12, 094007. doi:10.1088/1748-9326/aa7909
Hua, W. J., Dai, A. G., and Qin, M. H. (2022). Reconciling roles of external forcing and internal variability in Indian Ocean decadal variability since 1920. Geophys. Res. Lett. 49, e2021GL097198. doi:10.1029/2021GL097198
Kay, J. E., Deser, C., Phillips, A. S., Mai, A., Hannay, C., Strand, G., et al. (2015). The community Earth system model (CESM) large ensemble project: A community resource for studying climate change in the presence of internal climate variability. Bull. Amer. Meteorol. Soc. 96, 1333–1349. doi:10.1175/BAMS-D-13-00255.1
Kobayashi, S., Ota, Y., Harada, Y., Ebita, A., Moriya, M., Onida, H., et al. (2015). The JRA-55 reanalysis: General specifications and basic characteristics. J. Meteorol. Soc. Jpn. 93, 5–48. doi:10.2151/jmsj.2015-001
Kong, Q. Q., Ge, Q. S., Zheng, J. Y., and Xi, J. C. (2015). Prolonged dry episodes over Northeast China during the period 1961-2012. Theor. Appl. Climatol. 122, 711–719. doi:10.1007/s00704-014-1320-y
Lei, Y. H., and Duan, A. M. (2011). Prolonged dry episodes and drought over China. Int. J. Climatol. 31, 1831–1840. doi:10.1002/joc.2197
Li, H. X., Chen, H. P., Wang, H. J., Sun, J. Q., and Ma, J. H. (2018). Can Barents sea ice decline in spring enhance summer hot drought events over northeastern China? J. Clim. 31, 4705–4725. doi:10.1175/JCLI-D-17-0429.1
Li, J., Zhu, Z. W., and Dong, W. J. (2016a). Assessing the uncertainty of CESM-LE in simulating the trends of mean and extreme temperature and precipitation over China. Int. J. Climatol. 37, 2101–2110. doi:10.1002/joc.4837
Li, W., Jiang, Z. H., Xu, J. J., and Li, L. (2016b). Extreme precipitation indices over China in CMIP5 models. Part II: Probabilistic projection. J. Clim. 29, 8989–9004. doi:10.1175/JCLI-D-16-0377.1
Li, Y., Wang, Y. H., Lv, X. M., Ye, Y. C., and Ji, Y. H. (2015). Spatial distribution and temporal change in extreme weather events in three provinces in Northeast China [in Chinese]. Resour. Sci. 37, 2501–2513.
Liang, F., Liu, D. D., Wang, W. Z., Zhang, F. R., and Yu, F. J. (2016). Temporal and spatial variability of summer extreme precipitation events in Northeast China during 1961–2013 [in Chinese]. Arid. Land Geogr. 39, 565–572. doi:10.13826/j.cnki.cn65-1103/x.2016.03.013
Liu, S. J., Wen, N., and Li, L. (2021). Dynamic and thermodynamic contributions to Northern China dryness in El Niño developing summer. Int. J. Climatol. 41, 2878–2890. doi:10.1002/joc.6995
Merrifield, A., Lehner, F., Xie, S. P., and Deser, C. (2017). Removing circulation effects to assess central U.S. land-atmosphere interactions in the CESM large ensemble. Geophys. Res. Lett. 44, 9938–9946. doi:10.1002/2017GL074831
Nakaegawa, T., Kitoh, A., Murakami, H., and Kusunoki, S. (2014). Annual maximum 5-day rainfall total and maximum number of consecutive dry days over Central America and the Caribbean in the late twenty-first century projected by an atmospheric general circulation model with three different horizontal resolutions. Theor. Appl. Climatol. 116, 155–168. doi:10.1007/s00704-013-0934-9
Nastos, P. T., and Zerefos, C. S. (2009). Spatial and temporal variability of consecutive dry and wet days in Greece. Atmos. Res. 94, 616–628. doi:10.1016/j.atmosres.2009.03.009
Nath, R., Luo, Y., Chen, W., and Cui, X. F. (2018). On the contribution of internal variability and external forcing factors to the Cooling trend over the Humid Subtropical Indo-Gangetic Plain in India. Sci. Rep. 8, 18047. doi:10.1038/s41598-018-36311-5
Nath, R., and Luo, Y. (2021). Future projection of extremely hot and precipitation events over Southeast Asian river basins under RCP8.5 scenario. Int. J. Climatol. 42, 3107–3122. doi:10.1002/joc.7410
Pohl, B., Macron, C., and Monerie, P. A. (2017). Fewer rainy days and more extreme rainfall by the end of the century in Southern Africa. Sci. Rep. 7, 46466. doi:10.1038/srep46466
Qin, M. H., Dai, A. G., and Hua, W. (2022). Influence of anthropogenic warming on the Atlantic multidecadal variability and its impact on global climate in the twenty-first century in the MPI-GE simulations. J. Clim. 35, 2805–2821. doi:10.1175/JCLI-D-21-0535.1
Qin, P. H., and Xie, Z. H. (2016). Detecting changes in future precipitation extremes over eight river basins in China using RegCM4 downscaling. J. Geophys. Res. 121, 6802–6821. doi:10.1002/2016JD024776
Qin, P. H., Xie, Z. H., Zou, J., Liu, S., and Chen, S. (2021). Future precipitation extremes in China under climate change and their physical quantification based on a regional climate model and CMIP5 model simulations. Adv. Atmos. Sci. 38, 460–479. doi:10.1007/s00376-020-0141-4
Rajczak, J., Pall, P., and Schär, C. (2013). Projections of extreme precipitation events in regional climate simulations for Europe and the Alpine Region. J. Geophys. Res. 118, 3610–3626. doi:10.1002/jgrd.50297
Shen, B. Z., Lin, Z. D., Lu, R. Y., and Lian, Y. (2011). Circulation anomalies associated with interannual variation of early- and late-summer precipitation in northeast China. Sci. China Earth Sci. 54, 1095–1104. doi:10.1007/s11430-011-4173-6
Sun, J. Q., and Ao, J. (2013). Changes in precipitation and extreme precipitation in a warming environment in China. Chin. Sci. Bull. 58, 1395–1401. doi:10.1007/s11434-012-5542-z
Sun, J. Q., and Wang, H. J. (2012). Changes of the connection between the summer North Atlantic oscillation and the East Asian summer rainfall. J. Geophys. Res. 117, D08110. doi:10.1029/2012JD017482
Sun, L., Shen, B. Z., Gao, Z. T., Sui, B., Bai, L. S., Wang, S. H., et al. (2007). The impacts of moisture transport of East Asian monsoon on summer precipitation in Northeast China. Adv. Atmos. Sci. 24, 606–618. doi:10.1007/s00376-007-0606-8
Teshome, A., Zhang, J., Demissie, T., and Ma, Q. R. (2022). Observed and future spatiotemporal changes of rainfall extreme characteristics and their dynamic driver in June-August season over Africa. Atmos. Clim. Sci. 12, 358–382. doi:10.4236/acs.2022.122022
Veiga, S. F., and Yuan, H. L. (2021). Performance-based projection of precipitation extremes over China based on CMIP5/6 models using integrated quadratic distance. Weather. Clim. Extrem. 34, 100398. doi:10.1016/j.wace.2021.100398
Wang, J., Yang, X. G., Li, Y., Liu, Z. J., and Zhang, X. Y. (2011). Changes of China agricultural climate resources under the background of global climate change. VI. Change characteristics of precipitation resource and its possible effect on maize production in Sanjiang Plain of Heilongjiang Province. Chin. J. Appl. Ecol. 22, 1511–1522. doi:10.13287/j.1001-9332.2011.0205
Wang, L., Deng, A. Y., and Huang, R. H. (2019). Wintertime internal climate variability over Eurasia in the CESM large ensemble. Clim. Dyn. 52, 6735–6748. doi:10.1007/s00382-018-4542-3
Wang, L., Wu, Z. F., He, H. S., Wang, F. X., Du, H. B., and Zong, S. W. (2017). Changes in summer extreme precipitation in Northeast Asia and their relationships with the East Asian summer monsoon during 1961–2009. Int. J. Climatol. 37, 25–35. doi:10.1002/joc.4683
Wang, Q., and Li, S. L. (2020). Different summer rainfall anomaly patterns in Northeast China associated with two kinds of El Niño events. J. Trop. Meteorol. 26, 223–230. doi:10.46267/j.1006-8775.2020.020
Wu, B., Yang, K., and Zhang, R. H. (2009a). Eurasian snow cover variability and its association with summer rainfall in China. Adv. Atmos. Sci. 26, 31–44. doi:10.1007/s00376-009-0031-2
Wu, B., Zhang, R., Wang, B., and Arrigo, R. D. (2009b). On the association between spring Arctic sea ice concentration and Chinese summer rainfall: A further study. Adv. Atmos. Sci. 26, 666–678. doi:10.1007/s00376-009-9009-3
Wu, J., Han, Z. Y., Xu, Y., Zhou, B. T., and Gao, X. J. (2020). Changes in extreme climate events in China under 1.5°C–4°C global warming targets: Projections using an ensemble of regional climate model simulations. J. Geophys. Res. 125, e2019JD031057. doi:10.1029/2019JD031057
Xu, H. W., Chen, H. P., and Wang, H. J. (2022). Future changes in precipitation extremes across China based on CMIP6 models. Int. J. Climatol. 42, 635–651. doi:10.1002/joc.7264
Xu, Y., Gao, X. J., Giorgi, F., Zhou, B. T., Shi, Y., Wu, J., et al. (2018). Projected changes in temperature and precipitation extremes over China as measured by 50-yr return values and periods based on a CMIP5 ensemble. Adv. Atmos. Sci. 35, 376–388. doi:10.1007/s00376-017-6269-1
Xu, Y., Wu, J., Shi, Y., Zhou, B. T., Li, R. K., and Wu, J. (2015). Change in extreme climate events over China based on CMIP5. Atmos. Ocean. Sci. Lett. 8, 185–192. doi:10.1080/16742834.2015.11447258
Xu, Y., Zhou, B. T., Wu, J., Han, Z. Y., Zhang, Y. X., and Wu, J. (2017). Asian climate change under 1.5–4°C warming targets. Adv. Clim. Change Res. 8, 99–107. doi:10.1016/j.accre.2017.05.004
Yang, X., Zeng, G., Zhang, G., Li, J., Li, Z., and Hao, Z. (2021). Interdecadal variations of different types of summer heat waves in Northeast China associated with AMO and PDO. J. Clim. 34, 7783–7797. doi:10.1175/JCLI-D-20-0939.1
Ye, H. C., and Fetzer, E. J. (2019). Asymmetrical shift toward longer dry spells associated with warming temperatures during Russian summers. Geophys. Res. Lett. 46, 11455–11462. doi:10.1029/2019GL084748
Zeng, D. W., Yuan, X., and Roundy, J. K. (2019). Effect of teleconnected land-atmosphere coupling on Northeast China persistent drought in spring-summer of 2017. J. Clim. 32, 7403–7420. doi:10.1175/JCLI-D-19-0175.1
Zeng, Z. X., and Sun, J. Q. (2021). Characteristics of spring consecutive dry days with different durations across China based on the objective zoning approach. Atmos. Sci. Lett. 22, e1035. doi:10.1002/asl.1035
Zeng, Z. X., and Sun, J. Q. (2022). Decadal change of extreme consecutive dry days in spring over the middle and lower reaches of the Yangtze River around the early 2000s: The synergistic effect of mega-El Niño/Southern Oscillation, Atlantic Multidecadal Oscillation, and Arctic sea ice. Atmos. Res. 266, 105936. doi:10.1016/j.atmosres.2021.105936
Zhang, G., Zeng, G., Li, C., and Yang, X. (2020). Impact of PDO and AMO on interdecadal variability in extreme high temperatures in North China over the most recent 40-year period. Clim. Dyn. 54, 3003–3020. doi:10.1007/s00382-020-05155-z
Zhang, J., Chen, H. S., and Zhang, Q. (2019). Extreme drought in the recent two decades in northern China resulting from Eurasian warming. Clim. Dyn. 52, 2885–2902. doi:10.1007/s00382-018-4312-2
Zhang, J., Qian, W. H., and Ding, T. (2010). Characteristics and trends of rainfall events in northeast China from May to September during 1956–2008 [in Chinese]. Meteorol. Mon. 36, 1–7. doi:10.7519/j.issn.1000-0526.2010.8.001
Zhang, R. H. (2015). Natural and human-induced changes in summer climate over the East Asian monsoon region in the last half century: A review. Adv. Clim. Change Res. 6, 131–140. doi:10.1016/j.accre.2015.09.009
Zhang, R. H., Zhang, R. N., and Zuo, Z. Y. (2016). An overview of wintertime snow cover characteristics over China and the impact of Eurasian snow cover on Chinese climate [in Chinese]. J. Appl. Meteorol. Sci. 27, 513–526. doi:10.11898/1001-7313.20160501
Zhang, W. X., and Zhou, T. J. (2019). Increasing impacts from extreme precipitation on population over China with global warming. Sci. Bull. 65, 243–252. doi:10.1016/j.scib.2019.12.002
Zhang, X. B., Alexander, L., Hegerl, G. C., Jones, P., Tank, A. K., Peterson, T. C., et al. (2011). Indices for monitoring changes in extremes based on daily temperature and precipitation data. WIREs Clim. Change 2, 851–870. doi:10.1002/wcc.147
Zhang, Y., Wang, Z. S., Sha, S., and Feng, J. Y. (2018). Drought events and its causes in summer of 2018 in China [in Chinese]. J. Arid. Meteorol. 36, 884–892. doi:10.11755/j.issn.1006-7639(2018)-05-0884
Zhang Z., Z., Sun, X., and Yang, X. (2018). Understanding the interdecadal variability of East Asian summer monsoon precipitation: Joint influence of three oceanic signals. J. Clim. 31, 5485–5506. doi:10.1175/JCLI-D-17-0657.1
Zhao, A. D., Stevenson, D. S., and Bollasina, M. A. (2019). The role of anthropogenic aerosols in future precipitation extremes over the Asian Monsoon Region. Clim. Dyn. 52, 6257–6278. doi:10.1007/s00382-018-4514-7
Zheng, X. T., Hui, C., and Yeh, S. W. (2018). Response of ENSO amplitude to global warming in CESM large ensemble: Uncertainty due to internal variability. Clim. Dyn. 50, 4019–4035. doi:10.1007/s00382-017-3859-7
Zhou, B. T., HanWen, Q. Z., Xu, Y., Song, L. C., and Zhang, X. B. (2014). Projected changes in temperature and precipitation extremes in China by the CMIP5 multimodel ensembles. J. Clim. 27, 6591–6611. doi:10.1175/JCLI-D-13-00761.1
Zhu, H. H., Jiang, Z. H., and Li, L. (2021). Projection of climate extremes in China, an incremental exercise from CMIP5 to CMIP6. Sci. Bull. 66, 2528–2537. doi:10.1016/j.scib.2021.07.026
Keywords: Northeast China, summer consecutive dry days, interdecadal change, projection, CESM-LE
Citation: Sun Y, Wang Y, Zhang M and Zeng Z (2023) Summer extreme consecutive dry days over Northeast China in the changing climate: Observed features and projected future changes based on CESM-LE. Front. Earth Sci. 11:1138985. doi: 10.3389/feart.2023.1138985
Received: 06 January 2023; Accepted: 10 March 2023;
Published: 20 March 2023.
Edited by:
Prijitha R. G., University of Kerala, IndiaReviewed by:
Gang Zeng, Nanjing University of Information Science and Technology, ChinaCopyright © 2023 Sun, Wang, Zhang and Zeng. This is an open-access article distributed under the terms of the Creative Commons Attribution License (CC BY). The use, distribution or reproduction in other forums is permitted, provided the original author(s) and the copyright owner(s) are credited and that the original publication in this journal is cited, in accordance with accepted academic practice. No use, distribution or reproduction is permitted which does not comply with these terms.
*Correspondence: Mengqi Zhang, emhhbmdtZW5ncWlAbWFpbC5pYXAuYWMuY24=
Disclaimer: All claims expressed in this article are solely those of the authors and do not necessarily represent those of their affiliated organizations, or those of the publisher, the editors and the reviewers. Any product that may be evaluated in this article or claim that may be made by its manufacturer is not guaranteed or endorsed by the publisher.
Research integrity at Frontiers
Learn more about the work of our research integrity team to safeguard the quality of each article we publish.