
95% of researchers rate our articles as excellent or good
Learn more about the work of our research integrity team to safeguard the quality of each article we publish.
Find out more
ORIGINAL RESEARCH article
Front. Earth Sci. , 22 February 2023
Sec. Structural Geology and Tectonics
Volume 11 - 2023 | https://doi.org/10.3389/feart.2023.1138360
This article is part of the Research Topic Sichuan-Tibet Traffic Corridor: Fundamental Geological Investigations and Resource Endowment View all 11 articles
 Hanping Wan1
 Qiao Wang2*
The Yadong-Gulu rift (YGR) South Tibet is a Cenozoic active rift, which is endowed with abundant geothermal resources. The Gulu geothermal field (GGF) is located in the Northern section of the rift, where a large number of high-temperature hot springs develop, but its geothermal system is mysterious. In this study, the three-dimensional (3D) electrical structure of GGF is revealed by broad magnetotelluric (MT) and audio magnetotelluric (AMT). MT reveals that middle and upper crust conductors are developed in the subsurface of GGF. The conductors may originate from the partial melting that drives the geothermal system. AMT reveals that the electrical structure of GGF is conductive alternation cap overlying more resistive reservoir, which is consistent with the classical electrical structure of geothermal systems in worldwide active tectonic zones. According to the geothermal system model, cold fluids may converge from the periphery of GGF to the middle, wherein fault F1 (the Western branch of Jiulazi-Sanxung fault) may be the main channel for cold fluids to migrate downward. The fluids are heated by partial melting in the middle and upper crust, and may migrate upward along fault F2 (the middle branch of Jiulazi-Sanxung fault) and develop into heat reservoirs.
The YGR in the Southern Tibet is a Cenozoic active rift, which is characterized by active normal faults, frequent earthquakes, widespread thermal springs and high terrestrial heat flow, being endowed with abundant geothermal energy (Armijo et al., 1986; Hu et al., 2000; Yin and Harrison, 2000; Wu et al., 2011; Chevalier et al., 2020; Bian et al., 2022), Figure 1. High-temperature geothermal energy is renewable and can be used for power generation (Barbier, 2002; Rybach, 2010). The only two commercial geothermal power stations in China are located in the middle of YGR, that is Yangbajing geothermal field and Yangyi geothermal field, whose installed capacity is 25.15 MW and 16 MW, respectively (Dorji, 2003; Wang and Guo, 2010). A large number of high-temperature hot springs are developed on the surface of GGF, which is located in the north of YGR (Liu et al., 2014), Figure 1A. The unclear geothermal system of GGF limits the development of commercial power generation.
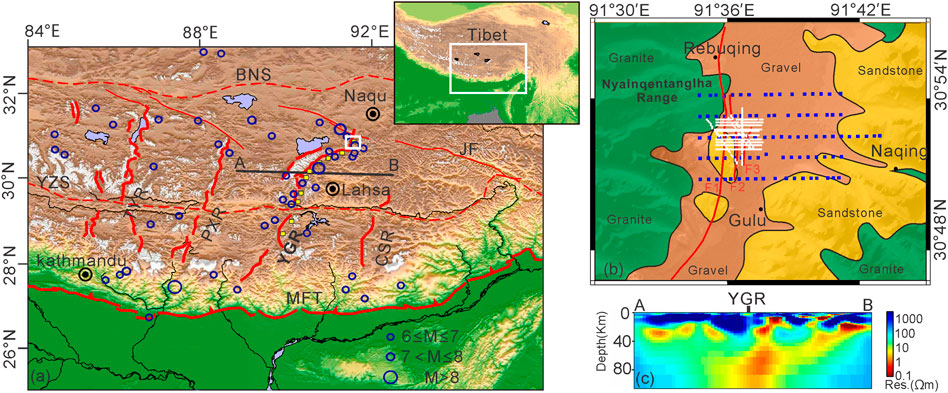
FIGURE 1. Geologic setting and sounding sites (A) Tectonic framework of Yadong-Gulu rift (modified from Shi et al., 2020). A large number of earthquakes are distributed around YGR, suggesting that YGR has intense activity. Red dots are sutures. Red lines are faults. Blue circles are earthquakes. Yellow diamonds are geothermal manifestations. Black line is the previous MT section, as shown in Figure 1C. (B) Sounding sites overlap on the geology of Gulu geothermal filed. Jiulazi-SanXung fault is consist of fault F1, F2 and F3. Nyainqentanglha Range is mainly composed of granite. The middle Jurassic Mali formation sandstone (J2m) and Quaternary gravel (Q) are the sedimentary strata of GGF. Blue diamonds are MT sites. White dots are AMT sites. (C) Electrical model of section AB (modified from Wang G et al., 2017). High conductors of mantle origin are distributed in the subsurface of YGR.
Geothermal systems are generally composed of shallow structures and deep heat sources, the former is key to understand geothermal systems (Cumming, 2009; Liao, 2017). Water geochemistry indicates that atmospheric precipitation is the main source of groundwater, including a small amount of magmatic water (Liu et al., 2014; Su et al., 2020; Wang et al., 2020; Yu et al., 2022). Tensional faults constitute fluid circulation channels and thermal reservoirs (Zhang et al., 2014; Wang S et al., 2017). The Quaternary hydrothermal sinter seals off the geothermal reservoirs, and the widely distributed hot springs imply good geothermal potential (Gao et al., 2022). The north-south active normal fault obviously controls the hydrothermal activity (Li and hou, 2005; Wu et al., 2006; Guo et al., 2007). Previous studies on the formation mechanism of geothermal system are mainly based on surface investigation (Zhao et al., 2002; Liu et al., 2009; Feng et al., 2012; Hu et al., 2022), laying a foundation for understanding of GGF geothermal systems. However, the lack of deep structure seriously restricts the understanding of GGF geothermal system.
Electrical resistivity in the subsurface is sensitive to characterize geothermal context, such as the shallow geothermal structure and deep heat source (Newman et al., 2008; Muñoz, 2013; Spycher et al., 2014). Fluid-bearing faults (or fractures) and heat sources are the main components of geothermal systems, which often show high conductivity and are easy to be imaged by MT (Abiye and Haile, 2008; Piña-Varas, et al., 2014; Peacock et al., 2016; Paolo et al., 2020). In this study, MT and AMT imagining have been carried out, and 3D inversion has been implemented to obtain the electrical structure of the middle and upper crust of GGF. Combining with previous researches, the origin of heat source is discussed on the electrical structure of MT. This study reveals the distribution of shallow geothermal systems by AMT. On this basis, the geothermal systems in tectonically active zones around the world are compared and analyzed, and the geothermal system model of GGF is constructed, which provides an important basis for understanding the geothermal system model of YGR in the South Tibet.
To clarify the origin of deep heat source in the GGF, we deployed 3D MT. The space of MT sites is about 0.6 km, and the collecting time is about 24 h with five components of electromagnetic field (Ex, Ey, Hx, Hy, Hz). In addition, in order to understand the fault and fluid distribution, 3D AMT was carried out in the hot springs developed area. The AMT space is about 0.05 km, the collecting time is 1 h with 5 components of electromagnetic field. Both MT and AMT data were collected by Phoenix V5-2000. On this basis, impedance tensors were estimated through the robust technique (Egbert, 1997).
The 3D inversion of MT and AMT data were carried out on the ModEM modules (Egbert, 2012; Kelbert et al., 2014). 3D inversion can effectively minimize the influence of off-profile structure and reveal a more real subsurface structure (Siripunvaraporn, 2011). Input data for the 3D inversions are all components of the MT and AMT impedance tensor for period range from 0.0001–1,000 s. The error floor for all tensors were 5% of sqrt (|Zxy×Zyx|). The starting model was set to a uniform half space with background resistivity of 100 Ωm, which was divided in a grid of 94 × 130 × 80 cells in the x, y, and z directions, respectively. In the data coverage part, horizontal cell sizes are set to 0.1 × 0.1 km. Ten padding cells with an increasing factor of 1.5 were also included. In the vertical direction, first layer is set to 50 m thickness, followed by 79 layers increasing thicknesses gradually by a factor of 1.1. After 103 times of iteration, the root-mean-square (RMS) misfit reached 2.18 (Figure 2), and a reliable resistivity model was obtained.
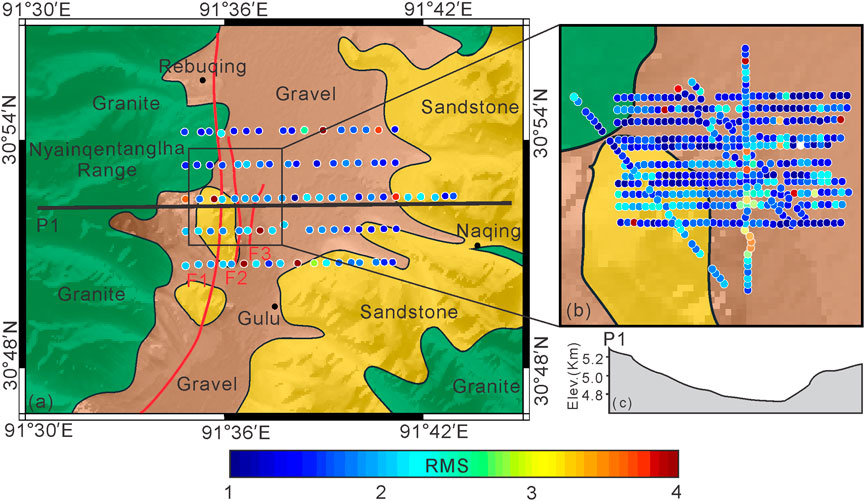
FIGURE 2. RMS of Magnetotelluric 3D inversion and tomographic section. (A) RMS of MT 3D inversion. RMS of most MT sites is less than 3. (B) RMS of AMT 3D inversion. RMS of a few AMT sites is around 4. (C) Topographic section of P1. The high terrain on both sides of GGF facilitates fluid migration to the center.
The electrical structure in shallow depth is characterized by high resistivity in the middle and high conductivity in the periphery. Geothermal systems typically consist of faults and fractures filled with geothermal fluids that may contain high concentrations of dissolved salts resulting in the presence of conductive electrolytes in the rock matrix (Muñoz, 2013). Hence, the resistivity of geothermal systems composed of fluids and electrolytes is about n × 10 Ωm (high conductivity), and that of granites is about n × 100 Ωm (high resistivity) (Newman et al., 2008; Peacock et al., 2012; Muñoz, 2013). These features provide an important basis for the interpretation of AMT data. Resistivity models at depths less than 0.4 km show that high conductivity (ρ<10 Ωm) is the dominant feature (Figure 3A, B), which may be related to the Quaternary strata, faults or fluids. Resistivity models of depths greater than 0.4 km show that there is a resistor R11 (ρ>1,000 Ωm), implying the presence of granite. The conductors C11, C12 and C13 located around the resistor R11 extends below 1 km, while the thickness of Quaternary strata in this area is generally less than 0.2 km (Armijo et al., 1986). We conclude that the shallow conductors may be related to the fluid migration.
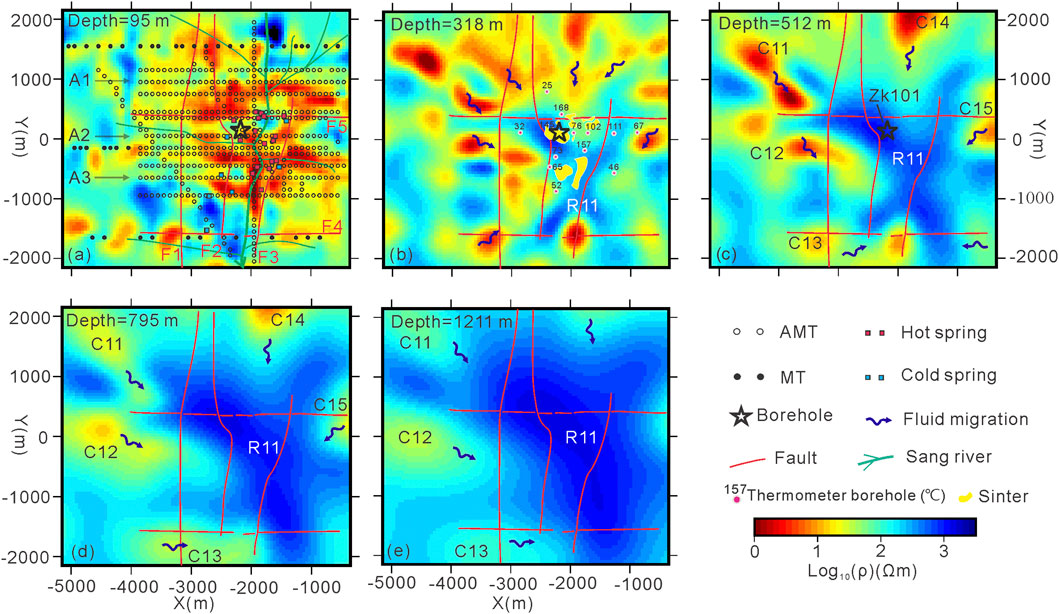
FIGURE 3. Horizontal slices of electrical model at different depths revealed by AMT. (A–E) Horizontal slices at depths of 95 m, 318 m, 512 m, 795 m, 1,211 m, respectively. The electrical model has the characteristics of high conductivity in the shallow depth (A–C) and high resistivity in the deep depth (D–E). Thermometer boreholes with depths of 57.1–83.1 m give out temperatures at the bottoms, as shown in Figure 3B.
Section A3 reveals fluid migration in the GGF. Conductor C12 is distributed beneath fault F1, extending to a depth of less than 1 km, which is inferred to be the migration direction of cold fluids. The migration direction is consistent with the topographic distribution of the surface, as shown in Figure 2C. In addition, a large number of cold springs distributed near fault F1, indicating that fault F1 may be the cold fluid channel, as shown in Figure 3A. The resistivity anomaly that cannot be ignored in Figure 4 is the high resistivity salient, marked by yellow arrows. The high resistivity salient may be caused by fault F2. The fault F2 may be a deep fault that controls granite invasion and also constitutes a heat-conducting channel. Borehole ZK101 revealed 5 layers of heat reservoirs and dozens of hydrothermal alteration zones in the hanging wall of fault F2 (Gao et al., 2022). In addition, there are a large number of hot springs and sinters on the eastern side of the fault F2 (Figures 3A, B), suggesting that the fault F2 may be an important heat-conducting channel for the GGF.
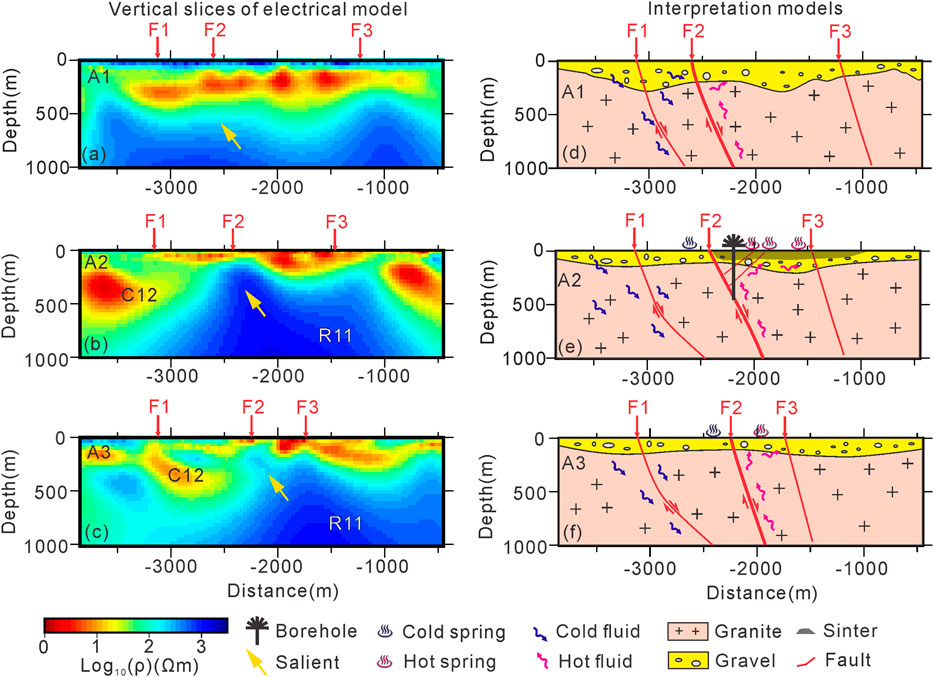
FIGURE 4. Vertical slices of electrical model and interpretation revealed by AMT. (A–C) Section resistivity models of A1-A3. High resistivity salient is an important feature in the electrical model, as shown by yellow arrows. (D–F) Interpretation models of A1-A3. Faults F1 and F2 may be the cold and hot fluids migration channel, respectively. The resistor R11 may imply presence of granite.
Different from section A2 and A3, section A1 reveals that there is a continuous and stable layer of high conductivity in the shallow depth, suggesting different geothermal context between the South and North of GGF. The nearly continuous conductivity layer in Figure 4A may suggest that there is an abundance of subsurface fluids and even good connectivity between these fluids. The influx of cold fluid will reduce the temperature of hot fluid, which is not conducive to the exploration of high-temperature geothermal system. This may also be the main reason why there is no surface hydrothermal activity in the north of GGF, as shown in Figure 3B. Combined with surface geology, boreholes, and resistivity anomalies, we deduce the deep extension of the faults F1, F2 and F3, Figures 4D–F. After clarifying the superficial fluid and fault system, it is the key to understand the deep heat source.
The horizontal slice of 3D electrical structure is important for understanding the transverse distribution of anomalous electrical bodies. According to the 3D inversion results, the electrical structures with depths of 1,023 m, 4,910 m, 9,757 m and 15,836 m were plotted, as shown in Figures 5A–D. The resistor R1 (ρ>1,000 Ωm) and the conductors C1 and C2 (ρ<30 Ωm) are distributed at different depths. Resistor R1 may represent intact granite and is an important medium for deep heat conduction to the surface (Newman et al., 2008; Piña-Varas, et al., 2014). The resistor R11 in Figure 4 is the shallow part of resistor R1 in Figure 5 on account of the same electrical anomaly and similar resistivity value. Resistors R11 and R1 represent the nearly intact granites. In Figure 5A, four conductors (C1, C2, C3, C4) are distributed around the resistor R1. They gradually become discrete on the shallow surface, which may indicate fluid migration, which has been elaborated on the AMT section. Conductors C3 and C4 are located above the R1 in Figures 5D, E, implying that there might be two blind faults bearing fluids in the southern GGF (Figures 5F, G). Conductors C1 and C2, located in the either side of GGF, extend deep and are more clearly shown in the sections.
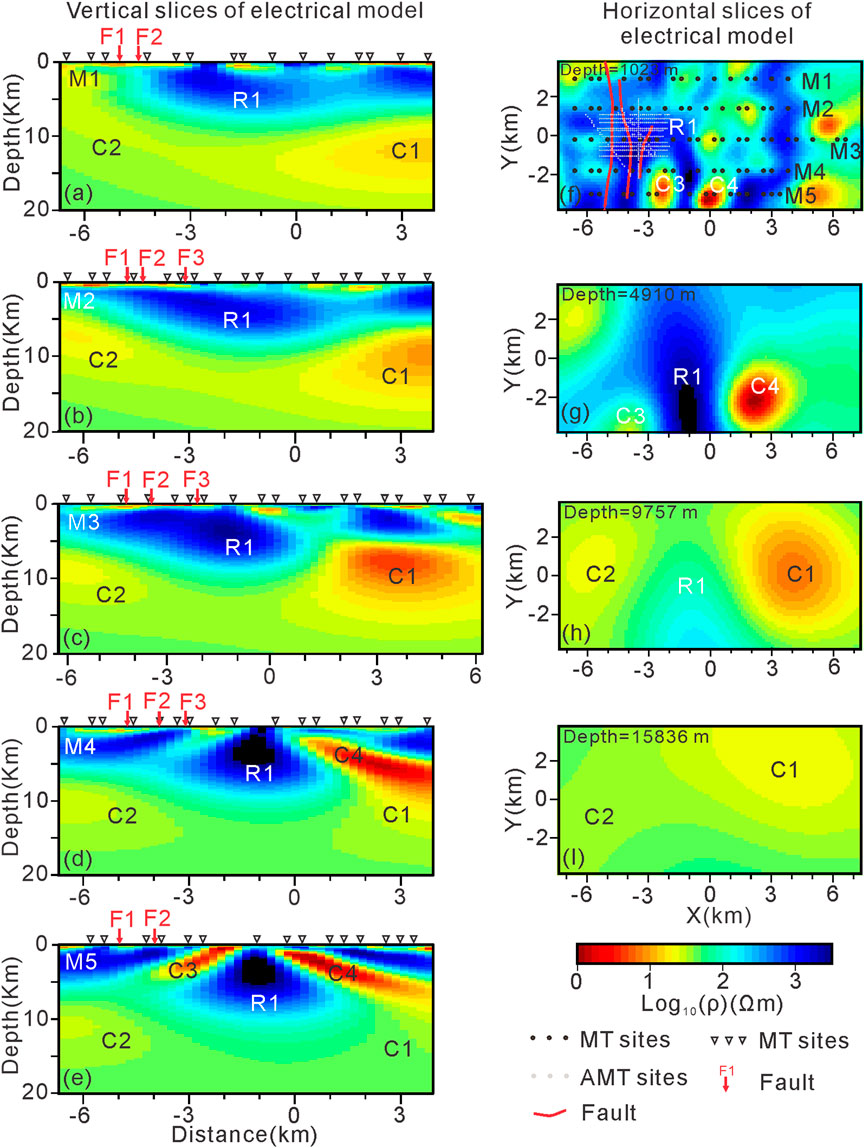
FIGURE 5. Horizontal and vertical slices of resistivity in GGF revealed by the MT. Figure (A–E) are vertical resistivity slices of M1 - M5, respectively. The vertical models are characterized by high resistivity at depth above ∼8 km and high conductivity at depth below 8 km. Figure (F–I) are horizontal resistivity slices of depths at 1,028 m, 4,910 m, 9,757 m, 15,836 m, respectively. Conductors C1 and C2 dominate the electrical anomaly of horizontal models. AMT sites indicate the location of GGF.
High conductivity domains the main resistivity feature in the subsurface of GGF. Conductors C1 and C2 (ρ<30 Ωm) has been imagined in these sections, among of which the section M3 is representative, Figure 5C. Section M3 shows different conductivity anomaly at the east and west of GGF. The west is characterized by resistivity, while the East is characterized by conductivity, which are also reflected in the horizontal slices. Conductors C1 and C2 extends to depth of 20 km and has no trap at the bottom, implying that they have a deep origin (Bertrand et al., 2012).
The middle and upper crust conductors C1 and C2 may originate from the upper mantle. Wang S et al. (2017) reveals that there are the conductors with approximately continuous distribution from the upper mantle to the middle and upper crust beneath the YGR, Figure 1C. In addition, Jin et al. (2022) reveals the similar conductivity anomaly characteristics through sparse 3D magnetotelluric data. Due to large site spacing (>20 km), previous researches mainly reveal crust-mantle scale structures of YGR (Lei et al., 2023). On the contrary, the authors deployed the MT with site space of ∼0.6 km in the GGF, which can reveal the fine electrical structure of the middle-upper crust. It is concluded that conductors C1 and C2 has a good spatial coupling relationship with the middle and lower crust conductors originating from upper mantle revealed by previous researches (Figure 1C), suggesting that they may have a high-temperature.
Partial melting may contribute to the conductors C1 and C2 beneath the GGF. For active tectonic zones, the main mechanisms for generating conductors are partial melting and aqueous fluids (Yang, 2011). It may be more appropriate to interpret conductors C1 and C2 by partial melting (Chen et al., 1996; Unsworth et al., 2005), because partial melting can continuously provide high terrestrial heat flow values (∼100 mW/m2, significantly higher than the surrounding areas, Hu et al., 2000) to the GGF. The resistivity revealed by MT can be used to estimate the fluid fraction (Le Pape et al., 2015). Partial melting zones may exist below C1 and C2 at depths of ∼8 km, with resistivity values of about 30 Ωm, indicating the presence of 2%–5% partial melting (Gaillard and Marziano, 2005). High-temperature and high-pressure experiments show that a small amount of water can affect partial melting fraction (Yang, 2011). The minor difference of resistivity between C1 and C2 may be due to the difference of water content in partial melting (Holtz et al., 2001).
Partial melting may originate from tearing of Indian slab (IS). The IS subducted beneath the Tibet at different angles (gentle in the west and steep in the east, Liang and Song, 2006; Li et al., 2008; Zhao J et al., 2010; Shi et al., 2020). Since the uneven gravitational field of IS triggering the differential dragging, it gives rise to the tearing of IS into multiple pieces (Chen et al., 2015; Li and Song, 2018). Mantle hot materials upwelled into the crust along the IS tearing windows and are geophysically imaged as low velocity bodies or high conductivity bodies in the middle and lower crust (Nelson, 1996; Wei et al., 2001; Unsworth et al., 2005; Jin et al., 2022). In addition, the tearing of IS caused the East-West extension of the upper crust, and several North-South trending rifts were formed in the Southern Tibet, such as the YGR (Wang Y et al., 2022; Lei et al., 2023). Mantle upwelling brought a large number of hot materials to the middle and lower crust (Li and Song, 2018), which lead to partial melting of crust. Partial melting of the middle and lower crust would penetrate the middle and upper crust along the tensile faults, forming the deep heat source of GGF. They are imagined as conductors C1 and C2 by MT (Figures 5H, I), which may be the origin of high terrestrial heat flow in the YGF. They are also supported by other evidences, such as seismic wave velocity (Tian et al., 2015; Wu et al., 2019; Shi et al., 2020), mantle CO2 emission (Kapp and Guynn, 2004; Zhang et al., 2021). Therefore, it is suggested that partial melting is the heat source driving high-temperature geothermal system of GGF, confirming the previous conjecture that heat source exists in the middle and upper crust (Dorji, 2003; Li and Hou, 2005; Gao et al., 2022; Wang R et al., 2022).
The north-south normal fault is an important channel for fluid migration. In the GGF, the east-dipping active normal fault is a part of the Nyainqentanglha fault, which undertakes the east-west stretching (∼6 mm/yr) and triggered the 1952 Mw7.4 Gulu earthquake (Tapponnier et al., 1981; Armijo et al., 1986; Chevalier et al., 2020), laying the foundation for the development of hot springs (Gao et al., 2022). The ages of fault and sinters overlap since Miocene, suggesting a strong correlation between fault and geothermal fluids (Shen, 1992; Zhao Y et al., 2010). The five geothermal reservoirs and hidden geothermal alteration zones revealed by borehole ZK101 in the middle of GGF, suggesting that fault F2 is a geothermal fluid channel (Gao et al., 2022). The geothermal system elements, such as hot springs at the surface with high conductivity and geothermal reservoirs at the depth with high resistivity, are well imagined by AMT, Figures 3, 4, which are consistent with high-temperature geothermal systems worldwide (Ussher et al., 2000). Due to the low permeability and high resistivity of granite (Newman et al., 2008), geothermal reservoirs (n × 100 Ωm) tend to have higher resistivity than geothermal alteration zones (1–10 Ωm) (Wright et al., 1985; Pellerin et al., 1996; Piña-Varas et al., 2014). Based on such features, we believe that the yellow arrows in Figure 4 may represent geothermal reservoirs, and the fault F2 may be the upward migration channel of geothermal fluids.
Hydrothermal alternation zones, as the cap of geothermal system, seal off the hot fluids. Due to clays and brines, the hydrothermal alteration zones are often characterized by high conductivity (Wright et al., 1985; Muñoz, 2014). Horizontal resistivity slice of depth at 95 m shows that there is a large area of shallow conductors in GGF, Figure 3A. Not all conductors are the hydrothermal alternation zones (Muñoz, 2013). Fortunately, thermometer borehole can directly reveal the existence of hydrothermal alternation zone. Except for the thermometer boreholes below 50°C in Figure 3B, all the other boreholes reveal that there are hydrothermal alteration zones with a thickness of ∼20–40 m distributed below 10 m on the surface, constituting the cap of the GGF geothermal system. In addition, the cold fluid migration is also worth identifying.
Fault F1 may be the channel for cold fluid migration. Fissures generated by faulting are important channels for surface fluids to migrate to the depth (Dorji, 2003). On the horizontal slices, the conductors (C11-C14) with increasing depth clearly show that the migration pathways of cold fluids are converging from the periphery to the middle (Figures 3D,E), which are consistent with the topographic relief of GGF (Figure 3C). The resistivity models A2 and A3 indicate that the fluids in the east may not be deeply circulating, while the conductor C12 in the west may indicate deep circulation of fluids (Figure 4). In general, high-temperature geothermal reservoirs can only be formed through deep circulation of fluids (Cumming and Mackie, 2010; Muñoz, 2014). Hydrogen and oxygen isotopes reveal that atmospheric precipitation is an important supply source of underground fluids (Zhang et al., 1995; Liu et al., 2014). Some of them migrate deeply into the West of Nyainqentanglha range, and the others overflow to the surface on the east side of fault F1 in the form of cold spring (Figure 3A). The fluids with deep migrating have the characteristics of high conductivity, which is imaged as conductor C12 by AMT, Figures 4C, E. Therefore, it is suggested that fault F1 may be an important channel for the deep migration of cold fluids.
Conceptionally, an ideal high-temperature geothermal system (temperature above 150°C–200°C, Muffler and Cataldi, 1978; Benderitter and Cormy, 1990) consists of heat source, heat reservoirs and cap, which are disputed in the tectonic active zones, such as plate boundaries, volcanic zones and rift zones (Majorowicz and Grasby, 2010; Muñoz, 2014). Conductive alteration cap overlying a more resistive reservoir is the classical electrical structure in the high-temperature geothermal systems, such as Taupo volcanic zone in New Zealand, Basin and Range province in California (Heise et al., 2007; Newman et al., 2008). The partially molten magma chambers are believed to be the heat source driving the geothermal systems (Wannamaker et al., 2004). Similar electrical structure and heat source also appear in the GGF. Unlike them, the electrical structure in the GGF appears to be shallower in the depth and higher in resistivity value, possibly due to young geothermal fluids activity. Based on above analyses, the authors establish the geothermal system model of GGF, Figure 6.
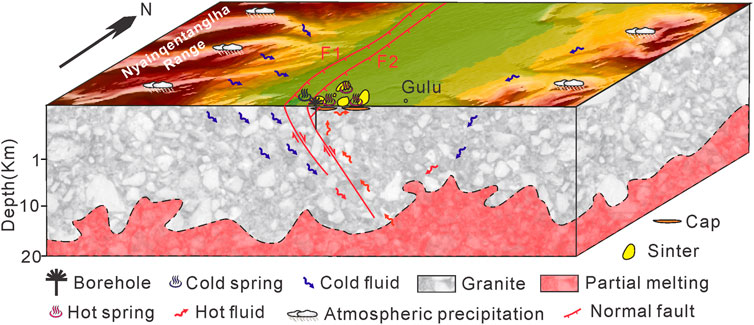
FIGURE 6. Cartoon model of geothermal system in Gulu geothermal field. Atmospheric precipitation feeds the underground fluids. The cold and hot fluids mainly migrate along the faults F1 and F2, respectively. The hydrothermal alternation zones below ∼30–50 m of surface revealed by boreholes are the cap of geothermal system of Gulu geothermal field. Partial melting in middle and upper crust drives the geothermal system.
The atmospheric precipitation migrates to the depth along the normal fault F1. With the depth increases, these cold fluids are gradually heated by partial melting, and transform into high-temperature geothermal fluids. Due to the upward geothermal buoyancy (Dorji, 2003), the geothermal fluids begin to migrate upward along the normal fault F2, and form hot springs and geothermal alteration zones on the surface.
The Yadong-Gulu rift in southern Tibetan is a tensile active rift, which gives rise to high-temperature geothermal systems, and the Gulu geothermal field is located in its northern section. Through three-dimensional inversion of integrated magnetotelluric and audio magnetotelluric data, the electrical model of the Gulu geothermal field is obtained. MT and AMT imagine conductors (C11, C12 and C13 in shallow depth, C1 and C2 in the deep) and resistors (R11 and R1) beneath Gulu geothermal field. Combined with geology, boreholes and previous researches, this paper explains the conductors and resistors and obtains the following understandings.
(1) Magnetotelluric reveals that conductors C1 and C2 are developed beneath the middle and upper crust of the Gulu geothermal field. The conductors may be the partial melting originating from the mantle upwelling, which drives the high-temperature geothermal system in the Gulu geothermal field.
(2) Audio magnetotelluric reveals the shallow electrical structure of Gulu geothermal system. The hydrothermal alternation cap with high conductivity overlies the high-temperature geothermal reservoirs with high resistivity, which is consistent with the classical electrical structure of active rifts geothermal systems worldwide. Faults F1 and F2 may be the cold and hot fluids migration channels, respectively.
(3) The geothermal system model of Gulu geothermal field constraining from the electrical structure is constructed. Cold fluids migrate from the periphery of Gulu geothermal field to the middle and supplies to the subsurface. Fault F1 may be the main downward migration channel of cold fluids. Due to the partial melting in the middle and upper crust, cold fluids are heated into hot fluids. Hot fluids may migrate upward along the fault F2, forming a large number of thermal alteration zones and hot springs in the Gulu geothermal field.
The raw data supporting the conclusion of this article will be made available by the authors, without undue reservation.
HW designed and organized the project. HW and QW analyzed the data. HW and QW interpreted the results and wrote the manuscript.
This research was partially supported by the Centralized R&D project of China National Nuclear Corporation ([2019] No. 419).
We thank Gary Egbert and Anna Kelbert for providing their 3D MT inversion code ModEM. We thank the associate editor and the reviewers for constructive comments that helped to improve this paper. We thank the researchers involved with collecting these valuable data. We are grateful to Shibing Xia for his assistance in mapping part of pictures.
The authors declare that this study received funding from China National Nuclear Corporation ([2019] No. 419). The funder had the following involvement in the study: design, data collection and analysis, decision to publish, and preparation of the manuscript.
All claims expressed in this article are solely those of the authors and do not necessarily represent those of their affiliated organizations, or those of the publisher, the editors and the reviewers. Any product that may be evaluated in this article, or claim that may be made by its manufacturer, is not guaranteed or endorsed by the publisher.
CSR, Cona-Sangri rift; GGF, Gulu geothermal field; JF, Jiali fault; MFT, Main front thrust; NS, Bangong-Nujiang Suture; PXR, Pumqu-Xainza rift; TYR, Tangra-Yumco rift; YGR, Yadong-Gulu rift; YZS, Yarlung-Zangbo suture.
Abiye, T. A., and Haile, T. (2008). Geophysical exploration of the boku geothermal area, central Ethiopian rift. Geothermics 37, 586–596. doi:10.1016/j.geothermics.2008.06.004
Armijo, R., Tapponnier, P., Mercier, J. L., and Han, T. L. (1986). Quaternary extension in Southern Tibet – field observations and tectonic implications. J. Geophys. Res. Solid Earth 91, 13803–13872. doi:10.1029/jb091ib14p13803
Barbier, E. (2002). Geothermal energy technology and current status: An overview. Renew. Sustain Energy Rev. 6, 3–65. doi:10.1016/s1364-0321(02)00002-3
Benderitter, Y., and Cormy, G. (1990). “Possible approach to geothermal research and relative costs,” in Small geothermal resources: A guide to development and utilization. Editors M. H. Dickson, and M. Fanelli (New York: UNITAR), 59–69.
Bertrand, E. A., Caldwell, T. G., Hill, G. J., Wallin, E., Bennie, S., Cozens, N., et al. (2012). Magnetotelluric imaging of upper-crustal convection plumes beneath the Taupo Volcanic Zone, New Zealand. Geophys Res. Lett. 39, L02304. doi:10.1029/2011GL050177
Bian, S., Gong, J., Zuza, A. V., Yang, R., Chen, L., Ji, J., et al. (2022). Along-strike variation in the initiation timing of the north-trending rifts in southern Tibet as revealed from the Yadong-Gulu rift. Tectonics 41, e2021TC007091. doi:10.1029/2021tc007091
Chen, L. S., Booker, J. R., Jones, A. G., Wu, N., Unsworth, M. J., Wei, W. B., et al. (1996). Electrically conductive crust in southern Tibet from Indepth magnetotelluric surveying. Science 274 (5293), 1694–1696. doi:10.1126/science.274.5293.1694
Chen, Y., Li, W., Yuan, X., Badal, J., and Teng, J. (2015). Tearing of the Indian lithospheric slab beneath southern Tibet revealed by SKS-wave splitting measurements. Ear. Pla. Sci. Let. 413, 13–24. doi:10.1016/j.epsl.2014.12.041
Chevalier, M., Tapponnier, P., van der Woerd, J., Leloup, P. H., Wang, S., Pan, J., et al. (2020). Late Quaternary extension rates across the northern half of the Yadong-Gulu rift: Implication for east-west extension in southern Tibet. Jour. Geoph. Res. Sol. Ear. 125, e2019JB019106. doi:10.1029/2019JB019106
Cumming, W. (2009). Geothermal resource conceptual models using surface exploration data[C], proceedings, 34th workshop on geothermal reservoir engineering, 187. SGP-TR-: Stanford University, 1–6.
Cumming, W., and Mackie, R. (2010). “Resistivity imaging of geothermal resources using 1D, 2D and 3D MT inversion and TDEM static shift correction illustrated by a glass mountain case history,” in proceedings of world geothermal congress 2010, Bali, Indonesia, 25–29 April.
Dorji, X. (2003). The basic characteristics of the yangbajing geothermal field— a typical high-temperature geothermal system. China Eng. Sci. 5 (1), 42–47. doi:10.3969/j.issn.10091742.2003.01.008
Egbert, G. (2012). Hybrid conjugate gradient-Occam algorithms for inversion of multi-frequency and multi-transmitter EM data. Geophys. J. Int. 190, 255–266. doi:10.1111/j.1365-246x.2012.05523.x
Egbert, G. (1997). Robust multiple-station magnetotelluric data processing. Geophys. J. Int. 130, 475–496. doi:10.1111/j.1365-246X.1997.tb05663.x
Feng, Z., Zhao, Y., Zhou, A., and Zhang, N. (2012). Development program of hot dry rock geothermal resource in the Yangbajing Basin of China. Renew. energy 39 (1), 490–495. doi:10.1016/j.renene.2011.09.005
Gaillard, F., and Marziano, G. I. (2005). Electrical conductivity of magma in the course of crystallization controlled by their residual liquid composition. J. Geophys. Res. 110, B06204. doi:10.1029/2004JB003282
Gao, H., Hu, Z., Wan, H., Weilin, H., Song, Z., and Xiao, L. (2022). Characteristics of geothermal geology of the Gulu geothermal field in Tibet. Available at: https://kns.cnki.net/kcms/detail/42.1874.P.20220506.0949.006.html.
Guo, Q. H., Wang, Y., and Wei, L. (2007). Major hydrogeochemical processes in the two reservoirs of the Yangbajing geothermal field, Tibet, China. Jour. Vol Geo. Res. 166 (3-4), 255–268. doi:10.1016/j.jvolgeores.2007.08.004
Heise, W., Bibby, H. M., Caldwell, T. G., Bannister, S. C., Ogawa, Y., Takakura, S., et al. (2007). Melt distribution beneath a young continental rift: The Taupo volcanic zone, New Zealand. Geophys Res. Lett. 34, L14313. doi:10.1029/2007GL029629
Holtz, F., Johannes, W., Tamic, N., and Behrens, H. (2001). Maximum and minimum water contents of granitic melts generated in the crust: A reevaluation and implications. Lithos 56 (1), 1–14. doi:10.1016/S0024-4937(00)00056-6
Hu, S. B., He, L., and Wang, J. (2000). Heat flow in the continental area of China: A new data set. Ear. Plan. Sci. Let. 179 (2), 407–419. doi:10.1016/s0012-821x(00)00126-6
Hu, Z. H., Gao, H. L., and Wan, H. P., (2022). Temporal and spatial evolution of hydrothermal alteration in the Yangbajing geothermal field, Tibet. Geol. Rev. 68 (1), 359–374. doi:10.16509/j.georeview.2021.12.105
Jin, S., Sheng, Y., Comeau, M. J., Becken, M., Wei, W., Ye, G., et al. (2022). Relationship of the crustal structure, rheology, and tectonic dynamics beneath the Lhasa-Gangdese terrane (southern Tibet) based on a 3-D electrical model. J. Geophys. Res. Solid Earth 127, e2022JB024318. doi:10.1029/2022JB024318
Kelbert, A., Meqbel, N., Egbert, G., and Tandon, K. (2014). ModEM: A modular system for inversion of electromagnetic geophysical data. Comput. Geosciences 66, 40–53. doi:10.1016/j.cageo.2014.01.010
Le Pape, F., Jones, A. G., Unsworth, M. J., Vozar, J., Wei, W., Jin, S., et al. (2015). Constraints on the evolution of crustal flow beneath northern Tibet. Geochem. Geophys. Geosystems 16 (12), 4237–4260. doi:10.1002/2015GC005828
Lei, L., Jin, S., Dong, H., Wei, W., Ye, G., and Zhang, L. (2023). 3-D electrical structure and tectonic dynamics in the Yangbajing area based on the array magnetotelluric data. Front. Earth Sci. 10, 1089675. doi:10.3389/feart.2022.1089675
Li, C., van der Hilst, R. D., Meltzer, A. S., and Engdahl, E. R. (2008). Subduction of the indian lithosphere beneath the Tibetan plateau and Burma. Ear. Plan. Sci. Lett. 274 (1-2), 157–168. doi:10.1016/j.epsl.2008.07.016
Li, J. T., and Song, X. D. (2018). Tearing of Indian mantle lithosphere from highresolution seismic images and its implications for lithosphere coupling in southern Tibet. Proc. Natl. Acad. Sci. 115 (33), 8296–8300. doi:10.1073/pnas.1717258115
Li, Z., and Hou, Z. (2005). “Partial melting in the upper crust in southern Tibet: Evidence from active geothermal fluid system,” in Mineral deposit research: Meeting the global challenge (Berlin, Heidelberg: Springer). doi:10.1007/3-540-27946-6317
Liang, C., and Song, X. (2006). A low velocity belt beneath northern and eastern Tibetan Plateau from Pn tomography. Geophys. Res. Lett. 33, L22306. doi:10.1029/2006GL027926
Liao, Z. (2017). Thermal springs and geothermal energy in the qinghai-Tibetan plateau and the surroundings. Springer, Berlin, Heidelber. doi:10.1007/978-981-10-3485-5
Liu, J., Shen, X. H., and Meng, K. (2009). Preliminary study on late Quaternary activity of faults in the Western margin of Gulu Basin. Earthquake 29 (3), 45–53. doi:10.3969/j.issn.10003274.2009.03.006
Liu, Z., Lin, W., and Zhang, M. (2014). Origin of geothermal fluid and contribution of mantle source in Nimu-Nagqu, Tibet. Earth Sci. Front. 21 (6), 356–371. doi:10.13745/j.esf.2014.06.034
Majorowicz, J., and Grasby, S. (2010). Heat flow, depth–temperature variations and stored thermal energy for enhanced geothermal systems in Canada. J. Geophys. Eng. 7 (3), 232–241. doi:10.1088/1742-2132/7/3/002
Muffler, P., and Cataldi, R. (1978). Methods for regional assessment of geothermal resources. Geothermics 7, 53–89. doi:10.1016/0375-6505(78)90002-0
Muñoz, G. (2014). Exploring for geothermal resources with electromagnetic methods. Sur. Geo. 35, 101–122. doi:10.1007/s10712-013-9236-0
Nelson, K. D., Zhao, W., Brown, L. D., Kuo, J., Che, J., Liu, X., et al. (1996). INDEPTH seismic teamPartially molten middle crust beneath southern Tibet: Synthesis of project INDEPTH results. Science 274, 1684–1688. doi:10.1126/science.274.5293.1684
Newman, G., Gasperikova, E., Hoversten, G., and Wannamaker, P. E. (2008). Three-dimensional magnetotelluric characterization of the Coso geothermal field. Geothermics 37, 369–399. doi:10.1016/j.geothermics.2008.02.006
Paolo, F., Ledo, J., Slazak, K., Martinez, D., Cabrera-Perez, I., and Pereze, N. (2020). La Palma island (Spain) geothermal system revealed by 3D magnetotelluric data inversion. Sci. Rep. 10, 18181. doi:10.1038/s41598-020-75001-z
Peacock, J. R., Thiel, S., Reid, P., and Heinson, G. (2012). Magnetotelluric monitoring of a fluid injection: Example from an enhanced geothermal system. Geophys. Res. Lett. 39, 1–5. doi:10.1029/2012gl053080
Pellerin, L., Johnston, J. M., and Hohmann, G. W. (1996). A numerical evaluation of electromagnetic methods in geothermal exploration. Geophysics 61, 121–130. doi:10.1190/1.1443931
Piña-Varas, P., Ledo, J., Queralt, P., Marcuello, A., Bellmunt, F., Hidalgo, R., et al. (2014). 3-D magnetotelluric exploration of Tenerife geothermal system (Canary islands, Spain), Surv. Geophys. 35:1045–1064Nonlinear conjugate gradients algorithm for 2-D magnetotelluric inversion. Geophysics 66, 174–187. doi:10.1190/1.1444893
Rybach, L. (2010). Status and prospects of geothermal energy. Bali, Indonesia: world geothermal congress.
Shen, M. (1992). Evolution and model of Yangbajing hydrothermal system. Selected papers of international symposium on high-temperature geothermal development and utilization in Tibet, Lhasa, 95–98.
Shi, D., Klemperer, S. L., Shi, J., Wu, Z., and Zhao, W. (2020). Localized foundering of Indian lower crust in the India–Tibet collision zone. Proc. Natl. Acad. Sci. 117, 24742–24747. doi:10.1073/pnas.2000015117
Siripunvaraporn, W. (2011). Three-dimensional magnetotelluric inversion: An introductory guide for developers and users. Surv. Geophys. 33 (1), 5–27. doi:10.1007/s10712-011-9122-6
Spycher, N., Peiffer, L., Sonnenthal, G. L., Saldi, G., Reed, M., and Kennedy, B. (2014). Integrated multicomponent solute geothermometry. Geothermics 51, 113–123. doi:10.1016/j.geothermics.2013.10.012
Su, J., Tan, H., and Chen, X. (2020). The groundwater deep circulation and large-scale geothermal deposition in response to the extension of the Yadong–Gulu rift, South Tibet, China. J. Volcanol. Geotherm. Res. 395 (4), 106836. doi:10.1016/j.jvolgeores.2020.106836
Tapponnier, P., Mercier, J. L., Armijo, R., Han, T., and Zhao, T. J. (1981). Field evidence for active normal faulting in Tibet. Nature 294, 410–414. doi:10.1038/294410a0
Tian, X. B., Chen, Y., Tseng, T., Klemperer, S., Thybo, H., Liu, Z., et al. (2015). Weakly coupled lithospheric extension in southern Tibet. Ear. Plan. Sci. Lett. 430, 171–177. doi:10.1016/j.epsl.2015.08.025
Unsworth, M. J., Jones, A., Wei, W., Marquis, G., Gokarn, S. G., and Spratt, J. E. (2005). Crustal rheology of the Himalaya and Southern Tibet inferred from magnetotelluric data. Nature 438 (7064), 78–81. doi:10.1038/nature04154
Ussher, G., Harvey, C., Johnstone, R., and Anderson, E. (2000). Understanding resistivities observed in geothermal systems, Proceedings world geothermal congress, Kyushu-Tohoku, Japan.
Wang, G., Wei, W., Ye, G., Jin, S., Jing, J., Zhang, L., et al. (2017). 3-D electrical structure across the Yadong-Gulu rift revealed by magnetotelluric data: New insights on the extension of the upper crust and the geometry of the underthrusting Indian lithospheric slab in southern Tibet. Earth Plan. Sci. Let. 474, 172–179. doi:10.1016/j.epsl.2017.06.027
Wang, R., Winberg, F., Zhu, D., Hou, Z. Q., and Yang, Z. M. (2022). The impact of a tear in the subducted Indian plate on the Miocene geology of the Himalayan-Tibetan orogen. GSA Bull. 134 (3-4), 681–690. doi:10.1130/b36023.1
Wang, S., Chevalier, M., Pan, J., Bai, M., Li, K., Li, H., et al. (2020). Quantification of the late Quaternary throw rates along the Yadong rift, southern Tibet. Tectonophysics 790, 228545. doi:10.1016/j.tecto.2020.228545
Wang, S., Lu, C., Nan, D., Hu, X., and Shao, J. (2017). Geothermal resources in Tibet of China: Current status and prospective development. Environ. earth Sci. 76, 239. doi:10.1007/s12665-017-6464-5
Wang, Y., and Guo, Q. (2010). The yangbajing geothermal field and the Yangyi geothermal field: Two representative fields in Tibet, China. Bali, Indonesia: Proceedings World Geothermal Congress, 25–29.
Wang, Y., Li, L., Wen, H., and Hao, Y. (2022). Geochemical evidence for the nonexistence of supercritical geothermal fluids at the Yangbajing geothermal field, southern Tibet. J. Hydrology 604, 127243. doi:10.1016/j.jhydrol.2021.127243
Wannamaker, P. E., Rose, P. E., Doerner, W. M., Berard, B. C., McCulloch, J., and Nurse, K. (2004). “Magnetotelluric surveying and monitoring at the coso geothermal area, California, in support of the enhanced geothermal systems concept: Survey parameters and initial results,” in proceedings, 29th workshop on geothermal reservoir Engineering (United States: Stanford University).
Wright, P., Ward, S., Ross, H., and West, R. C. (1985). State of the art geophysical exploration for geothermal resources. Geophysics 50, 2666–2696. doi:10.1190/1.1441889
Wu, C. L., Tian, X. B., Xu, T., Liang, X., Chen, Y., Taylor, M., et al. (2019). Deformation of crust and upper mantle in central Tibet caused by the northward subduction and slab tearing of the Indian lithosphere: New evidence based on shear wave splitting measurements. Earth Plan. Sci. Let. 514, 75–83. doi:10.1016/j.epsl.2019.02.037
Wu, Z., Ye, P., Barosh, P., and Wu, Z. (2011). The October 6, 2008 Mw 6.3 magnitude Damxung earthquake, Yadong-Gulu rift, Tibet, and implications for present-day crustal deformation within Tibet. J. Asian earth Sci. 40, 943–957. doi:10.1016/j.jseaes.2010.05.003
Wu, Z., Zhao, X., Wu, Z., et al. (2006). Quaternary geology and faulting in the Damxung-Yangbajain basin, southern Tibet. Jour. Geome. 12 (3), 3005–3315.
Yang, X. (2011). Origin of high electrical conductivity in the lower continental crust: A review. Surv. Geophys 32, 875–903. doi:10.1007/s10712-011-9145-z
Yin, A., and Harrison, T. (2000). Geologic evolution of the Himalayan-Tibetan orogen. Ann. Rev. Ear. Plan. Sci. 28, 211–280. doi:10.1146/annurev.earth.28.1.211
Yu, X., Wei, Z., Wang, G., Ma, X., Zhang, T., Yang, H., et al. (2022). Hot spring gas geochemical characteristics and geological implications of the northern Yadong-Gulu Rift in the Tibetan Plateau. Front. Earth Sci. 10, 863559. doi:10.3389/feart.2022.863559
Zhang, J., Quay, P. D., and Wilbur, D. O. (1995). Carbon isotope fractionation during gas-water exchange and dissolution of CO2. Geochim. Cosmochim. Acta 59, 107–114. doi:10.1016/0016-7037(95)91550-d
Zhang, M., Lin, W., Liu, Z., Liu, Z., Hu, X., and Wang, G. (2014). Hydrogeochemical characteristics and genetic model of Gulu high-temperature geothermal system in Tibet. Jour. Chengdu Univ. Tech. (Sci. Tech. Ed. 41 (3), 382–392. doi:10.3969/j.issn.16719727.2014.03.15
Zhang, M., Zhang, Li., Zhao, W., Guo, Z., Xu, S., Sano, Y., et al. (2021). Metamorphic CO2 emissions from the southern Yadong-Gulu rift, Tibetan Plateau: Insights into deep carbon cycle in the India-Asia continental collision zone. Chem. Geo. 584, 120534. doi:10.1016/j.chemgeo.2021.120534
Zhao, J., Yuan, X., Liu, H., Kumar, P., Pei, S., Kind, R., et al. (2010). The boundary between the Indian and Asian tectonic plates below Tibet. Natl. Acad. Sci. 107 (25), 11229–11233. doi:10.1073/pnas.1001921107
Zhao, P., Xie, E., and Duoji, X. (2002). Geochemical characteristics and geological significance of geothermal gases in Tibet. Acta petro. Sin. 18 (4), 539–550.
Keywords: magnetotelluric, audio magnetotelluric, Gulu geothermal filed, geothermal system model, electrical structure
Citation: Wan H and Wang Q (2023) Electrical structure of Gulu geothermal field in Southern Tibet and its implication for the high-temperature geothermal system. Front. Earth Sci. 11:1138360. doi: 10.3389/feart.2023.1138360
Received: 05 January 2023; Accepted: 06 February 2023;
Published: 22 February 2023.
Edited by:
Qiuming Pei, Southwest Jiaotong University, ChinaReviewed by:
Gang Zhang, Southwest University of Science and Technology, ChinaCopyright © 2023 Wan and Wang. This is an open-access article distributed under the terms of the Creative Commons Attribution License (CC BY). The use, distribution or reproduction in other forums is permitted, provided the original author(s) and the copyright owner(s) are credited and that the original publication in this journal is cited, in accordance with accepted academic practice. No use, distribution or reproduction is permitted which does not comply with these terms.
*Correspondence: Qiao Wang, NTQwMzYzMTc2QHFxLmNvbQ==
Disclaimer: All claims expressed in this article are solely those of the authors and do not necessarily represent those of their affiliated organizations, or those of the publisher, the editors and the reviewers. Any product that may be evaluated in this article or claim that may be made by its manufacturer is not guaranteed or endorsed by the publisher.
Research integrity at Frontiers
Learn more about the work of our research integrity team to safeguard the quality of each article we publish.