 Tinghui Wan
 Zhanzhao Li
 Yanjiang Yu1,2
- 1Guangzhou Marine Geological Survey, Guangzhou, China
- 2Southern Marine Science and Engineering Guangdong Laboratory (Guangzhou), Guangzhou, China
In 2020, China successfully conducted the second round of natural gas hydrate pilot production with horizontal wells at W11-W17 deposits in the Shenhu sea area of South China Sea, but the average daily gas production is far from reaching the commercial exploitation. Low productivity has become one of the key factors hindering the commercial exploitation of gas hydrate reservoir. This work taking SHSC-4 well as an example, uses numerical simulation method to analyze the impact of the placement of horizontal well section, length and the production system on productivity of horizontal well in depressurization exploitation. From the analysis of simulation results, it can be seen that the best performance of production capacity can be achieved when horizontal section placed in layer II, which is compared with that placed in layer I and III. More importantly, hydrate in layer I and free gas in layer III can be effectively utilized to improve productivity when layer II is exploited. When the horizontal section is arranged in layer II and produced by depressurization with small pressure difference (1 MPa), the longer the horizontal section length is, the better the productivity will be. However, the average cumulative gas production increment per meter is gradually decreasing. According to the simulation results, 300 m is a reasonable horizontal section length for the exploitation of layer II, and the cumulative gas production reaches 2.55 million cubic meters after 60 days of continuous exploitation. In addition, due to the limitations of convective heat transfer in the low-permeability reservoir in the Shenhu sea area, sensible heat can significantly improve the secondary hydrate generated in the wellbore and the reservoir around the wellbore due to throttling expansion effect, which has a good effect on productivity improvement. Compared with the situation without heating, when the horizontal section is arranged in layer II and the length is 300 m, the production mode of depressurization and combined heating is adopted, and the cumulative gas production of 60 days with different pressure difference (1–5 MPa) is 0.14, 5.55, 14.75, 23.72, and 29.5 times higher than that without heating.
Introduction
Natural gas hydrates (NGH) are a white, cage-shape, crystalline compound composed of water and gas mainly methane molecules, Natural gas hydrates have been widely occur in the permafrost and deep oceanic bottom sediments at high pressure and low temperature, At present, the estimated range of total carbon content in natural gas hydrate in the world is 1015–1018 m3, which is far higher than the current total carbon content of the world’s traditional minerals oil, coal and natural gas (Milkov, 2004; Sloan and Koh, 2008). The exploitation methods of natural gas hydrate reservoirs mainly include depressurization (Yuan et al., 2017a; Wang et al., 2018a; Yu et al., 2019a), thermal stimulation (Chong et al., 2016; Phirani et al., 2009) inhibitor injection (Lee, 2010; Daraboina et al., 2015), gas exchange (Chen et al., 2016; Xu et al., 2018; Tupsakhare and Castaldi, 2019) and some combined exploitation methods, such as depressurization combined with thermal (Feng et al., 2015; Feng et al., 2016; Yu et al., 2019b). The results of physical experiments, numerical simulation, and field tests carried out by predecessors have confirmed that the depressurization method is superior and economical to other recovery methods, and can be realized through conventional oil and gas recovery technologies (Wang et al., 2018b; Yuan et al., 2019).
The natural gas hydrate reservoir in the Shenhu area is located in the Zhu Ⅱ Depression between the Dongsha Islands and the Xisha Trough, the depression is in the stage of tectonic subsidence, with a high deposition rate and rich organic matter, creating favorable conditions for the formation of hydrates (Wu et al., 2010). Since 2003, the Guangzhou Marine Geological Survey Bureau of China Geological Survey has carried out a detailed investigation of hydrate resources in the region using various survey methods such as geology, geophysics, and drilling, and obtained physical samples of natural gas hydrate for the first time in 2007, which is a breakthrough in hydrate exploration. In 2015 and 2016, China Geological Survey carried out GMGS3 and GMGS4 voyages of natural gas hydrate drilling surveys in the South China Sea, respectively (Figure 1A), and a total of eight natural gas hydrate deposits were discovered (Yang et al., 2017). It is estimated that the controlled natural gas resource exceed 1 × 10¹² m3, showing the huge resource potential of natural gas hydrate. Among them, the W11-W17 deposits (Figure 1B), was selected as the best target for trial production.
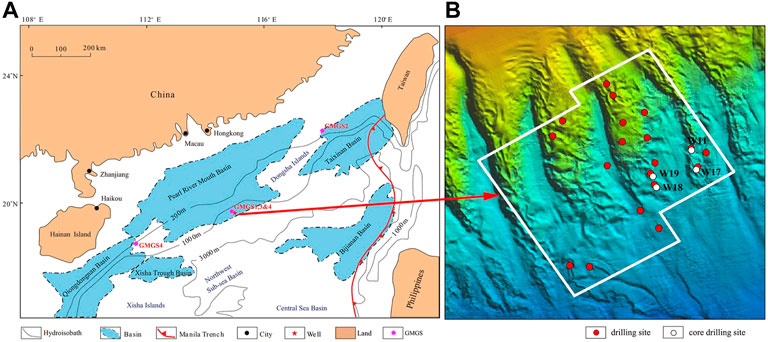
FIGURE 1. SHSC-4 Well location (A). GMGS3 Subsea topography and drilling locations (B) (Sun Y. et al., 2019).
In 2017, the China Geological Survey successfully organized and implemented China’s first marine gas hydrate trial production project near the W17 drilling site. Since the test gas ignition, the cumulative gas production of the SHSC-4 production test well-exceeded 30 × 104 m3 within 60 days, which is a historic breakthrough in the exploration and development of natural gas hydrates in China (Li et al., 2018). The results of the first round of hydrate trial production successfully implemented by China in Shenhu Sea Area in 2017 show that the production capacity of vertical well depressurization production is far from reaching the average daily gas production of commercial production of 2.8 × 10⁵ ST m3/d (Li et al., 2018), the productivity of gas hydrate production by depressurization of vertical wells is limited by the contact area between the wellbore and the gas hydrate reservoir.
In 2020, China successfully implemented the second round of hydrate pilot production in the Shenhu sea area by using horizontal well technology for the first time, with an average daily gas production of 2.87 × 10⁴ ST m3/d, which not only proves the feasibility of using horizontal wells to depressurize hydrate production but also proves the superiority of horizontal wells in improving natural gas recovery (Ye et al., 2020). However, the second round of hydrate trial production capacity also failed to reach the level of commercial exploitation, which inspires researchers to focus on how to use horizontal wells to exploit natural gas hydrates efficiently and safely. Study areas include analysis of the effect of reservoir reconstruction for gas production enhancement, various natural gas production strategies, production well designs and combined production methods.
After the second round of hydrate pilot production in the Shenhu sea area of the South China Sea, many researchers carried out a lot of research work on how to use horizontal wells to exploit natural gas hydrate reservoirs efficiently and safely in the sea area. For example, Yuan et al. (2020) used a new type of thermal water mechanical (THM) coupling simulator HydrateBiot to optimized the controllable parameters for depressurization-induced gas production using horizontal well in the Shenhu sea area of the South China Sea. Including well placement and perforation length, and the mechanical response caused by gas production in hydrate reservoirs. The results show that the well design of horizontal wells has a significant impact on hydrate production efficiency. The balance between mechanical stability and natural gas productivity must be considered when using a horizontal well to depressurize. Yu et al. (2021a) built a multi-layer hydrate reservoir model for the hydrate reservoir in the Shenhu sea area of the South China Sea and replicated short-term test results based on the field data obtained for the first time. The long-term natural gas hydrate production behavior of single horizontal well and double horizontal well systems in the field was studied, and the thermal stimulation production strategy is proposed to test the influence of hot water injection parameters on improving natural gas recovery. It is suggested that reservoir reconstruction should be carried out in advance to improve reservoir permeability before actual long-term natural gas production. Ma et al. (2021) conducted a feasibility study on the application of hydraulic fracturing and horizontal wells for the hydrate reservoirs in the Shenhu sea area of the South China Sea and studied the impact of the placement of horizontal wells and the length of horizontal fractures on gas production. Yu et al. (2021b) considered the key parameters of production well design (well length, well placement, and depressurization scheme) to build a three-dimensional hydrate reservoir model and analyzed the design of favorable horizontal well production system for gas hydrate production by depressurization. To obtain the global optimal solution, the BBD-RSM (Box Behnken Design with Response Surface Methodology) method is introduced to derive the optimal production system with the agent model. The results show that the well design of horizontal wells will significantly affect gas production. The above research results have made great contributions to the application of horizontal well production systems in the exploitation of natural gas hydrate, and which is very helpful for understand and predict the short-term and long-term production behavior of natural gas hydrate when using horizontal well production systems. It is a huge challenge for the industry to carry out field testing of natural gas hydrate, which requires huge capital investment. It is very necessary to make a comprehensive planning for the production system before field testing.
This work is based on the geological and logging data of the SHSC-4 well for the first gas hydrate pilot production in the Shenhu sea area of South China Sea, and uses TOUGH+HYDRATE simulation software to establish the multilayered hydrate reservoir model and replicate short-term test results based on the field data obtained at this site for the first time. The difference from previous research work is the optimization of the design strategy of the horizontal well production system. In addition, in this work, the impact of perforation and secondary hydrate on horizontal well production system has been comprehensively considered. By using the numerical simulation method, the layout placement of the horizontal section of the horizontal well is optimized at first, followed by the layout length of the horizontal section of the horizontal well. Finally, the depressurization production system of the horizontal well is analyzed and optimized. The results can not only bring new insights to the next stage of horizontal well efficient exploitation of hydrate reservoirs in this sea area, but also provide a useful reference for similar hydrate reservoir development in other sea areas.
Methods
Site description
The seawater depth of Well SHSC-4 is 1,266 m, and the hydrate reservoir belongs to the clayey-silt type. According to the classification method of hydrate reservoirs proposed by Moridis et al. (2007a), the natural gas hydrate system of Well SHSC-4 can be roughly divided into three layers (Li et al., 2018; Ma et al., 2020): 1) Hydrate I layer (201–236 mbsf, the pores are saturated with solid hydrate and liquid water); 2) Hydrate II layer (236–251 mbsf, the pores are saturated with solid hydrate, free gas and liquid water); 3) Hydrate III layer (251–278 mbsf, the pores are saturated with free gas and liquid water). The average permeability of the hydrate layers I, II, and III are 2.9 × 10⁻³, 1.5 ×10⁻³, and 7.4 × 10⁻³ μm2, respectively. The porosity is 0.35, 0.33, and 0.3, respectively. The above physical conditions are the data basis of this simulation.
Model mesh and discretization
TOUGH+HYDRATE 1.0 is a natural gas hydrate numerical simulation software developed by Lawrence Berkeley State Key Laboratory of the United States (Moridis et al., 2008). The software considers the four phases of gas, water, ice, and hydrate, and the four components of water, gas, hydrate, and inhibitor, which can describe the decomposition mechanism of hydrate depressurization, heating, and injection of inhibitor. In this work, the layered geological model of hydrate reservoir is established on the basis of the log data of SHSC-4 production test well in Shenhu sea area in 2017 of China Geological Survey (Li et al., 2018), as shown in Figure 2.
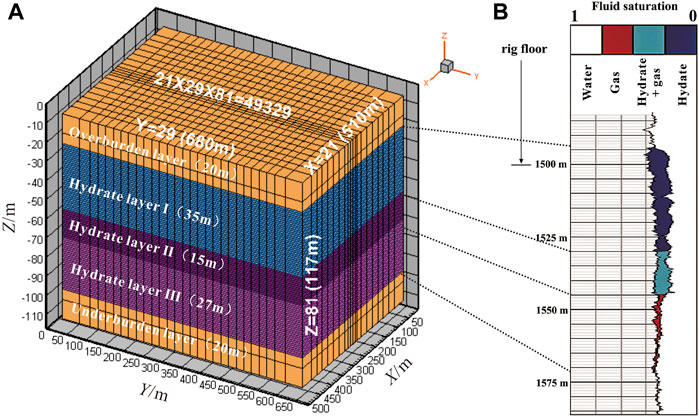
FIGURE 2. Model mesh (A). Logging curve of well SHSC-4 (B) (Li et al., 2018).
The natural gas hydrate reservoir in Well SHSC-4 compose of hydrate I, hydrate II, and hydrate III layers, with the thicknesses are 35, 15, and 27 m, respectively. Figure 2 depicts a schematic diagram of the grid division of the gas hydrate reservoir model in Well SHSC-4. The simulation area is 510 m × 680 m × 117 m, and the entire simulation area is discretized into 49,329 grids (21 grids in the X direction, 29 grids in the Y direction, and 81 grids in the Z direction). It can be seen from the figure that the grid division is not a uniform form, but the grid near the horizontal well is refined. Near the horizontal well, the grid sizes used in the model are Δx = 5.0 m, Δy = 20.0 m, Δz = 1.0 m. In the process of natural gas exploitation, hydrate decomposition mainly occurs in the area near the horizontal well, and local grid densification is conducive to observing the changes of reservoir physical properties near the horizontal well.
Initial and boundary conditions
According to the logging curve of the production test well SHSC-4, the geological data of each layer (0.5 m per layer), such as porosity, hydrate saturation, gas saturation, and water saturation, are extracted to establish the numerical model. The porosity of both the overburden layer and the underburden layer is set to 30%. The average permeability of Hydrate I, Hydrate II, and Hydrate III layers are set to 2.9 × 10⁻³, 1.5 × 10⁻³, and 7.4 × 10⁻³ μm2, respectively (Li et al., 2018). In this work, the effect of permeability anisotropy on hydrate production was not considered (Moridis et al., 2011; Sun J et al., 2019; Sun Y et al., 2019). Therefore, the permeability of the hydrate reservoir, overburden layer, and underburden layer in the X, Y, and Z directions are set to be equal. Since the overburden layer is permeable, the pore water in the gas hydrate reservoir can be exchanged with seawater, which means that the pore water pressure is the hydrostatic pressure (Sun J et al., 2017). The pressure of natural gas hydrate reservoir can be calculated and simulated by Formula 1 (Yuan et al., 2017b):
In the above formula, Ppw and Patm are the pore water pressure and standard atmospheric pressure, in MPa, ρ is the seawater density, in kg/m3, g is the acceleration of gravity, in m/s2, and H is the distance to sea level, in m. Additionally, temperatures and pressures at the top and bottom of the model can be calculated based on the static pressure equation and geothermal gradients. The temperature and pressure of the entire simulated gas hydrate reservoir can be obtained through the self-balancing function of the software (Sun J et al., 2015). During the numerical simulation, the temperature and pressure of the upper and lower boundaries are set to constant values (Feng et al., 2019). The reservoir properties and model parameters of natural gas hydrate reservoirs are shown in Table 1.
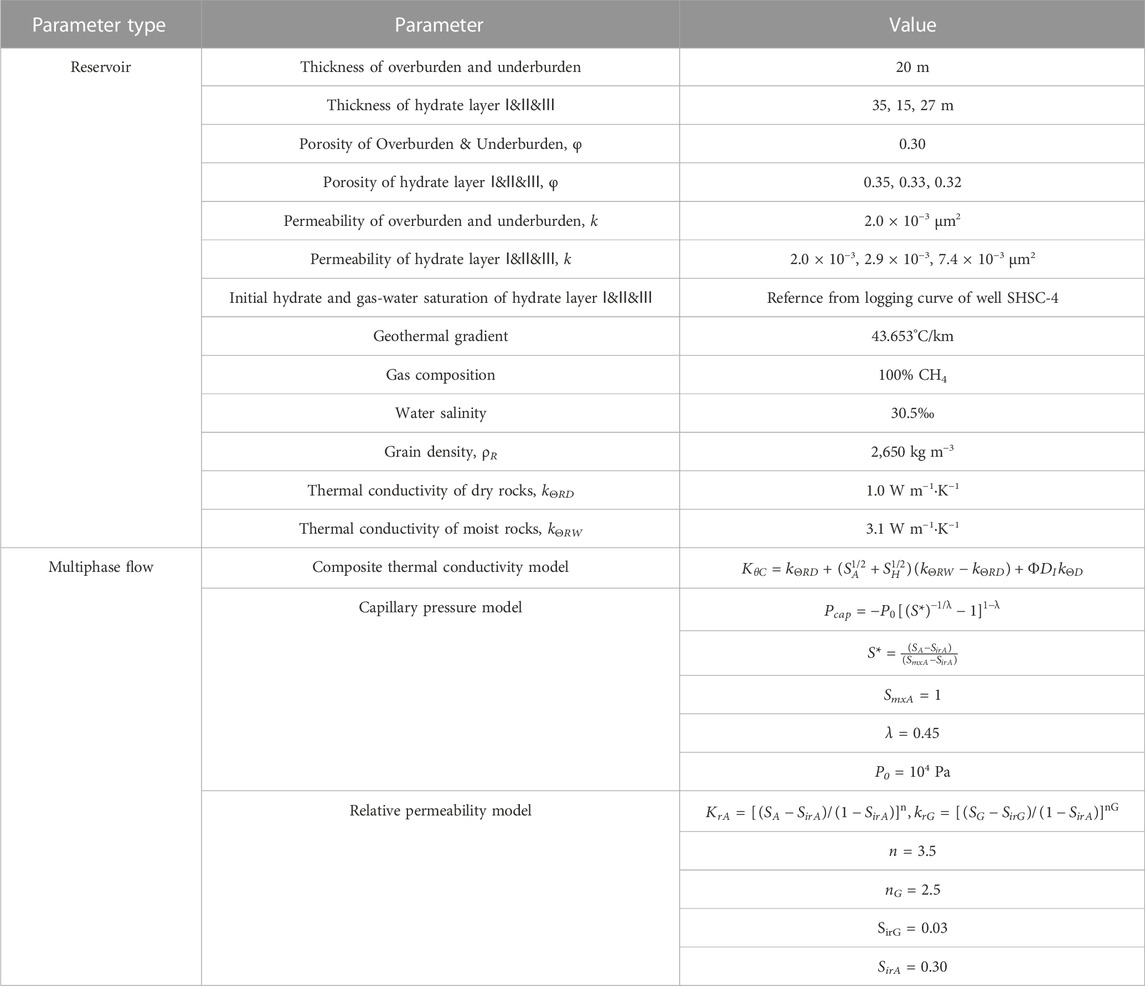
TABLE 1. Simulation calculation parameters and reservoir characteristic parameters.
According to the Navier-Stokes equation theory of fluid mechanics, the wellbore is regarded as a “pseudo-porous medium” in the numerical model, and the fluid inside the wellbore conforms with Darcy flow (Moridis et al., 2007b). Earlier studies have confirmed the correctness of this approximation (Moridis and Reagan, 2007a; Moridis et al., 2007b; Moridis and Reagan, 2007b; Cathles, 2007; Li G et al., 2010b; Su et al., 2010). This “pseudo-porous medium” has a porosity of 1, a permeability of 1 × 104 μm2, a capillary force of 0, a relative permeability that is a linear function of the saturation of each phase, and very low residual gas saturation (Moridis et al., 2007b).
Simulating the field test result
In the numerical simulation of hydrate productivity, gas production is one of the key parameters to verify the accuracy of the simulation results. In 2017, the test production of natural gas hydrate in the Shenhu sea area in 2017 is shown in Table 2 (Cui and Xiao, 2022).
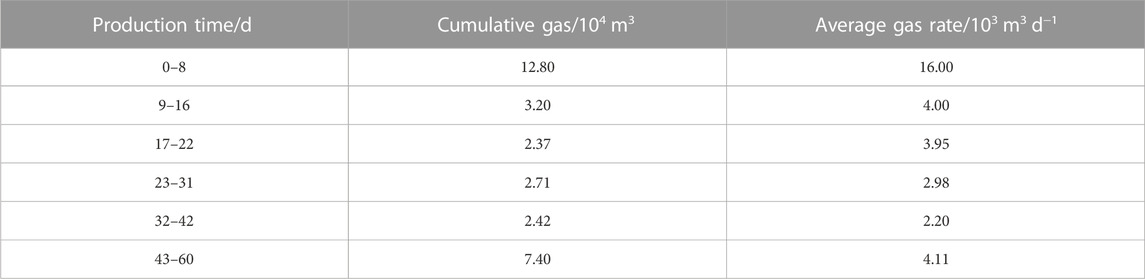
TABLE 2. Gas production of Shenhu area hydrate reservoir in 2017.
A vertical well is set in the center of the geological model, the perforation interval is −201 to −271 mbsf (corresponding to the model −21 to −91 mbsf), the corresponding length is 70 m, and the production pressure difference is set to 3 MPa (Qin et al., 2020), the placement of the vertical well in the model is shown in Figure 3.
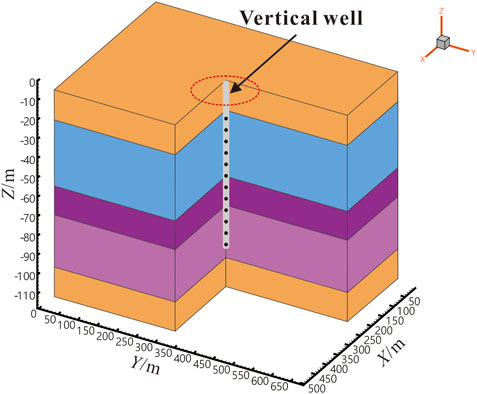
FIGURE 3. Schematic diagram of vertical well position in the model.
Figure 4 shows the historical matching results of gas production during the trial production of the hydrate reservoir in the Shenhu sea area. It can be seen that the cumulative gas production in the simulated 60d period is 29.3 × 10⁴ m3, and the fitted gas production rate, cumulative gas production, and trial production data are in good agreement. Therefore, the ideal hydrate layered geological model can be used as the basic model for the numerical simulation research of horizontal well depressurization production.
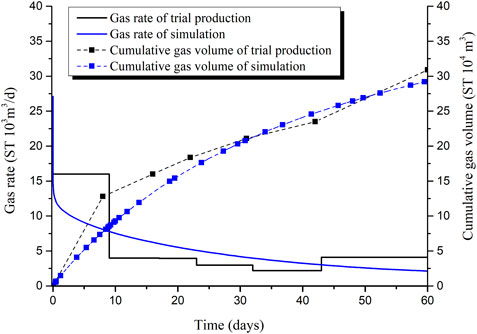
FIGURE 4. Fitting curves of gas production of Shenhu area hydrate reservoir.
Horizontal well section placement optimized
As mentioned above, the hydrate reservoir at this site can be subdivided into three layers: including hydrate layer I (201–236 mbsf), layer II (236–251 mbsf), and layer III (251–278 mbsf). In order to study the optimal horizons for horizontal well section placement, a total of three simulation schemes were set up, the horizontal well sections are respectively arranged in the middle of the hydrate layer I, the middle of the hydrate layer II, and the middle of the hydrate layer III.
Case design
To compare the productivity of different layers, the length of the horizontal well section is 100 m, and perforation is considered. Perforation is carried out at intervals of 20 m. The perforation length of each section is 20 m, and the total length of horizontal well perforation section is 60 m. The production pressure difference is set to 3 MPa, and the production is continuously simulated for 60d. Other simulation conditions are the same among those three cases. The best completion layer can be selected according to the productivity of each scheme, see Table 3 for details.
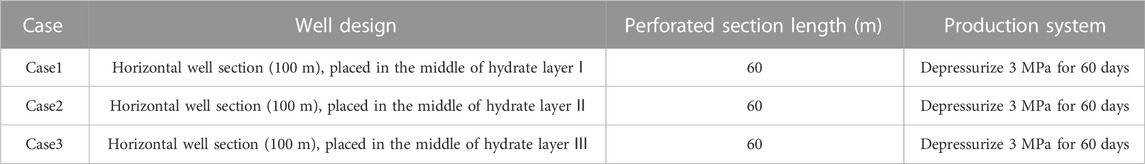
TABLE 3. Optimized the placement of horizontal well section.
Results and discussions
Gas and water production behaviors
The horizontal well sections are arranged in the middle of the hydrate layers I, II, and III, respectively. Figures 5A, B shows the gas production and water production after the depressurization of 3 MPa for 60 days. It can be seen from the figure that both the gas production rate QG and the cumulative gas production VG (about 84 × 104 m3) are the highest when the horizontal well section is arranged in the middle of layer II; When the horizontal well section is arranged in the middle of layer II, the initial gas production rate QG decreases slowly (within 5 days of production), it decreases sharply in the later stage. The main reason for this phenomenon is that the throttling and expansion effect of gas reduces the temperature of the wellbore and the temperature of the reservoir around the wellbore, and the root tip and finger tip of the horizontal well section of the wellbore generate high saturation hydrate, which is up to 85%, as shown in Figure 5D. In addition, a small amount of secondary hydrate is also generates in the reservoir around the well, as shown in Figure 6C. All of these make the wellbore flow and the seepage of the reservoir around the well worse, so the gas production rate QG decreases sharply in the later stage; But even if the gas production rate QG decreases sharply in the later stage, the recoverability is still optimal when the horizontal well section is arranged in the middle of layer II. When the horizontal well section is arranged in the middle of the hydrate layer I, both the gas production rate QG and the cumulative gas production VG (about 0.19 × 10⁴ m3) are both the lowest, with worst recoverability. This is mainly because the existence of solid hydrate makes the effective permeability of the hydrate reservoir very low, resulting in a poor effect of depressurization. When the horizontal well section is arranged in the middle of the hydrate layer III, the gas production rate QG shows a slow upward trend, the main reason is that the temperature of the hydrate layer III is relatively high and the latent heat of the formation is relatively large. Within 60 days of the simulated production, no secondary hydrate was formed around the wellbore and near the wellbore, as shown in Figures 5, 6. However, due to its low original gas saturation, the gas production rate is still different from that when the horizontal well section is arranged in the middle of the hydrate layer II, and the final cumulative gas production is VG (about 37 × 104 m3).
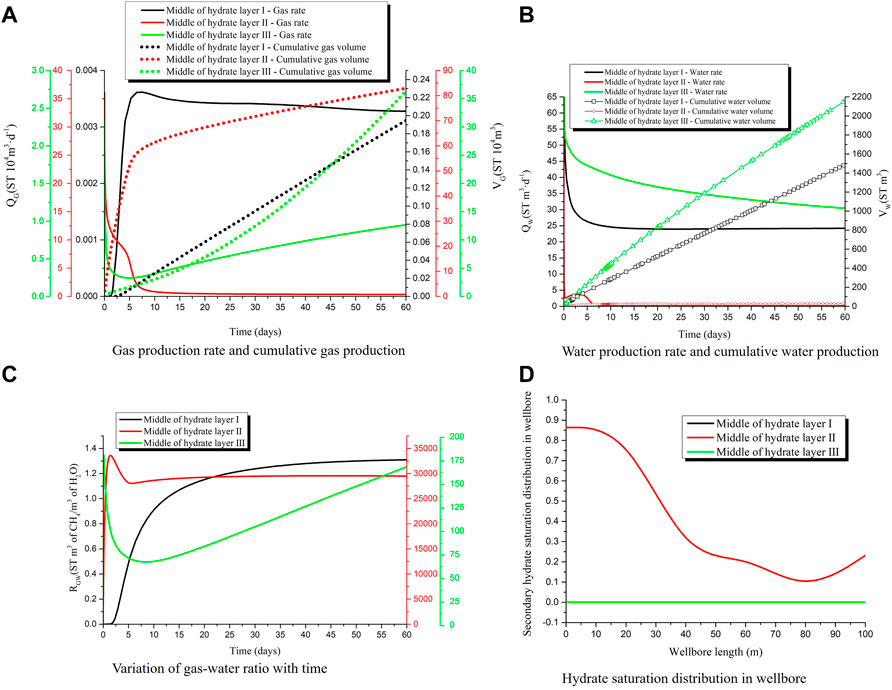
FIGURE 5. Gas production rate and cumulative gas production (A), Water production rate and cumulative water production (B), variation of gas-water ratio with time (C), and hydrate saturation distribution in wellbore (D) after 60 days of depressurization production with different layers.
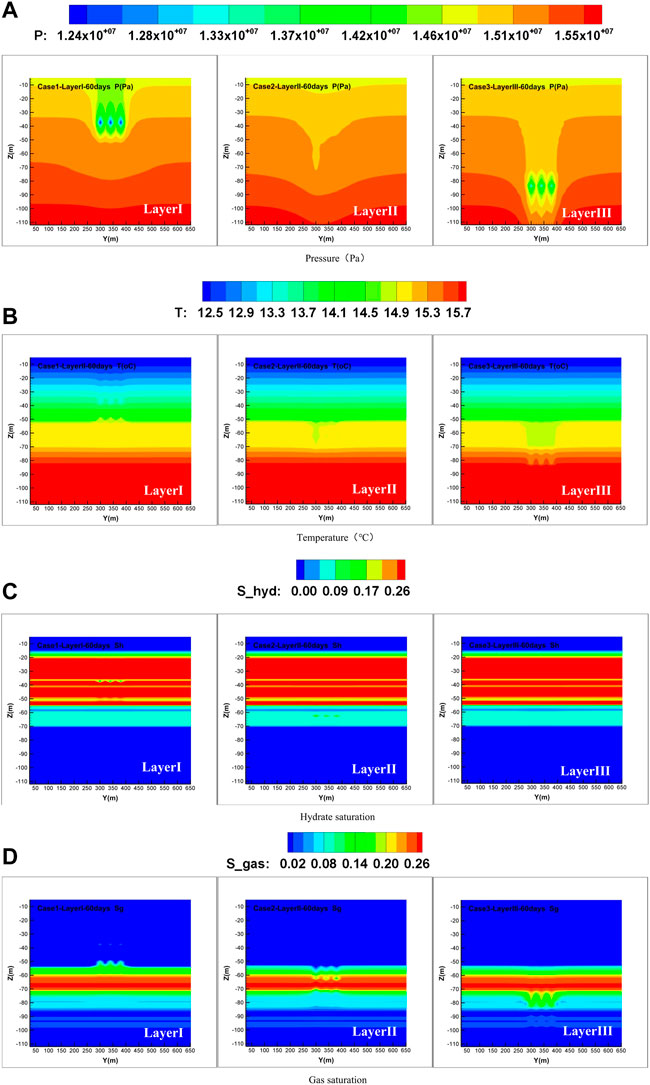
FIGURE 6. Spatial distribution of pressure (A), temperature (B), hydrate saturation (C), and gas saturation (D) after 60 days of depressurization production with different layers.
Corresponding to the gas production, the initial water production rate QW increased slowly when the horizontal well section was laid in the middle of layer II (within 5 days of production). Due to the formation of high-saturation hydrate in the root tip wellbore of the horizontal well section, the overall permeability of the wellbore decreased. Therefore, the water production rate QW decreases sharply in the later stage, and the water production is not very large, and most of the water in the hydrate layer II is irreducible water. The accumulated water production VW of the horizontal section is about 1,500 and 2,200 m3, respectively when the horizontal section is arranged in the middle of the hydrate layer I and III, and the reason for the high accumulated water production is that the original water saturation of the hydrate layer I and III is high, which are 66% and 93% respectively, and the decomposed water of the hydrate layer I is also extracted.
The gas-water ratio RGW is an important indicator to measure the recovery performance of hydrate reservoirs R = VG/VW). A larger gas-to-water ratio meant that the proportion of produced gas in the total output was larger, which proved that the extraction performance of the reservoir was better and the economic efficiency was higher. The horizontal well sections are arranged in the middle of the hydrate layers I, II, and III respectively. It can be seen from Figure 5C that when the horizontal well section is arranged in the middle of the hydrate layer II, the reservoir recovery performance is the best, and the gas-water ratio can reach about 33,000; when the horizontal well section is arranged in the middle of the hydrate layer III, the gas-water ratio is about 170. The mining effect is the second level; when the horizontal well section is arranged in the middle of the hydrate layer I, the gas-water ratio is only about 1.3, and the exploitation efficiency is the worst.
The horizontal well sections are respectively arranged in the middle of hydrate layers I, II, and III after depressurization of 3 MPa for 60 days, the distribution of hydrate saturation inside the wellbore along the length of the horizontal well section is shown in Figure 5D. When the horizontal well section is arranged in the middle of the hydrate layers I and III, no secondary hydrate is generates inside the wellbore. When it is arranged in the middle of the I layer, the water decomposed by the hydrate has a certain inhibitory effect on the throttling and expansion effect of the gas, and the gas production rate and the cumulative gas production of the I layer are very small (about 0.19 × 10⁴ m3). The throttling and expansion effect of the gas is smaller, however, the temperature of the hydrate layer III is high, the latent heat of the formation is large, and the throttling and expansion effect of the gas is not enough to generate secondary hydrate in the wellbore. When the horizontal well section is arranged in the hydrate layer II, due to the large production pressure difference (3 MPa), the gas throttling expansion effect reduces the wellbore temperature and the temperature of the reservoir around the well, as shown in Figure 5D. High-saturation hydrates are generated at the root tip and finger tip of the horizontal well section of the wellbore, especially the secondary hydrate saturation at the root tip of the wellbore is as high as 85%. The main reasons for the concentration of secondary hydrates at the root tip and finger tip of the horizontal well section are as follows: the seepage flow rate of horizontal wells is generally characterized by high at both ends and low in the middle (if the pressure loss in the wellbore is not large, its flow along the length of the horizontal well section is low. The distribution is symmetrical about the midpoint of the horizontal well section, while the length of the simulated horizontal well section is only 100 m, and the pressure loss is small). As shown in Figure 6C, due to the throttling expansion effect, the temperature of the wellbore and wellbore reservoir decreased, and the secondary hydrate tends to form in the low temperature and surrounding reservoir area. The above phenomenon is consistent with the previous research results (Wang Z et al., 2022; Yang L et al., 2023). Moreover, the throttling expansion effect of root tip and finger tip gas with large seepage flow is more obvious, and secondary hydrate is easier to form.
Physical characteristics in the reservoirs
The horizontal well sections are arranged in the middle of the hydrate layers I, II, and III, respectively, and the distribution of parameters such as temperature and pressure of the hydrate reservoir after 60 days of depressurization exploitation with the pressure difference of 3 MPa is shown in Figure 6. Due to the existence of solid hydrate in layer I, its effective permeability is very low, so the pressure conduction range of layer I is the smallest after 60 days of exploitation, and the corresponding low-temperature area and hydrate decomposition area are very small, and its gas production is the smallest (0.19 × 10⁴ m3).
Layer III has the largest effective permeability (7.4 × 10⁻³ μm2) with no solid hydrate, and the depressurization range of the layer III is the largest after 60 days of exploitation. However, the hydrates in layer I and layer II have not been effectively produced, and their gas saturation is low (7.8%), resulting in suboptimal gas production and high water production, resulting in poor recovery. The horizontal well section is arranged in layer II. Although the depressurization range is not the largest after 60 days of production, this method can not only exploit the gas in layer II, but also produce hydrate in layer I and gas in layer III, and layer II is saturated with water. However, after 60 days of exploitation, obvious secondary hydrate formation can be observed, which restricts its long-term exploitation effect.
The horizontal well section is arranged in the middle of the hydrate layers I, II, and III, and the cumulative gas production for 60 days is 0.19 × 10⁴, 84 × 104, 37 × 104 m3, and the cumulative water production is 0.15 × 10³, 0.025 × 10³, 2.2 × 10³ m3, respectively. The gas-water ratios are 1.3, 33,000, and 170, respectively. It is more advantageous to set up the horizontal well section in layer II through comprehensive analysis, and layer II is adjacent to layer I and layer III. When layer II is exploited, the hydrate in layer I and free gas in layer III can be effectively utilized to improve productivity. When the horizontal well section is arranged in the hydrate layer II, due to the large production pressure difference (3 MPa), the throttling and expansion effect of the gas reduces the wellbore temperature and the temperature of the reservoir around the wellbore, and high saturation hydrate is generated at the root tip and finger tip of the horizontal section, resulting in a sharp decline in the gas production rate in the later period of the development plan.
Horizontal well section length optimized
In the process of depressurization production by horizontal wells, the length of the horizontal well section is an important indicator, and its length needs to be determined comprehensively in combination with various factors such as engineering technology, mining efficiency, and construction cost, In order to evaluate the capacity performance of different horizontal well section lengths, a total of six simulation schemes are set up.
Case design
Combined with the simulation results in the chapter 2, In order to achieve a better mining effect, the horizontal well section of the simulation schemes are all arranged in the middle of the hydrate layer II, the lengths of the horizontal well section are 100, 140, 180, 220, 260, and 300 m. The perforation is carried out at intervals of 20 m for horizontal well. The perforation length of each section is 20 m, and the total length of horizontal well perforation section are 60, 80, 100, 120, 140, 160 m, respectively.
From the chapter 2, it can be concluded that, during production with a large pressure difference (3 MPa), the secondary hydrate saturation at the root tip of the horizontal wellbore is as high as 85%, and the reservoir around the wellbore also formation secondary hydrates. To avoid the formation of a large number of secondary hydrates in the wellbore and the reservoir around the wellbore, the production pressure difference of the six simulation schemes is set to 1 MPa, and other simulation conditions are the same. By comparing the productivity of each scheme, reasonable length of completion interval is optimized, as detailed in Table 4.
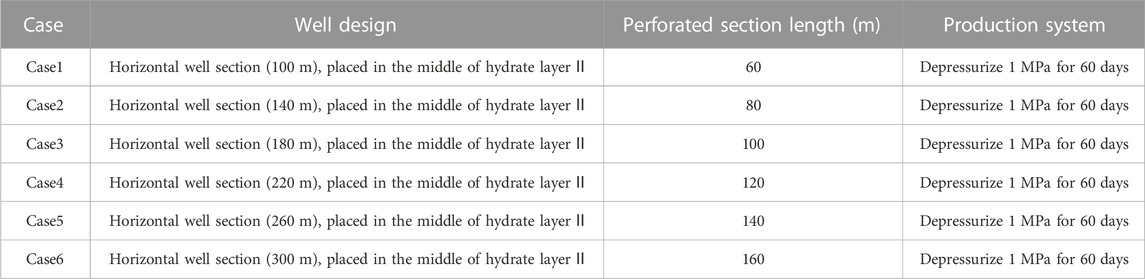
TABLE 4. Optimized the horizontal well section length.
Results and discussions
Gas and water production behaviors
Figures 7A, B shows the gas production and water production rate and cumulative gas production after the horizontal well section length is gradually increased from 100 to 300 m and depressurized by 1 MPa for 60 days. It can be seen from the figure that when the length of the horizontal well section increases from 100 to 300 m, the overall gas production rate QG and the cumulative gas production VG both increased with the increase of the length of the horizontal well section, especially when the length of the horizontal well section is short, the gas production rate QG and the cumulative gas production VG will significantly enhance with the increase of unit length. The main reasons for this phenomenon are as follow: (a) In the case of depressurization production with a small pressure difference (1 MPa), no secondary hydrate with higher saturation is generated inside the wellbore. As shown in Figure 7D, the overall permeability inside the wellbore is relatively high, and the gas that seeps into the wellbore and water can pass through the wellbore relatively smoothly; (b) The longer the length of the horizontal well section, the larger the contact area between the wellbore and the reservoir, and the higher the corresponding gas production rate. When the length of the horizontal well section is 300 m, the gas production rate QG decreases significantly in the late stage of simulated mining (50-60d). The main reason is that with the increase of the length of the horizontal well section, the gas production rate QG increase correspondingly, and the throttling expansion effect of the gas also increase accordingly. Secondary hydrates were formed inside the horizontal wellbore at the root tip, and the saturation reached 65%, as shown in Figure 7D. At the same time, the near-wellbore reservoir, at the root tip and finger tip of the horizontal well section also generate secondary hydrates with a certain degree of saturation, as shown in Figure 8C. Although the generated secondary hydrate will not block the wellbore and reservoir near the wellbore, it still causes a significant decrease in the gas production rate QG in the later stage of the simulation.
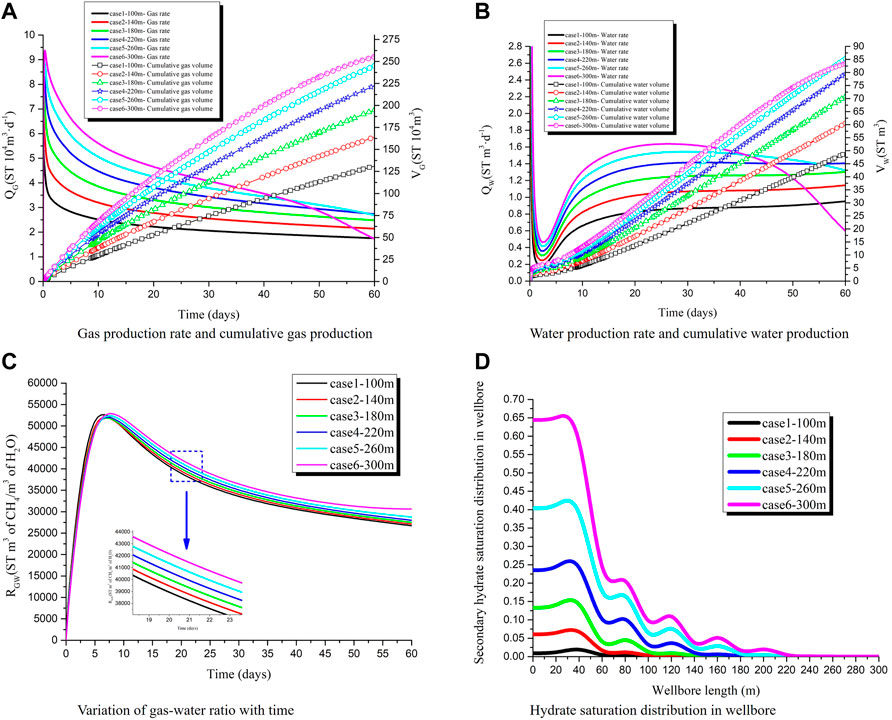
FIGURE 7. Gas production rate and cumulative gas production (A), water production rate and cumulative water production (B), variation of gas-water ratio with time (C), and hydrate saturation distribution in wellbore (D) after 60 days of depressurization production with different horizontal well section lengths.
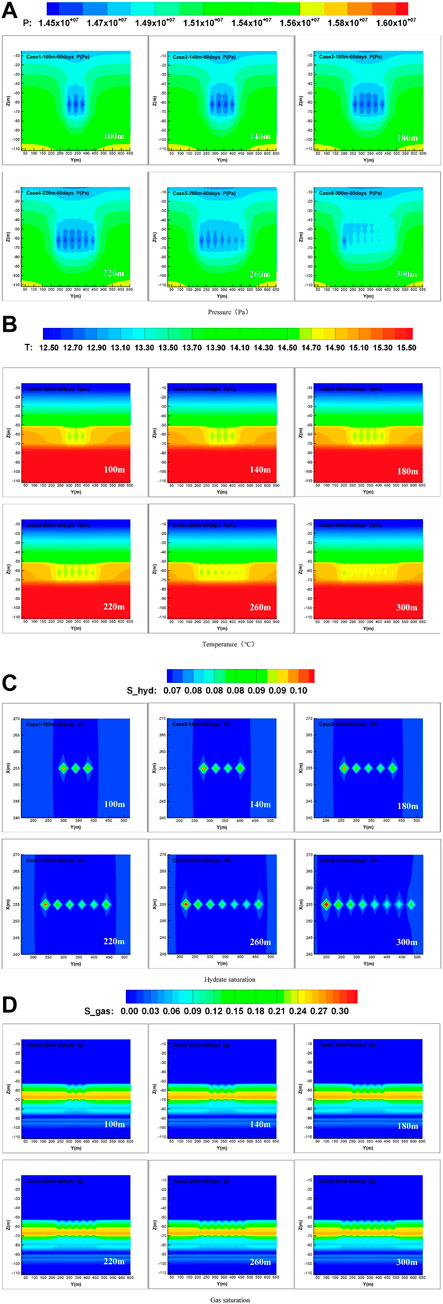
FIGURE 8. Spatial distribution of pressure (A), temperature (B), hydrate saturation (C), and gas saturation (D) after 60 days of depressurization production with different horizontal well section lengths.
When the length of the horizontal well section increases from 100 to 300 m, the water production rate QW and cumulative water production VW in the initial and mid-term (0-40d) simulated mining increase with the increase in the length of the horizontal well section, the increase of water production rate QW and cumulative water production VW brought by the increase of unit length is more obvious, which is consistent with the increase of gas production. In the later stage of simulated production (40-60d), the water production rate decreased significantly due to the formation of secondary hydrates in the wellbore and the reservoirs around the wellbore. Since the viscosity of water is much greater than that of gas, the influence of secondary hydrate on water production rate is obviously greater than that on gas production rate.
The gas-water ratio after the horizontal well section length increases from 100 to 300 m stepwise after depressurization 1 MPa production for 60 days is shown in Figure 7C. When the length of the horizontal well section increases from 100 to 300 m step by step, the difference in gas-water ratio is not large. The overall gas production rate QG decreased slowly, and the overall water production rate QW increased slowly. When the length of the horizontal well section gradually increased from 100 to 300 m, the overall gas-water ratio showed a trend of first increasing and then decreasing. The gas-water ratio of the scheme is maintained above 30,000.
The horizontal well section length is gradually increased from 100 to 300 m after depressurization 1 MPa and production for 60 days, the distribution of hydrate saturation in the wellbore along the length of the horizontal well section is shown in Figure 7D. With the increase of the length of the horizontal well section, the saturation of the secondary hydrate at the root tip of the horizontal well section also increases, and the saturation of the secondary hydrate reaches 65% when the length of the horizontal well section is 300 m. This is mainly because with the increase of the length of the horizontal well section, the gas production rate also increases accordingly, and the throttling expansion effect of the gas also increases. In general, when the production pressure difference is 1 MPa, the secondary hydrate generated in the wellbore will not block the wellbore and seriously affect the rate of gas and water production rate.
Physical characteristics in the reservoir
The distribution characteristics of physical fields such as temperature and pressure of hydrate reservoir after 60d of depressurization of 1 MPa from 100 to 300 m in horizontal section are shown in Figure 8. It can be seen in the figure that when the length of the horizontal well section increases from 100 to 300 m step by step, the depressurization range continues to increase, and the corresponding reservoir production scope also increases, corresponding to the continuous increase of gas and water production. With the increase of the length of the horizontal well section, the gas production and the throttling and expansion effect of the gas also increase, and the secondary hydrate saturation of the reservoir near the wellbore at the root tip and finger tip of the horizontal well section is also gradually increasing. When the length of the horizontal well section is 300 m, the secondary hydrate formed in the root tip of the horizontal well section wellbore and the reservoir near the wellbore at the root tip and finger tip of the horizontal well section limits the conduction of pressure difference in the reservoir to a certain extent. The pressure gradient around the wellbore is significantly reduced, correspondingly, when the length of the horizontal well section is 300 m, the gas production, and water production rates drop significantly, as shown in Figures 7A, B. As shown in Figure 8C, due to the throttling expansion effect, the wellbore and wellbore reservoir temperature are reduced, and the secondary hydrate tends to form in the low temperature and surrounding reservoir area, especially in the well bore at the root tip, and the reservoir around the well at the root tip and finger tip of the wellbore, which is an important factor restricting the increase of the length of the horizontal well section.
The cumulative gas production of different horizontal well section lengths is shown in Table 5. It can be seen from the table that the longer the length of the horizontal well section, the higher the cumulative gas production after 60 days of simulated mining. However, the average cumulative gas production increment per meter decreases gradually, especially when the length of the horizontal well section is increased from 260 to 300 m, the average gas production increment per meter is only 0.25 × 10⁴ m3, compared with the increase from 220 to 260 m, the average gas production increment per meter of 0.575 × 10⁴ m3 is reduced by about half, consistent with the previously analyzed, when the horizontal well section length is 300 m, the formation of secondary hydrates in the reservoirs around the wellbore at the root tip and finger tip of the horizontal well section and inside the wellbore at the root tip of the horizontal well section leads to a decrease in gas and water production rates.
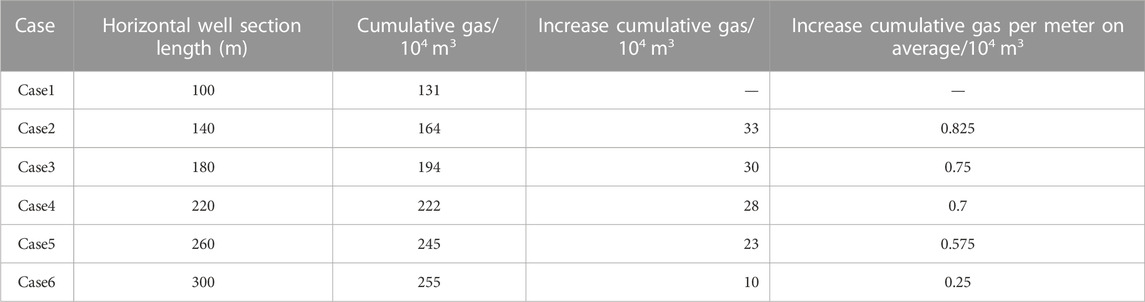
TABLE 5. Analysis of gas production of different horizontal well section lengths.
The length of the horizontal well section should be determined in combination with construction cost, economic benefit, reservoir, and wellbore stability. From the standpoint of productivity alone, when the length of the horizontal well section is 300 m, Its water and gas production rates begin to be significantly affected by the secondary hydrate, which is a reasonable horizontal well section length when mining the hydrate layer II.
Optimization of depressurization mining production system
Combined with the simulation results in the chapter 3, on the basis that the horizontal well section is arranged in the hydrate layer II and the length of the horizontal well section is 300 m, five simulation schemes with different production pressure differences are set up, to optimize the production system with better mining efficiency.
Case design
All of the five simulation schemes considered horizontal well perforation with 20 m perforation interval. The perforation length of each section is 20 m, and the total length of the perforated section of the horizontal well is 160 m, and the pressure reduction method at the root tip of the wellbore is adopted, and the production pressure difference is gradually increased from 1 to 5 MPa. All simulation schemes consider both heating and without-heating conditions, the wellbore heating method is to simulate the cable heating, by comparing the water and gas production after 60 days of pressure reduction with different production pressure difference, the production system is optimized, as shown in Table 6.
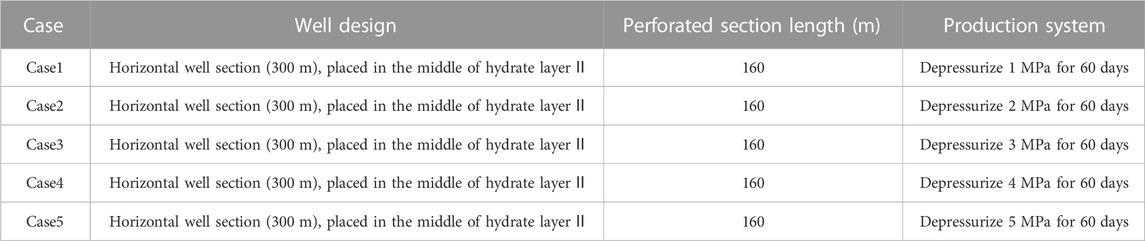
TABLE 6. Optimized the depressurized production system.
At present, the cable heating technology provided by various technical service providers in the industry can achieve a cable heating power range of about 10–150 W/m. Considering heat loss and complex downhole conditions, the cable heating power selected in this work is 100 W/m. The schematic diagram of the cable heating technology is as follows in Figure 9. By comparing the water and gas production after 60 days of mining under different production pressure difference, a better depressurization mining method is preferred.
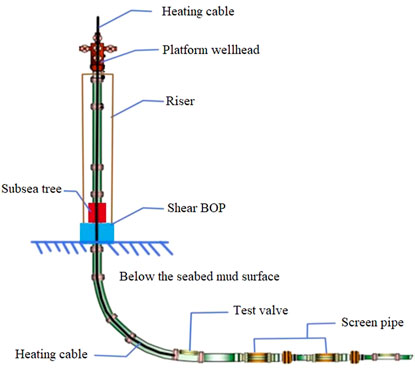
FIGURE 9. Schematic diagram of cable heating technology.
Results and discussions
Gas and water production behaviors (without heating)
Without regard to heating, the production pressure difference is gradually increased from 1 to 5 MPa, and the gas and water production after depressurization and exploitation for 60 days are shown in Figures 10A, B. It can be seen from the figure that with the increase of the production pressure difference, both the gas production rate and the cumulative gas production decrease significantly, especially when the production pressure difference increases from 1 to 2 MPa, the cumulative gas production decreases the most, from 250 × 104 to 90 × 104 m3. The main reason is that the secondary hydrate saturation at the root tip of the wellbore is about 65% after the production pressure difference is 1 MPa for 60 days of simulated production, and the secondary hydrate at the root tip of the wellbore is increased to 2 MPa after 60 days of simulated production. The saturation is as high as about 90%, as shown in Figure 10D; In addition, the production pressure difference increased from 1 to 2 MPa and simulate production for 60 days, the secondary hydrate saturation in the formation near the wellbore also increased significantly, as shown in Figure 11C. Due to the throttling expansion effect, the wellbore and wellbore reservoir temperature are reduced, and the secondary hydrate tends to form in the low temperature and surrounding reservoir area, the secondary hydrate formed at the root tip of the wellbore and near the wellbore, which is the main factor limiting productivity during high-pressure difference production.
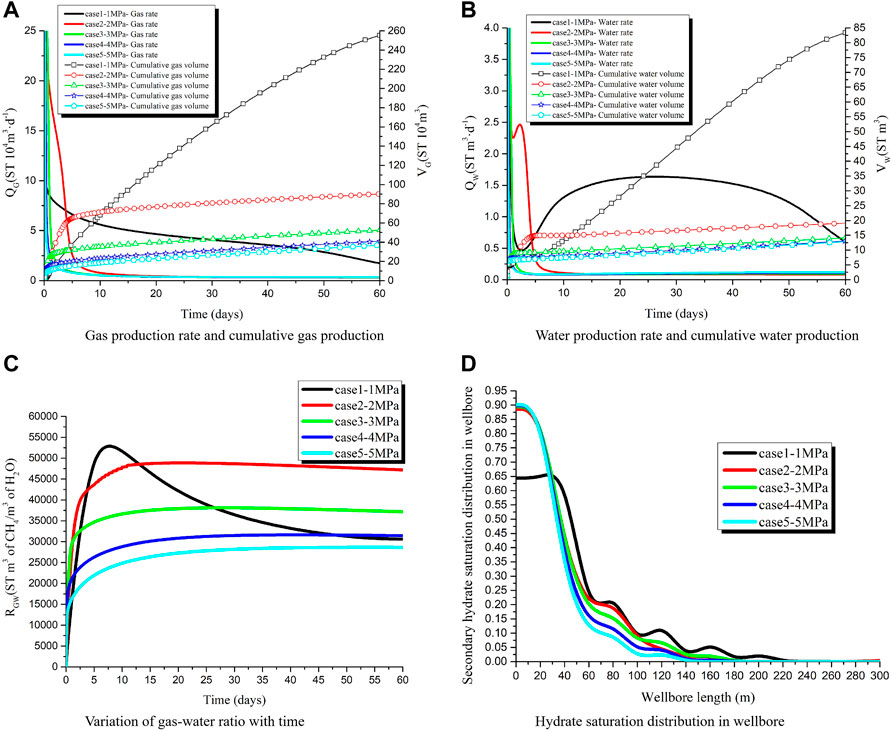
FIGURE 10. Gas production rate and cumulative gas production (A), water production rate and cumulative water production (B), variation of gas-water ratio with time (C), and hydrate saturation distribution in wellbore (D) after 60 days of depressurization production with different production system.
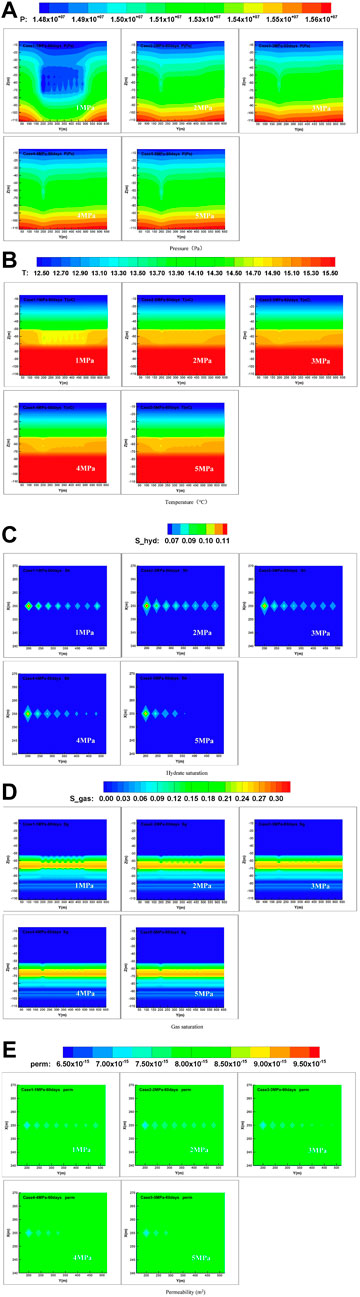
FIGURE 11. Spatial distribution of pressure (A), temperature (B), hydrate saturation (C), gas saturation (D), and permeability (E) after 60 days of depressurization production with different production system.
Similar to the gas production situation, with the increase of the production pressure difference, the water production rate and the cumulative water production volume both decreased significantly, and the decrease was the largest when the production pressure difference increased from 1 to 2 MPa. The secondary hydrates formed around the root tip of the horizontal well and near the wellbore also have a significant impact on the water production rate. Without regard to heating, the production pressure difference is gradually increased from 1 to 5 MPa and the gas-water ratio for 60d of depressurized production is shown in Figure 10C. The gas-water ratio is the highest in the early stage of exploitation with a small pressure difference (1 MPa), but it gradually decreases in the later stage due to the increase of water production; When the production pressure difference increases from 2 to 5 MPa step by step, the overall gas-water ratio in the large-pressure depressurization production mode gradually decreases, and the overall increase gradually increases in the initial stage and stabilizes in the later stage. The main reason of the different trend of the gas-water ratio between small pressure difference (1 MPa) production and large pressure difference (2–5 MPa) production may be the time and saturation of secondary hydrate formation at the root tip of the wellbore and the reservoir near the wellbore.
Without regard to heating, the production pressure difference is gradually increased from 1 to 5 MPa, and the distribution of hydrate saturation in the wellbore along the horizontal well section after depressurization and exploitation for 60 days is shown in Figure 10D. The secondary hydrate saturation at the root tip of the wellbore is the highest, and the secondary hydrate saturation at the finger tip is the lowest; Under the depressurization mode with small pressure difference (1 MPa), the secondary hydrate saturation in the root tip wellbore of the horizontal well section is about 65%. Under the depressurization production mode with high-pressure difference (2–5 MPa), the secondary hydrate saturation in the root tip wellbore of the horizontal well section is up to about 90%. In the middle of the horizontal well section (40–200 m), with the increase of the production pressure difference, the secondary hydrate saturation tends to decrease.
Physical characteristics in the reservoirs (without heating)
Without consideration of heating, the production pressure difference is gradually increased from 1 to 5 MPa, and the distribution characteristics of physical fields such as temperature and pressure in hydrate reservoirs after depressurization and exploitation for 60 days are shown in Figure 11. Under the depressurization production mode with small pressure difference (1 MPa), the range of depressurization is the largest, and the temperature of the reservoir around the wellbore also decreases significantly, the formations near the wellbore in the perforation part of the horizontal well section have secondary hydrate formation, but the saturation is not high, and the gas layer production utilization degree is high, which corresponds to the high gas and water production rates under the production pressure difference; Under the production mode of high-pressure difference (2–5 MPa), the range of depressurization is significantly reduced, and only the formation near the root tip has a significant pressure difference. Although the formation near the wellbore in the perforation part of the horizontal well section has secondary hydrate formation, the saturation gradually decreases. Under the 5 MPa production mode, there is no secondary hydrate formation in the near-wellbore formation at the perforation position in the second half of the horizontal well section (150–300 m), which indicates that the root tip of the horizontal well section has been severely blocked by secondary hydrates under the production pressure difference. Under the production condition of a high-pressure difference, the production degree of the gas layer is low, which corresponds to the low rate of gas production and water production under high production pressure difference. The throttling expansion effect of gas leads to the formation of secondary hydrates in the formation near the wellbore at the root tip and finger tip of the horizontal well section and the root tip of the horizontal well section, which is the main factor restricting the production of hydrate layer II with high production pressure difference.
Gas and water production behaviors (with heating)
With consideration of heating, the production pressure difference is gradually increased from 1 to 5 MPa, and the gas and water production after depressurization and exploitation for 60 days are shown in Figures 12A, B. It can be seen from the figure that in the case of wellbore heating, with the increase of the production pressure difference, the gas production rate and the cumulative gas production increase significantly, especially when the production pressure difference increases from 1 to 2 MPaMPa, the cumulative gas production increases the most, from 300 × 104 m3 rises to 600 × 104 m3, when the production pressure difference increases from 2 to 5 MPa step by step, the increase in the cumulative gas production of simulated mining for 60 days gradually decreases. The main reason for the gradual increase of gas production rate and cumulative gas production with the increase of production pressure difference is that no secondary hydrate is generated in the wellbore under heating, as shown in Figure 12D. There is no secondary hydrate with high saturation in the formation near the wellbore, as shown in Figure 13C, the pressure difference can be smoothly propagated to the depth of the formation, and the low-viscosity gas can smoothly seep into the wellbore under the action of the pressure gradient and be exploited come out. The increase in cumulative gas production gradually decreases from 2 to 5 MPa, mainly because the heating power of 100 W/m is insufficient to eliminate and prevent the formation of secondary hydrates in the reservoir around the root tip and finger tip of the horizontal well section. Which inhibits the increase of gas production rate to a certain extent. In general, heating has a good effect on increasing production performance.
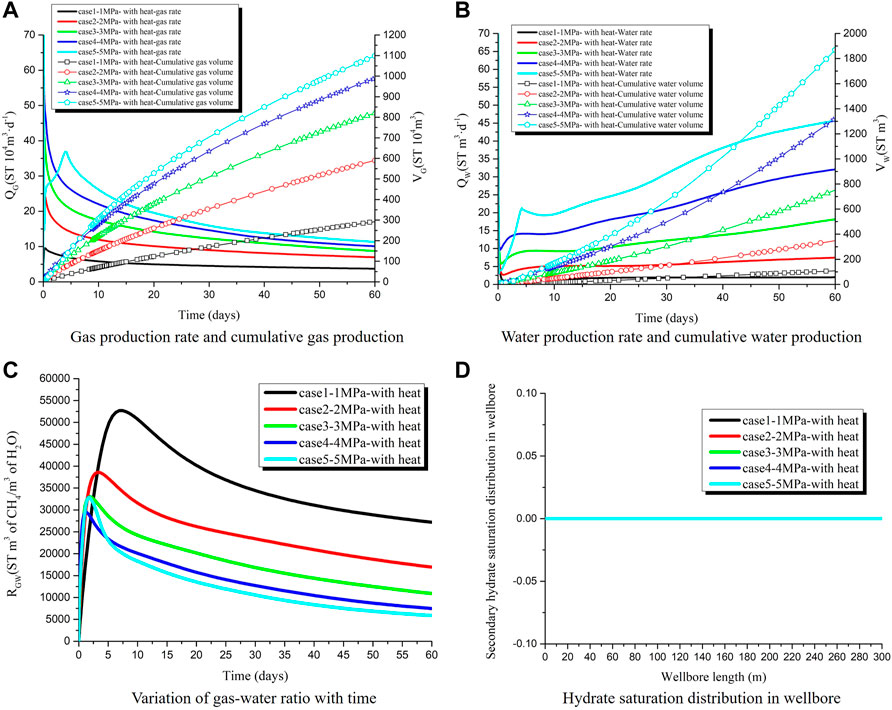
FIGURE 12. Gas production rate and cumulative gas production (A), water production rate and cumulative water production (B), variation of gas-water ratio with time (C), and hydrate saturation distribution in wellbore (D) after 60 days of depressurization production with different production system (with heating).
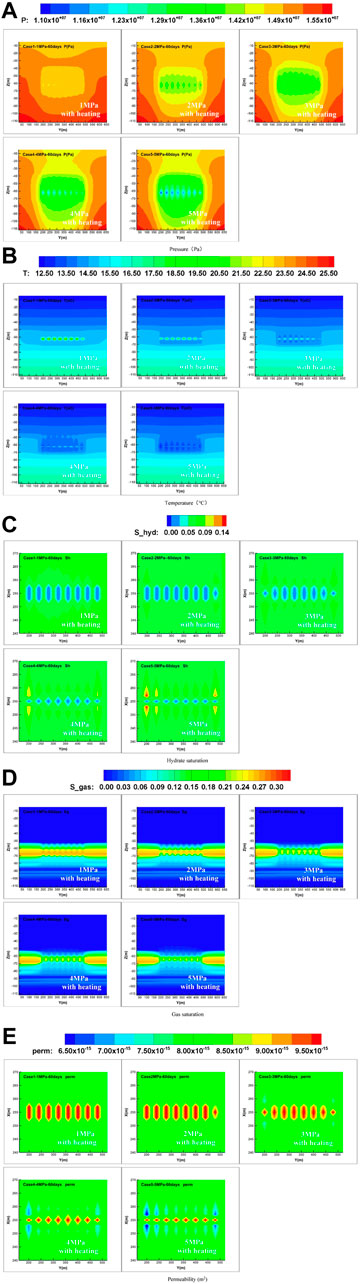
FIGURE 13. Spatial distribution of pressure (A), temperature (B), hydrate saturation (C), gas saturation (D), and permeability (E) after 60 days of depressurization production with different production system (with wellbore heating).
Similar to the gas production, with the increase of the production pressure difference, the water production rate and the cumulative water production volume increased significantly, especially when the production pressure difference increased from 1 to 2 MPa, the cumulative water production volume increased the most. However, from 2 to 5 MPa, the increase range in cumulative water production for 60 days of simulated production gradually decreases, which proves that the formation of secondary hydrates in the reservoir around the root tip and finger tip of the horizontal well section also contributes to the increase in water production rate. A certain inhibitory effect. In consideration of heating, the production pressure difference is gradually increased from 1 to 5 MPa, and the gas-water ratio after depressurization and exploitation for 60 days are shown in Figure 12C. It can be seen from the figure that the gas-water ratio is the highest at the initial stage of depressurization with a small pressure difference of 1 MPa; the overall gas-water ratio RGW gradually decreases with the stepwise increase of the production pressure difference, indicating that the increase of the water production rate is more obvious in the production of high-pressure difference. From the perspective of the gas-water ratio RGW alone, the low-pressure difference production has a good recovery performance and higher economic benefits.
With regard to heating, the production pressure difference is gradually increased from 1 to 5 MPa, and the distribution of hydrate saturation in the wellbore along the horizontal well section after depressurization and exploitation for 60 days are shown in Figure 12D. The simulation results show that no secondary hydrate is generated in the wellbore, indicating that the depressurization production within 5 MPa and the heating power of 100 W/m is sufficient to eliminate and prevent the formation of secondary hydrate in the wellbore.
Physical characteristics in the reservoirs (with heating)
With consideration of heating, the production pressure difference is gradually increased from 1 to 5 MPa, the distribution characteristics of physical fields such as temperature and pressure in hydrate reservoirs after depressurization and exploitation for 60 days are shown in Figure 13. It can be seen from the figure that when the production pressure difference is gradually increased from 1 to 5 MPa, the pressure difference conduction range continues to increase, and at the same time, the production range and degree of production of the gas layer also continue to increase, which correspond to the obvious increase in gas production rate and cumulative gas production after increasing the production pressure difference as shown in Figures 12A, B. When the production pressure difference increases from 1 to 5 MPa, the throttling and expansion effect of the gas gradually offsets the heating effect of the wellbore, which is specifically shown by the gradual decrease of the high-temperature area of the formation near the well, until the production pressure difference is 5 MPa, the formation near the well is shown as the low-temperature area. When the production pressure difference increases to 4–5 MPa, secondary hydrates are formed around the wellbore, which is consistent with the decrease in the gas production rate and cumulative gas production rate as shown in Figures 12A, B. The above phenomenon shows that under the condition of wellbore heating, secondary hydrates will not form around the wellbore, but when the production pressure difference is large to a certain extent (4–5 MPa), the throttling and expansion effect of the gas increases accordingly, which resulting in the horizontal well section. The formation of secondary hydrates around the wellbore at the root tip and finger tip inhibits the increase of gas production rate to a certain extent, but this inhibition can be eliminated by increasing the heating power or increasing the heating power at the root tip and finger tip of the horizontal well section alone.
From the simulation results in Table 7, it can be seen that the production pressure difference is gradually increased from 1 to 5 MPa during the depressurization production without heating, and the cumulative gas production VG decreases gradually after 60d. This is due to the throttling expansion effect that reduces the temperature of the wellbore and the surrounding reservoir and forms secondary hydrate, which inhibited the productivity performance. As shown in Figure 10D and Figure 11C, high saturation secondary hydrates are generated inside the wellbore and low saturation secondary hydrates are generated in the reservoir around the well. The permeability of the reservoir around the well decreases due to the formation of secondary hydrates, as shown in Figure 11E. The high saturation secondary hydrate generated inside the wellbore caused by the throttling expansion effect is the main factor limiting the productivity production without heating.
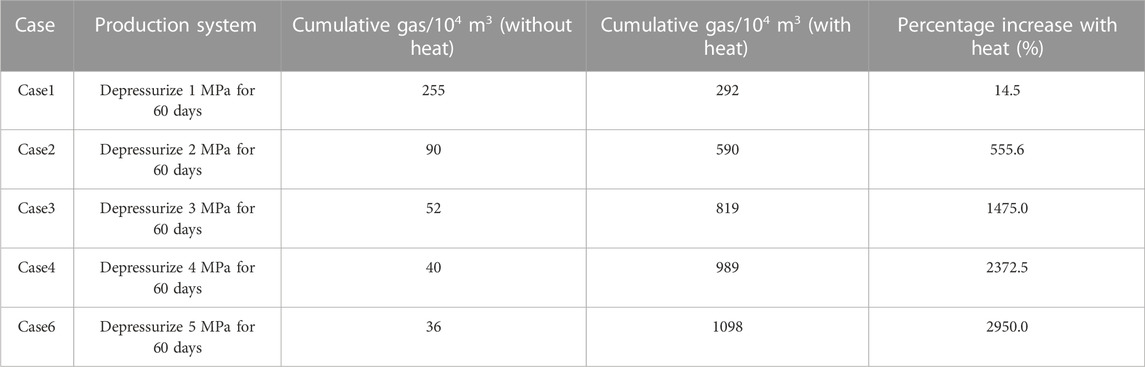
TABLE 7. Analysis of gas production under different production system.
In the case of heating, the pressure difference is gradually increased from 1 to 5 MPa, and the cumulative gas production VG after 60d exploitation is greatly increased compared with the case of heating, which is due to the significant effect of heating on eliminating and preventing the formation of secondary hydrate inside the wellbore. As shown in Figure 12D, no secondary hydrate is generated in the wellbore during depressurization exploitation with different pressure difference. As shown in Figures 13C, E, there is no secondary hydrate formation around the well and the permeability of the reservoir around the well is significantly improved when the pressure difference is small (1–3 Mpa). However, when the pressure difference is large (4–5 MPa), the effect of gas throttling expansion becomes more intense, and the secondary hydrate is generated in the reservoir around the wellbore root tip and finger tip, and its permeability also decreases. In general, under the same pressure difference, heating has an obvious effect on improving the permeability of the reservoir around the well compared with the case without heating, as shown in Figure 11E and Figure 13E.
According to the above simulation results, with the increase of production pressure difference under a certain heating power, secondary hydrates are gradually formed in the reservoir around the root tip and finger tip of the horizontal well, which indicates that under a certain heating power, there is a critical production pressure difference or an optimal production pressure difference selection range. Therefore, it is suggested that small pressure difference should be selected as far as possible for production at the initial stage of production test without heating. Moreover, the strategy of increasing the pressure difference in a small step should be adopted at the later stage of production test to avoid the rapid increase of pressure difference in a short time, and a large amount of secondary hydrates generated in the wellbore or the surrounding reservoir will block the wellbore, which will causing a sharp decline in permeability and then leading to failure of production test or production reduction. In the case of heating, the heating power is limited, so the production pressure difference should be avoided to exceed the critical production pressure difference. If the engineering technology permits, more heating power should be used to heat the root tip and finger tip of the horizontal section of the horizontal well.
Conclusion
China’s Shenhu sea area has a huge amount of natural gas hydrate resources. The results of the second round of hydrate trial production in this sea area in 2020 show that horizontal well exploitation can greatly improve the productivity of natural gas hydrate reservoirs. Therefore, it is of great significance to optimize the depressurization production system of horizontal wells in this sea area. Based on the geological and logging curve data of SHSC-4 well in Shenhu sea area in 2017, this work uses the simulation software TOUGH+HYDRATE to establish the ideal layered geological model of the hydrate reservoir. The historical fitting of gas production of the trial production and the scheme optimization of horizontal well exploitation was carried out. The main work contents include the optimization of the horizontal well section placement and length, and the production system. The following points have been obtained:
(1) The horizontal well section is arranged in the middle of hydrate layer I, layer II and layer III. The simulation results of 60 days show that the horizontal well section arranged in layer II has more advantages, and layer II is close to layer I and layer III. while exploiting layer II, hydrate in layer I and free gas in layer III can be effectively utilized.
(2) The horizontal well section is arranged in hydrate layer II. The simulation results of different horizontal well section lengths show that the longer the horizontal well section length, the higher the cumulative gas production after 60 days of simulated production, but the average cumulative gas production increment per meter is gradually decreasing when the horizontal well section length is 300 m, its water and gas production rate begins to be significantly affected by secondary hydrate, which is a more reasonable horizontal well section length when exploiting hydrate layer II at the station.
(3) The horizontal well section is arranged in hydrate layer II. The simulation results of different production systems show that:①Without heating, under the mode of small-pressure difference (1 MPa) production, the secondary hydrate saturation in the wellbore at the root tip of the horizontal well section is about 65%; Under the mode of high-pressure difference (2–5 MPa) production, the secondary hydrate saturation in the wellbore at the root tip of the horizontal well section is up to about 90%, the gas production rate and cumulative gas production decrease with increasing the pressure difference, indicating that the secondary hydrate formed at the root tip of the wellbore caused by the throttling expansion effect is the main factor limiting the productivity during high-pressure difference production. ② Using depressurization combined with heating production can eliminate and prevent the formation of secondary hydrate around the wellbore and the reservoir. Compared with the situation without heating, when the horizontal section is arranged in Layer II and the length is 300 m, the production mode of depressurization and combined heating is adopted, and the cumulative gas production of 60 days with different pressure difference (1–5 MPa) is 0.14, 5.55, 14.75, 23.72, and 29.5 times higher than that without heating.
Data availability statement
The original contributions presented in the study are included in the article/supplementary material, further inquiries can be directed to the corresponding authors.
Author contributions
TW: Modeling and writing. ZL: Communication and guidance. YY: Suggestion and guidance. QL: Suggestion and guidance. HL: Suggestion and guidance. JW: Communication and guidance. All authors contributed to the article and approved the submitted version.
Funding
This paper was supported by Guangdong MEPP Fund [No. GDNRC(2020)043], Key Special Project for Introduced Talents Team of Southern Marine Science and Engineering Guangdong Laboratory (Guangzhou) (No. GML2019ZD0506), Key Special Project for Introduced Talents Team of Southern Marine Science and Engineering Guangdong Laboratory (Guangzhou) (No. GML2019ZD0307) and Guangdong Major project of Basic and Applied Basic Research (No. 2020B0301030003).
Acknowledgments
The authors would like to extend their sincere appreciation to Kewei Zhang from the Guangzhou Marine Geological Survey for editing this paper.
Conflict of interest
The authors declare that the research was conducted in the absence of any commercial or financial relationships that could be construed as a potential conflict of interest.
Publisher’s note
All claims expressed in this article are solely those of the authors and do not necessarily represent those of their affiliated organizations, or those of the publisher, the editors and the reviewers. Any product that may be evaluated in this article, or claim that may be made by its manufacturer, is not guaranteed or endorsed by the publisher.
References
Cathles, L. M. (2007). Changes in sub-water table fluid flow at the end of the Proterozoic and its implications for gas pulsars and MVT lead-zinc deposits[J]. Geofluids 7 (2), 209–226. doi:10.1111/j.1468-8123.2007.00176.x
Chen, L., Sasaki, H., Watanabe, T., Okajima, J., Komiya, A., and Maruyama, S. (2016). Production strategy for oceanic methane hydrate extraction and power generation with Carbon Capture and Storage (CCS). Energy 126, 256–272. doi:10.1016/j.energy.2017.03.029
Chong, Z. R., Yang, S. H. B., Babu, P., Linga, P., and Li, X. S. (2016). Review of natural gas hydrates as an energy resource: Prospects and challenges. Appl. Energy 162, 1633–1652. doi:10.1016/j.apenergy.2014.12.061
Cui, W., and Xiao, J. Q. (2022). Numerical simulation for data analyses of first gas hydrate trial production test in Shenhu area. Earth Sci. 47 (5), 1890–1900. doi:10.3799/dqkx.2022.089
Daraboina, N., Pachitsas, S., and Von Solms, N. (2015). Experimental validation of kinetic inhibitor strength on natural gas hydrate nucleation. Fuel 139, 554–560. doi:10.1016/j.fuel.2014.09.013
Feng, J. C., Wang, Y., Li, X. S., Zhang, Y., and Chen, Z. Y. (2015). Production performance of gas hydrate accumulation at the GMGS2-site 16 of the pearl river mouth basin in the South China sea. Nat. Gas. Sci. Eng. 27, 306–320. doi:10.1016/j.jngse.2015.08.071
Feng, J. C., Wang, Y., and Li, X. S. (2016). Hydrate dissociation induced by depressurization in conjunction with warm brine stimulation in cubic hydrate simulator with silica sand. Appl. Energy 174, 181–191. doi:10.1016/j.apenergy.2016.04.090
Feng, Y. C., Chen, L., Suzuki, A., Kogawa, T., Okajima, J., Komiya, A., et al. (2019). Enhancement of gas production from methane hydrate reservoirs by the combination of hydraulic fracturing and depressurization method. Energy Convers. Manag. 184 (184), 194–204. doi:10.1016/j.enconman.2019.01.050
Lee, J. (2010). Experimental study on the dissociation behavior and productivity of gas hydrate by brine injection scheme in porous rock. Energy fuels. 24 (1), 456–463. doi:10.1021/ef900791r
Li, G., Moridis, G. J., Zhang, K., and Li, X. S. (2010b). Evaluation of Gas Production Potential from Marine Gas Hydrate Deposits in Shenhu Area of South China Sea. Energy & Fuels 24, 6018–6033. doi:10.1021/ef100930m
Li, J. F., Ye, J. L., Qin, X. W., Qiu, H. j., Wu, N. y., Lu, H. l., et al. (2018). The first offshore natural gas hydrate production test in South China Sea. China Geol. 1 (1), 5–16. doi:10.31035/cg2018003
Ma, X., Sun, Y., Liu, B., Guo, W., Jia, R., Li, B., et al. (2020). Numerical study of depressurization and hot water injection for gas hydrate production in China's first offshore test site. J. Nat. Gas Sci. Eng. 83, 103530. doi:10.1016/j.jngse.2020.103530
Ma, X., Sun, Y., Guo, W., Jia, R., and Li, B. (2021). Numerical simulation of horizontal well hydraulic fracturing technology for gas production from hydrate reservoir. Appl. Ocean Res. 112, 102674. doi:10.1016/j.apor.2021.102674
Milkov, A. V. (2004). Global estimates of hydrate-bound gas in marine sediments: How much is really out there?. Earth-Sci. Rev. 66 (3/4), 183–197. doi:10.1016/j.earscirev.2003.11.002
Moridis, G. J., Kowalsky, M. B., and Pruess, K. (2007a). Depressurization-Induced Gas Production From Class 1 Hydrate Deposits. Soc. Petroleum Eng. Reserv. Eval. Andengineering 10 (05), 458–481. doi:10.2118/97266-pa
Moridis, G. J., Reagan, M. T., Kim, S. J., Seol, Y., and Zhang, K. (2007b). Evaluation of the Gas Production Potential of Marine Hydrate Deposits in the Ulleung Basin of the Korean East Sea. Spe J. 14 (4), 759–781. doi:10.2118/110859-pa
Moridis, G. J., Kowalsky, M. B., and Pruess, K. (2008). TOUGH+HYDRATE V1. 0 user’s manual: A code for the simulation of system behavior in hydrate-bearing geologic media. United States.
Moridis, G. J., Reagan, M. T., Boyle, K. L., and Zhang, K. (2011). Evaluation of the Gas Production Potential of Some Particularly Challenging Types of Oceanic Hydrate Deposits. Transp. Porous Media 90 (1), 269–299. doi:10.1007/s11242-011-9762-5
Moridis, G. J., and Reagan, M. T. (2007a). Strategies for gas production from oceanic class 3 hydrate accumulations[C]. Houston: Offshore Technology Conference. OTC 18865.
Moridis, G. J., and Reagan, M. T. (2007b). Gas production from oceanic class 2 hydrate accumulations[C]. Houston: Offshore Technology Conference. OTC 18866.
Phirani, J., Mohanty, K. K., and Hirasaki, G. J. (2009). Warm water flooding of unconfined gas hydrate reservoirs. Energy fuels. 23 (9), 4507–4514. doi:10.1021/ef900291j
Qin, X., Liang, Q., Ye, J., Yang, L., Qiu, H., Xie, W., et al. (2020). The response of temperature and pressure of hydrate reservoirs in the first gas hydrate production test in South China Sea. Appl. Energy 278, 115649. doi:10.1016/j.apenergy.2020.115649
Sloan, E. D., and Koh, C. A. (2008). Clathrate hydrates of natural gases. 3rd ed. Boca Raton: CRC Press, 537–550.
Su, Z., Moridis, G., Zhang, K., Yang, R., and Wu, N. (2010). Numerical investigation of gas production strategy for the hydrate deposits in the shenhu area[C]. Houston: Offshore Technology Conference. OTC 20551.
Sun, J., Ning, F., Li, S., Zhang, K., Liu, T., Zhang, L., et al. (2015). Numerical simulation of gas production from hydrate-bearing sediments in the Shenhu area by depressurising: The effect of burden permeability. J. Unconv. Oil Gas Resour. 12 (12), 23–33. doi:10.1016/j.juogr.2015.08.003
Sun, J., Zhang, L., Ning, F., Lei, H., Tianle, L., Hu, G., et al. (2017). Production potential and stability of hydrate-bearing sediments at the site GMGS3-W19 in the South China Sea: A preliminary feasibility study[J]. Mar. Petroleum Geol. 86, 447–473. doi:10.1016/j.marpetgeo.2017.05.037
Sun, J., Ning, F., Liu, T., Liu, C., Chen, Q., Li, Y., et al. (2019). Gas production from a silty hydrate reservoir in the South China Sea using hydraulic fracturing: A numerical simulation. Energy ence Eng. 7 (1), 1106–1122. doi:10.1002/ese3.353
Sun, Y., Ma, X., Guo, W., Jia, R., and Li, B. (2019). Numerical simulation of the short- and long-term production behavior of the first offshore gas hydrate production test in the South China Sea. J. Petroleum Sci. Eng. 181, 106196. doi:10.1016/j.petrol.2019.106196
Tupsakhare, S. S., and Castaldi, M. J. (2019). Efficiency enhancements in methane recovery from natural gas hydrates using injection of CO2/N2 gas mixture simulating in-situ combustion. Appl. Energy. 236, 825–836. doi:10.1016/j.apenergy.2018.12.023
Wang, Y., Feng, J. C., Li, X. S., and Zhan, L. (2018a). Pilot-scale experimental evaluation of gas recovery from methane hydrate using cycling-depressurization scheme. Energy 160, 835–844. doi:10.1016/j.energy.2018.07.054
Wang, Y., Feng, J. C., Li, X. S., Zhang, Y., and Chen, Z. Y. (2018b). Fluid flow mechanisms and heat transfer characteristics of gas recovery from gas-saturated and water-saturated hydrate reservoirs. Int. J. Heat. Mass Tran. 118, 1115–1127. doi:10.1016/j.ijheatmasstransfer.2017.11.081
Wang, Z., Liu, S., Li, H., Xu, J., and Wang, X. (2022). A numerical simulation study of methane hydrate reformation during the dissociation process induced by depressurization. Fuel 313, 122983. doi:10.1016/j.fuel.2021.122983
Wu, N., Yang, S., Zhang, H., Liang, J., Wang, H., and Lu, J. (2010). Gas Hydrate System of Shenhu Area, Northern South China Sea:Wire-line Logging, Geochemical Results and Preliminary Resources Estimates[J]. Proc. Annu. Offshore Technol. Conf. 1 (1). doi:10.4043/20485-MS
Xu, C., Cai, J., Yu, Y., Yan, K. F., and Li, X. S. (2018). Effect of pressure on methane recovery from natural gas hydrates by methane-carbon dioxide replacement. Appl. Energy. 217, 527–536. doi:10.1016/j.apenergy.2018.02.109
Yang, S., Liang, J., Lu, J., Qu, C., and Liu, B. (2017). New understandings on the characteristics and controlling factors of gas hydrate reservoirs in the Shenhu area on the northern slope of the South China Sea[J]. Earth Sci. Front. 24 (004), 1–14. doi:10.13745/j.esf.yx.2016-12-43
Yang, L., Guan, D., Qu, A., Li, Q., Ge, Y., Liang, H., et al. (2023). Thermotactic habit of gas hydrate growth enables a fast transformation of melting ice. Appl. Energy 331, 120372. doi:10.1016/j.apenergy.2022.120372
Ye, J., Qin, X., Xie, W., Lu, H., Ma, B., Qiu, H., et al. (2020). The secondnatural gas hydrate production test in the South China Sea. China Geol. 3 (2), 197–209. doi:10.31035/cg2020043
Yu, T., Guan, G., Abudula, A., Yoshida, A., Wang, D., and Song, Y. (2019a). Gas recovery enhancement from methane hydrate reservoir in the Nankai Trough using vertical wells. Energy 166, 834–844. doi:10.1016/j.energy.2018.10.155
Yu, T., Guan, G., Abudula, A., Yoshida, A., Wang, D., and Song, Y. (2019b). Application of horizontal wells to the oceanic methane hydrate production in the Nankai Trough, Japan. Jpn. J. Nat. Gas. Sci. Eng. 62, 113–131. doi:10.1016/j.jngse.2018.11.027
Yu, T., Guan, G., Wang, D., Song, Y., and Abudula, A. (2021a). Numerical evaluation on the effect of horizontal-well systems on the long-term gas hydrate production behavior at the second Shenhu test site. J. Nat. Gas Sci. Eng. 95, 104200. doi:10.1016/j.jngse.2021.104200
Yu, H., Xu, T., Xin, X., Yuan, Y., Feng, G., Chen, Q., et al. (2021b). Optimization of Gas Production from Marine Methane Hydrate Deposit Induced by Horizontal Well. Energy & Fuels 35 (3), 2531–2544. doi:10.1021/acs.energyfuels.0c03868
Yuan, Y., Xu, T., Xin, X., and Xia, Y. (2017a). Multiphase flow behavior of layered methane hydrate reservoir induced by gas production. Geofluids 2017, 1–15. doi:10.1155/2017/7851031
Yuan, Y., Xu, T., Xin, X., and Xia, Y. (2017b). Multiphase Flow Behavior of Layered Methane Hydrate Reservoir Induced by Gas Production. Geofluids. 2017, 1–15. doi:10.1155/2017/7851031
Yuan, Y., Xu, T., Xia, Y., and Xin, X. (2019). Comparison of simplistic and geologically descriptive production modeling for natural-gas hydrate by depressurization. SPE J. 24 (2), 563–578. doi:10.2118/194214-pa
Yuan, Y., Xu, T., Jin, C., Zhu, H., Gong, Y., and Wang, F. (2020). Multiphase flow and mechanical behaviors induced by gas production from clayey-silt hydrate reservoirs using horizontal well. J. Clean. Prod. 328, 129578. doi:10.1016/j.jclepro.2021.129578
Nomenclature
Abbreviations
g gravitational acceleration vector, m/s2
k permeability, m2
Greek symbols
β phase, β = A, G, H, I is aqueous, gas, hydrate and ice, respectively
κ component, κ = w, m, i, h is water, methane, salt and hydrate, respectively
λ average thermal conductivity, W/(m·K)
Keywords: natural gas hydrate, Shenhu sea area, horizontal well, numerical simulation, TOUGH+HYDRATE
Citation: Wan T, Li Z, Yu Y, Liang Q, Lu H and Wang J (2023) Depressurization-induced gas production from hydrate reservoirs in the Shenhu sea area using horizontal well: Numerical simulation on horizontal well section deployment for gas production enhancement. Front. Earth Sci. 11:1137217. doi: 10.3389/feart.2023.1137217
Received: 04 January 2023; Accepted: 10 February 2023;
Published: 21 February 2023.
Edited by:
Shuai Yin, Xi’an Shiyou University, ChinaReviewed by:
Lei Yang, Dalian University of Technology, ChinaJiafei Zhao, Dalian University of Technology, China
Copyright © 2023 Wan, Li, Yu, Liang, Lu and Wang. This is an open-access article distributed under the terms of the Creative Commons Attribution License (CC BY). The use, distribution or reproduction in other forums is permitted, provided the original author(s) and the copyright owner(s) are credited and that the original publication in this journal is cited, in accordance with accepted academic practice. No use, distribution or reproduction is permitted which does not comply with these terms.
*Correspondence: Zhanzhao Li, 490565409@qq.com; Jingli Wang, 345856883@qq.com