 James Bela
 Vladimir Kossobokov
 Giuliano Panza1,4,5,6,7,8
- 1International Seismic Safety Organization (ISSO), Arsita, Italy
- 2Oregon Earthquake Awareness, Portland, OR, United States
- 3Institute of Earthquake Prediction Theory and Mathematical Geophysics, Russian Academy of Sciences (IEPT RAS), Moscow, Russia
- 4Accademia Nazionale dei Lincei, Rome, Italy
- 5Institute of Geophysics, China Earthquake Administration, Beijing, China
- 6Accademia Nazionale Delle Scienze detta dei XL, Rome, Italy
- 7Beijing University of Civil Engineering and Architecture (BUCEA), Beijing, China
- 8Associate to the National Institute of Oceanography and Applied Geophysics - OGS, Trieste, Italy
Neo-Deterministic Seismic Hazard Assessment (NDSHA), dating back to the turn of the Millennium, is the new multi-disciplinary scenario- and physics-based approach for the evaluation of seismic hazard and safety–guaranteeing “prevention rather than cure.” When earthquakes occur, shaking certainly does not depend on sporadic occurrences within the study area, nor on anti-seismic (earthquake-resistant) design parameters scaled otherwise to probabilistic models of earthquake return-period and likelihood — as adopted in the widespread application of the model-driven Probabilistic Seismic Hazard Analysis (PSHA). Therefore, from a policy perspective of prevention, coherent and compatible with the most advanced theories in Earth Science, it is essential that at least the infrastructure installations and public structures are designed so as to resist future strong earthquakes. Evidences and case histories detailed in the newly published book Earthquakes and Sustainable Infrastructure present a new paradigm for Reliable Seismic Hazard Assessment (RSHA) and seismic safety — comprehensively detailing in one volume the ‘state-of-the-art’ scientific knowledge on earthquakes and their related seismic risks, and actions that can be taken to ensure greater safety and sustainability. The book is appropriately dedicated to the centenary of Russian geophysicist Vladimir Keilis-Borok (1921–2013), whose mathematical-geophysical insights have been seminal for the innovative paradigm of Neo-deterministic seismic hazard assessment. This review focuses on Hazards, Risks and Prediction initially discussed in the introductory Chapter 1 — an understanding of which is essential in the applications of the state-of-the-art knowledge presented in the book’s 29 following chapters.
Introduction
Newly published Earthquakes and Sustainable Infrastructure (Panza et al., 2021) presents a new paradigm for seismic safety — comprehensively detailing in one volume the ‘state-of-the-art’ scientific knowledge on earthquakes and their related seismic risks, and the actions that can be taken to reliably ensure greater safety and sustainability. This book is appropriately dedicated to the centenary of Russian geophysicist Vladimir Keilis-Borok (1921–2013), whose mathematical insights have been seminal for the innovative paradigm of Neo-Deterministic Seismic Hazard Assessment (NDSHA). Dating back to the turn of the Millennium, NDSHA is the new multi-disciplinary scenario- and physics-based approach for the evaluation of seismic hazard and safety — guaranteeing “prevention rather than cure.”
When earthquakes occur with a given magnitude (M), the shaking certainly does not depend on sporadic occurrences within the study area, nor on anti-seismic (earthquake resistant) design parameters scaled otherwise to probabilistic models of earthquake return period and likelihood — as adopted in the widespread application of the model-driven Probabilistic Seismic Hazard Analysis (PSHA), e.g., by the Global Earthquake Model (GEM) project and its recent spinoff Modello di Pericolosità Sismica (MPS19) for Italy.
An earthquake compatible with the seismogenic characteristics of a certain area, even if sporadic and therefore labelled as “unlikely”, can occur at any time, and the anti-seismic design parameters must take into account the magnitude values defined according to both the seismic history and the seismotectonics. Therefore, from a policy perspective of prevention, coherent and compatible with the most advanced theories in Earth Science, it is essential that at least the infrastructure installations and public structures are designed so as to resist (or sustain) future strong earthquakes and continue operation in their original capacities.
Thirty chapters of the book provide comprehensive reviews and updates of NDSHA research and applications so far in Africa, America, Asia and Europe — a collection of evidences and case histories that hopefully will persuade responsible people and authorities to consider these more reliable procedures for seismic hazard analyses and risk evaluation. Providing awareness that the use of PSHA may result in the design of unsafe buildings, NDSHA evaluations must be considered in the next versions of earthquake-resistant design standards and explicitly taken as the reference approach for both safety and sustainability.
The book fulfils essential needs of geophysicists, geochemists, seismic engineers, and all those working in disaster preparation and prevention; and is the only book to cover earthquake prediction and civil preparedness measures from a Neo-Deterministic (NDSHA) approach. In this review we focus on the lead chapter: Hazard, Risks, and Prediction by Vladimir Kossobokov (2021) — an understanding of which is essential in the applications of the state-of-the-art knowledge presented in the book’s 29 following chapters.
Science should be able to warn people of looming Disaster
« Science should be able to warn people of looming disaster, Vladimir Keilis-Borok believes.“My main trouble,” he says, “is my feeling of responsibility.” »(Los Angeles Times, 9 July 2012)
Nowadays, in our Big Data World, Science can disclose Natural Hazards, assess Risks, and deliver the state-of-the-art Knowledge of Looming Disasters in advance of catastrophes, along with useful Recommendations on the level of risks for decision-making with regard to engineering design, insurance, and emergency management. Science cannot remove, yet, people’s favor for fable and illusion regarding reality, as well as political denial, sincere ignorance, and conscientious negligence among decision-makers. The general conclusion above is confirmed by application and testing against Earthquake Reality, that the innovative methodology of Neo-Deterministic Seismic Hazard Assessment (NDSHA) “Guarantees Prevention Rather Than Cure.” NDSHA results are based on reliable seismic evidence, Pattern Recognition of Earthquake Prone Areas (PREPA), implications of the Unified Scaling Law for Earthquakes (USLE), and exhaustive scenario-based modeling of ground shaking.
The UN World Conference on Disaster Reduction, held January 18–22, 2005 in Kobe, Hyogo, Japan, formally adopted the Hyogo Framework for Action 2005–2015: “Building the Resilience of Nations and Communities to Disasters”, just days following the 26 December 2004, MW 9.2 Great Indian Ocean mega-earthquake and tsunami. During the Conference, a Statement (Kossobokov, 2005a) at the “Special Session on the Indian Ocean Disaster: risk reduction for a safer future” was urging or insistent on a possibility of a few mega-earthquakes of about the same magnitude MW 9.0 occurring globally within the next 5–10 years. This prediction was confirmed, unfortunately, by both the 27 February 2010, MW 8.8 mega-thrust offshore Maule, Chile and the 11 March 2011, MW 9.1 mega-thrust and tsunami off the Pacific coast of Tōhoku, Japan (Kossobokov, 2011; Ismail-Zadeh and Kossobokov, 2020).
An opportunity to reduce the impacts from both these earthquakes and tsunami disasters was missed. Davis et al. (2012) showed how the prediction information on expected world’s largest earthquakes provided by the M8 and MSc algorithms (Keilis-Borok and Kossobokov, 1990; Kossobokov et al., 1990), although limited to the intermediate-term span of years and middle-range location of a thousand km, can be used to reduce future impacts from the world’s largest earthquakes.
The primary reasons for having not used the prediction for improving preparations in advance of the Tōhoku earthquake “included: 1) inadequate links between emergency managers and the earthquake prediction information; and 2) no practiced application of existing methodologies to guide emergency preparedness and policy development on how to make important public safety decisions based on information provided for an intermediate-term and middle-range earthquake prediction having limited but known accuracy.” The Tōhoku case-study exemplifies how reasonable, prudent, and cost-effective decisions can be made to reduce damaging effects in a region, when given a reliable Time of Increased Probability (TIP) for the occurrence of a large earthquake and associated phenomena like tsunami, landslides, liquefaction, floods, fires, etc.
The Sendai Framework for Disaster Risk Reduction 2015–2030, a successor of the Hyogo Framework for Action, is a set of agreed-upon commitments to proactively ensure the prevention of “new” Disasters — through the timely implementation of integrated economic, structural, legal, social, health, cultural, educational, environmental, technological, political, and institutional measures (Briceño, 2014; Mitchell, 2014). Years after the 2005 Hyogo and 2015 Sendai Frameworks for Disaster Risk Reduction, countries are now following a range of different approaches and mitigation strategies, due to the variety of both societal systems and hazards. However, Gilbert White’s (2005) observation from the tragic tsunami beginnings of this heightened awareness that it was “important to recognize that no country in the world has achieved a completely effective policy for dealing with the rising tide of costs from natural hazards” is still largely true today.
Our beliefs in models, myths can contradict real-world observations
Moreover, the ongoing COVID-19 pandemic is an itchy and troubling global example of how public policies based on presumably both “the best science available” and also data of high quality nonetheless appear to be extremely difficult, uneven, and may sometimes lead to Disaster even in those countries that were supposedly well-prepared for such an emergency. In fact, the pandemic (https://coronavirus.jhu.edu/map.html), with a rapidly growing less-than-a-year death toll of 1,820,841 and 83,579,767 global cases reported on 1 January 2021, as of 13 February 2021, had the numbers alarmingly already raised to 2,385,203 and 108,289,000 respectively — and thereby sheds a sobering shower on our existing unperturbed and unchallenged myths about disasters (Mitchell, 2014). As of 2 September 2021, the totals had more than doubled, rising to 4,702,119 and 229,159,687 despite enormous efforts on vaccination. JHU has stopped collecting data as of March 10, 2023 when the death toll reached 6,881,955; total cases reached 676,609,955; and total vaccine doses administered reached 13,338,833,198.
In one disastrous outcome, “the anzen shinwa (“safety myth”) image portrayed by the Japanese government and electric power companies tended to stifle honest and open discussion of the risks” from nuclear power, in the years leading up to the 2011 Fukushima disaster (Nöggerath et al., 2011). Kaufmann and Penciakova (2011) illustrate how “countries with good governance”— for example, Chile in 2010, “can better prepare for and mitigate the devastating effects of natural disasters” through leadership and transparency. In exploring “Japan’s governance in an international context and its impact on the country’s crisis response,” they reveal how failures in the nuclear plant regulatory environment (including regulatory capture — wherein “the rulemaking process also appears to be riddled with conflict of interest”) led to an unmitigated disaster that was totally avoidable. See also (Saltelli et al., 2022).
Can nothing be done to stop the increasing number of disasters?
Is there any reason, when estimating long-term trends, for inventing the Myth that now “fewer people are dying in disasters” (Mitchell, 2014), if a pandemic like COVID-19 (or even a single deadly event like the 2004 Great Indian Ocean mega-earthquake and tsunami that killed 227,898 people) can push up significantly the expected average rate of death tolls? Is Climate Change now the biggest cause of disasters, since both vulnerable populations and infrastructures presently exist widespread in the areas exposed to extreme catastrophic events of different kinds?
Is it true that nothing can be done to stop the increasing number of disasters, if, alternatively, a country can radically reduce its risks from disasters by appropriate investments, incentives, and political leadership? Unlike 30 years ago, Science presently does have the know-how to reduce damage from even the major hazardous events to the level of incidents rather than disasters.
Evidently, we do not live in a black-and-white disaster world, and our beliefs, i.e., our mental models, or the “conceptualizations” that we “bring to the task” (pages 2–3 in Chu, 2014) in “initial basic principles” may unfortunately lead us to rather prefer models that contradict with our real-world observations. We know quite well the famous quotation that “all models are wrong, but some are useful” from George Box (1979), but too often we forget that some models are useless and some others are really harmful, especially, when viewed as complete substitutes for the original natural phenomenon (Gelfand, 1991).
Nowadays, in our Big Data World, where the global information storage capacity routinely surpasses a level of more than 6 Zettabytes (6 × 10+21 in optimally compressed bytes) per year, “open data”, together with the enormous amount of available pretty fast user-friendly software, provide unprecedented opportunities for the development and enhancement of pattern recognition studies — in particular, those studies applied to Earth System processes. However, a Big Data World alternatively opens up as well many wide avenues, narrow pathways, and even rabbit holes for finding and/or imagining deceptive associations (i.e., Quixote-like patterns that are not really there) in both inter- and trans-disciplinary data — therein then subsequently inflicting misleading inventions, predictions, and, regretfully, wrong decisions that eventually may lead to different kinds of disasters.
The core seed of disaster is risk
The “common language vocabulary” by itself is oftentimes confusing to common peoples’ understandings of well-intentioned messaging conveying importance of dangers and their likelihood, even though generally being both thought-provoking and pretty much instructive: see Cambridge Dictionary for Disaster; Hazard; Risk; Vulnerability; and Prediction (https://dictionary.cambridge.org/us/).
“Although ‘hazard’ and ‘risk’ are commonly regarded as synonyms, it is useful to distinguish between them. Hazard can be thought of as the possibility that a dangerous phenomenon might occur, whereas risk is a measure of the loss to society that would result from the occurrence of the phenomenon. More concisely, ‘risk is a measure of the probability and severity of adverse effects’ (Lowrance, 1976; Peterson, 1988).” Seismic hazard refers to the natural phenomenon of earthquakes, ground motion in particular, which can cause harm. Seismic risk refers to the possibility of loss or injury caused by a seismic hazard.
We are all living in a risky world, and Figure 1 illustrates further our appetite for all the essential intertwined loops of Risk: defined in common language as “the chance of injury, damage, or loss.” The figure complements with the fifth basic component of Time the four components presented by Boissonnade and Shah (1984), who define Risk “as the likelihood of loss”. In insurance studies: a) the Exposure is defined as “the value of structures and contents, business interruption, lives, etc.”; and b) Vulnerability as the sensitivity to Hazard(s) at certain Location(s) — i.e., “the position of the exposure relative to the hazard.” Since Hazard is likely to cause damage and losses sometimes, the origin Time and duration of any hazardous event may become critical in its transformation to Disaster, as illustrated later.

FIGURE 1. A knot that symbolically intertwines hazard, location, time, exposure, and vulnerability — all around Risk.
Natural hazards
In the natural hazard realm, these dangerous and damaging phenomena may include earthquake, tsunami, flood, landslide, volcanic eruption, hurricane, tornado, wildfire, etc. Hazards (or possibilities that dangerous phenomena might occur) are especially “risky” when they are only thought of in terms of the perceived probabilities for their occurrence (i.e., low hazard or high hazard) — because here we really need to consider the components of Location, Time, and Exposure versus Vulnerability as well.
We also know quite well from experience that hazardous events may cascade — where (under certain circumstances) a primary event may initiate or cause further secondary, tertiary, etc. damages, disruptions, and losses — such as the recent August 26 2021 Hurricane Ida, a Category 4 storm that blasted ashore in Louisiana midday “knocking out power to all of New Orleans, blowing roofs off buildings and reversing the flow of the Mississippi River as it rushed from the Louisiana coast into one of the nation’s most important industrial corridors” in the middle of increasing Delta Variant infections/hospitalizations due to the ongoing COVID-19 pandemic. Thus, depending on both the particular risky situation and our response, a hazardous event scenario may either cause or not cause a Disaster.
Can uncertainty be computed?
While Risk can be computed, uncertainty cannot. So regretfully, the following statement, originally attributed to seismic hazard assessment some four decades ago, has not lost its relevance today, and still applies appropriately to present day situations we face in analyzing other potential damages and losses — for the timely implementation of integrated economic, structural, legal, social, health, cultural, educational, environmental, technological, political, and institutional measures:
However, ignorance still exists on the seismic severity (usually expressed in intensity values) a site may expect in the future as well on the damage a structure may sustain for a given seismic intensity. (Boissonnade and Shah, 1984, p. 233)
And while prediction is “the act of saying what you think will happen in the future: e.g., ‘I wouldn’t like to make any predictions about the result of this match.’”— even the advanced tools of data analysis may lead to wrong assessments, when inappropriately used to describe the phenomenon under study. A (self-) deceptive conclusion could be avoided by verification of candidate models against (reproducible) experiments on empirical data — and in no other way.
Risk communication in disaster planning
When decisions are made about required actions in response to prediction of a disaster, the choices made are usually based on a comparison of expected “black eyes” (risks/costs) and “feathers in caps” (benefits). If the latter exceed the former, it is reasonable to go forward. But each of decision-makers may have rather different opinions on hazards, risks, and outcomes of different decisions and, as it is well-known, even two experts (scientists, in particular) may have three or more opinions!
Therefore, actual decisions sometimes (if not always) are not optimal, especially when there are alternative ways of gaining personal benefits or avoiding personal guilt. In many practical cases, decision makers do not have any opinion due to: i) ignorance in beyond-design circumstances; ii) denial of hazard and risk — based on misconceptions; and iii) a sense of personal responsibility to an impending disaster when it is too late to take effective countermeasures. As a result, since Prediction again is “the act of saying what you think will happen in the future: e.g., ‘I wouldn't like to make any predictions about the result of this match.’” — this mimicked view in policy decisions becomes a common way to avoid responsibility.
Since there is already a lot of flexibility in common language that justifies the following disclaimer note: “Any opinions in the examples do not represent the opinion of the Cambridge Dictionary editors or of Cambridge University Press or its licensors.” — we note that many people, including scientists, do not well distinguish between ‘unpredictable’, ‘random’, and ‘haphazard’, which distinctions are, nevertheless, crucial for scientific reasoning and conclusions. In particular, Stark (2017, 2022) emphasizes that: “‘Random’ is a very precise statistical term of art” and that notions of probability can only apply “if the data have a random component.”
Risk Modeling (Michel, 2018) is about the future of Exposure and necessarily convolves Hazard (where possibility now ≈ likelihood of an event) with the components of Location, Time, and Vulnerability (Cannon, 1993; McEntire et al., 2002; McEntire, 2004). Fischhof and Kadvany (2011) informatively note that Risk “shows how to evaluate claims about facts (what might happen) and about values (what might matter)”, further observing that as was previously noted with regard to the global COVID-19 pandemic, officially declared 11 Mar 2020 by the World Health Organization (WHO): “societies define themselves by how they define and manage dangers.” See also (SISMA-ASI (2009); Kaufmann and Penciakova, 2011; May, 2001; Berke and Beatley, 1992; Scawthorn, 2006; SISMA-ASI (2009); Wang, 2008; Wiggins, 1972; Bolt, 1991; Tierney, 2014).
Thus, an earthquake hazard with a presumed low-likelihood (or low probability) can nevertheless represent a high or even unacceptable risk (Berke and Beatley, 1992; May, 2001; Marincioni et al., 2012; Bela, 2014; Tanner et al., 2020), in addition to references cited in previous paragraph — and particularly for those cases noted in “Earthquakes and Sustainable Infrastructure” (Panza et al., 2021), the state-of-the-art approaches are “aimed at the level of natural risks for decision-making in regard to engineering design, insurance, and emergency management”.
And while insurance can repair the damage, and while catastrophic reinsurance can even further spread the risk and keep first insurers solvent, lives can only be saved and infrastructure installations and public structures can only “resist (or sustain) future strong earthquakes and continue to operate in their original capacity” if they can withstand the shaking. An often unappreciated and complicating factor is that “earthquake risk is characteristically seen as ‘remote’ ”— with naturally rare earthquake events “resulting in low risk awareness and low risk reward (Michel, 2014).”
Volcanic disasters: Nyiragongo and Mt. St. Helens
The recent 22 May 2021 Nyiragongo volcano (DR Congo) flank eruption is tellingly illustrative of a volcanic disaster. After just 19 years since the catastrophic January-February 2002 flank eruption, a new flank eruption began on 22 May 2021 (coincidentally on the same date as the Mw 9.5 1960 Chile earthquake, the largest recorded earthquake of the 20th century). As of 27 May 2021 “More than 230,000 displaced people are crowding neighboring towns and villages. Lack of clean water, food and medical supplies, as well as electricity in parts of Goma, are creating catastrophic conditions in many places. To add to all this misery, health authorities are worried about outbreaks of cholera — at least 35 suspected cases have been found so far.” (https://www.volcanodiscovery.com/nyira-gongo/eruption-may-2021/activity-update.html).
USGS volcanologist Donald Peterson, who witnessed first-hand the catastrophic 1980 Eruption of Mt. St. Helens in southwestern Washington state, United States, observed in a comprehensive review of “Volcanic Hazards and Public Response” (Peterson, 1988) that “although scientific understanding of volcanoes is advancing, eruptions continue to take a substantial toll of life and property.” And although “scientists sometimes tend to feel that the blame for poor decisions in emergency management lies chiefly with officials or journalists because of their failure to understand the threat,” he believes otherwise that “however, the underlying problem embraces a set of more complex issues comprising three pervasive factors: 1) the first factor is the volcano: signals given by restless volcanoes are often ambiguous and difficult to interpret, especially at long-quiescent volcanoes; 2) the second factor is people: people confront hazardous volcanoes in widely divergent ways, and many have difficulty in dealing with the uncertainties inherent in volcanic unrest; 3) the third factor is the scientists: volcanologists correctly place their highest priority on monitoring and hazard assessment, but they sometimes fail to explain clearly their conclusions to responsible officials and the public, which may lead to inadequate public response.” And since “of all groups in society, volcanologists have the clearest understanding of the hazards and vagaries of volcanic activity; they thereby assume an ethical obligation to convey effectively their knowledge to benefit all of society.”
Explaining uncertainty; miscommunication and disasters
Common language vocabulary issues aside; “it is not easy to explain the uncertainties of volcanic hazards to people not familiar with volcanoes, and often these difficulties lead to confusion, misunderstanding, and strained relations between scientists and persons responsible for the public welfare, such as civil officials, land managers, and journalists” (Peterson, 1988) — and notably, the fatal 6 April 2009 Mw 6.3 earthquake disaster that occurred in the Abruzzi region of Central Italy, killing more than 300 people and wrecking the medieval heart of the city, is just such a case-in-point: showing that the above miscommunication reality will apply mutatis mutandis to earthquakes and other hazards. The 2009 L’Aquila earthquake had been preceded by much seismic activity beginning in October 2008, analogous to the preparatory rumblings of an awakening volcano. But even though it occurred in a zone defined at high seismic hazard, as charted on a map — high vulnerabilities combined with major failures in Disaster Risk Mitigation to produce both the tragic large losses and an ensuing legal prosecution of six scientists and one government official, “the L'Aquila Trial” (See Marincioni et al., 2012; Panza and Bela, 2020 and Supplementary Material therein).
Effective communication
In comprehensively addressing the public response, Peterson “advanced the view that volcanologists should regard the development of effective communications with the public just as important a challenge as that of monitoring and understanding the volcanoes. We must apply the same degree of creativity and innovation to improving public understanding of volcanic hazards,” he believed, “as we apply to the problems of volcanic processes. Only then will our full obligation to society be satisfied.”
To be creatively most effective, in developing effective communications with the public (all people or groups not involved in the scientific study of volcanoes, earthquakes, etc.), Peterson offered these insights systematically researched and provided from the social sciences, which “deal with the interaction of people with all kinds of hazards.”
Sorensen and Mileti (1987), pages 14–53 showed that the response to a warning by a person (Figure 2) or group includes a series of steps that involve hearing a message, understanding it, believing it, personalizing it (that is, being convinced that it really applies to the individual), and finally taking action. Different people and different societies react in individual ways as they progress through these steps. The style of a warning message greatly influences the response it produces, and warnings are most effective if they are specific, consistent, accurate, certain, and clear (Sorensen and Mileti, 1987, page 20). If one or more of these attributes is missing, the message is more likely to be ignored or disbelieved.
FIGURE 2. “I want to report an earthquake.”
What (we think) we know about earthquakes
For a reliable seismic hazard assessment, a specialist must be knowledgeable in understanding seismic effects:
• An earthquake is a sudden movement that generates seismic waves inside the Earth and shakes the ground surface.
• Although historical records on earthquakes are known from 2100 B.C., generally most of the earthquakes before the middle of the 18th century are lacking a reliable description, with a possible exception being the Catalogo Parametrico dei Terremoti Italiani (Gasperini et al., 2004) based upon both historical and instrumental data comprising an Italian Earthquakes Catalog more than a thousand years long.
• Earthquakes are complex phenomena. Their extreme catastrophic nature has been known for centuries, due to resulting devastations recorded from many of them.
• Their abruptness, along with their sporadic, irregular and apparently rare occurrences, all facilitate formation of the common perception that earthquakes are random and unpredictable phenomena.
However, modern advances in seismology prove that this perceived random and unpredictable behavior is not really the case in a number of important aspects (Kossobokov, 2021).
Nowadays, the location of earthquake-prone sites is accurately mapped (Figure 3) due to rather accurate hypocenter determinations, along with estimates of their source size. The “seismic effects” of earthquakes that are needed for a Seismic Hazard Assessment (SHA) can be characterized from both physically felt and observed effects (Macroseismic Intensity), and also from instrumentally recorded earthquake records: a) seismograms and b) records of the actual ground shaking characterizing acceleration, velocity, and displacement — see chapters in Encyclopedia of Solid Earth Geophysics (Gupta, 2020).
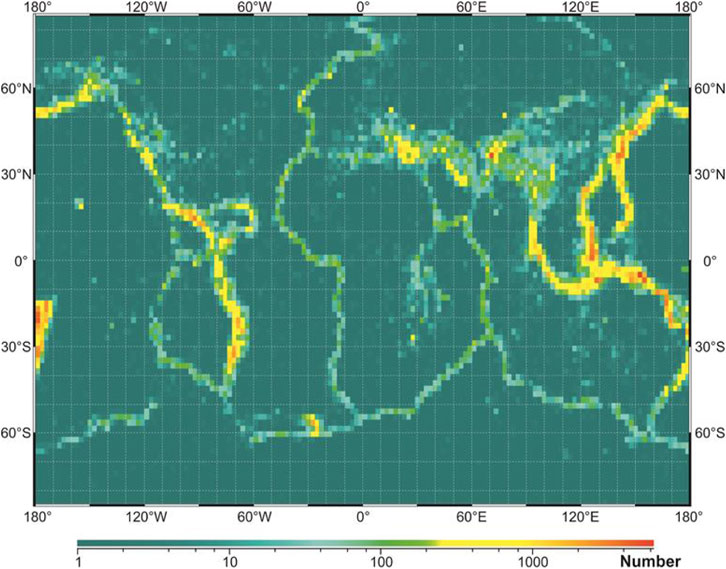
FIGURE 3. Locations of earthquake prone sites: Global map showing the numbers of the M ≥ 4 earthquake epicenters within 2.4°×2.0° grid cells during the period 1963–2020.
A detailed historical review of earliest seismological attempts to quantify sizes of earthquake sources through a measure of their energy radiated into seismic waves, which occurred also in connection with the parallel development of the concept of earthquake magnitude, is supplied by Gutenberg and Richter (1949), Panza and Romanelli (2001), and Okal (2019). Figure 4 illustrates the commonly accepted notation of earthquake magnitude classes.
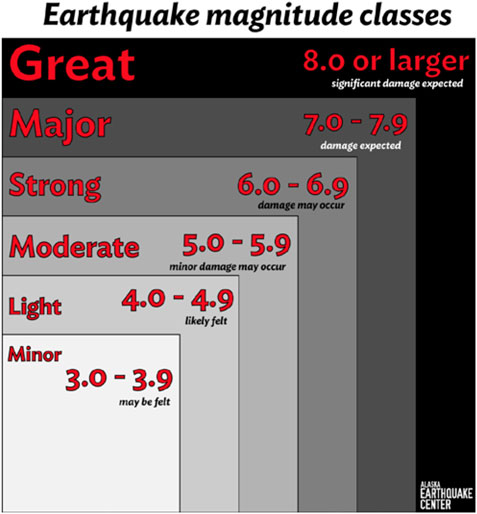
FIGURE 4. Earthquake magnitude classes.
Ellsworth (1990) offers these important caveats whenever performing a systematic SHA: a) “earthquakes are complex physical processes generated by sudden slip on faults, and as such they can only be grossly characterized by simple concepts”; and b) “Magnitude, as commonly used to compare the sizes of different earthquakes, also represents an extreme simplification (cf Felt Intensity: center of energy; Instrumental Seismometer: point of first rupture) of the earthquake process and by itself cannot fully characterize the size of any event. Traditionally, seismologists have developed a suite of magnitude scales, each with its own purpose and range of validity to measure an earthquake. Because no single magnitude scale can be systematically applied to the entire historical record, a summary magnitude, M, is introduced here to facilitate comparisons between events.”
Many shaking intensity scales have been developed over a few centuries to measure the damaging results from earthquakes, of which the Modified Mercalli Intensity (MMI) is among the most commonly used. This scale, which maps the center of energy release for pre-instrumental records, classifies qualitatively the effects from an earthquake upon the Earth’s surface: ranging from “not felt” (intensity I); to “extreme” (intensity X), when most masonry and frame structures are destroyed with foundations; and finally, to “total destruction” (intensity XII on the MMI scale), when rolling waves are seen on the ground surface and objects are thrown upward into the air. We feel worth mentioning here also that, for the Mercalli Cancani Sieberg (MCS) intensity scale, a doubling of Peak Ground Acceleration (PGA) practically corresponds to one unit increment of Macroseismic Intensity (Cancani, 1904).
Numerous approaches to the determination of an earthquake source size have resulted in a number of quantitative determinations of magnitude M based on instrumental, macro-seismic, and other data (Bormann, 2020). Charles Richter (1935) used the physically dimensionless logarithmic scale (because of the very large differences in displacement amplitude between different sized events) for his definition of magnitude М — that appears naturally appropriate due to apparent hierarchical organization of the lithosphere (which contains mobile blocks ranging from just the size of a grain ∼10−3 m across — on up to scale of tectonic plates ∼106 m). (Keilis-Borok, 1990; Sadovsky, 2004; Ranguelov, 2011; Ranguelov and Ivanov, 2017).
It is not surprising that, for shallow-depth earthquakes, the magnitude M (originally determined by Richter from the ground displacement recorded on a seismogram) is about two-thirds of the MMI intensity at the epicenter I0, thus М = ⅔ I0 + 1 (Gutenberg and Richter, 1956). Accordingly, then, a strong (M = 6.0) shallow earthquake may cause only negligible damage in buildings of good design and construction near the epicenter, but otherwise considerable damage in poorly built or badly designed structures.
Figure 5 illustrates the global magnitude distribution by year for the time period 1963–2020, i.e., after installation of the analog World-Wide Network of Standard Seismograph Stations (WWNSS) https://science.sciencemag.org/content/174/4006/254 (top); and the empirical non-cumulative Gutenberg-Richter plot of N(M) for the entire 58 years of record, with b-value estimated at 0.998 (R2 = 0.977) for the best fit of log10N(M) = a + b × (8 – M) (bottom).
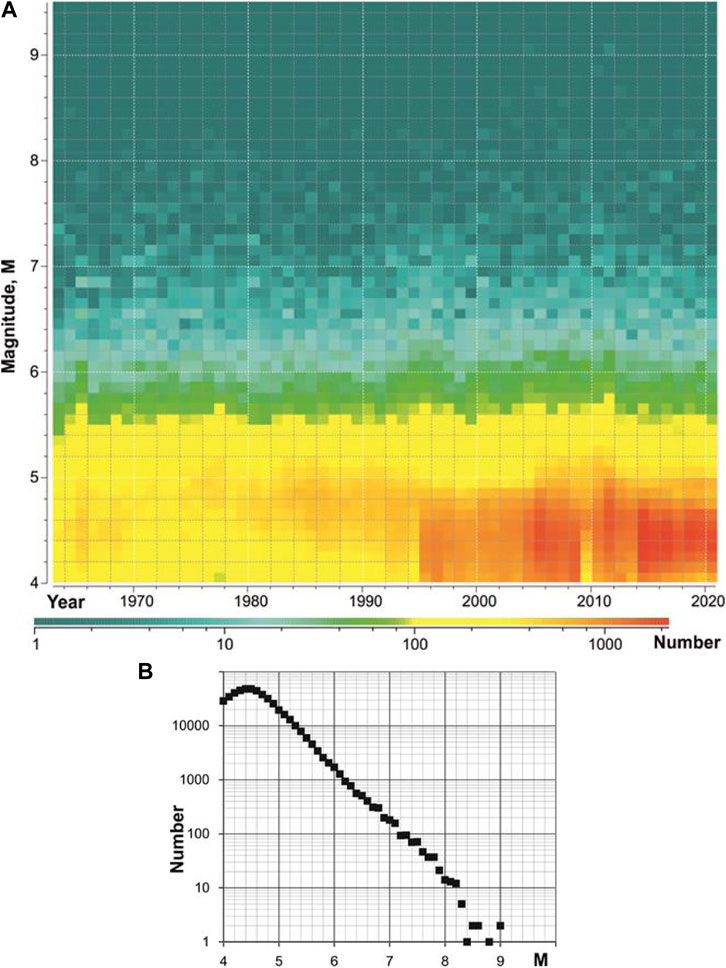
FIGURE 5. The global non-cumulative magnitude distribution by year in 1963–2020 (A) and the Gutenberg-Richter plot (B).
The coastline of Britain and the seismic locus of earthquake epicenters
The set of earthquake epicenters or, in other words, the seismic locus, has the same fractal properties as the coastline of Britain. Benoit Mandelbrot (1967) notes: “Geographical curves are so involved in their detail that their lengths are often infinite or, rather, undefinable. However, many are statistically ‘self-similar’, meaning that each portion can be considered a reduced-scale image of the whole. Indeed, self-similarity methods are a potent tool in the study of chance phenomena, wherever they appear, from geostatistics to economics and physics. Therefore, scientists ought to consider dimension as a continuous quantity ranging from 0 to infinity.”
Following the pioneering works by Mikhail A. Sadovsky (Sadovsky et al., 1982) and Keiiti Aki (Okubo and Aki, 1987), our understanding of the fractal nature of earthquakes and seismic processes has increasingly grown (Kossobokov, 2020) — along with a concomitantly scientifically revolutionary better understanding and mapping of both the Earth’s interior (Stacey and Davis, 2020), as well as of geophysical aspects of seismic waves propagation (Florsch et al., 1991; Fäh et al., 1993; La Mura et al., 2011; Iturrarán-Viveros and Sánchez-Sesma, 2020).
Naturally, or as might be expected due to hierarchical organization of the lithosphere (referring to the size-related distribution of geographical/seismological phenomena), the number of earthquakes globally, or within a region, is scaled by magnitude, according to the Gutenberg-Richter Frequency-Magnitude (FM) relation (Gutenberg and Richter, 1944; 1954). Globally, and for the time period of 58 years shown in Figure 5 the slope (so called b-value) of the plot is about 1, so that each one unit change in magnitude between M = 5 and M = 9 results in approximately a 10-fold change in the number of earthquakes; there were approximately two hundred M = 7 earthquakes compared to about twenty M = 8 and 20,000 M = 5 earthquakes.
The Gutenberg-Richter relation is a power law and can be written as log10 N = a − bM. As shown in Figure 5, this is also a Pareto distribution, or a distribution with “fat” tails, which serves as a reminder that, in SHA, outliers always do exist as “possibilities” and must therefore be duly recognized and accounted for in seismic hazard [see e.g., Kanamori (2014; 2021)].
Generalized Gutenberg-Richter relationship and unified scaling law for earthquakes
The Gutenberg-Richter relationship just shown above was further generalized by Kossobokov and Mazhkenov (1988, 1994) to the following fractal form:
where: i) N(M,L) is the expected annual number of main shocks of magnitude M within an area of linear size L; ii) the similarity coefficients A and B are similar to the a- and b-values from the classical Gutenberg-Richter law; iii) the newly added similarity coefficient C is the fractal dimension (D per Mandelbrot) of the set of epicenters; and iv) M–and M–are the limits of the magnitude range where this relationship holds. The three frequency-magnitude-spatial coefficients provide an insight into scaling properties of actual seismicity, and therefore they are of specific interest to seismologists working on seismic zonation and risk assessment.
It was shown that C is significantly different from 2, and that it correlates with the geometry of tectonic structures: i) high values of C (∼1.5) correspond to the regions of complex dense patterns of faults of different strikes and high degrees of fracturing, whereas; ii) lower values of C (∼1) are related to regions exhibiting a predominant linear major fault zone (which is consistent with rectifiable curves and straight lines, where D = 1).
Moreover, for example, in the specific case of the Lake Baikal region in the mountainous Russian region of Siberia, north of the Mongolian border (with area of 1,500,000 km2 and C = 1.25), it was demonstrated (Kossobokov and Mazhkenov, 1988; Kossobokov and Mazhkenov, 1994) that: i) the inclusion of aseismic areas leads to underestimation of seismic activity in an area of 1,000 km2 by a factor of 15; and alternatively ii) when a characteristic of seismic activity over 1,000 km2 is computed for a grid 10 km × 10 km, this leads to overestimation by a factor greater than 2.
Earlier, in order to avoid just such seismic activity bias, in a pilot study assessing seismic risk for 76 selected Largest Cities of the World in active seismic regions, Keilis-Borok et al. (1984) compared these two integral estimates: 1) the number of cities with population of one million or more affected in 30 years by strong motion of intensity I ≥ VIII; and 2) the total population in these cities — with the actual aftermaths of these past earthquakes — for reliable “validation of the results” showing specifically that: a) “available data may be sufficient to estimate the seismic risk for a large set of objects, while not for each separate object”; and b) “it indicates, that global seismic risk is rapidly increasing, presenting new unexplored problems.”
The Unified Scaling Law for Earthquakes (USLE), got its name later, when Bak et al. (2002) presented an alternative formulation from that above — making use of the inter-event time between the earthquake occurrences, instead of their annual number. Using the USGS/NEIC Global Hypocenters Data Base, 1964–2001, and a robust box-counting algorithm; Nekrasova and Kossobokov (2002) managed to map the values of A, B, and C in every 1°× 1° box on the Earth marked by record of earthquake occurrence, wherever the catalog of shallow earthquakes of M ≥ 4 permitted a reliable estimation. The results of this global mapping are available at the data repository of the International Seismological Centre (Nekrasova and Kossobokov, 2019).
The distribution of the number of seismic events by magnitudes — the Gutenberg-Richter frequency magnitude relation — is of paramount importance for seismic hazard assessment of a territory. Accordingly, the generalization of the original Gutenberg-Richter relation into the Unified Scaling Law for Earthquakes (USLE) as originally proposed in 1988 makes it possible now to take into account as well the pattern of epicentral distribution of seismic events, whenever changing the spatial scale of the analysis. This is extremely important for adequate downscaling of the frequency-of-occurrence into a smaller target area within any territory under study (e.g., into a megalopolis).
At the time, when Per Bak (Bak et al., 2002) suggested a dual formulation of USLE using the time between seismic events, the Institute of Earthquake Prediction Theory and Mathematical Geophysics of the Russian Academy of Sciences developed a modified algorithm for statistically improved, confident Scaling Coefficients Estimation (referred to as SCE) of the USLE parameters to be used for producing seismic hazard maps of territories prone to seismic effects. An updated brief review, focused on the use of the USLE approach in relation to assessment of seismic hazard and associated risks, is provided in (Nekrasova et al., 2020).
Multi-scale seismicity model
Complementary to USLE is the Multi-scale Seismicity Model (MSM) by Molchan et al. (1997). For a general use of the classical frequency-magnitude relation in seismic risk assessment, they formulated a multi-scale seismicity model that relies on the hypothesis that “only the ensemble of events that are geometrically small, compared with the elements of the seismotectonic regionalization, can be described by a log-linear FM relation.” It follows then that the seismic zonation must be performed at several scales, depending upon the self-similarity conditions of the seismic events and the log-linearity of the frequency-magnitude relation, within the magnitude range of interest. The analysis of worldwide seismicity, using the Global Centroid Moment Tensor (GCMT) Project catalog (where the seismic moment is recorded for the earthquake size) corroborates the idea and observation that a single FM relation is not universally applicable. The MSM of the FM relation has been tested in the Italian region, and MSM is one of the considered appropriate ingredients of NDSHA.
Earthquake catalogs evidence clear patterns that there exists a space-time energy distribution of seismic events because: i) earthquakes do not happen everywhere, but preferentially in tectonically well-developed highly fractured fault zones within the Earth’s lithosphere; ii) earthquake sizes follow the Gutenberg-Richter relationship, which is a surprisingly robust power law (such that, for every magnitude M event, there are ∼10 magnitude M − 1 quakes — within an area that is large enough); iii) earthquakes cluster in time — in particular, seismologists observe: a) surges and swarms of earthquakes; b) seismically driven decreasing cascades of aftershocks; and c) less evident inverse cascade (energy increase), or crescendo of rising activity in foreshocks premonitory to the main shock.
Since earthquake-related observations are generally limited to the recent-most decades (sometimes centuries in just a few rare cases), getting reasonable confidence limits on an objective estimate of the occurrence rate or inter-event times of a strong earthquake within any particular geographic location necessarily requires a geologic span of time that is unfortunately unreachable for instrumental, or even historical seismology [see, e.g., (Ellsworth, 1990; Beauval et al., 2008; Stark, 2017; 2022)]. That is why probability estimates in Probabilistic Seismic Hazard Analysis (PSHA) remain subjective values ranging between 0 and 1, derived from evidently imaginary (but enticingly both analytically and numerically tractable) unrealistic hypothetical models of seismicity.
Seismic Roulette: Nature spins the wheel!
“Look deep into nature, and then you will understand everything better”.- Albert Einstein
Regretfully, most, if not all, of earthquake prediction claims can be characterized as “invented” windmills, wherein we see the earth “not as it is”, but “as it should be” due to very small, if any, samples of clearly defined evidence! Many prediction claims are hampered at their start from the misuse of Error Diagram and its analogues — ignoring the evident heterogeneity of earthquake distributions in space as well as in time. See e.g. (Bela and Panza, 2021).
A rigorous mathematical formulation of a natural spatial measure of seismicity is given in (Kossobokov et al., 1999). This “Seismic Roulette null-hypothesis” (Kossobokov and Shebalin, 2003) (or the hypothesis that chance alone in a random process is responsible for the results) is a nice analogy for using the simple recipe that accounts for this spatial patternicity (Kossobokov, 2006a) using statistical tools available since Blaise Pascal (1623–1662):
 consider a roulette “wheel” with as many sectors as the number of events in the best available catalog of earthquakes, one sector per earthquake epicenter event;
 make your best bet according to any prediction strategy: determining which events are inside a projected space-time “area of alarm” — and then
 place one chip upon each of the corresponding sectors.
Nature then spins the “wheel”, before introducing an energized target-seeking earthquake “ball”. If you play seismic roulette systematically, then you win and lose systematically (Figure 6). If you are smart enough, and your predictions are effective, the first will outscore the second.

FIGURE 6. Seismic Roulette: Nature spins the wheel!
However, if Seismic Roulette is not perfect in confirming your betting strategy (and thus alternatively is nullifying your hypothesis), and still you are smart enough to choose an effective strategy, then your wins will outscore your losses! And after a while . . . you can then use your best wisdom, or even now an “antipodal strategy”, wherein the earthquake “prediction problem” is examined from the standpoint of decision theory and goal optimization per Molchan (2003) — so as to win both systematically and statistically self-similarly in the future bets!
The results of just such a global “betting” test of the prediction algorithms M8 and MSc did confirm such an “imperfection” of Seismic Roulette (Seismic Roulette is not perfet!) in the recurrence of earthquakes in Nature (Ismail-Zadeh and Kossobokov, 2020); but these same results still suggest placing future bets can be useful, if used in a knowledgeable way for the benefit of the populations exposed to seismic hazard. Their accuracy is already enough for undertaking earthquake preparedness measures, which would prevent a considerable part of damage and human loss, although far from the total. And fortunately, the methodology linking prediction with disaster management strategies does already exist (Molchan, 1997).
Pattern recognition of earthquake prone areas
In lieu of local seismic observations long enough for trustworthy and reliable SHA, alternatively one may try using Pattern Recognition of Earthquake-Prone Areas (PREPA) based, however, on the appropriate geological and geophysical data sets that are available. This geomorphological pattern recognition approach (Gelfand et al., 1972; Kossobokov and Soloviev, 2018) is an especially useful preparedness and mitigation tool in seismic regions that have passed validation: i) first, by exhaustive retrospective testing; and then ii) by the decisive confirmation check afforded by actual strong earthquakes that have occurred. Validity of this pattern recognition PREPA methodology has been proven by the overall statistics of strong earthquake occurrences — after numerous publications of pattern recognition results encompassing both many seismic regions and also over many magnitude ranges (see Gorshkov et al., 2003; Gorshkov and Novikova, 2018 and references therein).
Those who can’t model are doomed to reality!
One application of PREPA deserves a special comment. Regional pattern recognition problems solved by Gelfand et al. (1976) treated two different sets of natural recognition objects for the two overlapping regions: i) regularly spaced points along major strike-slip faults in California; and ii) intersections of morphostructural lineaments in California and adjacent territories of Nevada (Figure 7). They then drew from these the qualitative conclusion that areas prone to M ≥ 6.5 are characterized by proximity to the ends (or to intersections) of major faults, in association with both: a) low relief; and b) often also with some kind of downward neotectonic movement expressed in regional topography and geology — with their conclusion further supported by both PREPA classifications: i) points; and ii) intersections — wherein the same five groups of earthquake-prone areas show up in both cases. Slight differences are due to the fact that the study of intersections covers a larger territory. This supports the idea derived from recognition of points — that strong earthquake-prone intersections often associate with neotectonic subsidence on top of a background weak uplift.

FIGURE 7. Circular 40-km radius outlines of the D-intersections of morphostructural lineaments in California and Nevada and epicenters of magnitude 6.5+ earthquakes before (black stars) and after (red stars with names) publication in 1976 (Gelfand et al., 1976).
As evident from Figure 7, the PREPA termless prediction for California and Nevada has been statistically justified by the subsequent occurrence of 16 out of 17 magnitude 6.5+ earthquakes within a narrow vicinity of the 73 Dangerous D-intersections of morphostructural lineaments (union of yellow circles in Figure 7) determined by Gelfand et al. (1976) as prone to seismic events that large. The target earthquakes included the recent-most 15 May 2020, M6.5 Monte Cristo Range (NV) earthquake and 6 July 2019, M7.1 Ridgecrest (CA) main shock, i.e., the one exceptional near-miss within the study area since 1976. In fact, the first day cascading aftershocks for this event, as well as the entire 2019 Ridgecrest earthquake sequence, extend to the D-intersection. It is also notable that the Puente Hills thrust fault beneath metropolitan Los Angeles coincides exactly (Kossobokov, 2013) with the lineament drawn back in 1976, decades in advance of its “rediscovery” by the 1994 Northridge Earthquake (Shaw and Shearer, 1999).
Finally (and importantly for seismic hazard assessment), PREPA is a readily available hazard-related quantity that can be naturally included in NDSHA, while so far, no comparable way exists to formulate a direct use for it within PSHA — wherein earthquake “possibilities” are instead viewed temporally by Senior Seismic Hazard Analysis Committee (SSHAC, 1997) of the United States Nuclear Regulatory Commission as “annual frequencies of exceedance of earthquake-caused ground motions [that, however] can be attained only with significant uncertainty.” Therefore, ahem . . . those who can’t model are doomed to reality!
Seismic hazard and associated risks
“At half-past two o'clock of a moonlit morning in March, I was awakened by a tremendous earthquake, and though I had never before enjoyed a storm of this sort, the strange thrilling motion could not be mistaken, and I ran out of my cabin, both glad and frightened, shouting, "A noble earthquake! A noble earthquake!" feeling sure I was going to learn something.”John Muir, The Yosemite, Chapter 4
Ground shaking may be frightening, but it may not necessarily kill people. For example, the earliest reported earthquake in California was on 28 July 1769, and was documented in diaries by the exploring expedition of Gaspar de Portola, enroute from San Diego to chart a land route to Monterey. While camped along the Santa Ana River, about 50 km southeast of Los Angeles, “a sharp earthquake was felt that ‘lasted about half-as-long as an Ave Maria.” Based on descriptions of the quake, it was likely a moderate or strong earthquake. Some described the shaking in expedition diaries as violent, and occurring for over the next several days, suggesting aftershocks. Although the magnitude and epicenter are unclear, by comparing these descriptions with more recent events, the quake may have been similar to the M 6.4 1933 Long Beach or the M 5.9 1987 Whittier Narrows earthquake (https://geologycafe.com/california/pp1515/chapter6.html#history).
The exploring party, personally uninjured and unimpeded in this M 5–6 earthquake event, noted not that the region portended high seismic hazard and landslide risk, but instead benignly rather that it appeared to be a good place for agriculture!
“Earthquakes do not kill people, buildings do!” is a long-time refrain in the world of seismic hazard preparedness and earthquake engineering or do they? While inadequately designed and poorly constructed buildings, infrastructure and lifeline systems can kill people (Gere and Shah, 1984; Bilham, 2009), tsunamis and landslides are directly triggered earthquake phenomena that tragically do kill people, as well!
Therefore, for reliably assessing the hazard and estimating the risk that a population is exposed to, one needs to know the possible distribution of earthquakes large enough to produce a primary damage state. The global map of the maximal magnitude (Mmax) observed during the last 57 years, as portrayed within 2.4° × 2.0° grid cells (Figure 8) could be used for this purpose, as a very rough approximation.

FIGURE 8. The global map of the reported maximal magnitude, Mmax, in 1963–2020.
Earthquake vulnerability, intensity and disaster
An earthquake of about M ∼ 5 (Intensity VI on the MMI scale), may cause slight damage (if any) to an ordinary structure located nearby the epicenter; and therefore, cannot produce any significant loss. On the other hand, a strong earthquake (M 6.0–M 6.9) may result in a real disaster — as has happened on several occasions in the past. See e.g., the M 6.3 L’Aquila Earthquake of 6 April 2009 (Alexander, 2010).
For example, the 21 July 2003, M 6.0 Yunnan (China) earthquake and induced landslides: i) destroyed 264,878 buildings; ii) damaged 1,186,000 houses; iii) killed at least 16 people; and iv) injured 584. Moreover, v) a power station was damaged; vi) roads were blocked; and vii) 1,508 livestock were killed in the province. The resulting damage due to direct and indirect losses (consequences) of this earthquake was estimated at ∼ 75 million United States dollars. So, this is a rare case when a shallow M 6 earthquake (one at the fringe of the smallest threshold of potentially hazardous earthquakes) occurred at both a location and also at 23:16 local time that together unfortunately combined maximum Vulnerability × Exposure of the province (i.e., slopes prone to failure; buildings, houses, etc., that could not withstand the shaking; dense population at home; and livestock still sheltered in their facilities).
Half of a clock face on Modenesi’s Towers of Finale Emilia, Ferrara, Italy (Figure 9) — destroyed following an earthquake and aftershocks May 20–29, 2012. Felt Intensities exceeded VII, as depicted on the clock face after the main shock. It was the first strong earthquake “anywhere nearby” since the Ferrara quake of 1570. The relatively small number in only 7 fatalities, when a strong and unusually shallow M 6 earthquake struck the Emilia Romagna region of northern Italy, is connected with the event’s occurrence time at just after 4 a.m. — fortuitously very early on that Sunday morning 20 May 2012 — on account of the fact that “the affected region is home to countless historic churches, castles, and towers — many of which were damaged or toppled.” With so many vulnerable churches collapsed or severely damaged, an origin time in the late morning might have easily claimed hundreds of victims from worshipers participating in religious ceremonies (Panza et al., 2014).
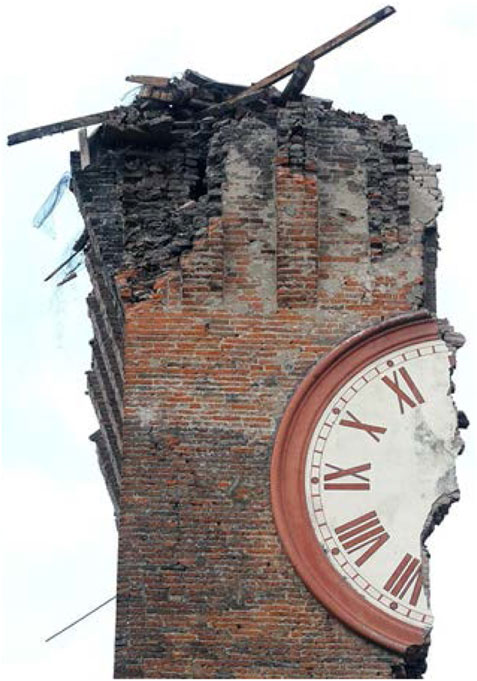
FIGURE 9. Time and earthquake wait for no man.
The world’s deadliest earthquakes since 2000
Table 1 lists all eighteen of the World’s deadliest earthquakes since the year 2000 — where the number of fatalities in each case exceeded one thousand. Remembering the earlier comment by Ellsworth (1990), i.e., that “earthquakes are complex physical processes generated by sudden slip on faults, and as such they can only be grossly characterized by simple concepts.” — we note that the magnitude of any one of these disastrous events has a poor correlation with the loss of lives: i) the two deadliest earthquakes, namely, the M 9.0 Indian Ocean disaster of 2004, and the M 7.3 Haiti earthquake of 2010, differ in seismic energy by a factor >350 — but resulted in roughly the same death tolls of above 200,000 people; while ii) the death toll of a later occurring M 9.1 mega-thrust earthquake and tsunami off the coast of Tōhoku (Japan) in 2011 was 2 times lower than that for the strong crustal earthquake of only M 6.6 in Bam (Iran). See also (Bela, 2014) and references therein.
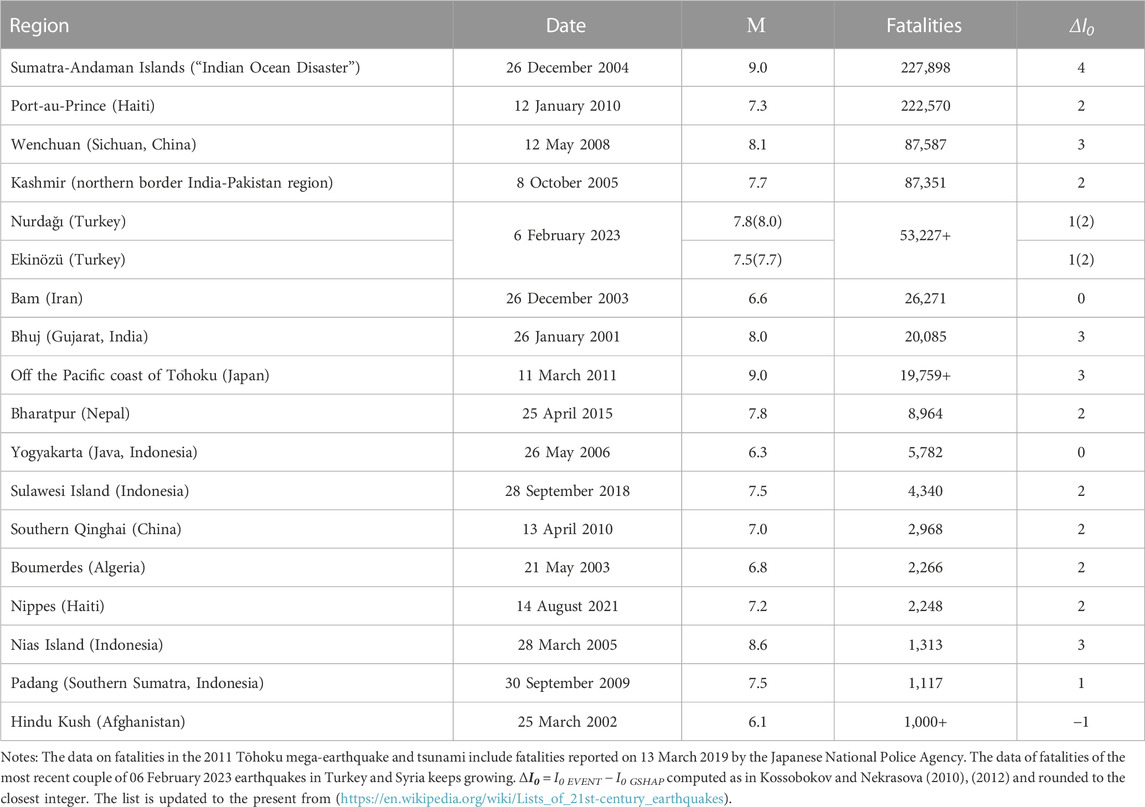
TABLE 1. Top deadliest earthquakes since 2000 of at least 1,000+ fatalities including victims of tsunami and other associated effects.
There is one single case showing a negative value ΔI0 that refers to the smallest of these 18 deadliest earthquakes: the M 6.1 earthquake that struck Hindu Kush (Afghanistan) on 25 March 2002 causing 1,000 + fatalities. A larger M 7.4 deep earthquake (at 200 + km depth) and at distance greater than 150 km, occurred within less than a month on 03.03.2002, causing at least 150 fatalities. The last column in Table 1 shows the difference ΔI0 between the real Macroseismic Intensity I0 EVENT and that predicted by the GSHAP Map I0 GSHAP. These computed ΔI0 = I0 EVENT − I0 GSHAP values are (in all but one case) positive — with their median value of 2.
Seismic hazard mapping
An accurate characterization of seismic hazard at local scale requires use of detailed geologic maps of both active faults and past earthquake epicenter determinations. The typical seismic hazard assessment undertaken strives to provide a preventive determination of the ground motion characteristics that may be associated with future earthquakes — at regional, local, and even urban scales (Panza et al., 2013).
The first scientific seismic hazard assessment maps were deterministic in scope, and they were based on the observations that primary damage: i) decreases generally with the distance away from the earthquake source; and ii) is often correlated with the physical properties of underlying soils at a particular site, e.g., rock and gravel. In the 1970s, after publication of Engineering Seismic Risk Analysis by Alin Cornell (1968), the development of probabilistic seismic hazard maps became first fashionable, then preferred, and finally “required” — so that in the 1990s the probabilistic mapping of seismic hazard came to prevail over the heretofore deterministic cartography. For a chronologic history (and a Bibliographic Journey of that history), see in particular (Nishioka and Mualchin, 1996; 1997; Hanks, 1997; Bommer and Abrahamson, 2006; McGuire, 2008; Mualchin, 2011; Panza and Bela, 2020, especially Supplementary Material therein).
Global Seismic Hazard Assessment Program (GSHAP) 1992–1999
In particular, a widespread application of PSHA began when the Global Seismic Hazard Assessment Program (GSHAP) was launched three decades ago in 1992 by the International Lithosphere Program (ILP) with the support of the International Council of Scientific Unions (ICSU), and also endorsed as a demonstration program within the framework of the United Nations International Decade for Natural Disaster Reduction (UN/IDNDR). The GSHAP project terminated in 1999 (Giardini, 1999) with publication of the final GSHAP Global Seismic Hazard Map (Giardini et al., 1999).
However, following a number of publications critical of the PSHA technoscience paradigm, e.g., (Krinitzsky, 1993a; Krinitzsky, 1993b; Krinitzsky, 1995; Castanos and Lomnitz, 2002; Klügel, 2007; see also Udias, 2002), and pivotably the catastrophic 2010 Haiti earthquake, a systematic comparison of the GSHAP peak ground acceleration (PGA) estimates with those related to the actual earthquakes that had occurred disclosed gross inadequacy of this “probabilistic” product (Kossobokov, 2010a). The discrepancy between: a) the PGA on the GSHAP map; and b) accelerations at epicenters of 1,320 strong (M ≥ 6.0) earthquakes that happened after publication of the 1999 Map appeared to be a disservice to seismic zonation and associated building codes adopted in many countries on both national or regional scale (see Bommer and Abrahamson, 2006 and references therein). For fully half of these earthquakes, the PGA values on the map were surpassed by 1.7 m/s2 (0.2 g) or more within just 10 years of publication, which fact (of exceeding more than 50% of the PSHA hazard map values within just 10 years) evidently contradicts the GSHAP predicted “10% chance of exceedance in 50 years” — for the ground motion contours displayed on the map.
These problematic GSHAP results were naturally reported to a wide geophysical community at the Euroscience Open Forum (ESOF 2010) session on “Disaster prediction and management: Breaking a seismo-ill-logical circulus vitiosus”, and also at the Union sessions of the Meeting of the Americas and the American Geophysical Union (AGU) 2010 Fall Meeting (Kossobokov, 2010b; Kossobokov, 2010c; Kossobokov and Nekrasova, 2010; Soloviev and Kossobokov, 2010); and later at the EGI Community Forum (EGICF12) by Peresan et al. (2012a). Then, with finally the 11 March 2011, Mw 9.0 Tōhoku mega-earthquake and tsunami disaster, it became absolutely clear that the GSHAP Probabilistic Seismic Hazard Analysis—despite parascientific apologetics of its “legacy” advocated by Danciu and Giardini (2015) — is UNACCEPTABLE FOR ANY KIND OF RESPONSIBLE SEISMIC RISK EVALUATION AND KNOWLEDGEABLE DISASTER PREVENTION (Kossobokov and Nekrasova, 2012). See, e.g., (Wyss et al., 2012; Mulargia et al., 2017).
Unsurprising surprises
While, “like Sumatra in 2004, the power of the Tōhoku earthquake in 2011 took us by surprise (Wang, 2012)”, and made us question: “After decades of scientific research, how well or how badly are we doing in understanding subduction earthquakes?” ... In retrospect, the Tōhoku earthquake and its tsunami were consistent with what we had learned from comparative studies of different subduction zones–and therefore, “despite its wrenching pain”, the cascading 2011 Tōhoku Mw 9.0 Megathrust Earthquake — Tsunami — Fukushima Disaster (from both an earth and tsunami science perspective) was an “Unsurprising Surprise!”
The last column in Table 1 shows the difference ΔI0 between the real Macroseismic Intensity I0 EVENT and that predicted by GSHAP I0 GSHAP, which values are all (but one case) positive with average and median values of about 2! The same holds as well for all M ≥ 7.5 earthquakes, including the most recent 6 February 2023 coupled earthquakes in Turkey. This underestimation by two units on MMI scale can mean an event experience of “severe damage in substantial buildings with partial collapse” instead of a GSHAP forecast “highly likely” intensity of “slight damage to an ordinary structure.”
Moreover, it should be noted that, in common sense, such a poor performance of the GSHAP product could have already been found at the time of its 1999 publication, and this should have been done by the contributors to the Program as the first order validation test of the GSHAP final map! The claim of a 10% chance of exceedance in 50 years is violated already in 1990–1999 for more than 40% of 2,200 strong M ≥ 6.0, for 94% of 242 significant M ≥ 7.0, and 100% for major M ≥ 7.5 earthquakes (Kossobokov and Nekrasova, 2012)! Note also that GSHAP directly overlapped the time when it was openly realized and discussed by the earthquake engineering community that “10% probability of exceedance in 50 years was too risky for a life-safety criterion” in the United States Building Codes (Frankel et al., 1996) — because earthquake-resistant design standards, when scaled to 10% in 50 years hazard curve ground motions, were insufficient protection when damaging major and great earthquakes did inevitably occur!
Synthetic seismograms: Increasing the reliability of seismic hazard assessment
On the other hand, with our current knowledge of the physical processes of both earthquake generation and seismic wave propagation in anelastic attenuating media, we can increase the reliability of seismic hazard assessments by basing them instead on computation of synthetic seismograms — in terms of a more realistic modeling of ground motion (see e.g., Panza, 1985; Fäh et al., 1993; Panza et al., 1996; Panza et al., 2001; Panza and Romanelli, 2001; Paskaleva et al., 2007; Peresan et al., 2012b).
NDSHA, which is immediately falsifiable by the occurrence of a damaging event with magnitude exceeding the predicted threshold, has so far been validated in all regions where hazard maps prepared under its methodology have existed at the time of later strong or larger occurring earthquakes. PSHA, by providing a minimum ground motion that has a commonly 10% or 2% chance of exceedance in 50 years in its hazard model, is therefore not falsifiable at the occurrence of any single event that far exceeds this minimum ground motion value, as shown in Table 1.
Furthermore, such ambiguity (authoritatively calculated and endorsed) also provides a legal shield against both “unsurprising surprises”, as well as any responsibilities for ensuring satisfactory outcomes to civil populations for any such presumed unlikely and rare events–on the part of administrators, politicians, engineers and even scientists (e.g., “the L’Aquila Trial,” as previously mentioned).
Finally, there are existing algorithms for the diagnosis of “times of increased probability” (TIP) that have also been proven reliable in the long-lasting and on-going earthquake prediction experiment that began in 1985 (Kossobokov et al., 1999; Kossobokov and Shebalin, 2003; Kossobokov, 2013) and these can deliver an intermediate-term Time and middle-range Space component to the newer Neo-Deterministic NDSHA approach in a more targeted public-safety centered evaluation of seismic hazard (Peresan et al., 2011; Peresan et al., 2012a). In some cases, additional geophysical observations can further help in reducing the spatial uncertainty to the narrow-range about tens of kilometers, e.g., (Crespi et al., 2020).
Advanced seismic hazard assessment
The results by Wyss et al. (2012) regarding “Errors in expected human losses due to incorrect seismic hazard estimates” are well in line with the two Topical Volumes Advanced Seismic Hazard Assessment edited by Panza et al. (2011), which supply multifaceted information on the modern tools for Seismic Hazard Assessment (SHA).
The contributors to these special issues make clear the significant differences between hazard, risk, hazard mitigation, and risk reduction (Klügel, 2011; Peresan et al., 2011; Wang, 2011; Zuccolo et al., 2011), which are of paramount importance as the critical arguments toward revising fundamentally our present existing hazard maps, risk estimates, and engineering practices.
All ideas have consequences. Therefore, any Standard Method must be Reliable in the first place! That is, it must be: a) good; b) right; and c) true! It must consider: i) the fragility of the local built environment; ii) soil conditions; and iii) furnish now far more informative risk/resiliency assessments of cities and metropolitan territories (Paskaleva et al., 2007; Trendafiloski et al., 2009). The consequences of the Maximum Credible Earthquake (MCE) should be the criteria for Reliable Seismic Hazard Assessment (RSHA), because “what can happen” is a more important consideration than “what gets approved” based on a hazard model (see again Kanamori, 2014, 2021). Incidentally, we note that MCE as practiced in NDSHA (per Rugarli et al., 2019) supplies for Japan an enveloping magnitude M 9.3.
Backward into the future!
In spite of both: i) the numerous evidenced shortcomings of PSHA (see Stein et al., 2012; Wyss and Rosset, 2013 for a comprehensive discussion); and ii) its unreliable and poor performances — PSHA (emboldened now by 50 years of dangerous “sincere ignorance and conscientious stupidity”) is still widely applied at regional and global scale “to continue the vision of a global seismic hazard model” (Danciu and Giardini, 2015; Gerstenberger et al., 2020; Meletti et al., 2021). Regretfully, the Global Earthquake Model project (GEM, http://www.globalquakemodel.org/) is evidently still on the preferred “circulus vitiosus” — a situation in which the solution to a problem creates another problem. Recently, the GEM Foundation released Global Seismic Hazard Map (version 2018.1) that depicts the geographic distribution of the PGA “with a 10% probability of being exceeded in 50 years” and makes the same fatal errors of the GSHAP 1999 PSHA map — see also “Development of a global seismic risk model” (Silva et al., 2020).
In the recent AGU Reviews in Geophysics article, entitled “Probabilistic Seismic Hazard Analysis at Regional and National Scales: State of the Art and Future Challenges,” Gerstenberger et al. (2020): i) keep advocating the evident misuse of statistics by attributing any exposure of the fundamental flaws of PSHA (e.g., Castanos and Lomnitz, 2002; Klügel, 2007; Mulargia et al., 2017; Stark, 2017, 2022; Panza and Bela, 2020, etc.) to “subjective experts’ judgment”; and ii) keep ignoring both — a) the systematic failures-to-predict the magnitude of exceedance (Kossobokov and Nekrasova, 2012; Wyss et al., 2012; Wyss and Rosset, 2013; Wyss, 2015); as well as b) the already two-decades-long existing and much more reliable alternative of the neodeterministic approach (Panza et al., 2012; Panza et al., 2014; Kossobokov et al., 2015a; Nekrasova et al., 2015a; Kossobokov et al., 2015b).
The PSHA’s “State of the Art and Future Challenges” (which more correctly should have been alternatively released under the technoscience warning label “Reviews in Risk Modeling for Hazards and Disasters”, rather than a true scientific oriented “Reviews in Geophysics”) purposely “sincerely” missed referencing “NDSHA: A new paradigm for reliable seismic hazard assessment” (Panza and Bela, 2020), published online already about 2 months prior to the Gerstenberger et al. (2020) acceptance date (10 January 2020) and ignored as well Advanced Seismic Hazard Assessment, which was published in Pure and Applied Geophysics already 9 years prior (Panza et al., 2011).
Furthermore, Jordan et al. (2014) have referenced (Peresan et al., 2012a), which reference fully reveals the qualities, attributes, and applicability of NDSHA to “Operational earthquake forecast/prediction” with direct attention called in the Abstract to the “very unsatisfactory global performance of Probabilistic Seismic Hazard Assessment at the occurrence of most of the recent destructive earthquakes.” Peresan et al. (2012a, p. 135) also discuss in detail the “Existing operational practice in Italy,” which has been “following an integrated neo-deterministic approach” since 2005.
Supplementary Material in (Panza and Bela, 2020): Bibliographic Journey To A New Paradigm, provides detailed references in their chronologically developing order, so that one can see PSHA and NDSHA publications side-by-side over now more than two decades — as NDSHA effectively “built a new model that made the existing model obsolete!” Finally, one of just a few references critical of PSHA that were surprisingly included by Gerstenberger et al. (2020) did manage to state with absolute clarity: “Reliance on PSHA for decisions that affect public safety should cease” (Wyss and Rosset, 2013)!
Seismic Roulette is a game of chance
Seismic Roulette is a game of chance! It is true that we gamble against our will, but that does not make it any less of a game! Disastrous earthquakes are low-probability events locally; however, in any of the earthquake-prone areas worldwide, they reoccur as “unsurprising surprises” with certainty, i.e., with 100% probability sooner or later! Should we then synchronize our watches and historic clock towers. And then wait for another decade, while “Nature spins the wheel”, to find out that GEM is as wrong as GSHAP?
The Neo-Deterministic Seismic Hazard Assessment (NDSHA) methodology (Fäh et al., 1993; Panza et al., 2012; Peresan et al., 2012a; Bela and Panza, 2021; Panza and Bela, 2020 and references therein) has demonstrated its abilities to serve as the Standard Method for Reliable Seismic Hazard Assessment (RSHA). NDSHA, proposed some 20 years ago (Panza et al., 1996; Panza and Romanelli, 2001), has proven to both reliably and realistically simulate comprehensive sets of hazardous earthquake ground motions throughout many regions worldwide. NDSHA, in making use of: i) our present-day comprehensive physical knowledge of seismic source structures and processes; ii) the propagation of earthquake waves in heterogeneous anelastic media; and iii) site conditions — effectively accounts for the complex, essentially tensor nature of earthquake ground motions in the affected area. Therefore, NDSHA applications provide realistic synthetic time series of ground shaking at a given place, when the best available distribution of the potential earthquake sources can be used for scenario modelling.
Conservative estimates of the maximum credible seismic hazard are obtained when they are based on the actual empirical distribution of earthquake characteristics — supplemented further with i) the existing geologic, tectonic, macro- and paleo-seismic evidence, ii) the results of PREPA, and iii) the implications of USLE, accounting for the local fractal structure of the lithosphere. In fact, USLE allows for a comparison between PSHA and NDSHA by providing reliable estimates of PGA values associated with model earthquakes of maximal expected magnitude within 50 years (Nekrasova et al., 2014; Parvez et al., 2014; Nekrasova et al., 2015a; Nekrasova et al., 2015b; Kossobokov et al., 2020), it has been comparatively demonstrated that the NDSHA maps that use such estimates outscore GSHAP generated PSHA maps in identifying correctly the sites of moderate, strong, and significant earthquakes.
Specifically, the number of unacceptable errors (when PGA on a hazard map at the epicenter of a real earthquake is less, by factor 2 or greater, than PGA attributed to this earthquake) is several times larger for the GSHAP map than for the NDSHA — USLE derived map (e.g., PGA is 11.4, 1.7, and 2.5 times larger for strong earthquakes in Himalayas and surroundings, Lake Baikal region, and Central China, respectively, than on the GSHAP PGA hazard map). This cannot be attributed solely to the difference of the empirical probability distributions of the model PGA values within a region, although evidently the USLE model favors larger estimates in the Baikal and Central China regions. Note that at the regional scale of investigation, the GSHAP estimates of seismic hazard can be grossly underestimated in the areas of sparse explorations of seismically active faults, such as those to the east of the upper segment of the Baikal rift zone.
Earthquake prediction
“Science has not yet mastered prophecy. We predict too much for the next year and yet far too little for the next ten.”Neil Armstrong(Speech to a joint session of Congress, 16 September 1969)
The terms “Earthquake Forecast/Prediction” described in this section are focused primarily on Operational Earthquake Forecasting (OEF) and mean: i) first specifying the time, place, and energy (as a rule in terms of magnitude) of an anticipated seismic event with sufficient accuracy/precision to then ii) provide authoritative warning to those responsible for the undertaking of civil preparedness actions intended to: a) reduce loss-of-life and damage to property; and b) mitigate disruption to life lines and social fabric (i.e., harden community resilience).
Some distinguish forecasting as prediction supplemented with probability of occurrence (Allen, 1976; NEPEC, 2016). In common everyday language, however, “forecast” and “prediction” are synonymous to the public when they are referring to earthquake phenomena — at least from a practical awareness and actionable viewpoint. Note, however, that estimates of earthquake probability or likelihood are the result of one’s usually subjective deterministic choice of probability model — which might mislead personal belief away from the actual phenomena under study (Gelfand, 1991).
In J.R.R. Tolkien’s fantasy adventure “The Hobbit: An Unexpected Journey” — the “necessity of identifying risk in any thorough plans in life” is underscored in making reference to the actual phenomenon: “It does not do to leave a live dragon out of your calculations, if you live near him.”
Therefore, earthquake forecast/prediction is neither an easy nor a straight-forward task (but rather an unexpected journey) and therefore implies both an informed as well as a delicate application of statistics (Vere-Jones, 2001). Whenever the problems are very broad, as they particularly are here in the earthquake realm of geophysics and the earth sciences — it is always very important to distinguish the facts from the assumptions, so that one can fully understand the limitations of the assumptions, as a scientific safeguard against committing the equivalent of geophysical malpractice (see P.B. Stark’s “Thoughts on applied statistics” at https://www.stat.berkeley.edu/users/stark/other.htm).
Regretfully, in many cases of Seismic Hazard Assessment (SHA): from i) time-independent (term-less); to ii) time-dependent probabilistic (PSHA); from iii) deterministic (DSHA, NDSHA); to also iv) Short-term Earthquake Forecasting (StEF) — since the claims of a high potential success of the prediction method are based on a flawed application of statistics, they are therefore hardly suitable for communication to responsible decision makers.
Making SHA claims (either time-independent or time-dependent) quantitatively probabilistic in the “frames” of the most popular objectivists’ viewpoint on probability (i.e., objective chance) — requires a long series of “yes/no” trials, which however cannot actually be obtained without an extended and rigorous testing of the method predictions against real (live) observations. Moreover, as pointed out by Stark (2017), (2022), the distinction between ‘random’, ‘haphazard’, and ‘unpredictable’ is crucial for scientific inference and applications in practice (see, e.g., Chipangura et al., 2019).
Predicting the unpredictable
By the 1980s, the lithosphere of the Earth was recognized as a complex hierarchically self-organized non-linear dissipative system, with critical phase transitions manifested through larger earthquakes (Keilis-Borok, 1990) (see also more recent Wang et al., 2018; Bedford et al., 2020). Mathematically, the characteristics of such haphazard, apparently chaotic systems are nevertheless predictable up to a certain limit, and after substantial averaging (e.g., as in the abovementioned Keilis-Borok et al., 1984). Therefore, a “success” in forecasting disastrous earthquakes necessarily implies a successive step-by-step determination that narrows down the time interval, location area, and magnitude range of any incipient earthquake.
So far, none of the proposed short-term precursory signals have shown sufficient evidence to be used as a reliable precursor ahead of large impending earthquakes (Wyss, 1991; Wyss, 1997; Sornette et al., 2021). For example, when testing the West Pacific short-term forecast of earthquakes with magnitude MwHRV ≥5.8 of Jackson and Kagan (1999) against the catalog of earthquakes in the period from 10 April 2002 through 13 September 2004, the conclusion was drawn by Kossobokov (2006b) that the underlying method could be used for prediction of aftershocks, while it however does not outscore Seismic Roulette random guessing — when main shocks are considered. Note that the attribute “short-term” in (Jackson and Kagan, 1999) appears rather misleading, because even for reasonably small values of an alerted space-time volume, some places can remain at “short-term” alert for years.
Short-Term Earthquake Probability (STEP)
The unfortunately poor performance of another Short-Term Earthquake Probability (STEP) model (based on earthquake clustering) by Gerstenberger et al. (2005) could have been anticipated before making operational the United States Geological Survey web site service, as well as the solicited publication announcement in Nature; Kossobokov (2005); Kossobokov (2006a), based on the 15 years of seismic record statistics provided in “Real-time forecasts of tomorrow’s earthquakes in California” by Gerstenberger et al., presented a “half-page proof” that suggests rejecting with confidence above 97% “the generic California clustering model” used in calculation of forecasts of expected ground shaking for tomorrow. The poor performance of STEP was eventually later further confirmed by Kossobokov (2008), because: in 1,060 days operation of the real-time forecasting, the five earthquakes of MMI ≥ VI in California occurred alternatively in the areas of the web-site’s lowest-risk (about 1/10,000 or less), while the extent of the observed areas of intensity VI for these events (about 100 cells in total) is by far less than the model expected value (about 850 cells). “A website, showing daily ground-shaking probabilities in California, was subsequently removed because of coding problems” (Cartlidge, 2014).
Accuracy of short-term earthquake forecast/prediction tools
Recently Zhang et al. (2021) apply the Error Diagram (Molchan, 1997; Molchan, 2003), weighted by an analogue of Seismic Roulette, to conclude that the correspondence between earthquakes and thermal infrared (TIR) anomalies, widely observed in decades of satellite imagery, is proven “absent” — because the claims for such are based on a uniform distribution of epicenters that they judge to be inadequate for an appropriate measure of the alarm [see also: Preface; Editors’ Introduction discussion on “Statistical Models and Causal Inference” in (Collier et al., 2010)].
In their reviews of the state of knowledge in the field of earthquake forecast/prediction — neither Jordan et al. (2011), nor Sornette et al. (2021) found any reliable methods for a short-term Operational Earthquake Forecasting (OEF) — but acknowledge that the deterministic pattern recognition approach is reliably efficient at: i) intermediate-term time scale of a few years; and ii) middle-range distance encompassing areas of a few target earthquake-source dimensions in diameter (see also Kossobokov, 2006a; Kossobokov, 2014; Ismail-Zadeh and Kossobokov, 2020; Kossobokov and Shchepalina, 2020).
For three decades the deterministic earthquake prediction algorithms have made use of clustering in seismic sequences, observable at different magnitude-space-time scales. For example, the M8 Algorithm (Keilis Borok and Kossobokov, 1990; Healy et al., 1992; Ismail-Zadeh and Kossobokov, 2020) diagnoses the “Time of Increased Probability” (TIP) from a multi-parametric analysis of a local system of blocks-and-faults in the traditional “phase space” of rate and rate differential — supplemented with earthquake-specific measures of earthquake source concentration and clustering. However, the M8 algorithm does not provide probability value, but rather a pattern of its increase above the level sufficient for efficient prediction of target earthquakes.
After these many decades of rigid real time testing of both the validity and reliability of Global M8 predictions (Ismail-Zadeh and Kossobokov, 2020; Kossobokov and Shchepalina, 2020) and Regional CN algorithm predictions for Italy (Peresan et al., 2005) have been confirmed with a high statistical confidence (Peresan, 2018; Kossobokov, 2021).
Therefore, the accuracy of these forecasting/prediction tools is sufficiently proven for efficiently undertaking precautionary civil earthquake preparedness measures. The theoretical framework for optimization of disaster preparedness measures, undertaken in response to reliable earthquake forecast/prediction, was developed under supervision of Leonid V. Kantorovich, the 1975 Nobel Laureate in Economic Sciences (Kantorovich et al., 1974; Kantorovich and Keilis-Borok, 1991).
Davis et al. (2012) have shown further that prudent and cost-effective actions can be wisely undertaken, if the prediction certainty is known but not necessarily high. For example, the huge losses from the 6 Fukushima Nuclear Power Plants were on the order $100 billion, while the preventive costs of raising tsunami wall height, plus that of protective housing for generators to resist the potential flooding, were only about $10 million. As an epilogue (reminiscent of “the L’Aquila Trial”), in 2020 (https://www.theguardian.com/environment/fukushima) a “Japanese court found the government and TEPCO, the operator of the wrecked Fukushima nuclear plants, negligent for failing to take measures to prevent the 2011 nuclear disaster, and ordered them to pay 1 bn yen ($9.5 million) in damages to thousands of residents for their lost livelihoods.” Therefore, taking these preventative actions, as detailed by Davis et al. (2012), in response to the intermediate-term (Time) and middle-range (Space) prediction that was communicated to Japanese authorities in mid-2001 would have been cost-effective for the Fukushima nuclear power plants, even if the prediction had had a whopping 99.99% chance of being false alarm!
Therefore, is a “Likely Impossibility” (or leaving a live dragon out of your calculations), a safe bet on which to place chips in Seismic Roulette 00? a) “In court, the government argued it was impossible to predict the tsunami or prevent the subsequent disaster”; and b) “The court said that the government could have taken measures to protect the site, based on expert assessments available in 2002 that indicated the possibility of a tsunami of more than 15 m.”
Operational earthquake forecasting
In the Realm of Operational Earthquake Forecasting (OEF), which is “the dissemination of authoritative information about time-dependent earthquake probabilities to help communities prepare for potentially destructive earthquakes” (Jordan et al., 2014), within the broader OEF scheme shown in Figure 10, we believe one should try to use all reliable Geophysical Information, including but not limited to: i) Earthquakes; ii) GPS; iii) Gravity; iv) Electro-magnetic; and v) Geochemical input that might be relevant to origination of damaging ground shaking.
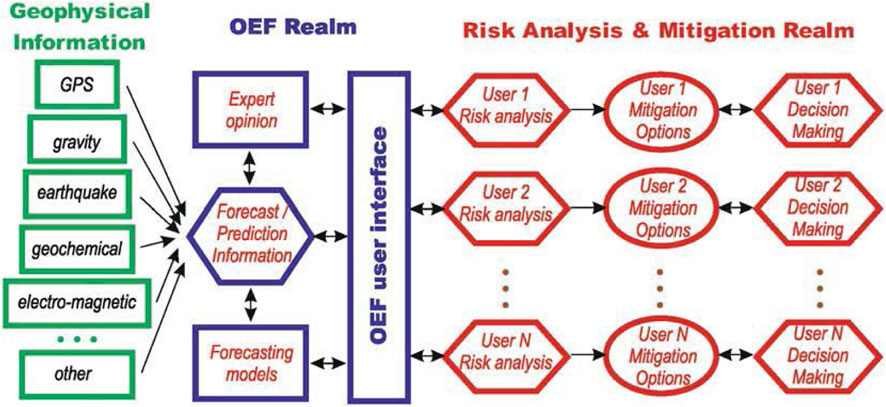
FIGURE 10. Operational Earthquake Forecasting scheme.
This would allow for a true multi-disciplinary forecast/prediction so much needed in practice. Forecasting Information must be reliable, tested, and confirmed by evidence (Allen, 1976; Kossobokov et al., 2015b), such that the heretofore probabilistic-centered models (which have been focused primarily on “expert opinion” and weighting of different subjective “models of seismicity”) defer now rather to a more collaborative practice of “expert judgement”, which is incorporating all of the above forecasting requirements, and as is more simply illustrated in Figure 11. Ideally, good judgement comes from experience; and not from bad judgement and failed policy disasters, such as experienced at L’Aquila and Fukushima!
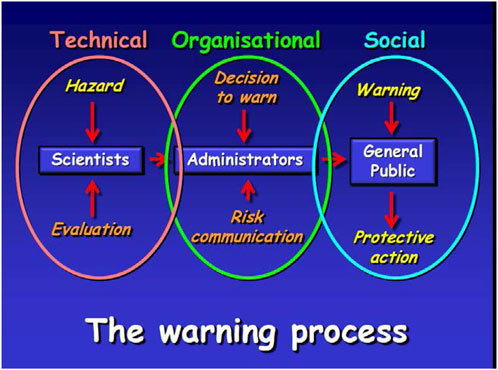
FIGURE 11. The technical NDSHA warning process. Source courtesy of David Alexander.
Seismology and computer science alone are not enough for a successful collaboration aimed at effective forecasting of larger earthquakes. OEF could be either deterministic, probabilistic, or a combination of both in interaction with user needs within the Realm of Risk Analysis and Mitigation. Naturally, the scheme applies as well to other natural hazards and can be further generalized. Note however, that ‘operational’ (in everyday language) means ‘ready to work correctly’; hence, it is obvious that SHA belongs to the OEF Realm as, we believe, the most important part of the OEF user interface shown in Figures 10, 11. See (Peresan et al., 2005; Peresan, 2018) for ‘operational’ forecast/prediction practices in Italy since 2005 and also (Crespi et al., 2020) for a recent example.
Practitioners are positive that any reliable forecasting information can be i) effective, ii) complementary to design and construction of seismically resistant buildings and infrastructure, and iii) well appreciated by the population as a timely precautionary reminder and timely warning (Mileti and Fitzpatrick, 1992; Kossobokov et al., 2015b). Obviously, the spectrum of doable low-key preparedness options increases in the case of longer rather than short-term warnings. Theoretically speaking, while decision-makers should be aware of the full broad spectrum of possible actions, following general strategies of response to predictions by escalation or de-escalation of safety measures (depending on expected losses and magnitude-space-time accuracy of reliable forecasting), lives can only be saved (and more legal trials avoided) if buildings and infrastructures can withstand the shaking!
Earthquake preparedness should not fluctuate on daily or weekly basis
Therefore, per Wang and Rogers (2014), “Earthquake Preparedness Should Not Fluctuate on a Daily or Weekly Basis” from both public safety, as well as effective public messaging concerns. They say “although fully appreciating the noble intention of OEF and the scientific merits of the seismicity analyses it employs, we are concerned that its wide promotion may lead the public to believe that earthquake preparedness can fluctuate at timescales of days or weeks,” and we “question the claim that it should and can be made operational,” because:
(1) Where OEF is based largely on clustering or potential foreshock sequences, it is not reliable, as the “majority of damaging earthquakes are not preceded by anomalous foreshocks.”
(2) “The most objective measure of the usefulness of a short-term forecast is whether it can guide pre-seismic evacuation of unsafe buildings.”
(3) But providing probability forecasts in percentages from very low to even 20% or 40% (and with authoritative uncertainties) may not mean much to a public that only dichotomizes Risk: Yes or No! (like “Shall I carry an umbrella today, or not?”).
(4) “Crying earthquake is a potent way of blunting earthquake awareness and preparedness,” as well as disrupting the economy.
Since the most sensible and reliable way to mitigate the hazard posed by unsafe and killer buildings requires that the public, the government, and society “make every effort to retrofit or replace an unsafe building to comply with earthquake resistance provisions,” while this is not simple, Wang and Rogers believe the scientific community should first and foremost help society to deal with these challenges, and not just champion short-term alternatives focusing on evacuations (i.e., “the practice of continual updating and dissemination of physics-based short-term (days) probabilities for the occurrence of damaging earthquakes”) to that specific evacuation end.
Reflecting on the damage and fatalities in L’Aquila, they note that the relevant questions to ask regarding reliable mitigation strategies are:
Why did those buildings collapse? What could have been done better in designing and implementing building codes? How should retrofitting regulations and practices be improved to reduce the vulnerability of old buildings? How can the methods of developing seismic-hazard models be further improved?
. . . . . . . . . . . . . . . . . . . . . . . . . . . . . . . . . . . . . . . . . . . . . . . . . . . . . . . . . . . . . . .
During this type of crisis, the scientific community should step up to guide public and government attention to the relevant questions asked above. It is our concern that their attention was guided farther away from these questions by the report of the International Commission on Earthquake Forecasting for Civil Protection (Jordan et al., 2011), which, in our view, incorrectly concludes that the L’Aquila incident demonstrated the need for OEF.
“Society’s best strategy against the consequence of earthquakes,” they say, “is to focus on making the built environment earthquake resistant.” Naturally, when then Nature does spin the wheel, you can bet on that!
Earthquake prediction in practice: Success and failure
As an example, the success in predicting in practice the devastating 1975 Haicheng earthquake (Zhang-li et al., 1984) remains the sole case of successful OEF decision-making interaction between scientists and administrators. A “lucky” intermediate-term (Time) guess: i) readied the province for an incipient large earthquake; ii) was followed by an escalation of civil preparedness from low-key actions at low-level alert to short-term monitoring of multidisciplinary observations; and iii) ultimately culminated with “red alert” status! — and evacuation of the city of Haicheng was ordered by Chinese officials early in the morning of February 4th — thereby saving most of approximately one million residents from consequences of the devastating M 7.5 shock that hit the area in the evening hours. Although 1,328 people nevertheless died, over 27,000 were injured, and thousands of buildings collapsed, the number of fatalities is just about 1% of the estimate, if the evacuation had not taken place.
In deadly contrast, the M 7.8 Great Tangshan Earthquake of 28 July 1976 was sadly “the greatest earthquake disaster in the history of the world”, and occurred with no warning (Huixian et al., 2002). It was generated by a fault running directly through the middle of the city, which is located in the extreme NE region of China abutting the iconic (and fractal) Bohai Bay indentation of the Chinese coastline. “Although the building code had seismic design requirements, Tangshan was in a zone requiring no earthquake design.” Therefore “red alert” timely evacuation would have been the one-and-only successful action for OEF!
Notably: i) 85% of the buildings in Tangshan either collapsed or were “so seriously damaged as to be unusable; ” ii) infrastructure and agriculture were also seriously damaged as well; iii) the shock hit around 4:00 a.m. when the population was mostly at home asleep in vulnerable structures having no earthquake resistance; iv) the extreme intensity XI on MMI scale and subsequent aftershocks caused officially 242,419 victims (Huixian et al., 2002) (this death toll number placing The Great Tangshan Earthquake atop the list of deadliest earthquakes in a century).
Therefore, in contrast to the very successful 1975 Haicheng earthquake forecast/prediction case, The Great Tangshan Earthquake turns out be a “cold shower” of disillusionment on both the Risk Umbrella and the presumed reliability of OEF, demonstrating particularly that consideration of MCE as practiced in NDSHA, per Rugarli et al. (2019), has to envelope all public safety considerations over and above, we believe, probability model perturbations of OEF responses.
It does not do to leave a live dragon out of your calculations
The Caltech EERL 2002–001 Report on The Great Tangshan Earthquake shows what can happen when an unexpected earthquake strikes an unprepared city, and it makes clear the need for earthquake preparedness even if the (subjectively modeled) probability of an earthquake is presumed to be low (Huixian et al., 2002).
Decades later, a golden opportunity was tragically lost to advise the citizens of L'Aquila, Italy on low-key safety measures, when Commisione Grandi Rischi (CGR), or Grand Risk Commission, issued their politicized statement on 31 March 2009 — because at this time the situation was favorable for adequate reaction of the public to prudent (understandable, believable, and personal) information on the “increased probability” of an impending strong earthquake (see e.g., Mileti and Fitzpatrick, 1992; Marincioni et al., 2012; Wachinger et al., 2013).
The local authorities and emergency management agencies, in particular, were also ready to act in advance, but were advised to the contrary by CGR to do nothing! From a strictly scientific viewpoint, an adequate evaluation of the seismic crisis in the Abruzzo region of Central Italy east of Rome on 31 March 2009 could have actually provided a much more reliable forecast/prediction than the previous and celebratory 1975 Haicheng success story! — if seismological knowledge had not been misspresented by CGR:
(I) According to scientific studies by the CGR members (Boschi et al., 1995; Dolce and Martinelli, 2005) L'Aquila was: a) at the highest seismic risk in Italy in the near future; and b) buildings in medieval L'Aquila were extremely vulnerable.
(II) Therefore, given the November 2008 — March 2009 apparently unrelenting seismic activity shaking the Abruzzo region (culminating in March 2009, when over 100 tremors occurred in the vicinity of L’Aquila), any responsible scientific body should not have asked local people to “calm down and relax,” but should instead have claimed: a) evident “increase of seismic risk” within the area; and also advised b) raising the “alert level” from background “green” to “yellow”, at least, or even “orange”. Subsequently it has been shown that this cluster of seismic activity that was so alarming to the population was a foreshock sequence foreshadowing the M 6.3 L’Aquila main shock (Papadopoulos et al., 2010).
Communicating their already existing scientific knowledge “as is” and unabridged could have led to saving the lives of a significant part of the 309 people who perished under the rubbles of the devastating M 6.3 L'Aquila earthquake on 06 April 2009 at 03:32 a.m. Many victims would not have returned back to their homes to sleep, but would have instead remained outside their houses for the rest of the night, following the two premonitory tremors of M3.9 (2009/04/05 22:48 CET) and M3.5 (2009/04/06 00:39 CET) which preceded the fatal M6.3 (2009/04/06 03:32 CET) main shock by just 3 hours. See in particular ‘Voices from the seismic crater in the trial of The Major Risk Committee: a local counternarrative of “the L’Aquila Seven”’ by Pietrucci (2016).
(1) On 22 October 2012 the Court of L’Aquila found all seven CGR members, who had been convened in L'Aquila on 31.03.2009 with “the aim of providing the citizens of Abruzzo with all the information available to the scientific community on the seismic activity of the last few weeks,” guilty of negligence, imprudence, and inexperience by their actions in providing incomplete information to the National Department of Civil Protection, to the Abruzzo Region Councilor for Civil Protection, to the Mayor of L'Aquila, and to the citizens of L'Aquila that had resulted in the deaths of people.
Thus, and what was commonly misunderstood at the time, the guilty parties were convicted neither for failing to forecast the earthquake, nor for failing to advise evacuation of the city. Rather they were convicted for having provided ‘inaccurate, incomplete, and contradictory information’ about the ongoing seismic activity and therefore undermining the safety of the population (see e.g., https://www.slideshare.net/dealexander/reflections-on-the-trial-of-the-laquila-seven).
Their providing of this “incomplete information” was as a result of: a) the statements made to the media; and b) the CGR draft report — both of which were: i) imprecise and contradictory on the nature, causes, danger and future developments of the seismic activity in question; ii) also in violation of the general legislation of the Law regarding the “discipline of information and communication” activities of public administrations at the time of said meeting; and iii) only approximate, generic and ineffective in relation to the activities and duties of “forecasting and prevention” (Alexander, 2014). In the Italian three-part legal system, after the Court of L’Aquila guilty verdict 1) above; 2) later the Court of Appeal acquitted six scientists; and 3) the Supreme Court ultimately confirmed this ruling.
It cannot be ruled out, however, that the CGR meeting on 31 March 2009 was convened with the explicit goal to calm down the disquieted public from both the ongoing seismic activity, and also the warnings of an amateur earthquake prediction scientist (Alexander, 2014; Imperiale and Vanclay, 2019). And the questions of whether scientists were used or “captured” (allowing their knowledge to be misused) or also complicit (by not taking action to correct misinformation that was the equivalent of geophysical malpractice) remains both itchy, as well as worrisome.
More details about so-called “L'Aquila Trial” (or trial of “the L’Aquila Seven”), and the political crisis in science it spawned, are given by Panza and Bela (2020) and Supplementary material therein. Information regarding the “AGU Statement: Investigation of Scientists and Officials in L'Aquila, Italy, Is Unfounded'' (including Comment and Reply) — are in (Dobran, 2010; Wasserburg, 2010); see also (Stark and Saltelli, 2018).
CN prediction experiment in Italy: 8 target earthquakes
Since the beginning of the real-time CN prediction experiment in Italy in July 2003 (Peresan et al., 2005), only 2 events (out of 8 target earthquakes) were missed. Namely, the 24 November 2004, M 5.5, Salò earthquake in southern Alps, Northern region (Figure 12) and the 6 April 2009, M 6.3, L’Aquila earthquake in the central part of the Apennines, Central region. The L’Aquila earthquake scored as a “failure to predict” just because its epicenter was located about 10 km outside the alarm territory of Northern region identified by CN algorithm for the corresponding time window (Peresan et al., 2011).
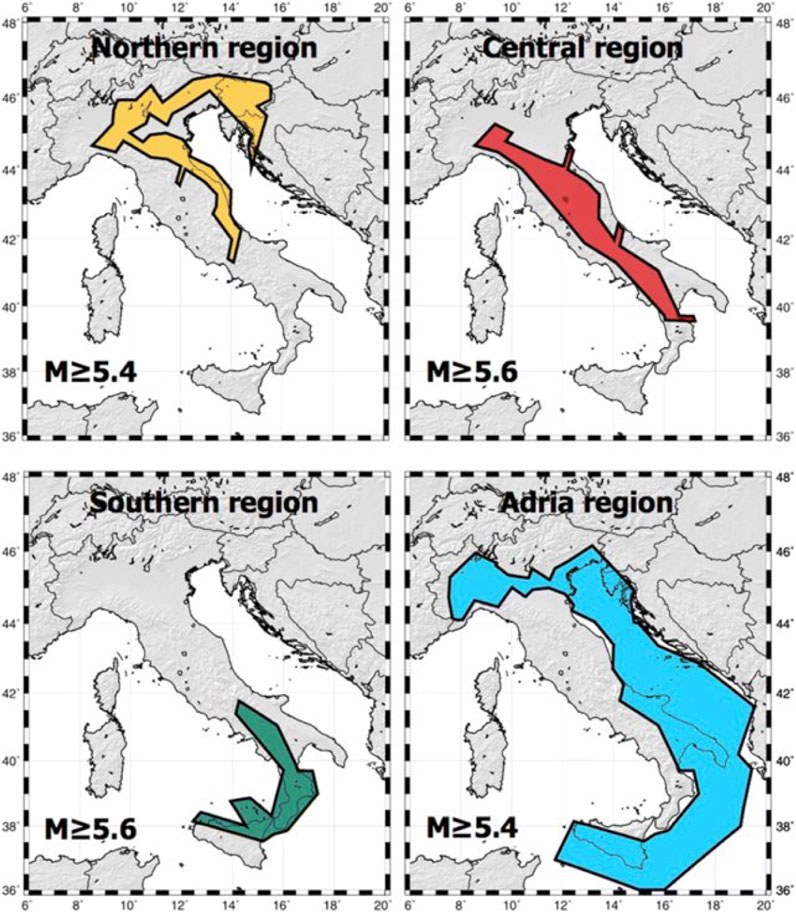
FIGURE 12. Regionalization used in the CN prediction experiment in Italy.
The situation with the Salò earthquake, which again occurred within the Northern Region, was quite different. In fact, fully three target earthquakes hit the same region in a row, respectively those of September 2003 July 2004, and November 2004. Both the first and second earthquakes were correctly predicted by CN algorithm within the alarm window beginning in May 2001, but according to the protocols of the prediction experiment, however, when the seismic energy release within the alarm region surpassed the preset sufficiently high threshold after the second, July 2004 earthquake, the alarm was automatically terminated — thus resulting in a “failure to predict” for the third November 2004 Salò earthquake (Peresan, 2018).
Discussion and conclusions
“Nothing is less predictable than the development of an active scientific field.”Charles Francis Richter
Charles Richter, whose critical observation that “only fools and charlatans predict earthquakes” is often cited (see e.g., Hough, 2016), illuminatingly wrote a one-page note (Richter, 1964) next to the article by Russian researchers Vladimir I. Keilis-Borok and Lyudmila N. Malinovskaya that was describing quantitatively an observation of a general increase in seismic activity in advance of some 20 strong earthquakes (Keylis-Borok and Malinovskaya, 1964). Richter noted: i) that this was “a creditable effort to convert this rather indefinite and elusive phenomenon into a precisely definable one”; ii) further marked as important a confirmation of “the necessity of considering a very extensive region including the center of the approaching event”; and iii) finally outlined “difficulty and some arbitrariness, as the authors duly point out, in selecting the area which is to be included in each individual study.” An example of the procedure followed to define the CN-regions in Italy is given by Peresan et al. (2005) and references therein (see also http://www.mitp.ru/en/cn/CN-Italy.html).
As can be judged after reading the most recent review of “The Global Earthquake Forecasting System: Towards Using Non-seismic Precursors for the Prediction of Large Earthquakes” (Sornette et al., 2021), most, if not all, non-seismic “low-hanging fruits” stubbornly remain earthquake precursor candidates unfortunately lacking the results of similar credible seismic precursor definition efforts — which results are absolutely required to advance earthquake prediction forward from challenging “hindcasting” to a reliable “operational forecasting” of earthquake hazard, i.e., ready to be used correctly by both civil protection agencies and populations (Mignan et al., 2021).
One could not realistically or believably challenge that earthquake prediction research requires from a scientist both a keen feeling of responsibility, as well as rigid control of all claims and conclusions. Such responsibility requires further the highest standards of statistical analysis, because it is well-known that the improper use of statistical methods may lead to wrong (although to the user desirable) causal inferences. And we were often reminded of this error by Andrei N. Kolmogorov (1903–1987), the famous Russian mathematician known for Probability theory, Topology, Intuitionistic logic, Turbulence and many other studies, who modified for this purpose a famous quotation attributed to Benjamin Disraeli (1804–1881): “There are three kinds of lies: lies, damned lies, and political statistics.”
It would likewise also be wrong to regard statistics as purely a tool for exercises in numerology, by first counting, and then regressing “descriptive” parameters — as proxies for “causal inference” in statistical models (Collier et al., 2010). A main reason is from Albert Einstein’s observation that “not everything that can be counted counts, and not everything that counts can be counted.” Or, in other words, “as far as the laws of mathematics refer to reality, they are not certain; and as far as they are certain, they do not refer to reality” (Albert Einstein, Geometry and Experience, 27 gennaio 1921).
Furthermore, as one of the highest authorities in modern mathematical sciences, Izrail M. Gelfand (1913–2009) wrote in his Kyoto Prize Commemorative Lecture of the 1989 Laureate in Basic Sciences (Gelfand, 1991): “It is terrible that in our technocratic age we do not doubt the initial basic principles. But when these principles become the basis for constructing either a trivial or finely developed model, then the model is viewed as a complete substitute for the natural phenomenon itself.”
We believe foremostly that PSHA is not “the natural phenomenon itself”, and also, per “Cargo-cult statistics and scientific crisis” (Stark and Saltelli, 2018) — that the underlying problem of a widespread pandemic-like scientific crisis in many disciplines collaboratively involved in SHA lies squarely in the misuse of Statistics far beyond the possibilities of its applications (as in the abovementioned GSHAP, STEP, GEM seismic hazard model endeavors) — due primarily to: i) superficial education regarding “initial basic principles”; ii) lots of mechanical application of pretty available software; and our favorite iii) the questionable editorial policies of scientific journals, as in (Gerstenberger et al., 2020); see also (Stark, 2018; Stark and Saltelli, 2018; Bela and Panza, 2021).
Regretfully, nowadays for many science has become a “career,” rather than a calling (Stark and Saltelli, 2018). And for example, in his last appearance of the famous Bertolt Brecht play, Galileo concludes (in lecture style) his instructions to a young scholar:
For a few years I was as strong as the authorities. And yet I handed the powerful my knowledge to use, or not to use, or to misuse as served their purposes. I have betrayed my calling. A man who does what I have done cannot be tolerated in the ranks of science.
Thus, when once again maps are checked “with the actual territory during the journey”, the newest GEM global seismic hazard maps based on PSHA are of deceptive glow — regrettably the same as the old pretty-shabby ones born of GSHAP, and as a result, therefore, mislead to a disappointing future practice of more unsurprising surprises, when actual seismic effects are once again: a) unexpectedly disastrous; as well as b) of unnecessary expenses on earthquake-resistant construction within the essentially aseismic areas.
On the contrary, the three-decades-long physically sound approach of NDSHA models (Fäh et al., 1993; Panza et al., 2013), that predictably outscore comparative PSHA models in efficiency, enables estimating realistically the future magnitude of ground shaking for SHA — with statistically justifiable reliability. Deterministic scenarios of catastrophic earthquakes, which can now be based on the state-of-the-art knowledge of the Earth’s complex structure and patterns of seismicity, provide a much more comprehensive basis for: i) decision-making for land use planning; ii) adjusting building code earthquake-resistant design standards; iii) seismic-related regulations; and iv) operational emergency management.
Today NDSHA is gaining even more momentum in spreading Worldwide a New Paradigm of Reliable Seismic Hazard Assessment, RSHA (Panza and Bela, 2020; Bela and Panza, 2021); and one (see XeRiS - Methodology) that, along with other modern physics-based earthquake scenario modelling platforms, e.g. CyberShake (SCEC, 2018) — should ultimately change the mind-sets of both scientific and engineering communities alike: from a pessimistic disbelief in past forecasting abilities attributable only to “fools and charlatans”... to today’s optimistic appreciation of the many challenging issues being addressed by Neo-Deterministic Predictability of Natural Hazards.
Author contributions
JB performed organizational and editing/language tasks related to manuscript. VK wrote initial presentation on Hazards, Risks, and Prediction in the book Earthquakes and Sustainable Infrastructure and collaborated on interpretation and manuscript write up. GP helped with overall expanded coverage of topic, provided references, key insights, and editorial managing oversight.
Conflict of interest
The authors declare that the research was conducted in the absence of any commercial or financial relationships that could be construed as a potential conflict of interest.
Publisher’s note
All claims expressed in this article are solely those of the authors and do not necessarily represent those of their affiliated organizations, or those of the publisher, the editors and the reviewers. Any product that may be evaluated in this article, or claim that may be made by its manufacturer, is not guaranteed or endorsed by the publisher.
References
Alexander, D. E. (2014). Communicating earthquake risk to the public: The trial of the “L’Aquila seven”. Nat. Hazards 72 (2), 1159–1173. doi:10.1007/s11069-014-1062-2
Alexander, D. E. (2010). The L'Aquila earthquake of 6 April 2009 and Italian government policy on disaster response. J. Nat. Resour. Policy Res. 2 (4), 325–342. doi:10.1080/19390459.2010.511450
Allen, C. R. (1976). Responsibilities in earthquake prediction: To the seismological society of America, delivered in edmonton, Alberta, may 12, 1976. Bull. Seismol. Soc. Am. 66 (6), 2069–2074. doi:10.1785/BSSA0660062069
Bak, P., Christensen, K., Danon, L., and Scanlon, T. (2002). Unified scaling law for earthquakes. Phys. Rev. Lett. 88 (17), 178501–178504. doi:10.1103/PhysRevLett.88.178501
Beauval, C., Bard, P. Y., Hainzl, S., and Guguen, P. (2008). Can strong motion observations be used to constrain probabilistic seismic hazard estimates? Bull. Seismol. Soc. Am. 98 (2), 509–520. doi:10.1785/0120070006
Bedford, J. R., Moreno, M., Deng, Z., Oncken, O., Schurr, B., John, T., et al. (2020). Months-long thousand-kilometre-scale wobbling before great subduction earthquakes. Nature 580, 628–635. doi:10.1038/s41586-020-2212-1
Bela, J., and Panza, G. F. (2021). Ndsha - the new paradigm for RSHA - an updated review. Vietnam J. Earth Sci. 43 (2), 111–188. doi:10.15625/2615-9783/15925
Bela, J. (2014). Too generous to a fault? Is reliable earthquake safety a lost art? Errors in expected human losses due to incorrect seismic hazard estimates. Earth’s Future 2, 569–578. doi:10.1002/2013EF000225
Berke, P. R., and Beatley, T. (1992). Planning for earthquakes: Risk, politics, and policy. Baltimore, USA: Johns Hopkins Univ. Press, 210. Available at: https://www.amazon.com/Planning-Earthquakes-Risk-Politics-Policy/dp/0801842557.
Bilham, R. (2009). The seismic future of cities. Bull. Earthq. Eng. 7, 839–887. doi:10.1007/s10518-009-9147-0
Boissonnade, A. C., and Shah, H. C. (1984). Seismic vulnerability and insurance studies. Geneva Pap. Risk Insur. - Issues Pract. 9 (32), 223–254. doi:10.1057/gpp.1984.13
Bolt, B. A. (1991). Balance of risks and benefits in preparation for earthquakes. Science 251 (4), 169–174. doi:10.1126/science.251.4990.169
Bommer, J. J., and Abrahamson, N. A. (2006). Why do modern probabilistic seismic-hazard analyses often lead to increased hazard estimates? Bull. Seismol. Soc. Am. 96 (6), 1967–1977. doi:10.1785/0120060043
Bormann, P. (2020). “Earthquake, magnitude,” in Encyclopedia of Solid earth geophysics. Editor H. Gupta (Cham, Switzerland: Springer). doi:10.1007/978-3-030-10475-7_3-1
Boschi, E., Gasperini, P., and Mulargia, F. (1995). Forecasting where larger crustal earthquakes are likely to occur in Italy in the near Future. Bull. Seismol. Soc. Am. 85 (5), 1475–1482. doi:10.1785/BSSA0850051475
Box, G. E. P. (1979). “Robustness in the strategy of scientific model building,” in Robustness in statistics. Editors R. L. Launer, and G. N. Wilkinson (New York, USA: Academic Press), 201–236. doi:10.1016/B978-0-12-438150-6.50018-2
Briceño, S. (2014). “The international strategy for disaster reduction and the Hyogo framework for action (2005–2015): Essential tools for meeting the challenges of extreme events,” in Extreme natural hazards, disaster risks and societal implications (special publications of the international union of geodesy and geophysics). Part VII. Editors A. Ismail-Zadeh, J. U. Fucugauchi, A. Kijko, K. Takeuchi, and I. Zaliapin (Cambridge, UK: Cambridge University Press), 333–347. doi:10.1017/CBO9781139523905.034
Cancani, A. (1904). “Sur l’emploi d’une double échelle sismique des intensités, empirique et absolue,” in Proceedings of the 2nd international conference of seismology. Strasbourg, France, jul 24-28, 1903. Gerlands Beiträge zur Geophysik; Special Volume II, Annexe A-10. Editor E. Rudolph, 281–283. Available at: https://www.castaliaweb.com/ita/discussioni/PSHA_NDSHA/Cancani1904.pdf.
Cannon, T. (1993). “A hazard need not a disaster make: Vulnerability and the causes of natural disasters natural disasters: Protecting vulnerable communities,” in Proceedings of the conference held in London, 13-15 October 1993. Editors P. A. Merriman, and C. W. A. Browitt (London: Thomas Telford). Available at: https://www.researchgate.net/publication/285133108_A_hazard_need_not_a_disaster_make_Vulnerability_and_the_causes_of_natural_disasters_edited_by_Merriman_Natural_disasters_protecting_vulnerable_communities.
Cartlidge, E. (2014). A dangerous distraction? Phys. World 27 (10), 6–7. doi:10.1088/2058-7058/27/10/10
Castanos, H., and Lomnitz, C. (2002). Psha: Is it science? Eng. Geol. 66 (3-4), 315–317. doi:10.1016/S0013-7952(02)00039-X
Chipangura, P., Van der Waldt, G., and Van Niekerk, D. (2019). An exploration of the tractability of the objectivist frame of disaster risk in policy implementation in Zimbabwe. Jàmbá J. Disaster Risk Stud. 11 (1), 604–610. doi:10.4102/jamba.v11i1.604
Chu, H. Y. (2014). R. Buckminster Fuller’s model of nature: Its Role in his design process and the presentation and Reception of his work. PhD Thesis (Brighton, UK, Sept 29, 2014: Univ of Brighton), 298. Available at: https://cris.brighton.ac.uk/ws/portalfiles/portal/4754859/Final_Thesis_April+2015.pdf.
Collier, D., Sekhon, J. S., and Stark, P. B. (2010). “Preface, editors’ introduction: Inference and shoeleather,” in Statistical models and causal inference: A dialog with the social sciences. Editors D. Collier, J. S. Sekhon, and P. B. Stark 1st ed./Kindle Ed. (New York, NY, USA: Cambridge University Press), xi-xii–xiii-xvi. Available at: https://www.google.com/books/edition/Statistical_Models_and_Causal_Inference/KfPDgsPIDpsC?hl=en&gbpv=1&printsec=frontcover.
Cornell, C. A. (1968). Engineering seismic risk analysis. Bull. Seismol. Soc. Am. 58 (5), 1583–1606. doi:10.1785/BSSA0580051583
Crespi, M. G., Kossobokov, V. G., Panza, G. F., and Peresan, A. (2020). Space-time precursory features within ground velocities and seismicity in North-Central Italy. Pure Appl. Geophys. 177, 369–386. doi:10.1007/s00024-019-02297-y
Danciu, L., and Giardini, D. (2015). Global seismic hazard assessment program - GSHAP legacy. Ann. Geophys. 58 (1), S0109. doi:10.4401/ag-6734
Davis, C., Keilis-Borok, V., Kossobokov, V., and Soloviev, A. (2012). Advance prediction of the March 11, 2011 great east Japan earthquake: A missed opportunity for disaster preparedness. Int. J. Disaster Risk Reduct. 1, 17–32. doi:10.1016/j.ijdrr.2012.03.001
Dobran, F. (2010). Further comment on “AGU statement: Investigation of scientists and officials in L'Aquila, Italy, is unfounded”. Eos, Trans. Am. Geophys. Union (AGU) 91 (42), 384. doi:10.1029/2010EO420007
Dolce, M., and Martinelli, A. (2005). Inventario e vulnerabilità degli edifici pubblici e strategici dell’Italia Centro-Meridionale - Vol. II - Analisi di Vulnerabilità e Rischio Sismico. L’Aquila: Istituto Nazionale di Geofisica e Vulcanologia/Gruppo Nazionale per la Difesa dai Terremoti, 187. Available at: https://emidius.mi.ingv.it/GNDT2/Att_scient/Prodotti_consegnati/Dolce_Zuccaro/Volume%202.pdf.
Ellsworth, W. L. (1990). “Earthquake history, 1769-1989,” in The San Andreas fault system, California. U.S. Geological Survey professional paper 1515 - Chpt 6. Editor R. E. Wallace, 153–187. Available at: http://pubs.usgs.gov/pp/1990/1515/.
Fäh, D., Iodice, C., Suhadolc, P., and Panza, G. F. (1993). A new method for the realistic estimation of seismic ground motion in megacities: The case of Rome. Earthq. Spectra 9 (4), 643–668. doi:10.1193/1.1585735
Fischhoff, B., and Kadvany, J. (2011). Risk: A very short introduction. New York, NY, USA: Oxford Uni Press, 185. doi:10.1093/actrade/9780199576203.001.0001
Florsch, N., Fäh, D., Suhadolc, P., and Panza, G. F. (1991). Complete synthetic seismograms for high-frequency multimode SH-waves. Pure Appl. Geophys. (PAGEOPH) 136, 529–560. doi:10.1007/BF00878586
Frankel, A., Mueller, C., Barnhard, T., Perkins, D., Leyendecker, E. V., Dickman, N., et al. (1996). National seismic-hazard maps: Documentation june 1996. U.S. Geol. Surv. Open-File Rep. 96-532, 110. doi:10.3133/ofr96532
P. Gasperini, R. Camassi, C. Mirto, and M. Stucchi (Editors) (2004). Parametric catalog of Italian earthquakes. Version 2004 (CPTI04) (Milan: National Institute of Geophysics and Volcanology). Available at: http://emidius.mi.ingv.it/CPTI/.
Gelfand, I. M., Guberman, S. A., Keilis-Borok, V. I., Knopoff, L., Press, F., Ya Ranzman, E., et al. (1976). Pattern recognition applied to earthquake epicenters in California. Phys. Earth Planet. Interiors 11 (3), 227–283. doi:10.1016/0031-9201(76)90067-4
Gelfand, I. M., Guberman, S. I., Izvekova, M. L., Keilis-Borok, V. I., and Ja Ranzman, E. (1972). Criteria of high seismicity determined by pattern recognition. Dev. Geotect. 13 (1-4), 415–422. doi:10.1016/B978-0-444-41015-3.50028-8
Gelfand, I. M. (1991). Two archetypes in the psychology of Man. Nonlinear Sci. Today 1 (4), 11–16. Available at: https://www.kyotoprize.org/wp-content/uploads/2019/07/1989_B.pdf.
Gere, J. M., and Shah, H. C. (1984). Terra non Firma: Understanding and preparing for earthquakes. New York, NY, USA: W. H. Freeman, 203.
Gerstenberger, M. C., Marzocchi, W., Allen, T., Pagani, M., Adams, J., Danciu, L., et al. (2020). Probabilistic seismic hazard analysis at regional and national scales: State of the art and future challenges. Rev. Geophys. 58 (2), e2019RG000653. doi:10.1029/2019RG000653
Gerstenberger, M. C., Wiemer, S., Jones, L. M., and Reasenberg, P. A. (2005). Real-time forecasts of tomorrow's earthquakes in California. Nature 435, 328–331. doi:10.1038/nature03622
Giardini, D., Grünthal, G., Shedlock, K., and Zhang, P. (1999). The GSHAP global seismic hazard map. Ann. Geophys. 42 (6), 1225–1230. doi:10.4401/ag-3784
Giardini, D. (1999). The global seismic hazard assessment program (GSHAP) – 1992/1999. Ann. Geophys. 42 (6), 957–974. doi:10.4401/ag-3780
Gorshkov, A., Kossobokov, V., and Soloviev, A. (2003). “Recognition of earthquake-prone areas,” in Nonlinear dynamics of the lithosphere and earthquake prediction. Springer series in synergetics. Editors V. I. Keilis-Borok, and A. A. Soloviev (Berlin, Heidelberg, Germany: Springer), 239–310. Available at: https://www.springer.com/gp/book/9783540435280.
Gorshkov, A., and Novikova, O. (2018). Estimating the validity of the recognition results of earthquake-prone areas using the ArcMap. Acta Geophys. 66 (5), 843–853. doi:10.1007/s11600-018-0177-3
H. K. Gupta (Editor) (2020). “Encyclopedia of Solid earth geophysics,” Encyclopedia of earth sciences series. 2nd ed. (Cham, Switzerland: Springer). doi:10.1007/978-3-030-10475-7
Gutenberg, B., and Richter, C. F. (1956). Earthquake magnitude, intensity, energy, and acceleration: (Second paper). Bull. Seismol. Soc. Am. 46 (2), 105–145. doi:10.1785/BSSA0460020105
Gutenberg, B., and Richter, C. F. (1944). Frequency of earthquakes in California. Bull. Seismol. Soc. Am. 34 (4), 185–188. doi:10.1785/BSSA0340040185
Gutenberg, B., and Richter, C. F. (1949). Seismicity of the Earth and associated phenomena. 1st ed. Princeton, NJ, USA: Princeton Univ. Press, 273. Available at: https://archive.org/details/seismicityofthee009299mbp/page/n7/mode/2up.
Gutenberg, B., and Richter, C. F. (1954). Seismicity of the Earth and associated phenomena. 2nd ed. Princeton, NJ, USA: Princeton Univ. Press, 310. doi:10.1111/j.2153-3490.1950.tb00313.x
Hanks, T. C. (1997). Imperfect science, uncertainty, diversity, and experts. Eos, Trans. Am. Geophys. Union (AGU) 78 (35), 369–377. doi:10.1029/97EO00236
Healy, J. H., Kossobokov, V. G., and Dewey, J. W. (1992). A test to evaluate the earthquake prediction algorithm, M8. U.S. Geological Survey Open-File Report 92-401, pp. 23 with 6 Appendices. doi:10.3133/ofr92401
Hough, S. E. (2016). “Chapter 16. Predicting the unpredictable,” in Richter's scale: Measure of an earthquake, measure of a man (Princeton, N.J., USA: Princeton University Press), 253–268. doi:10.1515/9781400884445-017
Huixian, L., Housner, G. W., Lili, X., and Duxin, H. (2002). The great tangshan earthquake of 1976. Pasadena, CA, USA: California Institute of Technology (Caltech): EERL Report 2002-001 (Unpublished. Available at: https://resolver.caltech.edu/CaltechEERL:EERL.2002.001.
Imperiale, A. J., and Vanclay, F. (2019). Reflections on the L’Aquila trial and the social dimensions of disaster risk. Disaster Prev. Manag. 28 (4), 434–445. doi:10.1108/DPM-01-2018-0030
Ismail-Zadeh, A., and Kossobokov, V. (2020). “Earthquake prediction, M8 algorithm,” in Encyclopedia of Solid earth geophysics. Encyclopedia of earth sciences series. Editor H. Gupta 2nd edition (Cham, Switzerland: Springer). doi:10.1007/978-3-030-10475-7_157-1
Iturrarán-Viveros, U., and Sánchez-Sesma, F. J. (2020). “Seismic wave propagation in real media: Numerical modeling approaches,” in Encyclopedia of Solid earth geophysics. Encyclopedia of earth sciences series. Editor H. Gupta 2nd edition (Cham, Switzerland: Springer). doi:10.1007/978-3-030-10475-7_6-1
Jackson, D. D., and Kagan, Y. Y. (1999). Testable earthquake forecasts for 1999. Seismol. Res. Lett. 70 (4), 393–403. doi:10.1785/gssrl.70.4.393
Jordan, T. H., Chen, Y.-T., Gasparini, P., Madariaga, R., Main, I., Marzocchi, W., et al. (2011). Operational earthquake forecasting: State of knowledge and guidelines for utilization. Ann. Geophys. 54 (4), 315–391. doi:10.4401/ag-5350
Jordan, T. H., Marzocchi, W., Michael, A. J., and Gerstenberger, M. C. (2014). Operational earthquake forecasting can enhance earthquake preparedness. Seismol. Res. Lett. 85 (4), 955–959. doi:10.1785/0220140143
Kanamori, H. (2021). Rules and outliers in seismology–implications for hazard mitigation plenary; SSA annual meeting. Virtual, April 22, 2021; Abstract. Seismol. Res. Lett. 92 (2B), 1215. doi:10.1785/0220210025
Kanamori, H. (2014). The diversity of large earthquakes and its implications for hazard mitigation. Annu. Rev. Earth Planet. Sci. 42, 7–26. doi:10.1146/annurev-earth-060313-055034
Kantorovich, L. V., Keilis-Borok, V. I., and Molchan, G. M. (1974). “Seismic risk and principles of seismic zoning,” in Seismic design decision analysis series. Internal report No. 43 (Cambridge, MA, USA: Department of Civil Engineering, MIT), 26. Available at: https://nehrpsearch.nist.gov/static/files/NSF/PB80104813.pdf. See also: Seismic Design Decision Analysis, Report R73-58, Structures Publication No. 381, Jan 1, 1974. https://nehrpsearch.nist.gov/static/files/NSF/PB282979.pdf.
Kantorovich, L. V., and Keilis-Borok, V. I. (1991). “Earthquake prediction and decision-making: Social, economic and civil protection aspects,” in Proceedings of the international conference on earthquake prediction: State-of-the-Art, scientific-technical contributions. Strasbourg, France, 15-18 October 1991, CSEM-EMSC, 586-593. (based on “economics of earthquake prediction”. In proceedings of the UNESCO conference on seismic risk, paris, France, 1977). Available at: https://www.worldcat.org/title/international-conference-on-earthquake-prediction-state-of-the-art-strasbourg-france-15-18-october-1991-scientific-technical-contributions-reprints/oclc/80533359.
Kaufmann, D., and Penciakova, V. (2011). Japan’s triple disaster: Governance and the earthquake, tsunami and nuclear crises. Brookings: Op-Ed. Available at: https://www.brookings.edu/opinions/japans-triple-disaster-governance-and-the-earthquake-tsunami-and-nuclear-crises/(Accessed Mar 27, 2022).
Keilis-Borok, V. I., and Kossobokov, V. G. (1990). Premonitory activation of earthquake flow: Algorithm M8. Phys. Earth Planet. Interiors 61 (1-2), 73–83. doi:10.1016/0031-9201(90)90096-G
Keilis-Borok, V. I., Kronrod, T. L., and Molchan, G. M. (1984). Seismic risk for the largest cities of the world; intensity VIII or more. Geneva Pap. Risk Insur. – Issues Pract. 9 (32), 255–270. doi:10.1057/GPP.1984.14
Keilis-Borok, V. I. (1990). The lithosphere of the Earth as a nonlinear system with implications for earthquake prediction. Rev. Geophys. 28 (1), 19–34. doi:10.1029/RG028i001p00019
Keylis-Borok, V. I., and Malinovskaya, L. N. (1964). One regularity in the occurrence of strong earthquakes. J. Geophys. Res. 69 (14), 3019–3024. doi:10.1029/JZ069i014p03019
Klügel, J. U. (2007). Error inflation in probabilistic seismic hazard analysis. Eng. Geol. 90 (3-4), 186–192. doi:10.1016/j.enggeo.2007.01.003
Klügel, J. U. (2011). Uncertainty analysis and expert judgment in seismic hazard analysis. Pure Appl. Geophys. 168 (1), 27–53. doi:10.1007/s00024-010-0155-4
Kossobokov, V. (2008). “Testing earthquake forecast/prediction methods: "Real-time forecasts of tomorrow's earthquakes in California",” in Abstracts of the contributions of the EGU general Assembly 2008, Vienna, Austria, 13-18 April 2008 (CD-ROM). Geophysical research Abstract 10: EGU2008-A-07826. Available at: https://www.geophysical-research-abstracts.net/egu2008.html.
Kossobokov, V. (2011). Are mega earthquakes predictable? Izvestiya, Atmos. Ocean. 46 (8), 951–961. doi:10.1134/S0001433811080032
Kossobokov, V. G. (2014). “Chapter 18 - times of increased probabilities for occurrence of catastrophic earthquakes: 25 Years of hypothesis testing in real time,” in Earthquake hazard, risk, and disasters. Editors M. Wyss, and J. Shroder, 477–504. doi:10.1016/B978-0-12-394848-9.00018-3
Kossobokov, V. G. (2013). Earthquake prediction: 20 years of global experiment. Nat. Hazards 69 (2), 1155–1177. doi:10.1007/s11069-012-0198-1
Kossobokov, V. G. (2021). “Hazards, risks, and predictions,” in Earthquakes and sustainable infrastructure: Neodeterministic (NDSHA) approach guarantees prevention rather than cure. Editors G. Panza, V. Kossobokov, E. Laor, and B. DeVivo (Amsterdam, Netherlands: Elsevier), 1–25. doi:10.1016/B978-0-12-823503-4.00031-2
Kossobokov, V. G., Keilis-Borok, V. I., and Smith, S. W. (1990). Localization of intermediate term earthquake prediction. J. Geophys. Res. 95 (B12), 19763–19772. doi:10.1029/JB095iB12p19763
Kossobokov, V. G., and Mazhkenov, S. A. (1994). “On similarity in the spatial distribution of seismicity computational seismology and geodynamics (volume 1, selected papers from volumes 22 and 23 of Vychislitel’naya seysmologiya,” in Article in computational seismology and geodynamics · March 2013). Editors D. K. Chowdhury, and N. N. Biswas (Washington DC: AGU, The Union), 6–15. doi:10.1029/CS001p0006
Kossobokov, V. G., and Mazhkenov, S. A. (1988). “Spatial characteristics of similarity for earthquake sequences: Fractality of seismicity,” in Lecture notes of the ICTP workshop on global geophysical informatics with applications to research in earthquake prediction and reduction of seismic risk (trieste, Italy, 15 Nov–16 dec, 1988). Available at: http://indico.ictp.it/event/a02153/contribution/3/material/0/0.pdf.
Kossobokov, V. G. (2010c). Natural hazards at extreme: Predictive understanding versus complex reality. Abstract in EOS Trans AGU 91(26). Fall Supplement: Abstract NH14A-01. Available at: https://eos.org/current-issues.
Kossobokov, V. G., and Nekrasova, A. K. (2012). Global seismic hazard assessment program maps are erroneous. Seism. Instrum. 48 (2), 162–170. doi:10.3103/S0747923912020065
Kossobokov, V. G., and Nekrasova, A. K. (2010). Global seismic hazard assessment program maps are misleading. Abstract in EOS Trans AGU 91(52). Fall Meeting of the American Geophysical Union: Abstract U13A-0020.
Kossobokov, V. G. (2006a). Quantitative earthquake prediction on global and regional scales. AIP Conf. Proc. 825, 32–50. doi:10.1063/1.2190730
Kossobokov, V. G., Romashkova, L. L., Keilis-Borok, V. I., and Healy, J. H. (1999). Testing earthquake prediction algorithms: Statistically significant advance prediction of the largest earthquakes in the Circum-pacific, 1992–1997. Phys. Earth Planet. Interiors 111 (3-4), 187–196. doi:10.1016/S0031-9201(98)00159-9
Kossobokov, V. G. (2010a). “Scaling laws and earthquake predictability,” in Assessment of Seismic Risk. Lecture presented at the Advanced Conference on Seismic Risk Mitigation and Sustainable Development. The Abdus Salam International Centre for Theoretical Physics (ICTP), Miramare, Trieste - Italy, 10 - 14 May 2010, 71. doi:10.13140/RG.2.2.32855.09121
Kossobokov, V. G., and Shchepalina, P. D. (2020). Times of increased probabilities for occurrence of world’s largest earthquakes: 30 Years hypothesis testing in real time. Izvestiya, Phys. Solid Earth 56 (1), 36–44. doi:10.1134/S1069351320010061
Kossobokov, V. G., and Soloviev, A. A. (2018). Распознавание образов в задачах оценки сейсмической опасности. Chebyshevskii Sb. 19 (4), 55–90. (In Russian with English Abstract). doi:10.22405/2226-8383-2018-19-4-55-90
Kossobokov, V. G. (2010b). “Statistics of extreme seismic events and their predictability,” in ESOF 2010 Programme Book. Proceedings of the Euroscience Open Forum, Torino, Italy, 2-7 Jul 2010, 56. Available at: https://www.esof.eu/esof-torino/.
Kossobokov, V. G. (2006b). Testing earthquake prediction methods: «the West Pacific short-term forecast of earthquakes with magnitude MwHRV ≥ 5.8». Tectonophysics 413 (1-2), 25–31. doi:10.1016/j.tecto.2005.10.006
Kossobokov, V. G. (2005b). “The 26 december 2004 greatest asian quake: When to expect the next one? Statement,” in Special Session on the Indian Ocean Disaster: risk reduction for a safer future, UN World Conference on Disaster Reduction, Kobe, Hyogo, Japan, 18-22 January 2005, 13. doi:10.13140/RG.2.2.11464.14087
Kossobokov, V., Peresan, A., and Panza, G. F. (2015b). On operational earthquake forecast and prediction problems. Seismol. Res. Lett. 86 (2), 287–290. doi:10.1785/0220140202
Kossobokov, V., Peresan, A., and Panza, G. F. (2015a). Reality check: Seismic hazard models you can trust. Eos, Trans. Am. Geophys. Union (AGU) 96 (13), 9–11. doi:10.1029/2015EO031919
Kossobokov, V. (2005a). “Quantitative earthquake prediction on global and regional scales,” in Quake: Earthquake seminars, 2005 Archives. (December 15, 2005) (CA, USA: USGS Menlo Park). Available at: http://quake.wr.usgs.gov/resources/seminars.php?show=2005_archives.
Kossobokov, V., and Shebalin, P. (2003). “Earthquake prediction,” in Nonlinear dynamics of the lithosphere and earthquake prediction. Springer series in synergetics. Editors V. I. Keilis-Borok, and A. A. Soloviev (Berlin, Heidelberg, Germany: Springer), 141–207. doi:10.1007/978-3-662-05298-3_4
Kossobokov, V. (2020). “Unified scaling law for earthquakes that generalizes the fundamental gutenberg-richter relationship,” in Encyclopedia of Solid earth geophysics. Encyclopedia of earth sciences series. Editor H. Gupta 2nd edition (Cham, Switzerland: Springer). doi:10.1007/978-3-030-10475-7_257-1
Krinitzsky, E. L. (1993a). Earthquake probability in engineering. Part 1. The use and misuse of expert opinion. The third Richard H. Jahns distinguished lecture in engineering geology. Eng. Geol. 33 (4), 257–288. doi:10.1016/0013-7952(93)90030-G
Krinitzsky, E. L. (1993b). Earthquake probability in engineering—Part 2: Earthquake recurrence and limitations of gutenberg-richter b-values for the engineering of critical structures. Eng. Geol. 36 (1-2), 1–52. doi:10.1016/0013-7952(93)90017-7
Krinitzsky, E. L. (1995). Problems with logic trees in earthquake hazard evaluation. Eng. Geol. 39 (1-2), 1–3. doi:10.1016/0013-7952(94)00060-F
La Mura, C., Yanovskaya, T. B., Romanelli, F., and Panza, G. F. (2011). Three-dimensional seismic wave propagation by modal summation: Method and validation. Pure Appl. Geophys. 168, 201–216. doi:10.1007/s00024-010-0165-2
Lowrance, W. W. (1976). Of acceptable risk: Science and the determination of safety. Los Altos, CA, USA: William Kaufmann, 180. Available at: https://eric.ed.gov/?q=ddt&pg=2&id=ED159027.
Mandelbrot, B. B. (1967). How long is the coast of britain? Statistical self-similarity and fractional dimension. Science 156 (3775), 636–638. doi:10.1126/science.156.3775.636
Marincioni, F., Appiotti, F., Ferretti, M., Antinori, C., Melonaro, P., Pusceddu, A., et al. (2012). Perception and communication of seismic risk: The 6 April 2009 L'Aquila earthquake case study. Earthq. Spectra 28 (1), 159–183. First Published February 1, 2012. doi:10.1193/1.3672928
May, P. J. (2001). Societal perspectives about earthquake performance: The fallacy of “acceptable risk”. Earthq. Spectra 17 (4), 725–737. doi:10.1193/1.1423904
McEntire, D. A., Fuller, C., Johnston, C. W., and Weber, R. (2002). A comparison of disaster paradigms: The search for a holistic policy guide. Public Adm. Rev. 62 (3), 267–281. doi:10.1111/1540-6210.00178
McEntire, D. A. (2004). Tenets of vulnerability: An assessment of a fundamental disaster concept. J. Emerg. Manag. 2 (2), 23–29. doi:10.5055/jem.2004.0020
McGuire, R. K. (2008). Probabilistic seismic hazard analysis: Early history. Earthq. Eng. Struct. Dyn. 37 (3), 329–338. doi:10.1002/eqe.765
Meletti, C., Marzocchi, W., D'Amico, V., Lanzano, G., Luzi, L., Martinelli, F., et al. (2021). The new Italian seismic hazard model (MPS19). Ann. Geophys. 64 (1), SE112. doi:10.4401/ag-8579
G. Michel (Editor) (2018). Risk modeling for hazards and disasters (Cambridge, MA, USA: Elsevier), 318. doi:10.1016/C2015-0-01065-6
Mignan, A., Ouillon, G., Sornette, D., and Freund, F. (2021). Global earthquake forecasting system (GEFS): The challenges ahead. Eur. Phys. J. Special Top. 230, 473–490. doi:10.1140/epjst/e2020-000261-8
Mileti, D. S., and Fitzpatrick, C. (1992). The causal sequence of risk communication in the parkfield earthquake prediction experiment. Risk Anal. 12 (3), 393–400. doi:10.1111/j.1539-6924.1992.tb00691.x
Mitchell, T. (2014). Seven myths about disasters. London, UK: Overseas Development Institute ODI. Available at: https://news.trust.org/item/20141103115234-a5v2c/(Accessed Mar 27, 2022).
Molchan, G., Kronrod, T., and Panza, G. F. (1997). Multi-scale seismicity model for seismic risk. Bull. Seismol. Soc. Am. 87 (5), 1220–1229. doi:10.1785/BSSA0870051220
Molchan, G. M. (1997). Earthquake prediction as a decision-making problem. Pure Appl. Geophys. 149, 233–247. doi:10.1007/BF00945169
Molchan, G. M. (2003). “Earthquake prediction strategies: A theoretical analysis,” in Nonlinear dynamics of the lithosphere and earthquake prediction. Springer series in synergetics. Editors V. I. Keilis-Borok, and A. A. Soloviev (Berlin, Heidelberg, Germany: Springer), 209–237. doi:10.1007/978-3-662-05298-3_5
Mualchin, L. (2011). “History of modern earthquake hazard mapping and assessment in California using a deterministic or scenario approach,” in Advanced seismic hazard assessment. Topical volume 168, Part II: Regional seismic hazard and seismic microzonation case studies. Pure and applied geophysics (PAGEOPH) SI 168 (II). Editors G. Panza, K. Irikura, M. Kouteva, A. Peresan, Z. Wang, and R. Saragoni (Basel, Switzerland: Birkhäuser), 383–407. doi:10.1007/s00024-010-0121-1
Mulargia, F., Stark, P. B., and Geller, R. J. (2017). Why is probabilistic seismic hazard analysis (PSHA) still used? Phys. Earth Planet. Interiors 264, 63–75. doi:10.1016/j.pepi.2016.12.002
Nekrasova, A. K., Kossobokov, V. G., Parvez, I. A., and Tao, X. (2020). Unified scaling law for earthquakes as applied to assessment of seismic hazard and associate risks. Izvestiya, Phys. Solid Earth 56 (1), 83–94. doi:10.1134/S1069351320010097
Nekrasova, A., and Kossobokov, V. (2002). Generalizing the Gutenberg-Richter scaling law. Abstract in EOS Trans AGU 83(47). Fall Meeting of the American Geophysical Union: Abstract NG62B-0958. Available at: https://ui.adsabs.harvard.edu/abs/2002AGUFMNG62B0958N/abstract.
Nekrasova, A., Kossobokov, V., Parvez, I. A., and Tao, X. (2015b). Seismic hazard and risk assessment based on the unified scaling law for earthquakes. Acta Geod. Geophys. 50, 21–37. doi:10.1007/s40328-014-0082-4
Nekrasova, A., Kossobokov, V., Peresan, A., and Magrin, A. (2014). The comparison of the NDSHA, PSHA seismic hazard maps and real seismicity for the Italian territory. Nat. Hazards 70 (1), 629–641. doi:10.1007/s11069-013-0832-6
Nekrasova, A., and Kossobokov, V. (2019). “Unified scaling law for earthquakes: Global map of parameters,” in ISC seismological dataset repository. doi:10.31905/XT753V44
Nekrasova, A., Peresan, A., Kossobokov, V. G., and Panza, G. F. (2015a). “A new probabilistic shift away from seismic hazard reality in Italy?,” in Nonlinear mathematical physics and natural hazards. Springer proceedings in physics (SPPHY volume 163). Editors B. Aneva, and M. Kouteva-Guentcheva (Cham, Switzerland: Springer), 83–103. doi:10.1007/978-3-319-14328-6_7
NEPEC (2016). Evaluation of earthquake predictions: Recommendations to the USGS earthquake hazards program from the national earthquake prediction evaluation Council (NEPEC), september 2016, 6. Available at: https://www.usgs.gov/media/files/recommendations-nepec-evaluating-earthquake-predictions.
Nishioka, T., and Mualchin, L. (1997). Deterministic seismic hazard map of Japan from inland maximum credible earthquakes for engineering. J. Struct. Mech. Earthq. Eng. 570, 11–19. doi:10.2208/jscej.1997.570_11
Nishioka, T., and Mualchin, L. (1996). Deterministic seismic hazard map of Japan: Based on inland maximum credible earthquakes. Sacramento, CA, USA: California Dept. of Transportation, Engineering Service Center, Office of Earthquake Engineering.
Nöggerath, J., Geller, R. J., and Gusiakov, V. K. (2011). Fukushima: The myth of safety, the reality of geoscience. Bull. Atomic Sci. 67 (5), 37–46. doi:10.1177/0096340211421607
Okal, E. (2019). Energy and magnitude: A historical perspective. Pure Appl. Geophys. 176, 3815–3849. doi:10.1007/s00024-018-1994-7
Okubo, P. G., and Aki, K. (1987). Fractal geometry in the san Andreas fault system. J. Geophys. Res. 92 (B1), 345–356. doi:10.1029/JB092iB01p00345
Panza, G. F., and Bela, J. (2020). “Ndsha: A new paradigm for reliable seismic hazard assessment,” in Geo-hazards due to large earthquakes (with contributions from the International Symposium commemorating the 10th anniversary of the 2008 Wenchuan earthquake). Engineering geology SI 275. Editors T. van Asch, N. Rengers, and Q. Xu (London, UK: Elsevier), 14. Article 105403. doi:10.1016/j.enggeo.2019.105403
Panza, G. F., Kossobokov, V., Peresan, A., and Nekrasova, A. (2014). “Why are the standard probabilistic methods of estimating seismic hazard and risks too often wrong?,” in Earthquake hazard, risk, and disasters. Editors M. Wyss, and J. Shroder (London, UK: Elsevier), 309–357. doi:10.1016/B978-0-12-394848-9.00012-2
Panza, G. F., La Mura, C., Peresan, A., Romanelli, F., and Vaccari, F. (2012). Seismic hazard scenarios as preventive tools for a disaster resilient society. Adv. Geophys. 53, 93–165. doi:10.1016/B978-0-12-380938-4.00003-3
Panza, G. F., Peresan, A., and La Mura, C. (2013). “Seismic hazard and strong motion: An operational neodeterministic approach from national to local scale,” in Geophysics and geochemistry, Eds. UNESCO-EOLSS joint committee, in Encyclopedia of life support systems (EOLSS), developed under the Auspices of the UNESCO (Oxford, UK: Eolss Publishers). Available at: http://www.eolss.net.
Panza, G. F., and Romanelli, F. (2001). Beno Gutenberg contribution to seismic hazard assessment and recent progress in the European–Mediterranean region. Earth-Science Rev. 55 (1-2), 165–180. doi:10.1016/S0012-8252(01)00051-4
Panza, G. F., Romanelli, F., and Vaccari, F. (2001). Seismic wave propagation in laterally heterogeneous anelastic media: Theory and applications to seismic zonation. Adv. Geophys. 43, 1–95. doi:10.1016/S0065-2687(01)80002-9
Panza, G. F. (1985). Synthetic seismograms: The Rayleigh waves modal summation. J. Geophys. 58 (1), 125–145. Available at: https://geophysicsjournal.com/article/67.
Panza, G. F., Vaccari, F., Costa, G., Suhadolc, P., and Fäh, D. (1996). Seismic input modelling for Zoning and microzoning. Earthq. Spectra 12 (3), 529–566. doi:10.1193/1.1585896
Panza, G., Irikura, K., Kouteva, M., Peresan, A., Wang, Z., and Saragoni, R. (2011). “Advanced seismic hazard assessment, Preface,” in Advanced seismic hazard assessment. Topical volume 168, Part I: Seismic hazard assessment. Pure and applied geophysics (PAGEOPH) SI 168 (I). Editors G. Panza, K. Irikura, M. Kouteva, A. Peresan, Z. Wang, and R. Saragoni (Basel, Switzerland: Birkhäuser), 1–9. doi:10.1007/s00024-010-0179-9
G. Panza, V. Kossobokov, E. Laor, and B. DeVivo (Editors) (2021). Earthquakes and sustainable infrastructure: Neodeterministic (NDSHA) approach guarantees prevention rather than cure (Amsterdam, Netherlands: Elsevier), 672. doi:10.1016/C2020-0-00052-6
Papadopoulos, G. A., Charalampakis, M., Fokaefs, A., and Minadakis, G. (2010). Strong foreshock signal preceding the L'Aquila (Italy) earthquake (M_w∼6.3) of 6∼April∼2009. Nat. Hazards Earth Syst. Sci. 10 (1), 19–24. doi:10.5194/nhess-10-19-2010
Parvez, I. A., Nekrasova, A., and Kossobokov, V. (2014). Estimation of seismic hazard and risks for the Himalayas and surrounding regions based on Unified Scaling Law for Earthquakes. Nat. Hazards 71 (1), 549–562. doi:10.1007/s11069-013-0926-1
Paskaleva, I., Dimova, S., Panza, G. F., and Vaccari, F. (2007). An earthquake scenario for the microzonation of Sofia and the vulnerability of structures designed by use of the Eurocodes. Soil Dyn. Earthq. Eng. 27 (11), 1028–1041. doi:10.1016/j.soildyn.2007.03.004
Peresan, A., Kossobokov, V. G., and Panza, G. F. (2012b). Operational earthquake forecast/prediction. Rend. Fis. Acc. Lincei 23, 131–138. doi:10.1007/s12210-012-0171-7
Peresan, A., Kossobokov, V. G., Romashkova, L., and Panza, G. F. (2005). Intermediate-term middle-range earthquake predictions in Italy: A review. Earth-Science Rev. 69 (1-2), 97–132. doi:10.1016/j.earscirev.2004.07.005
Peresan, A. (2018). “Recent developments in the detection of seismicity patterns for the Italian region,” in Pre-earthquake processes: A multi-disciplinary approach to earthquake prediction studies. AGU geophysical monograph series. Editors D. Ouzounov, S. Pulinets, K. Hattori, and P. Taylor (New York, NY, USA: Wiley), Vol. 234, 149–172. doi:10.1002/9781119156949.ch9
Peresan, A., Vaccari, F., Magrin, A., Romanelli, F., and Panza, G. F. (2012a). “Ground motion modelling and seismic hazard assessment,” in VRCs on EGI and Regional Infrastructures. Proceedings Of Science (POS)EGCIF12-EMITC2)132, EGI Community Forum 2012/EMI Second Technical Conference, ed. F. Ruggieri, 8-9. EGI Community Forum 2012/EMI Second Technical Conference, Munich, Germany, 26-30 Mar, 2012. doi:10.22323/1.162.0132
Peresan, A., Zuccolo, E., Vaccari, F., Gorshkov, A., and Panza, G. F. (2011). “Neo-deterministic seismic hazard and pattern recognition techniques: Time-dependent scenarios for north-eastern Italy,” in Advanced seismic hazard assessment. Topical volume 168, Part II: Regional seismic hazard and seismic microzonation case studies. Pure and applied geophysics (PAGEOPH) SI 168 (II). Editors G. Panza, K. Irikura, M. Kouteva, A. Peresan, Z. Wang, and R. Saragoni (Basel, Switzerland: Birkhäuser), 583–607. doi:10.1007/s00024-010-0166-1
Peterson, D. W. (1988). Volcanic hazards and public response. J. Geophys. Res. 93 (B5), 4161–4170. doi:10.1029/JB093iB05p04161
Pietrucci, P. (2016). Voices from the seismic crater in the trial of the major risk committee: A local counternarrative of “the L’Aquila seven”. Interface a J. about Soc. movements 8 (2), 261–285. Available at: http://www.interfacejournal.net/wordpress/wp-content/uploads/2016/12/Interface-8-2-Pietrucci.pdf.
Ranguelo, B. (2011). Natural Hazards –nonlinearities and assessment. Sofia, Bulgaria: Acad. Publ. House (BAS, 327.
Ranguelov, B., and Ivanov, Y. (2017). Fractal properties of the elements of PlateTectonics. J. Min. Geol. Sci. 60 (1), 83–89.
Richter, C. F. (1935). An instrumental earthquake magnitude scale. Bull. Seismol. Soc. Am. 25 (1), 1–32. doi:10.1785/BSSA0250010001
Richter, C. F. (1964). Discussion of paper by V.I. Keylis-Borok and L.N. Malinovskaya, ‘One regularity in the occurrence of strong earthquakes. J. Geophys. Res. 69 (14), 3025. doi:10.1029/JZ069i014p03025
Rugarli, P., Vaccari, F., and Panza, G. (2019). Seismogenic nodes as a viable alternative to seismogenic zones and observed seismicity for the definition of seismic hazard at regional scale. Vietnam J. Earth Sci. 41 (4), 289–304. doi:10.15625/0866-7187/41/4/14233
Sadovsky, M. A., Bolkhovitinov, L. G., and Pisarenko, V. F. (1982). On the property of the discreteness of rocks. Izvestiya of the USSR Academy of Sciences. Fiz. Zemli 12, 3–18. (in Russian).
Sadovsky, M. A. (2004). The self similarity of geodynamic processes. Report of Academician M.A. Sadovsky - Laureate of the M.V. Lomonosov Gold Medal. (in Russ.) 35, 23–32. Available at: https://www.itpz-ran.ru/wp-content/vs/35/v35_023_Sadovsky.pdf.
Saltelli, A., Dankel, D. J., Di Fiore, M., Holland, N., and Pigeon, M. (2022). Science, the endless frontier of regulatory capture. Futures 135, 102860. doi:10.1016/j.futures.2021.102860
Scawthorn, C. (2006). “A brief history of seismic risk assessment,” in Risk assessment, modeling and decision support. Risk, governance and society series. Editors A. Bostrom, S. French, and S. Gottlieb (Berlin, Heidelberg: Springer), Vol. 14, 5–81. doi:10.1007/978-3-540-71158-2_2
SCEC (2018). The 2018 SCEC annual meeting. Proceedings Volume XXVIII. Available at: https://files.scec.org/s3fs-public/SCEC2018Proceedings.pdf.
Shaw, J. H., and Shearer, P. M. (1999). An elusive blind-thrust fault beneath metropolitan Los Angeles. Science 283 (5407), 1516–1518. doi:10.1126/science.283.5407.1516
Silva, V., Amo-Oduro, D., Calderon, A., Costa, C., Dabbeek, J., Despotaki, V., et al. (2020). Development of a global seismic risk model. Earthq. Spectra 36 (1), 372–394. doi:10.1177/8755293019899953
SISMA-ASI (2009). “The SISMA project: A pre-operative seismic hazard monitoring system”, by Chersich, M., A. Amodio, A. Francia, and C. Sparpaglione, EGU General Assembly, 19-24 April, 2009, Vienna. Geophys. Res. Abstr. 11, EGU2009–10946. Available at: http://meetingorganizer.copernicus.org/EGU2009/EGU2009-10946.pdf.
Soloviev, A., and Kossobokov, V. G. (2010). Seismic hazard and earthquake predictability. Abstract in EOS Trans AGU 91(26). The Meeting of the Americas: Abstract U13B-08. Available at: https://sciencedocbox.com/Geology/70644784-Seismic-hazard-and-earthquake-predictability.html.
Sorensen, J. H., and Mileti, D. S. (1987). “Public warning needs,” in Proceedings of conference XL: A workshop on the U.S. Geological survey's role in hazards warnings. U.S. Geological Survey open-file report 87-269, 9–75. Available at: https://www.amazon.com/Proceedings-Conference-XL-Geological-Open-File/dp/1287007430.
Sornette, D., Ouillon, G., Mignan, A., and Freund, F. (2021). Preface to the Global Earthquake Forecasting System (GEFS) special issue: Towards using non-seismic precursors for the prediction of large earthquakes. Eur. Phys. J. Special Top. 230, 1–5. doi:10.1140/epjst/e2020-000242-4
SSHAC (1997). “Senior seismic hazard analysis committee Recommendations for probabilistic seismic hazard analysis: Guidance on uncertainty and use of experts,” in NUREG/CR-6372 (Washington DC, USA: US Nuclear Regulatory Commission), Vol. 1, 885–XXI. Appendices: A 72, B 511, C 10, D 7, E 11, F 35, G 97, H 16, I 30, J 64. NUREG/CR-6372, Volume 1 (PDF - 16.4 MB).
Stacey, F. D., and Davis, P. M. (2020). “Earth, density distribution,” in Encyclopedia of Solid earth geophysics. Encyclopedia of earth sciences series. Editor H. Gupta 2nd edition (Cham, Switzerland: Springer). First Online 22 Jan 2020. doi:10.1007/978-3-030-10475-7_100-1
Stark, P. B. (2018). Before reproducibility must come preproducibility WORLD VIEW: A personal take on events. Nature 557, 613. doi:10.1038/d41586-018-05256-0
Stark, P. B. (2017). Pay No attention to the model behind the curtain. Berkley, California, USA: University of California at Berkley, 21. Available at: https://www.stat.berkeley.edu/∼stark/Preprints/eucCurtain15.pdf (Accessed Mar 27, 2022).
Stark, P. B. (2022). “Pay no attention to the model behind the curtain,” in PAGEOPH topical volume 179 (11), Geophysical studies of geodynamics and natural hazards in the northwestern pacific region. Editors A. Soloviev, V. Kossobokov, and J. Eichelberger (Basel, Switzerland: Birkhäuser). 179 (11), 4121–4145. doi:10.1007/s00024-022-03137-2
Stark, P. B., and Saltelli, A. (2018). Cargo-cult statistics and scientific crisis. Significance 15 (4), 40–43. doi:10.1111/j.1740-9713.2018.01174.x
Stein, S., Geller, R. J., and Liu, M. (2012). Why earthquake hazard maps often fail and what to do about it. Tectonophysics 562-563, 1–25. doi:10.1016/J.TECTO.2012.06.047
Tanner, A., Chang, S. E., and Elwood, K. J. (2020). Incorporating societal expectations into seismic performance objectives in building codes. Earthq. Spectra 36 (4), 2165–2176. doi:10.1177/8755293020919417
Tierney, K. (2014). “Communities and societies at risk,” in The social roots of risk: Producing disasters, promoting resilience. High reliability and crisis management series, K. Tierney (Redwood City, CA, USA: Stanford University Press), 125–159. doi:10.1515/9780804791403
Trendafiloski, G., Rosset, P., Wyss, M., Wiemer, S., Bonjour, C., and Cua, G. (2009). Estimation of damage and human losses due to earthquakes worldwide - QLARM strategy and experience. Presentation at EGU General Assembly 2009: 5027. Held 19-24 April, 2009 in Vienna, Austria. Available at: http://meetings.copernicus.org/egu2009.
Udias, A. (2002). Ethical problems in seismology. Seismol. Res. Lett. 73 (1), 3–4. doi:10.1785/gssrl.73.1.3
Vaccari, F., and Magrin, A. (2019). “NDSHA computational aspects of the neo-deterministic seismic hazard assessment,” in Resilience and sustainability of cities in hazardous environments. Editor F. Dobran (Trieste: GVES), 202–212.
Vere-Jones, D. (2001). The marriage of statistics and seismology. J. Appl. Probab. 38A, 1–5. doi:10.1017/s0021900200112604
Wang, K., and Rogers, G. C. (2014). Earthquake preparedness should not fluctuate on a daily or weekly basis. Seismol. Res. Lett. 85 (3), 569–571. doi:10.1785/0220130195
Wachinger, G., Renn, O., Begg, C., and Kuhlicke, C. (2013). The risk perception paradox—implications for governance and communication of natural hazards. Risk Anal. 33 (6), 1049–1065. doi:10.1111/j.1539-6924.2012.01942.x
Wang, K. (2012). “An unsurprising surprise,” in American association for the Advancement of science (AAAS) annual meeting, 16-20 feb, 2012, Vancouver, BC Canada: Abstract 7167. Available at: https://aaas.confex.com/aaas/2012/webprogram/Paper7167.html.
Wang, K., Sun, T., Brown, L., Hino, R., Tomita, F., Kido, M., et al. (2018). Learning from crustal deformation associated with the M9 2011 Tohoku-oki earthquake. Geosphere 14 (2), 552–571. doi:10.1130/GES01531.1
Wang, Z. M. (2011). “Seismic hazard assessment: Issues and alternatives,” in Advanced seismic hazard assessment. Topical volume 168, Part I: Seismic hazard assessment. Pure and applied geophysics (PAGEOPH) SI 168 (I). Editors G. Panza, K. Irikura, M. Kouteva, A. Peresan, Z. Wang, and R. Saragoni (Basel, Switzerland: Birkhäuser), 11–25. doi:10.1007/s00024-010-0148-3
Wang, Z. (2008). “Understanding seismic hazard and risk: A gap between engineers and seismologists,” in 14th world conference on earthquake engineering, Oct 12–17, 2008, beijing, China, paper S27-001, 11. Available at: http://invenio.itam.cas.cz/record/12057?ln=en.
Wasserburg, G. J. (2010). Comment on “AGU statement: Investigation of scientists and officials in L'Aquila, Italy, is unfounded”. Eos, Trans. Am. Geophys. Union (AGU) 91 (42), 384. doi:10.1029/2010EO420006
White, G. F. (2005). Foreword. Mitig. Adapt. Strategies Glob. Change 10 (3), 333–334. doi:10.1007/s11027-005-0049-4
Wiggins, J. H. (1972). The balanced risk concept, new approach to earthquake building codes. Civil Enginering — ASCE, (August 1972), 55–59.
Wyss, M. (1991). Evaluation of proposed earthquake precursors. Eos Trans. Am. Geophys. Union 72 (38), 411. doi:10.1029/90EO10300
Wyss, M., Nekrasova, A., and Kossobokov, V. (2012). Errors in expected human losses due to incorrect seismic hazard estimates. Nat. Hazards 62 (3), 927–935. doi:10.1007/s11069-012-0125-5
Wyss, M., and Rosset, P. (2013). Mapping seismic risk: The current crisis. Nat. Hazards 68, 49–52. doi:10.1007/s11069-012-0256-8
Wyss, M. (1997). Second round of evaluations of proposed earthquake precursors. Pure Appl. Geophys. 149, 3–16. doi:10.1007/BF00945158
Wyss, M. (2015). Testing the basic assumption for probabilistic seismic-hazard assessment: 11 failures. Seismol. Res. Lett. 86 (5), 1405–1411. doi:10.1785/0220150014
Zhang, Y., Meng, Q., Ouillon, G., Zhang, L., Hu, D., Ma, W., et al. (2021). Long-term statistical evidence proving the correspondence between tir anomalies and earthquakes is still absent topical collection - the global earthquake forecasting system: Towards using non-seismic precursors for the prediction of large earthquakes. Eur. Phys. J. Special Top. 230 (1), 133–150. doi:10.1140/epjst/e2020-000248-4
Zhang-li, C., Pu-xiong, L., De-yu, H., Da-lin, Z., Feng, X., and Zhi-dong, W. (1984). “Characteristics of regional seismicity before major earthquakes,”. 1984: UNESCO (063.4)/P2 in Earthquake prediction: Proceedings of the international symposium on earthquake prediction (Paris, France: UNESCO), 505–521. Available at: https://digitallibrary.un.org/record/1058?ln=en.
Zuccolo, E., Vaccari, F., Peresan, A., and Panza, G. F. (2011). “Neo-deterministic and probabilistic seismic hazard assessments: A comparison over the Italian territory,” in Advanced seismic hazard assessment. Topical volume 168, Part I: Seismic hazard assessment. Pure and applied geophysics (PAGEOPH) SI 168 (I). Editors G. Panza, K. Irikura, M. Kouteva, A. Peresan, Z. Wang, and R. Saragoni (Basel, Switzerland: Birkhäuser), 69–83. doi:10.1007/s00024-010-0151-8
Keywords: complex dynamical systems, earthquake disaster, hazard analysis, pattern recognition applications, risk analysis, scenario simulation
Citation: Bela J, Kossobokov V and Panza G (2023) Seismic Rigoletto: Hazards, risks and seismic roulette applications. Front. Earth Sci. 11:1136472. doi: 10.3389/feart.2023.1136472
Received: 03 January 2023; Accepted: 10 March 2023;
Published: 20 April 2023.
Edited by:
Giovanni Martinelli, National Institute of Geophysics and Volcanology, ItalyReviewed by:
Boyko Ranguelov, University of Mining and Geology “Saint Ivan Rilski”, BulgariaZhenming Wang, University of Kentucky, United States
Copyright © 2023 Bela, Kossobokov and Panza. This is an open-access article distributed under the terms of the Creative Commons Attribution License (CC BY). The use, distribution or reproduction in other forums is permitted, provided the original author(s) and the copyright owner(s) are credited and that the original publication in this journal is cited, in accordance with accepted academic practice. No use, distribution or reproduction is permitted which does not comply with these terms.
*Correspondence: Vladimir Kossobokov, dm9sb2R5YUBtaXRwLnJ1