
94% of researchers rate our articles as excellent or good
Learn more about the work of our research integrity team to safeguard the quality of each article we publish.
Find out more
ORIGINAL RESEARCH article
Front. Earth Sci., 06 July 2023
Sec. Solid Earth Geophysics
Volume 11 - 2023 | https://doi.org/10.3389/feart.2023.1136423
This article is part of the Research TopicJoint Inversion and Imaging in GeophysicsView all 12 articles
 Zhen Wang1
 Yiqiong Zhang1*Zhifeng Ji1Shutang Jin2Ren Jiang1
 Xueke Wang1Yankun Wang1Shanbo Sheng2Yaping Lin1
Due to the low porosity and thin thickness of the Carboniferous carbonate reservoir in the Pre-Caspian Basin, the impedance difference between the reservoir and the surrounding rock is not obvious, and the seismic response characteristics are weak. It is ambiguous to detect oil and gas based on the convention attribute amplitude and frequency information. According to the geological characteristics of the Carboniferous Reservoir in the Pre-Caspian Basin, we proposed a new hydrocarbon detection method from the phase decomposition of sensitive frequency in post-stack seismic data, which improves the accuracy of hydrocarbon detection. The forward model that is a method of numerical analysis is utilized to testify the feasibility of hydrocarbon detection with phase decomposition, which showed that the amplitude of oil and gas layers in −90° phase components is stronger than that of water layer. The special frequency band seismic data sensitive to oil and gas is decomposed into 10 Hz, 20 Hz, 30 Hz, 40 Hz, 50 Hz, and 60 Hz single frequency energy body, and then hydrocarbon is detected according to the amplitude anomaly in specific frequency energy body. The application of forward model and filed example demonstrates that the fluid type in the reservoir can be directly identified by the phase decomposition technique, which has higher accuracy than the conventional hydrocarbon detection technology with post-stack data. After the application of this technology, the coincidence between hydrocarbon results and oil test results in the block was increased from 60% to 80%, and the coincidence rate is much higher than the detection results using conventional attributes, more than 90%. All the two exploration wells deployed according to the detection results have obtained higher oil production, new discovered oil geologic reserves have been increased to 5.54 million tons.
Carbonate reservoirs in the eastern margin of Pre-Caspian Basin are characterized by strong vertical and horizontal heterogeneity, larger differences in the type, scale and hydrocarbon-bearing property of the reservoir space. Multiple oil-water systems are developed in the Carboniferous system, with smaller oil layer thickness (single layer thickness of about 2 m), and limited distribution range. The updip direction is shielded by lithological and physical changes, resulting in great uncertainty for quantitative analysis. Therefore, it is necessary to predict the reservoir distribution and fluid properties, so as to improve the drilling success rate. Many theoretical researches and new technologies had been used in the carbonate reservoirs’ exploration (e.g., Zhao W et al., 2014), such as forward and inversion modeling of complex wave field of fracture-porous media petrophysical model, identification of structural tensor small fault from seismic gradient, quantitative prediction of fracture-cavity reservoir by cloud transform stochastic simulation, and gas reservoir detection based on pre-stack elastic parameter inversion and frequency division attribute. But there are some issues in the corresponding seismic prediction technologies, such as weak theoretical methods and low prediction accuracy. At present, reservoir fluid detection by seismic data includes pre-stack detection and post-stack detection. Pre-stack fluid detection is mainly based on AVO theory for pre-stack fluid parameter inversion. Post-stack fluid detection is chiefly based on the “bright spot” of amplitude attribute, seismic wave absorption attenuation theory and 90° phase shift technique (Cao et al., 2010; Qiao et al., 2018; Zheng et al., 2019; Guo et al., 2022). The seismic wave absorption attenuation theory uses seismic amplitude changing with frequency to detect fluids. The 90° phase shift technique only makes 90° phase rotation to zero-phase seismic data to better depict formation lithology (Chen et al., 2012). Due to complex underground geological conditions, reservoir seismic response is not only affected by non-fluid factors such as reservoir type, physical properties, thickness and interference, but also by fluid properties in the reservoir (Yang et al., 2010; Chen X et al., 2020; Chen et al., 2022), so conventional fluid detection techniques have ambiguity in practical application.
Phase decomposition was originally proposed by Castagna et al. (2016). This technique has been applied in sandstone reservoirs (Barbato et al., 2017; Castagna et al., 2019; Selmara et al., 2019; Zhou et al., 2019), and achieved remarkable results. All the applications conducted phase decomposition in full-band seismic data, and the application of phase decomposition to carbonate reservoirs is very limited.
In view of the shortcomings of conventional post-stack hydrocarbon detection methods, this paper applies phase decomposition technique to directly detect hydrocarbons based on in seismic data volume of sensitive frequency under the premise of only post-stack seismic data. First, establish a forward model based on the statistics of reservoir parameters in the study area, decompose the frequency and phase of forward modeling results and actual seismic data, and find out the frequency and phase components that are sensitive to oil layers. Finally, the method is applied to predict lithologic reservoirs in the slope area of the Central Block in the eastern margin of the Pre-Caspian Basin to verify the effectiveness of the method.
The Pre-Caspian Basin is one of the world’s largest petroliferous basins, with an area of about 585,000 km2, most of which is located in the west of Kazakhstan, and the maximum thickness of sedimentary rocks is 21 km. Tectonically, it belongs to the foreland basin in the southeast of the Eastern European Craton. The basin widely develops the Permian Kungurian gypsum-salt layer, which is vertically divided into two major structural strata (pre-salt and post-salt) (Zhao et al., 2010; Zheng et al., 2011; Zhao et al., 2016). Several world-class giant oil and gas fields have been proved in the basin, but the exploration degree of the basin is uneven. The exploration degree of the post-salt layers is relatively high, while the exploration of the pre-salt Paleozoic strata is mainly concentrated at the basin margin (Xu et al., 2009), and the remaining exploration area is large. However, the drilled wells show that the relationship between oil and water is complex and the drilling success rate is low, leading to low exploration effect at present. The Central Block of the Kazakhstan Pre-Caspian Basin is the first risk exploration block of PetroChina (Jin et al., 2015), which is located in the uplift zone of the eastern margin of the basin with higher exploration degree, covering an area of 3,262.3 km2 (Figure 1). The main exploration target layer is the pre-salt Carboniferous KT-I and KT-II layers (Fang et al., 2008; Xu, 2011; Liang et al., 2013; He et al., 2014). In the Central Block, North Truva Oilfield and Takyr hydrocarbon-bearing structure have been discovered successively. Since 2012, large pre-salt structural traps have been drilled, and exploration in this area has shifted from structural traps to lithological traps. The study area is located in the northern part of the Central Block, covering an area of 450 km2 (Figure 2). The study area is mainly developed in the Carboniferous carbonate reef reservoirs developed in the open platform, with one shoal being one reservoir. There is no unified oil-water interface, and the oil-water relationship is complicated. At present, 24 Wells have been drilled and 3D seismic data of “two widths and one height” have been collected, which is conducive to oil and gas detection and research.
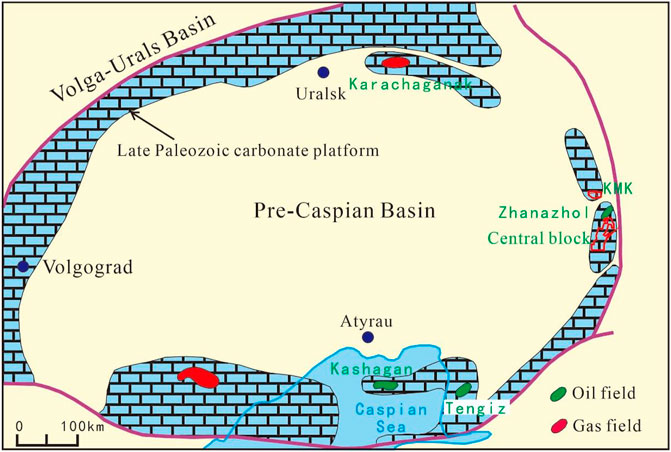
FIGURE 1. Location of the Central Block in the eastern Pre-Caspian Basin.
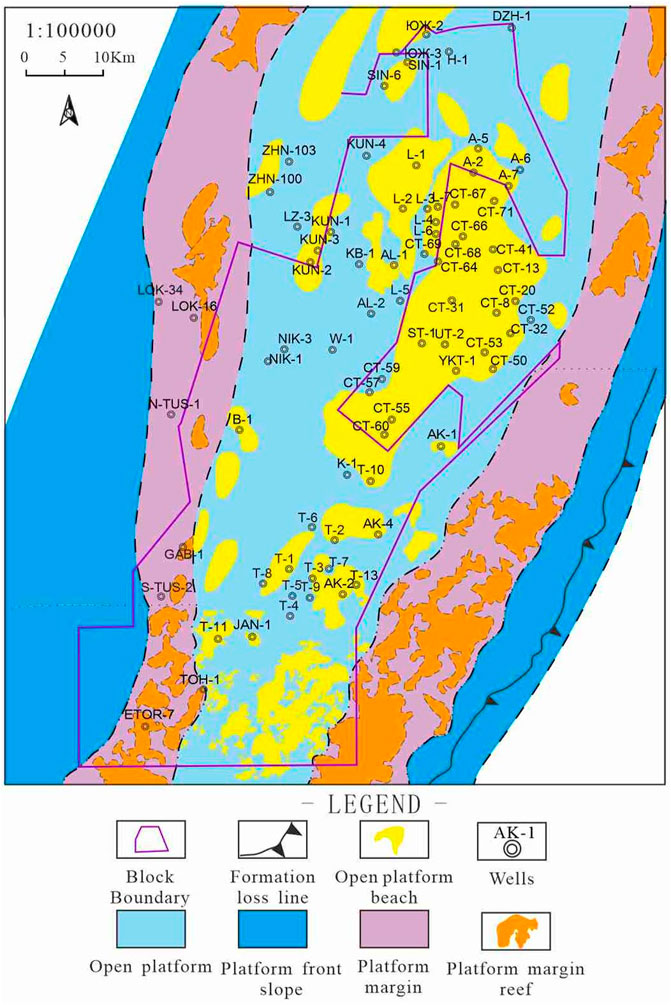
FIGURE 2. Carboniferous sedimentary facies distribution of the Study area.
According to the drilling, well logging, lithology, and paleontology data of the exploration block and its surrounding oil and gas fields, the strata are vertically divided into three sets of main stratigraphic combinations (Figure 3), which are in order from bottom to top: the pre-salt Paleozoic carbonate and clastic combination, the lower Permian Kungurian Formation salt stratum, and the post-salt Permian-Quaternary clastic combination.
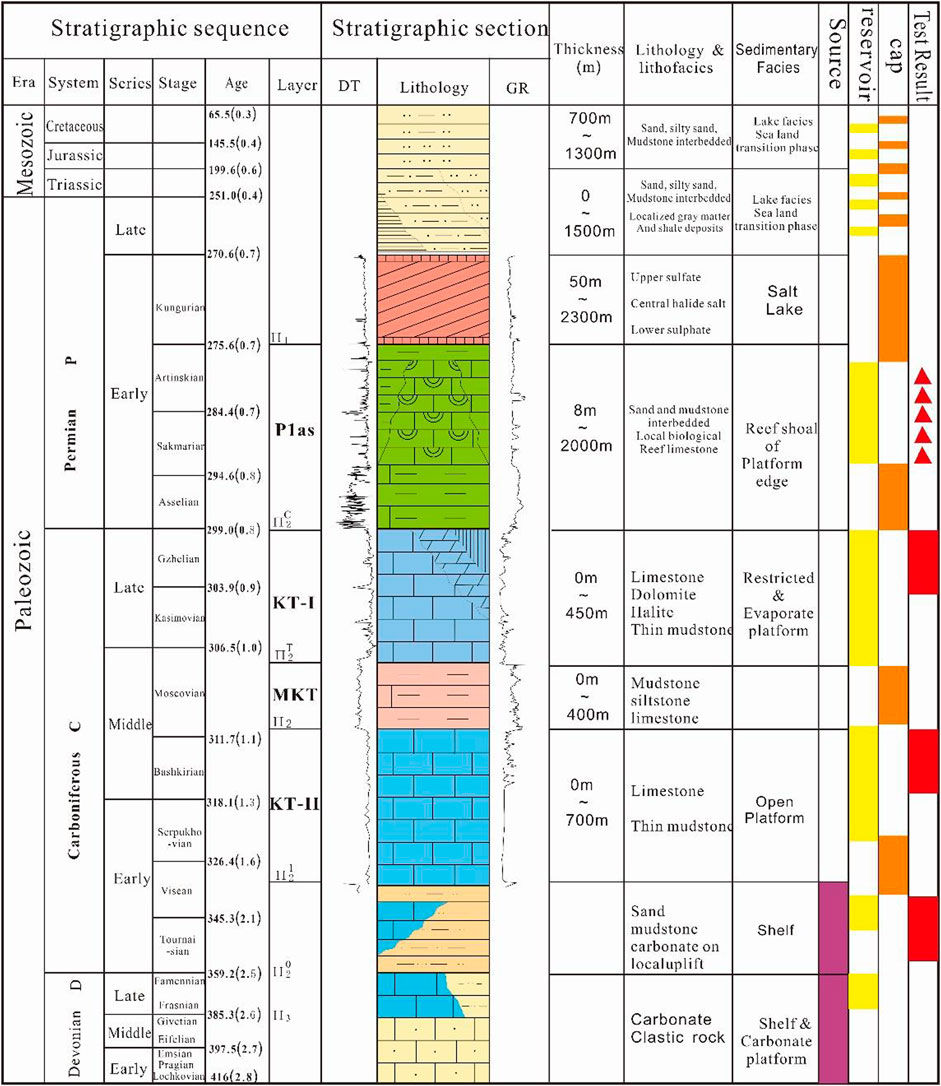
FIGURE 3. Composite stratigraphic column of the Central Block.
Phase decomposition is a new and unique application. It is different from the 90° phase-shifting technique of seismic sedimentary facies (Pan et al., 2013). It is significantly different from the traditional phase rotation. It does not rotate the seismic trace with a simple phase angle, but decomposes the seismic trace into various phase components.
In the past, seismic attribute research was mainly conducted in amplitude domain and frequency domain, but rarely in phase domain, due to the lack of effective algorithm to decompose the phase domain. In 2015, John Castagna invented the least square method (CLSSA) frequency and phase decomposition algorithm (Castagna et al., 2016; Castagna et al., 2019), which achieved a fundamental breakthrough in this domain. The phase decomposition technique is to transform the seismic wave in the phase domain. On this basis, the corresponding components of different phases can be extracted, and specific combinations of different phase profiles can be made to highlight the characteristics of formation fluids. The basic formula of time-frequency analysis commonly used in seismic signal processing is shown in Formula (1).
where,
Formula 1 does not consider the phase change, but in fact, the seismic wave is a function of the three parameters (amplitude, frequency and phase). When considering the phase change, Formula 1 becomes Formula 2:
where,
When the frequency is fixed, Formula 2 becomes Formula 3:
where,
It is found that the zero-phase component of seismic signals often represents the information of stratum interface, and the change of pore fluids or lithology in the stratum will cause amplitude anomaly in the −90° phase component (Lin et al., 2007). According to this characteristic, the phase decomposition technique can be used to directly identify the fluid types in the reservoir.
Seismic wave forward modeling is to obtain the propagation rule of seismic wave in the known underground geological model, including propagation time, path, energy, etc. (Zhao L et al., 2014; Chen Y et al., 2020). Forward modeling is the first step to understand the unknown problems in seismic research. The rules obtained from forward modeling in a given geological model can improve people’s understanding of the unknown model, thus helping to solve the problem.
According to the well logging interpretation results, the thicknesses of various layers of Carboniferous KT-I and KT-II layers are counted (Figure 4). The well logging interpretation shows that the thin layers less than 5 m thick are the dominated, and the thicknesses of all oil layers of KT-II layer are less than 5 m. From the porosity statistics, the average porosity of the oil layers of KT-I and KT-II layers is about 10%.
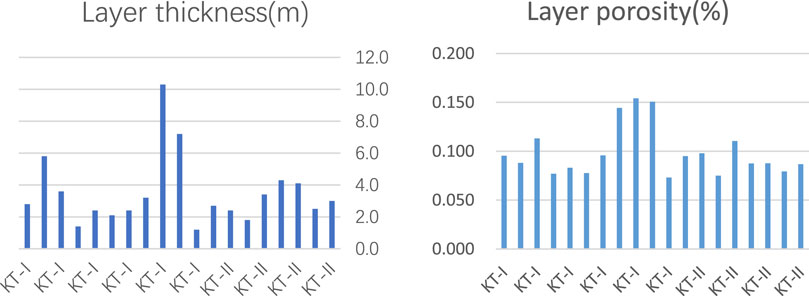
FIGURE 4. Statistics of KT-I and KT-II layer’s thicknesses.
According to the statistics of petrophysical analysis results of various lithofacies, the velocity and density values of each layer are given as follows: the velocity of caprock above layer KT-I is about 2,900 m/s, the density is about 1.9 g/cm3; the velocity of layer KT-I is 5,950 m/s, the density is 2.68 g/cm3; the velocity of mudstone interlayer is 2,800 m/s, and the density is 2.1 g/cm3; The velocity of layer KT-II is 6,100 m/s, the density is 2.7 g/cm3; the velocity of MKT mudstone is 3,050 m/s, and the density is 2.1 g/cm3.
According to the reservoir characteristics in well, considering reservoir thickness, the distance between reservoir and formation top, and the mudstone interlayer, a forward model of the target reservoir is established, and it is filled with physical parameters (such as velocity, density, porosity) from statistics of well-logging data.
As shown in Figures 5A, B, according to the actual formation development, layer KT-I is designed four reservoir groups: the first two groups are filled with oil and gas respectively, and the last two groups are filled with water. Two groups are 2 m from the top interface of layer KT-I, and another two groups are about 50 m from the top interface of layer KT-I. The mudstone interlayer with a thickness of about 2 m is embedded in layer KT-I. Four groups of reservoirs are also designed for layer KT-II: two groups are 20 m from the top interface of layer KT-II, and another two groups are 40 m from the top interface of layer KT-II.
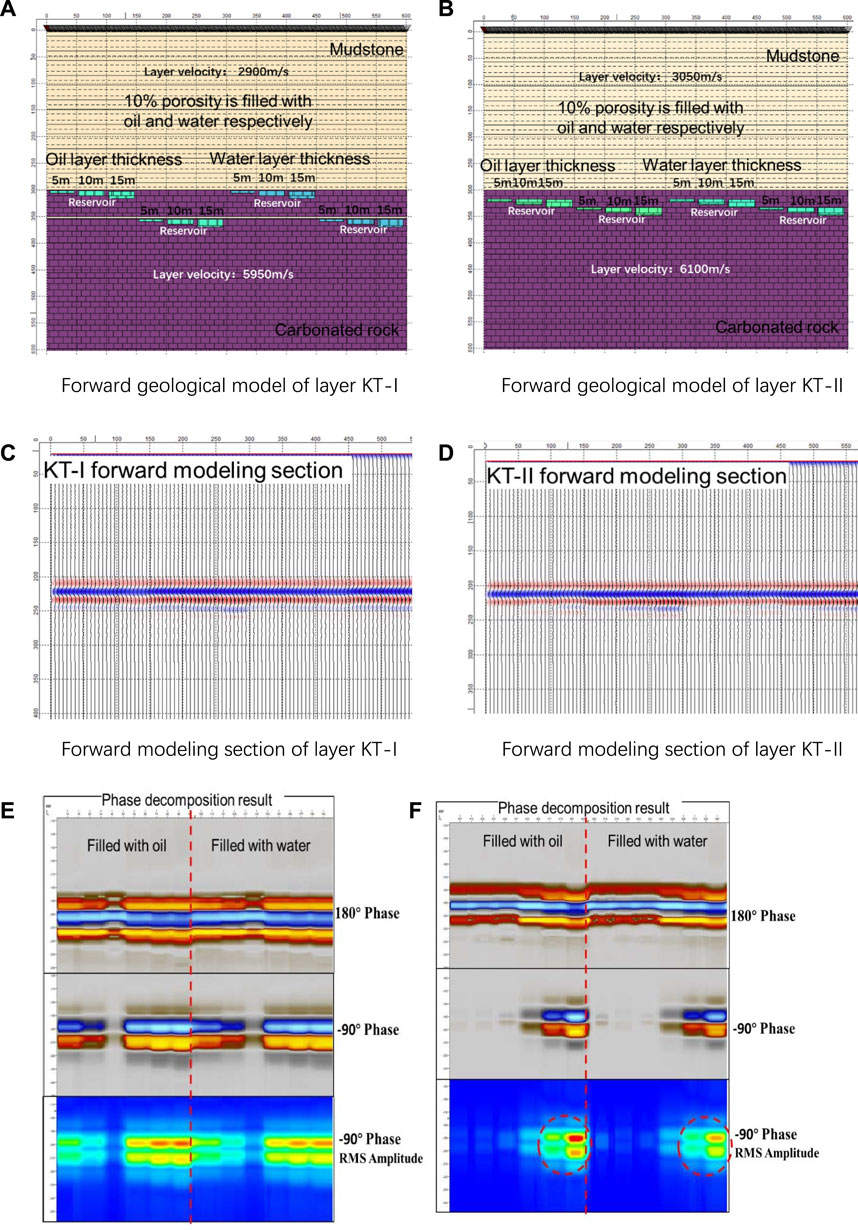
FIGURE 5. Geological model, forward modeling records and phase decomposition results.
The sections obtained by using 30 Hz dominant frequency, Ricker wavelet, surface shooting, single row receiving and wave equation forward modeling method are shown in Figures 5C, D.
When the reservoir of layer KT-I is close to the top interface (2 m): 10–15 m thick oil layer will significantly weaken the reflection intensity of the overlying interface, but 15 m thick water layer will also significantly weaken the reflection intensity of the overlying interface. Then, the oil layer and water layer are difficult to identify. When the reservoir of layer KT-I is farer from the top interface (>50 m) and there is a mudstone interlayer: the reservoir has stronger reflection (relative to the surrounding rock and mudstone interlayer), thus the reservoir can be identified.
When the reservoir of layer KT-II is 20 m from the top interface: 10–15 m oil layer weakens the reflection intensity of the overlying interface, similar to that of layer KT-I, but the weakening degree is reduced. The 0–15 m thick water layer will also cause the above phenomenon. When the reservoir of layer KT-II is 40 m away from the top interface: the reservoir is characterized by stronger reflection (relative to the surrounding rock and mudstone interlayer), and the top and bottom of the reservoir with a certain thickness can be identified. Therefore, oil layer and water layer cannot be determined from the conventional seismic reflection amplitude alone.
The forward modeling results of layer KT-I and layer KT-II are decomposed by phase decomposition technique (Figures 5E, F) to obtain 180° and −90° phase component sections. From the phase decomposition results of layers KT-I and KT-II, the 180° phase component section mainly reflects the characteristics of layer KT-I interface; On the −90° phase component section, the waveform is distributed in blocks, similar to the shape of the reservoir in the geological model; RMS amplitude is calculated in −90° phase component, and it can be seen that the reflection characteristics of the reservoir are more obvious. Moreover, the amplitude intensity of oil layer is greater than that of water layer. Therefore, the phase decomposition technique can be used to identify the existence of oil and gas reservoirs.
The phase information of seismic data can be obtained by spectrum decomposition of seismic data, so the selection of spectrum decomposition algorithm is also crucial to the result of phase decomposition. Spectrum decomposition has been widely used in fine geological interpretation. Due to the sensitivity of frequency change, many subtle stratigraphic features have been more finely interpreted and identified in the frequency domain (Zhang et al., 2017; Chen Y et al., 2020). Affected by stratum absorption and other factors, seismic wavelet changes with time and space. In order to reflect the influence of stratum in the target layer on seismic wavelet, spectrum decomposition must be carried out in a small time window. There are several different implementation methods for spectrum decomposition. In the early stage, the short time Fourier transform (STFT), continuous wavelet transform (CWT), S-wave transform (ST) and other methods were used for spectrum decomposition. Affected by the time window tailing effect, these methods have low resolution in time and frequency.
In this paper, the constrained least squares spectrum analysis (CLSSA) is used for spectrum decomposition. Compared with other methods, the CLSSA method has higher resolution in time and frequency. Compared with the discrete Fourier transform, it reduces the tailing effect of the window and spectrum smoothing, which can ensure better maintenance of the reflection spectrum characteristics in the short window. Compared with short-time Fourier transform, the improvement of resolution by CLSSA method increases with the shortening of time window length. Therefore, the least square method is superior to short-time Fourier transform and continuous wavelet transform in spectrum decomposition.
The time-frequency spectrum obtained by applying different spectral decomposition methods to the actual seismic traces (Figure 6). It can be seen that the frequency spectrum of the 20 ms Fourier transform is artificially widened, and the truncation effect in the time domain is obvious. The time lag effect of 100 ms Fourier transform and wavelet transform is obvious, and the wavelet transform moves to the low frequency end. The spectrum decomposition of the least squares method has high vertical resolution, and is closely related to the energy of the seismic traces. The tailing effect in frequency domain and time domain is small.
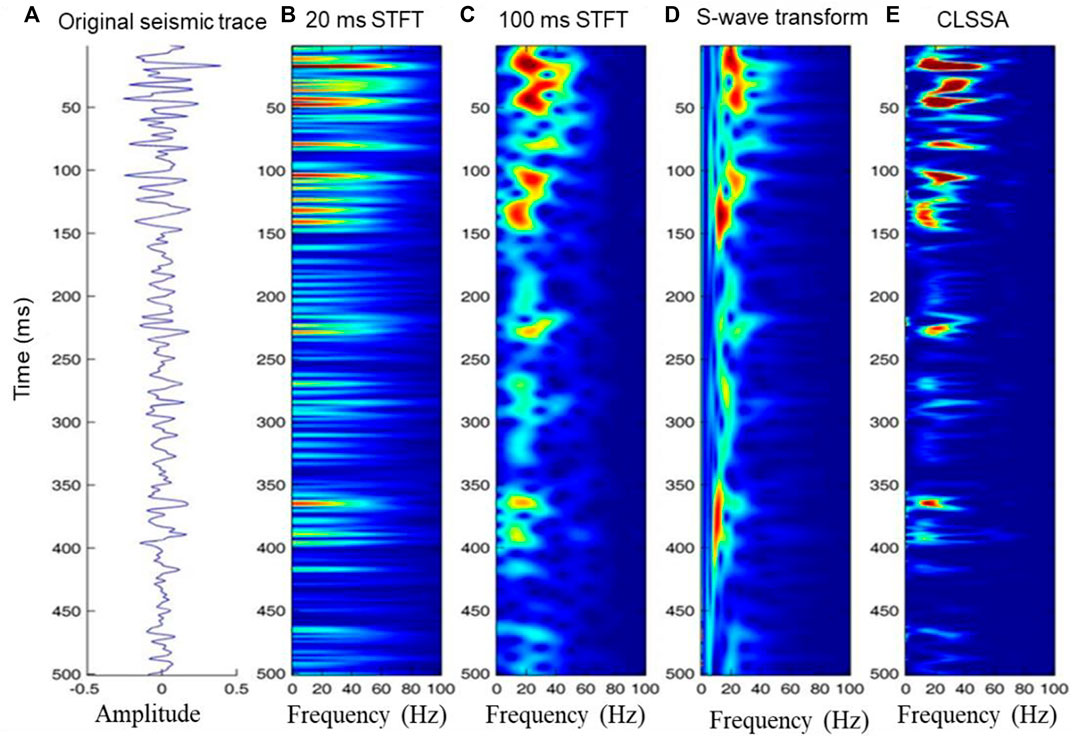
FIGURE 6. Comparison of spectrum decomposition results of different methods applied to actual seismic traces ((A) actual seismic records, (B) Fourier transform with 20 ms window, (C) Fourier transform with 100 ms window, (D) wavelet transform, (E) least squares spectrum decomposition).
A lot of attempts have been made on the input data of phase decomposition for oil and gas detection. The first attempt is to use the original full-frequency data for phase decomposition, and the effect of identifying oil-water layers is indistinct. Therefore, on the basis of least square spectrum decomposition processing, single frequency data was innovatively adopted for phase decomposition by 10 Hz, 20 Hz, and 30 Hz single frequency volumes. According to the characteristics of the spectrum gather of the well side traces, the oil and gas response energy is concentrated near 20 Hz, so the 20 Hz single frequency volume is finally used for phase decomposition.
As shown in Figure 7A, through fine reservoir calibration, it can be found that the amplitude energy group of KT-I oil layer is about 20 Hz on the frequency gather and 30°–80° on the phase gather. The sensitive frequency bands of layers KT-II and KT-I are close, as shown in Figure 7B, but the sensitive phases are different, and they are located between 150° and 180° and between −150° and −180°.
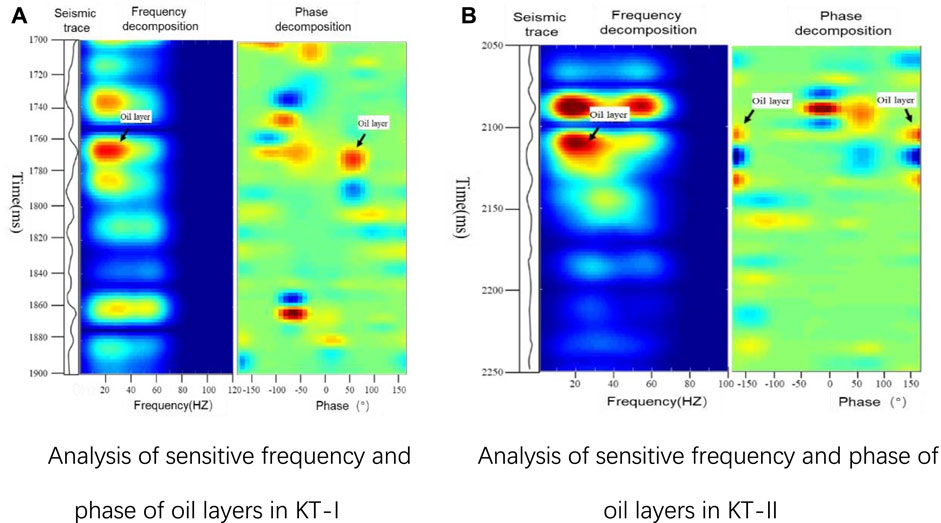
FIGURE 7. Analysis of sensitive frequency and phase of oil layers in different intervals.
After the sensitive frequency and phase are determined, oil and gas can be detected according to the amplitude corresponding to the specified frequency and phase section. The detection effect of this method is illustrated from the two dimensions of section and plane.
It can be seen from the section (Figures 8, 9) that the amplitude difference between oil layer and dry layer is not obvious in the conventional section. After the phase decomposition and data reconstruction of seismic data in sensitive frequency band, the designated phase stacking section can better distinguish oil layer and dry layer. On the overall phase stacking section, the amplitude of oil layer is stronger than oil-water layer, and oil-water layer is stronger than dry layer.
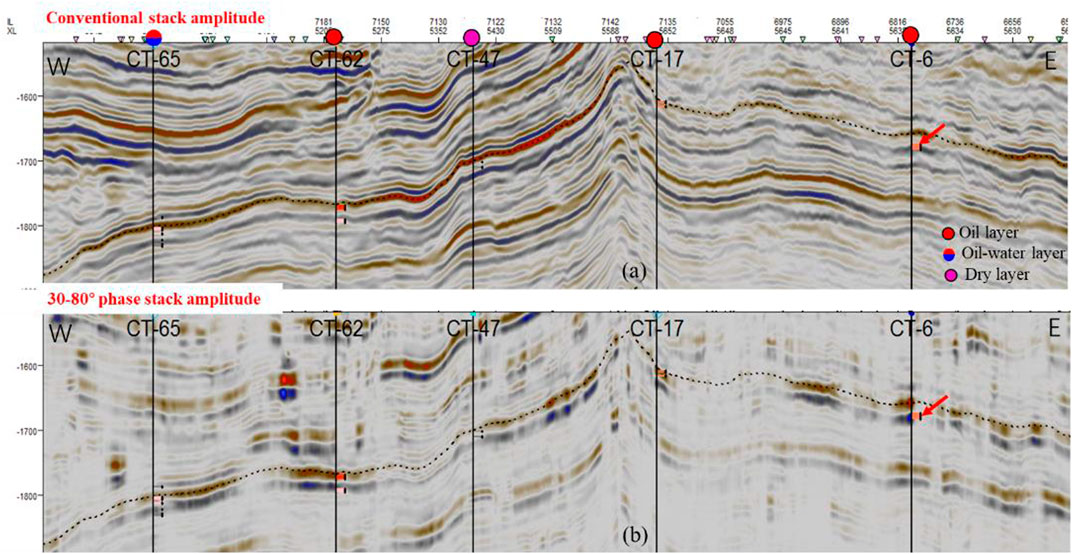
FIGURE 8. Seismic attribution comparison in the KT-I layer. (A) Conventional stack data volume and (B) Specified phase stack volume.
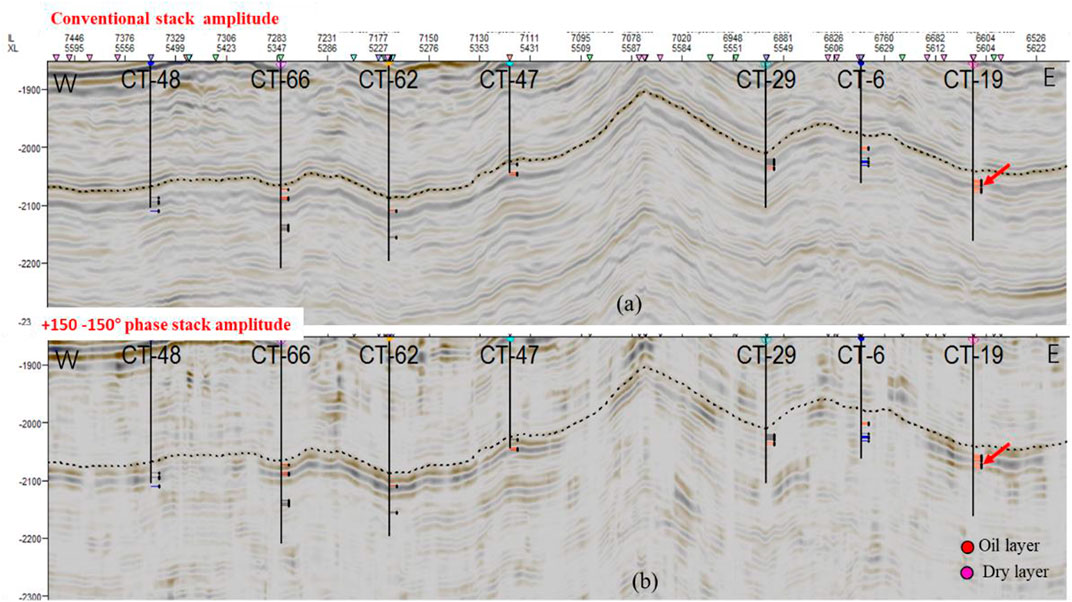
FIGURE 9. Comparison of conventional stack data volume (A) and specified phase stack volume (B) of KT-II.
In the phase interval stack volume, to extract the slice of RMS attribute of KT-I and KT-II respectively, and use the amplitude characteristics previously analyzed to detect fluids. Moreover, the RMS amplitude at the well point and the RMS amplitude of the phase decomposition are intersected, as shown in Figure 10. Compared with the amplitude detection results of conventional section, the phase decomposition results have a better distinction between the oil layer and oil-water layer of KT-I. The intersection results of KT-II are slightly worse than KT-I, but compared with the conventional seismic amplitude attributes, it has a better identification accuracy for oil layer.
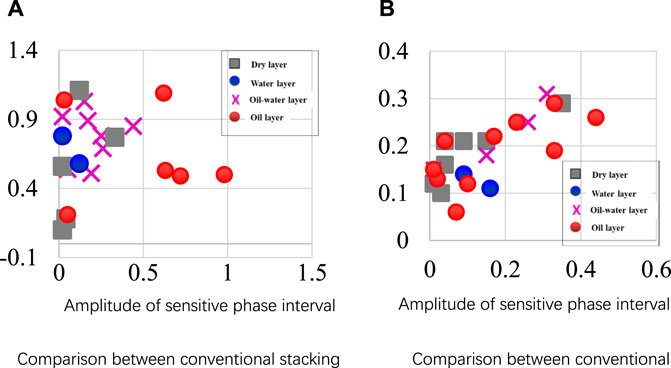
FIGURE 10. Cross plot of RMS amplitude of well point and RMS amplitude of phase decomposition reconstruction volume in different intervals.
According to the threshold value obtained from well intersection analysis, the fluid ranges of KT-I and KT-II can be carved. The left part in Figure 11C shows the fluid carving result of upper KT-I, and Figure 11D shows that of upper KT-II. Compared with conventional seismic amplitude attributes (Figures 11A, B), the fluid results identified by phase decomposition have a higher coincidence rate with the drilled wells. There are 6 industrial oil flow wells in layer KT-I, 6 wells are matched, thus the coincidence degree is 100%. There are 10 industrial oil flow wells in layer KT-II, 8 wells are matched, thus the coincidence degree is 80%. Moreover, according to the prediction results, the drilled wells L-4 and L-7 have both obtained industrial oil flow in the target formation. Hereinto, Well L-4 obtained daily oil production of 4.89 m3 in Carboniferous KT-I in testing, and obtained maximum daily oil production of 24 m3 in KT-II; Well L-7 obtained daily oil production of 12 m3 in Carboniferous KT-II in testing after acid fracturing. It also verifies the accuracy of oil and gas detection results.
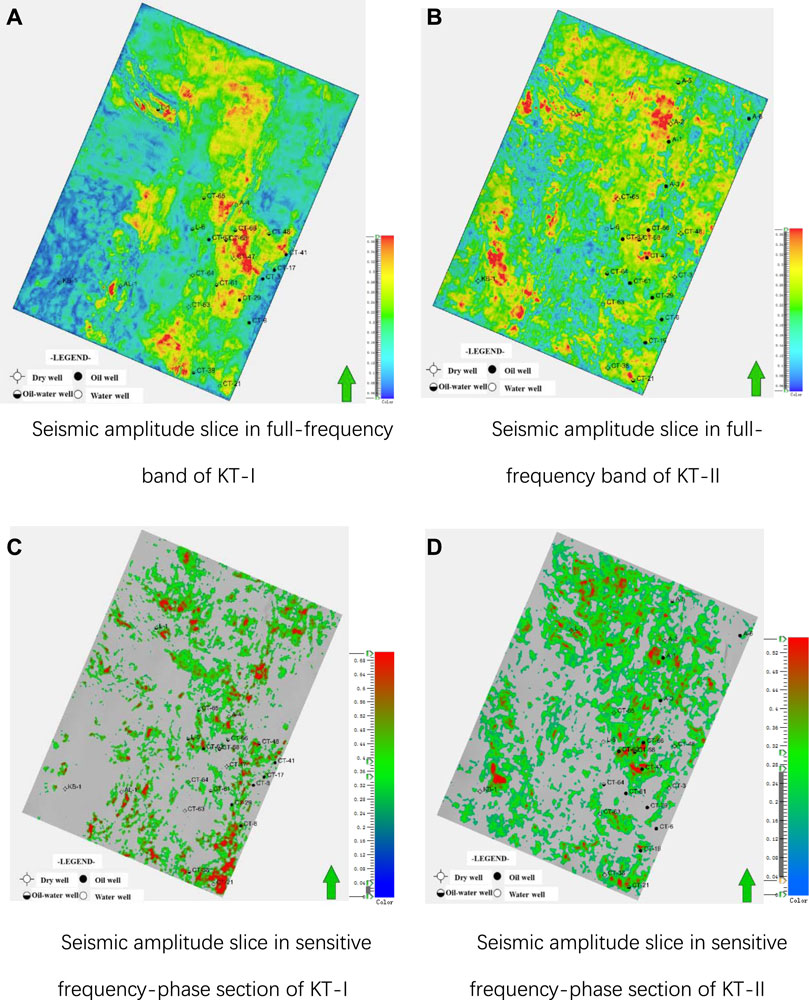
FIGURE 11. Comparison of oil and gas detection effects between conventional amplitude and amplitude after phase decomposition.
In the case that conventional amplitude and frequency cannot distinguish fluids clearly, this paper provides a new idea for oil and gas detection. Its core is to find the corresponding sensitive frequency and phase of oil and gas layers. In a specific study area, the sensitive frequency and phase are different, so it is necessary to analyze and optimize according to forward modeling and actual data. Therefore, in practical application, it is necessary to strengthen the combination of well and seismic analysis.
The phase range of oil layer energy concentration of KT-I layer in the Pre-Caspian Basin is 30°–80°, and the characteristics of oil layer, oil-water layer and dry layer on section are obvious, thus they can be effectively distinguished; The phase range of energy concentration of KT-II oil layer is between +150° and −150°.
Both forward modeling and practical application results show that the phase decomposition technique is highly reliable for fluid identification under the carbonate reef facies controlled constraint, and the identification results can be used for well location optimization, which is of great significance for improving the exploration efficiency of complex carbonate rocks. However, this method has some limitations. It requires drilling data to optimize the sensitive frequency and phase, thus it is difficult to apply in the area without wells.
The original contributions presented in the study are included in the article/Supplementary material, further inquiries can be directed to the corresponding author.
ZW and SJ designed and directed the project; RJ, SS, and YZ performed the experiments; XW, YL, and YW contributed significantly to analysis and manuscript preparation; YZ, ZW, and RJ performed the data analyses and wrote the manuscript. All authors contributed to the article and approved the submitted version.
National Major Science and Technology Projects of China (Grant No. 2016ZX05029), and PetroChina Science and Technology Major Project (Grant Nos 2019D-4307; 2021DJ31). The authors declare that this study received funding from PetroChina Science and Technology Major Project. The funder was not involved in the study design, collection, analysis, interpretation of data, the writing of this article, or the decision to submit it for publication. The authors declare that PetroChina Science and Technology Major Project was not involved in the study design, collection, analysis, interpretation of data, the writing of this article, or the decision to submit it for publication.
This research was funded by the China National Petroleum Corporation Science and Technology Program (No. 2019D-4307; 2021DJ31) and National Major Science and Technology Projects of China (Grant No. 2016ZX05029).
Authors ZW, YZ, ZJ, RJ, XW, YW, and YL were employed by CNPC. Authors SJ and SS were employed by CNODC.
All claims expressed in this article are solely those of the authors and do not necessarily represent those of their affiliated organizations, or those of the publisher, the editors and the reviewers. Any product that may be evaluated in this article, or claim that may be made by its manufacturer, is not guaranteed or endorsed by the publisher.
Barbato, U., Portniaguine, O., Winkelman, B., and Castagna, J. (2017). Phase decomposition as a dhi in bright-spot regimes: A gulf of Mexico case study. Soc. Explor. Geophys. 2017, 3976–3980. SEG Technical Program Expanded Abstracts 2017. doi:10.1190/segam2017-17737608.1
Cao, X., Chang, X., Liu, Y., and Chunlei, Z. (2010). Seismic singularity attribute and its applications in hydrocarbon detection. Petroleum Explor. Dev. 37 (3), 325–329. doi:10.1016/s1876-3804(10)60036-5
Castagna, J., Chesnokov, E., Zheng, Y., and Oyem, A. (2019). Reservoir delineation using bandwidth extension and phase decomposition. Houston: University of HOUSTON.
Castagna, J., Oyem, A., Portniaguine, O., and Aikulola, U. (2016). Phase decomposition. Interpretation 4 (3), N1–N10. doi:10.1190/int-2015-0150.1
Chen, C., Feng, S., and Aling, M. (2012). Application of 90° phase data in lithologic interpretation. Oil Geophys. Prospect. 47 (1), 95–99.
Chen, H., Peng, L., Chen, X., Hu, Y., Li, R., and Fang, Y. (2022). A three-parameter W transform and its application to gas reservoir identification. Geophysics 87 (5), V521–V532. doi:10.1190/geo2021-0803.1
Chen, X., Chen, H., Fang, Y., and Hu, Y. (2020). High-order synchroextracting time-frequency analysis and its application in seismic hydrocarbon reservoir identification. IEEE Geoscience Remote Sens. Lett. 18 (11), 2011–2015. doi:10.1109/lgrs.2020.3009259
Chen, Y., Bi, J., Qiu, X., Yang, H., and Cao, J. (2020). A method of seismic meme inversion and its application. Petroleum Explor. Dev. 47 (06), 1235–1245. doi:10.1016/s1876-3804(20)60132-5
Fang, J., Wu, L., and Gao, G. (2008). Sedimentary facies and types of carbonate rock reservoir in caspian seashore basin: A case from carboniferous. Petroleum Explor. Dev. 35 (4), 498–508.
Guo, Q., Ba, J., and Luo, C. (2022). Nonlinear petrophysical amplitude variation with offset inversion with spatially variable pore aspect ratio. GEOPHYSICS 87 (4), M111–M125. doi:10.1190/geo2021-0583.1
He, L., Zhao, L., and Li, J. (2014). Complex relationship between porosity and permeability of carbonate reservoirs and its controlling factors: A case of platform facies in Pre-Caspian Basin. Petroleum Explor. Dev. 41 (2), 206–214. doi:10.1016/S1876-3804(14)60026-4
Jin, S., Zheng, J., and Yu, B. (2015). Late Paleozoic sequence stratigraphy and sedimentary facies in the eastern margin of the PreCaspian basin. Beijing: Petroleum Industry Press.
Liang, S., Wang, Y., and Jin, S. (2013). Controlling of tectonic evolution on hydrocarbon occurrence in PreCaspian Basin. Petroleum Geol. Exp. 35 (2), 174–178.
Lin, C., Zhang, X., and Dong, C. (2007). Hepatoprotective effects of Chai-Hu-Ching-Kan-Tang on acetaminophen-induced acute liver injury in rats. Acta Pet. Sin. 28 (2), 69–79. doi:10.1142/S0192415X07004631
Pan, W., Liu, H., and Zhang, L. (2013). Application of 90°-phase seismic data in prediction of sandstone. J. Geomechanics 19 (3), 304–314.
Qiao, Z., Han, Z., and Kong, S. (2018). Application of extremal amplitude and hydrocarbon detection technique to the oil and gas exploration in the Bohai Sea. Oil Drill. Prod. Technol. 40 (A01), 4. doi:10.13639/j.odpt.2018.S0.006
Selmara, D. A. E., Castagna, J. P., and Gil, G. (2019). Case study: Phase-component amplitude variation with angle. GEOPHYSICS 84 (4), B285–B297. doi:10.1190/geo2018-0762.1
Xu, C., Qian, G., and Zhang, J. (2009). Geological characteristics and reservoir-forming assemblages. BeiJing: Petroleum Industry Press.
Xu, K. (2011). Hydrocarbon accumulation characteristics and exploration practice in the Middle Block of the eastern margin of the Precaspian Basin. BeiJing: Petroleum Industry Press.
Yang, Z., Sha, X., and Li, Z. (2010). Hydrocarbon detection and application in lithologic resevoir exploration. Nat. Gas. Geosci. 21 (5), 822–827.
Yu, H., Zhang, Y., and Li, J. (2013). Identification of the carbonate reservoir based on spectral decomposition. Prog. Geophys. 28 (3), 1440–1446. doi:10.6038/pg20130338
Zhang, H., Ma, J., and Jiang, Z. (2017). Application of spectral decomposition technique in reservoir characterization and fluid identification. Complex Hydrocarb. Reserv. 10 (1), 31–33.
Zhao, L., Geng, J., Cheng, J., Han, D., and Guo, T. (2014). Probabilistic lithofacies prediction from prestack seismic data in a heterogeneous carbonate reservoir. GEOPHYSICS 79 (5), M25–M34. doi:10.1190/geo2013-0406.1
Zhao, L., Li, J., Li, K., Zifei, F., Heng, S., and Xubin, C. (2010). Development and genetic mechanism of complex carbonate reservoir fractures: A case from the zanarol Oilfield, Kazakhstan. Kazakhstan. Petroleum Explor. Dev. 37 (3), 304–309. doi:10.1016/s1876-3804(10)60034-1
Zhao, W., Yang, W., and Zhao, W. (2014). The review of technical progress in application of seismic reservoir and hydrocarbon prediction. Prog. Geophys. 29 (5), 2337–2346.
Zhao, W., Zhao, L., Wang, X., Wang, S., Sun, M., and Wang, C. (2016). Phase behavior characteristics and water-flooding development technical policy of weakly volatile oil in carbonate reservoirs. Petroleum Explor. Dev. 43 (2), 308–314. doi:10.1016/s1876-3804(16)30035-0
Zheng, J., Peng, G., and Sun, J. (2019). Fusing amplitude and frequency attributes for hydrocarbon detection using 90° phase shift data. Geophys. Prospect. Petroleum 58 (1), 130–138.
Zheng, J., Wang, Z., and Xue, L. (2011). Petroleum Geology Theory and exploration practice in salt-bearing basins in central Asia. Beijing: Petroleum Industry Press.
Keywords: Pre-Caspian Basin, phase decomposition, hydrocarbon seismic direct detection, frequency, seismic signals analysis, fluids detection, forward modeling analysis
Citation: Wang Z, Zhang Y, Ji Z, Jin S, Jiang R, Wang X, Wang Y, Sheng S and Lin Y (2023) Application of a new hydrocarbon detection technique with phase decomposition in carbonate reservoir of the Pre-Caspian Basin. Front. Earth Sci. 11:1136423. doi: 10.3389/feart.2023.1136423
Received: 03 January 2023; Accepted: 21 June 2023;
Published: 06 July 2023.
Edited by:
Jian Sun, Ocean University of China, ChinaReviewed by:
Ying Hu, Chengdu University of Technology, ChinaCopyright © 2023 Wang, Zhang, Ji, Jin, Jiang, Wang, Wang, Sheng and Lin. This is an open-access article distributed under the terms of the Creative Commons Attribution License (CC BY). The use, distribution or reproduction in other forums is permitted, provided the original author(s) and the copyright owner(s) are credited and that the original publication in this journal is cited, in accordance with accepted academic practice. No use, distribution or reproduction is permitted which does not comply with these terms.
*Correspondence: Yiqiong Zhang, Y3VnYnp5cUAxNjMuY29t
Disclaimer: All claims expressed in this article are solely those of the authors and do not necessarily represent those of their affiliated organizations, or those of the publisher, the editors and the reviewers. Any product that may be evaluated in this article or claim that may be made by its manufacturer is not guaranteed or endorsed by the publisher.
Research integrity at Frontiers
Learn more about the work of our research integrity team to safeguard the quality of each article we publish.