- Division of Glacial Environment Research, Korea Polar Research Institute (KOPRI), Incheon, Republic of Korea
Although the El Niño-Southern Oscillation (ENSO) affects West Antarctica via teleconnection, it is delayed by a season, because the Amundsen Sea Low (ASL) anomaly in response to the ENSO is the strongest in May. However, the process and mechanism of the delay has not been fully elucidated yet. In this study, we examined the formation of the ENSO-driven teleconnection in each month from January to May by analyzing the kinetic energy conversion and Rossby wave propagation. The flow perturbed by the ENSO gains energy from the basic state by energy conversion, but the perturbation does not reach the high latitudes until April. In May, although the ENSO intensity becomes weak, the development of the subtropical jet induces waves to propagate further south, resulting in the anticyclonic circulation anomaly over the ASL region. Numerical experiments that account for the decay of the ENSO forcing and the monthly varying basic state also indicate that the formation of the teleconnection is the strongest in May. The results reveal that the configuration of the basic state is crucial for the teleconnection in response to the ENSO to reach West Antarctica.
1 Introduction
The El Niño-Southern Oscillation (ENSO) is the largest atmospheric variability on the interannual time scales and leads to changes in atmosphere, ocean, and even the cryosphere over West Antarctica (Yeh et al., 2018; Li et al., 2021). This climate phenomenon weakens the Amundsen Sea Low (ASL) at the positive phase via atmospheric teleconnection. The ENSO-driven ASL anomaly induces momentum transfer to the ocean over the Antarctic continental shelf and causes inflow of warm water beneath the ice shelves (Dutrieux et al., 2014; Jenkins et al., 2018). It subsequently results in basal melting of the ice shelves as well as ice mass loss, which is directly associated with the sea level rise (Holland et al., 2019). The ASL anomaly modulates the snowfall and sea ice variations in West Antarctica as well (Turner et al., 2016; Paolo et al., 2018; Meehl et al., 2019). These previously reported observations indicate that the ENSO clearly affects the West Antarctic climate through ASL modulation.
The process by which the ENSO induces the ASL anomaly does not occur simultaneously. The ENSO grows in the austral spring, has the strongest strength in summer, and decays in autumn. On the other hand, the ASL anomaly in response to the ENSO is the strongest in autumn than in summer. Thus, the occurrence of the ASL anomaly seems delayed with respect to the ENSO occurrence (Jin and Kirtman, 2010; Yiu and Maycock, 2019), and this discrepancy can be explained by the typical characteristics of the teleconnections that form differently according to the seasonal cycle. The teleconnection to high latitudes is weak in summer, whereas they are strong in autumn, winter, and spring (Webster, 1982; Ambrizzi et al., 1995; Lee et al., 2009; Lee and Jin, 2021), because the basic state in the colder seasons provides a route for the barotropic Rossby wave to propagate to high latitudes (Hoskins and Ambrizzi, 1993; Yang and Hoskins, 1996). However, the mechanism underlying the strengthening of the ENSO-related ASL anomaly in autumn, according to the gradually changing basic state from summer to autumn, is not fully elucidated. Therefore, in this study, we examined the detail process of the one-season delay by analyzing the monthly mean fields, which can help in gaining a deeper understanding of the impact of the ENSO on West Antarctica.
To demonstrate the variance in the ASL anomaly, we examined the circulation anomaly that is established over the Amundsen Sea by the barotropic Rossby wave propagating from the ENSO. Teleconnection is mainly generated by the waves horizontally propagating from the forcing region. The formation of teleconnection occurs via two processes: 1) generation and 2) propagation of the barotropic Rossby wave. The former is associated with the generation of the wave from the forcing. Immediately after the atmosphere is disturbed by the forcing, the divergent component in perturbation becomes dominant and creates the Rossby wave source by interacting with the basic state (Sardeshmukh and Hoskins, 1988; Jin and Hoskins, 1995). The Rossby wave source can be a starting point of the propagating barotropic Rossby wave. Meanwhile, in a point of view of energy, the wave develops via kinetic energy conversions (Simmons et al., 1983; Wang et al., 2022). The wave is amplified as the perturbation gains kinetic energy from the basic state. The latter, i.e., propagation of the barotropic Rossby wave, is related to the propagation of the wave to remote regions. In this process, the configuration of the basic state plays a deterministic role in developing a path for wave propagation. The wave moves through the waveguide, in which the basic zonal wind is strong and meridionally localized, while the propagation weakens at the region, where the basic zonal wind is near or less than zero (Karoly, 1983). In this study, the energy conversion phenomenon, total wavenumber, and wave activity flux were used to identify the development of the barotropic Rossby wave and recognize the wave propagating toward the south in order to examine the ENSO-induced teleconnection in West Antarctica.
2 Data and methods
2.1 Datasets
The ERA5 reanalysis monthly data, obtained from the European Centre for Medium-Range Weather Forecasts (ECMWF) for atmospheric variables, and the monthly sea surface temperature (SST) data, obtained from the Met Office Hadley Center SST dataset (HadISST) version 1.1, were used for the period from 1979 to 2019, and the linear trend was removed from the data. To subtract the ENSO-related variations from the variables, a regression analysis was conducted with the DJF-mean Niño3 index, which is calculated by averaging the SST over the domain of 150W°−90°W and 5°S−5°N and by normalizing the obtained values. To confirm the statistical significance of the regression, the two-tail Student’s t-test was performed.
2.2 Kinetic energy conversion (CK)
The barotropic perturbation gains kinetic energy from the basic state through the barotropic instability, and the energy conversion can be calculated as follows (Simmons et al., 1983):
where
2.3 The total wavenumber
To identify the wave propagation path, the total wavenumber is used based on the modified dispersive relationship for the barotropic Rossby wave (Li et al., 2015; Zhao et al., 2015); the total wavenumber is expressed as follows:
where
Thus negative value of
2.4 Wave activity flux
The wave activity flux is used to diagnose and visualize Rossby wave propagation (Plumb, 1985), and the horizontal wave activity flux is derived as follows:
where, a,
2.5 Linear baroclinic model (LBM)
To demonstrate the ENSO-induced circulation anomaly, we used an atmospheric linear baroclinic model (LBM) with T42 horizontal and L20 vertical resolutions in sigma coordinates, which can be obtained from http://ccsr.aori.u-tokyo.ac.jp/∼lbm/sub/lbm.html. The basic state in the model is initialized with the monthly mean climatological field of the ERA5 data. To mimic the ENSO-related forcing in the model, we induced diabatic heating at 160°W and 0°N, and consistently added this diabatic heating in the temperature tendency equation as an external forcing during the integration time. The forcing has an ellipse-shape with 30° longitudinal and 20° latitudinal scales and a maximum peak around the sigma level of 0.229. The simulated field averaged over 20–30 integration days is presented here for the analysis.
3 Results
To identify the delay between the ENSO and the ASL anomaly, regression maps of the SST and circulation anomalies were plotted with increasing time since austral summer in Figure 1. The ENSO-related SST anomaly has the greatest strength in December to January (DJ) and gradually weakens since February to March (FM) until Jun to July (JJ). The circulation anomaly shows the significant anticyclonic anomaly at the ASL region over West Antarctica until April to May (AM), whereas no significant anomaly in JJ is observed because of the weakened ENSO intensity. The strongest peak of the circulation anomaly appears in AM and is located further east and south, which are closer to West Antarctica (Figure 1C). It causes the one-season delayed impact of the ENSO on the climate in West Antarctica, e.g., SST (Lee et al., 2010), snowfall (Sasgen et al., 2010), atmospheric river (Wille et al., 2019), ice melting (Paolo et al., 2018; Holland et al., 2019), and sea ice (Paolo et al., 2018). Figures 2A, B show the monthly changes in the SST anomaly over the western Pacific and the circulation anomaly over the ASL region. The ENSO-related SST warming declined since December, while the ENSO-driven circulation anomaly shows the greatest intensity in May, because the circulation anomaly migrates eastward over time (Figure 2C). These results indicate that the ENSO is relevant to the May ASL anomaly.
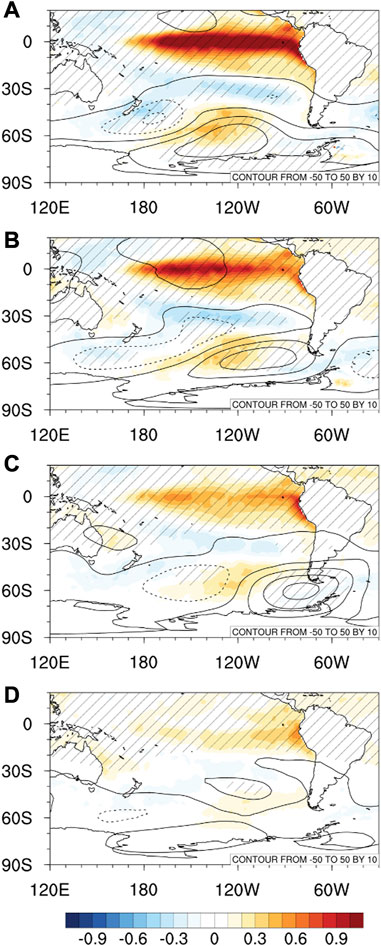
FIGURE 1. Regression maps of the SST (shaded; K) and 500-hPa geopotential height (contour; intervals of 10 m) anomalies for (A) DJ, (B) FM, (C) AM and (D) JJ. The statistically significant values of the SST and geopotential height anomalies at 95% confidence level are represented by shaded and hatched areas, respectively.
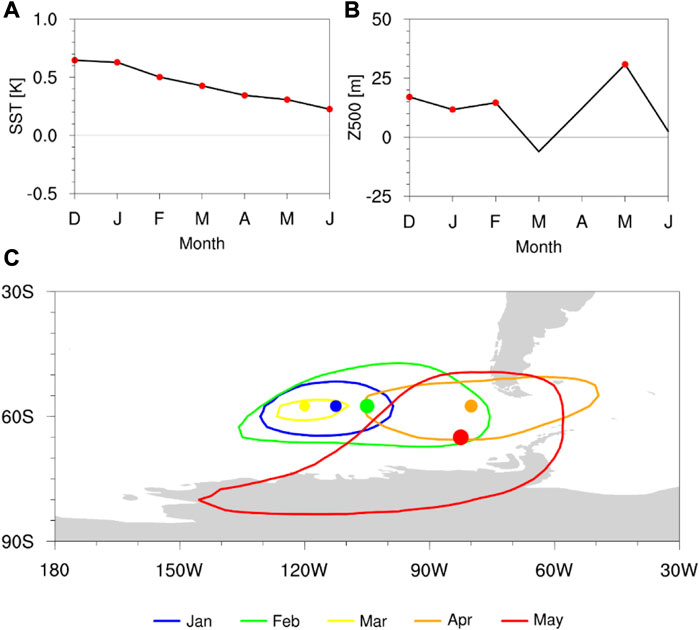
FIGURE 2. Regression coefficients of the (A) SST anomaly (K) over the eastern Pacific region (160°W–70°W, 15°S–15°N) and (B) 500-hPa geopotential height anomaly (m) over the Amundsen Sea region (100°W–60°W, 80°S–60°S). The red dot represents the statistically significant value at 95% confidence level. (C) Horizontal distribution of the ENSO-driven anticyclonic circulation anomaly near the Amundsen Sea in each month from January to May. The contour is 20 m of the 500-hPa geopotential height anomaly in the regression map. The inside dot and its size denote the location of the center and relative intensity of the circulation anomaly, respectively. The colors represent each month (defined in the legend).
Previous studies were focused on the investigation of the ENSO teleconnection in the coldest and warmest season to understand seasonality in the teleconnection (Yiu and Maycock, 2019; Yiu and Maycock, 2020; Wang et al., 2022). The teleconnection is strong in austral winter than in summer, but the ENSO rarely exists in winter (Figure 1D). Thus, examining the teleconnection in autumn, when the ENSO-related SST remains, is more practical. Autumn exhibits the relatively weaker basic state than winter. The subtropical jet occurs in autumn and grows until winter, and in particular, the intensity of the subtropical jet exceeds that of the polar jet in May.
To understand the intensification of the circulation anomaly, we investigated the monthly calculated energy conversion as shown in Figure 3. Here, it should be noted that the effect manifests as a change in the next month, because CK is the tendency. In January, the strong positive CK anomaly is observed near the central South Pacific (Figure 3A). It moves eastward until April (Figures 3B–D) and disappears in May (Figure 3E). This eastward shift is likely to induce the eastward migration of the ASL anomaly. Among the terms on the right-hand side of Eq. 1, the dominant component in the CK generation is advection of the climatological zonal wind due to the zonal wind flux induced by the zonal wind anomaly (
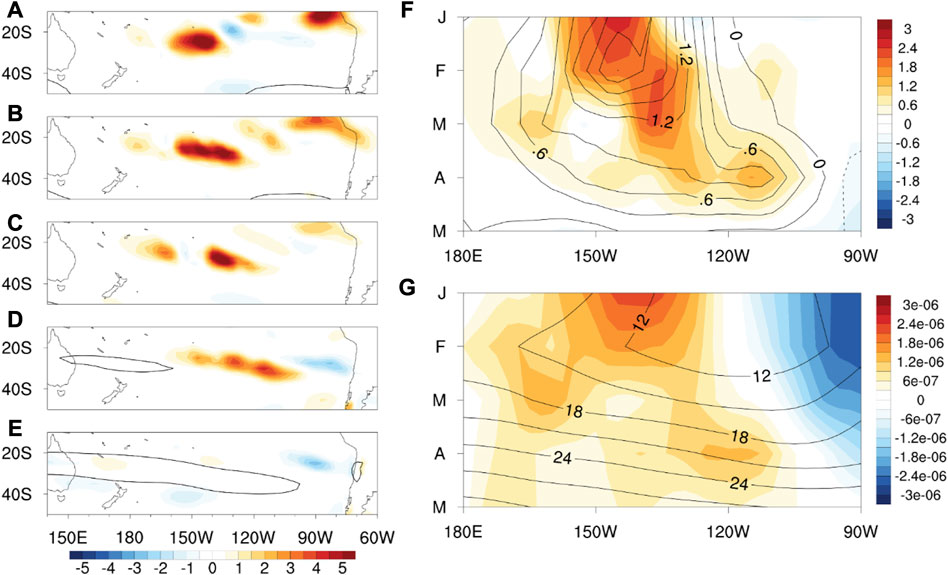
FIGURE 3. Regression maps of CK (shaded at 95% confidence level; m2 s–3) and
The barotropic Rossby wave driven by the ENSO obtains energy by the energy conversion in all months, but the perturbation reach at West Antarctica in May. To understand the reason, we analyzed the total wavenumber calculated from the modified dispersive relationship, and the corresponding results are displayed in Figure 4. Eq. 2 considers the effect of the meridional basic wind (Li et al., 2015; Zhao et al., 2015), which is neglected in the classical equation. The total wavenumber in the classical equation does not account for the wave propagation at the tropical easterly region (
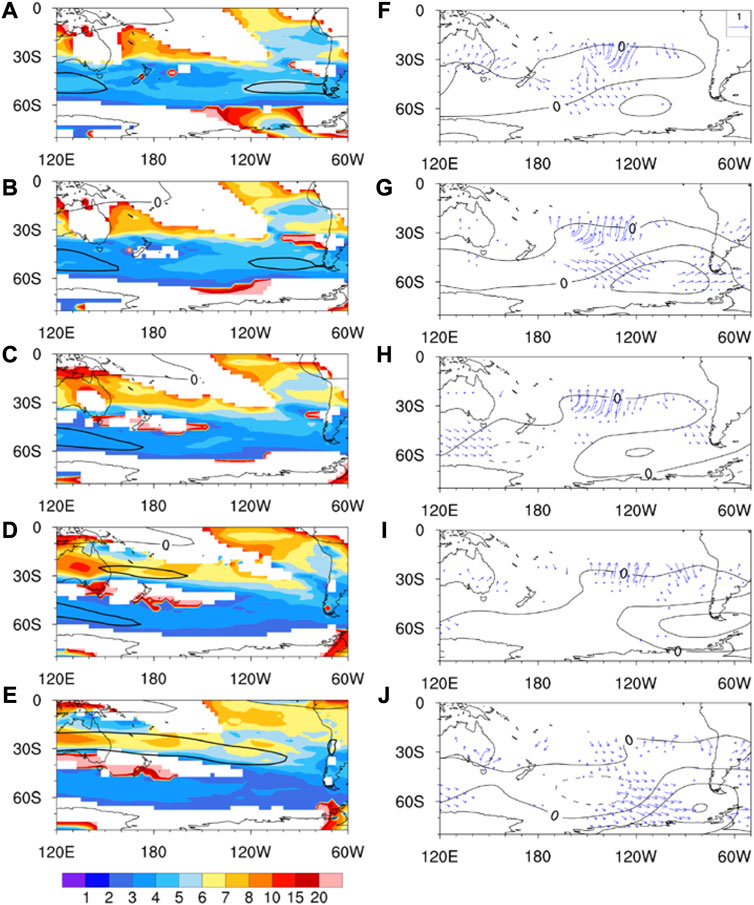
FIGURE 4. The total wavenumber (shaded, units of a−1, where a is the radius of the earth) at 250 hPa for the zonal wavenumber 2 and for the negative meridional wavenumber in each month from (A–E) January to May (left panels). The contour represents the 250-hPa climatological zonal wind velocity (m s–1), and the 0 and 30 m s–1 wind are represented by thin and thick lines, respectively. Regression maps of the 500-hPa geopotential height anomaly (contour, intervals of 20 m) and corresponding 250-hPa wave activity flux (vector, m2 s–2, less than 0.01 m2 s–2 is not drawn) from (F–J) January to May (right panels).
Additionally, numerical experiments using LBM were conducted to demonstrate that the formation of the teleconnection is the strongest in May. Considering the practical decay of the ENSO, the diabatic forcing was given with varied intensity (Figure 5), but the horizontal and vertical shapes of the forcing were constant. The basic state corresponding each month was initiated in the experiment. Interestingly, the result shows that the simulated circulation anomaly over the Amundsen Sea is considerably weaker in January to March, when the forcing is relatively strong (Figures 6A–C), whereas it becomes much stronger in April and May, when the forcing is weak (Figures 6D, E). The wave activity flux shows that the propagating wave energy reaches the high latitudes in May, indicating that the basic state is more important for the formation of teleconnections than the forcing intensity. Meanwhile, the experiments do not capture the eastward migration of the ASL anomaly seen in observation, and the anomaly appears relatively strong in April and May. It may be due to employing the unrealistic forcing, since features of the forcing, e.g., location and shape, can affect positioning and intensity of the teleconnection. Although this study ignored temporal change of the features for the sake of simplicity of model design, if considering them, the result could be closer to observation.
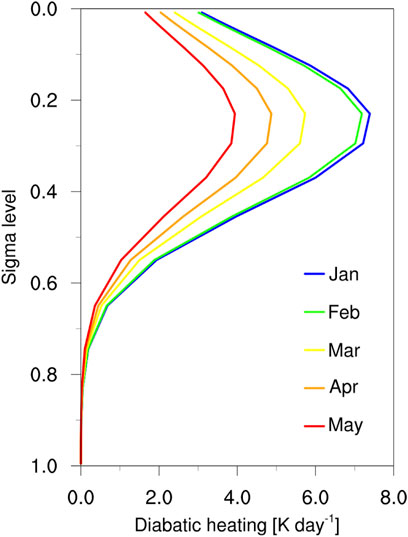
FIGURE 5. Vertical profile of the diabatic heating (K day–1) in sigma coordinates at the maximum location (160°W, 0°S). Considering the decaying ratio of the ENSO in Figure 2A, forcing with the intensity of 1, 0.97, 0.78, 0.66, and 0.53 times the January forcing are arbitrarily created from January to May. The heating in January to May are expressed by blue to red colors (explained in the legend).
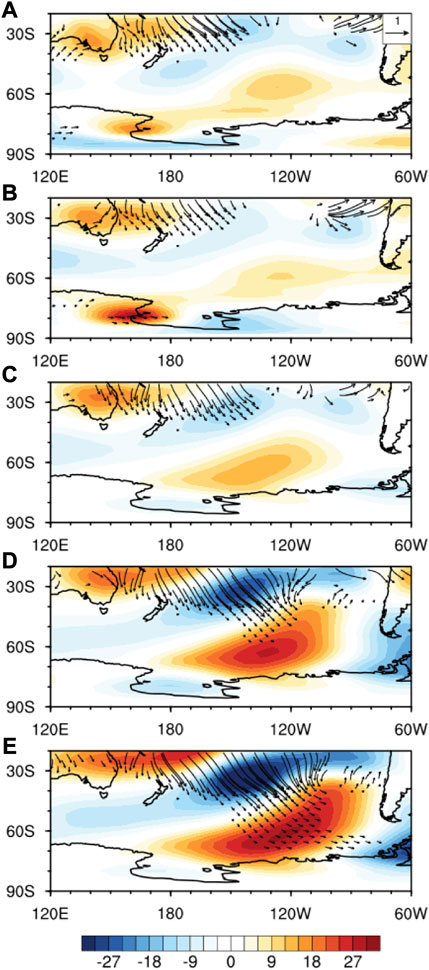
FIGURE 6. Simulated geopotential height anomaly (shaded, m) at 0.5 sigma and corresponding wave activity flux (vector, m2 s–2, less than 0.01 m2 s–2 is not drawn) at 0.26 sigma in response to the tropical forcing at 160°W. Each diabatic heating shown in Figure 5 is initiated in the model with the basic state of the corresponding month. (A–E) denote from January to May, respectively, and the zonal mean was removed from the geopotential height field to clearly present the wave propagation.
4 Conclusion and discussion
The findings of this study, which was focused on investigating the monthly varying teleconnections, clarify the mechanisms underlying the delayed response of the circulation anomaly over the Amundsen Sea to the ENSO. The analysis of the kinetic energy conversion reveals that the ENSO-induced perturbation continues to gain energy from the basic state as the ENSO appears. However, the propagation of the perturbation to West Antarctica is dependent on the basic state. The total wavenumber shows that in January to March, the basic state does not present a wave propagation path for southward movement of the wave. However, a path develops near the exit of the subtropical jet in May with the occurrence of jets. As a result, the perturbation arrives at the Amundsen Sea as seen in the wave activity flux, leading to the weakening of the ASL anomaly due to the developed anticyclonic circulation anomaly. Furthermore, we conducted numerical experiments, considering the decay of the ENSO over time, to confirm the prevailing teleconnection in May. It is properly reproduced in the model that the formation of the ASL anomaly is the strongest in May.
It should be noted that although we analyzed the delay effect using the summer-mean Niño index, the wave response does not occur as the energy retained from summer to May. Because the atmosphere is fluid and rapidly changes, a pulse of forcing requires only 2 weeks to move from the tropics to the high latitudes (Jin and Hoskins, 1995). If there is persistent forcing such as the ENSO, then a sequence of pulses of the forcing in time are formed, which result in a continuous response (Branstator, 2014). Therefore, the response to forcing in summer already dissipates in summer, and the response in May more likely appears due to the ENSO in this month (and probably April). Consequently, the response seems to be delayed from the peak of the ENSO.
The delay mechanism revealed in this study can greatly vary depending on the ENSO persistence and condition of the basic state. The ENSO is strongly related to the ASL anomaly in May in the present climate, but the timing can be modified if the ENSO or the basic state changes. In the future, the ENSO is expected to be stronger and longer lasting (Fredriksen et al., 2020; Hu et al., 2021; Lopez et al., 2022), and the basic zonal wind will strengthen and shift poleward in response to global warming (Fyfe and Saenko, 2006; Lorenz and DeWeaver, 2007). Thus, the impact of the ENSO on the ASL anomaly and West Antarctica is expected to appear sooner and for a longer duration in the future. However, further comprehensive studies on more details are required to understand the explicit change.
Data availability statement
Publicly available datasets were analyzed in this study. This data can be found here: https://www.ecmwf.int/en/forecasts/datasets/reanalysis-datasets/era5, https://www.metoffice.gov.uk/hadobs/hadisst.
Author contributions
H-JL and EJ contributed to conception and design of the research. H-JL performed the analysis and wrote the first draft. EJ reviewed and contributed to improving the manuscript.
Funding
This work was supported by Korea Institute of Marine Science and Technology Promotion (KIMST) grant funded by the Ministry of Oceans and Fisheries (KIMST 20190361).
Conflict of interest
The authors declare that the research was conducted in the absence of any commercial or financial relationships that could be construed as a potential conflict of interest.
Publisher’s note
All claims expressed in this article are solely those of the authors and do not necessarily represent those of their affiliated organizations, or those of the publisher, the editors and the reviewers. Any product that may be evaluated in this article, or claim that may be made by its manufacturer, is not guaranteed or endorsed by the publisher.
References
Ambrizzi, T., Hoskins, B. J., and Hsu, H. H. (1995). Rossby wave propagation and teleconnection patterns in the austral winter. J. Atmos. Sci. 52, 3661–3672. doi:10.1175/1520-0469(1995052<3661:RWPATP>2.0.CO;2)
Branstator, G. (2014). Long-lived response of the midlatitude circulation and storm tracks to pulses of tropical heating. J. Clim. 27, 8809–8826. doi:10.1175/JCLI-D-14-00312.1
Dutrieux, P., De Rydt, J., Jenkins, A., Holland, P. R., Ha, H. K., Lee, S. H., et al. (2014). Strong sensitivity of Pine Island ice-shelf melting to climatic variability. Science 343 (6167), 174–178. doi:10.1126/science.1244341
Fredriksen, H. B., Berner, J., Subramanian, A. C., and Capotondi, A. (2020). How does El niño–southern oscillation change under global warming—a first look at CMIP6. Geophys. Res. Lett. 47 (22), e2020GL090640. doi:10.1029/2020GL090640
Fyfe, J. C., and Saenko, O. A. (2006). Simulated changes in the extratropical Southern Hemisphere winds and currents. Geophys. Res. Lett. 33 (6), L06701. doi:10.1029/2005GL025332
Holland, P. R., Bracegirdle, T. J., Dutrieux, P., Jenkins, A., and Steig, E. J. (2019). West Antarctic ice loss influenced by internal climate variability and anthropogenic forcing. Nat. Geosci. 12 (9), 718–724. doi:10.1038/s41561-019-0420-9
Hoskins, B. J., and Ambrizzi, T. (1993). Rossby wave propagation on a realistic longitudinally varying flow. J. Atmos. Sci. 50 (12), 1661–1671. doi:10.1175/1520-0469(1993)050<1661:RWPOAR>2.0.CO;2
Hu, K., Huang, G., Huang, P., Kosaka, Y., and Xie, S. P. (2021). Intensification of El Niño-induced atmospheric anomalies under greenhouse warming. Nat. Geosci. 14 (6), 377–382. doi:10.1038/s41561-021-00730-3
Jenkins, A., Shoosmith, D., Dutrieux, P., Jacobs, S., Kim, T. W., Lee, S. H., et al. (2018). West Antarctic ice sheet retreat in the Amundsen Sea driven by decadal oceanic variability. Nat. Geosci. 11 (10), 733–738. doi:10.1038/s41561-018-0207-4
Jin, D., and Kirtman, B. P. (2010). How the annual cycle affects the extratropical response to ENSO. J. Geophys. Res. Atmos. 115 (D6), D06102. doi:10.1029/2009JD012660
Jin, F., and Hoskins, B. J. (1995). The direct response to tropical heating in a baroclinic atmosphere. J. Atmos. Sci. 52, 307–319. doi:10.1175/1520-0469(1995)052<0307:TDRTTH>2.0.CO;2
Karoly, D. J., and Hoskins, B. J. (1982). Three dimensional propagation of planetary waves. J. Meteorol. Soc. Jpn. Ser. Ii. 60 (1), 109–123. doi:10.2151/jmsj1965.60.1_109
Karoly, D. J. (1983). Rossby wave propagation in a barotropic atmosphere. Dyn. Atmo. Oceans. 7 (2), 111–125. doi:10.1016/0377-0265(83)90013-1
Lee, H. J., and Jin, E. K. (2021). Seasonality and dynamics of atmospheric teleconnection from the tropical Indian ocean and the western pacific to West Antarctica. Atmosphere 12 (7), 849. doi:10.3390/atmos12070849
Lee, S. K., Wang, C., and Mapes, B. E. (2009). A simple atmospheric model of the local and teleconnection responses to tropical heating anomalies. J. Clim. 22 (2), 272–284. doi:10.1175/2008JCLI2303.1
Lee, T., Hobbs, W. R., Willis, J. K., Halkides, D., Fukumori, I., Armstrong, E. M., et al. (2010). Record warming in the South Pacific and Western Antarctica associated with the strong central-pacific El Niño in 2009–10. Geophys. Res. Lett. 37 (19), 44865. doi:10.1029/2010GL044865
Li, X., Cai, W., Meehl, G. A., Chen, D., Yuan, X., Raphael, M., et al. (2021). Tropical teleconnection impacts on Antarctic climate changes. Nat. Rev. Earth Environ. 2 (10), 680–698. doi:10.1038/s43017-021-00204-5
Li, Y., Feng, J., Li, J., and Hu, A. (2019). Equatorial windows and barriers for stationary Rossby wave propagation. J. Clim. 32 (18), 6117–6135. doi:10.1175/JCLI-D-18-0722.1
Li, Y., Li, J., Jin, F. F., and Zhao, S. (2015). Interhemispheric propagation of stationary Rossby waves in a horizontally nonuniform background flow. J. Atmos. Sci. 72 (8), 3233–3256. doi:10.1175/JAS-D-14-0239.1
Lopez, H., Lee, S. K., Kim, D., Wittenberg, A. T., and Yeh, S. W. (2022). Projections of faster onset and slower decay of El Niño in the 21st century. Nat. Commun. 13 (1), 1915–2013. doi:10.1038/s41467-022-29519-7
Lorenz, D. J., and DeWeaver, E. T. (2007). Tropopause height and zonal wind response to global warming in the IPCC scenario integrations. J. Geophys. Res. Atmos. 112 (D10), 8087. doi:10.1029/2006JD008087
Meehl, G. A., Arblaster, J. M., Chung, C. T., Holland, M. M., DuVivier, A., Thompson, L., et al. (2019). Sustained ocean changes contributed to sudden Antarctic sea ice retreat in late 2016. Nat. Commun. 10 (1), 14–19. doi:10.1038/s41467-018-07865-9
Paolo, F. S., Padman, L., Fricker, H. A., Adusumilli, S., Howard, S., and Siegfried, M. R. (2018). Response of pacific-sector antarctic ice shelves to the El niño/southern oscillation. Nat. Geosci. 11 (2), 121–126. doi:10.1038/s41561-017-0033-0
Plumb, R. A. (1985). On the three-dimensional propagation of stationary waves. J. Atmos. Sci. 42 (3), 217–229. doi:10.1175/1520-0469(1985)042<0217:OTTDPO>2.0.CO;2
Sardeshmukh, P. D., and Hoskins, B. J. (1988). The generation of global rotational flow by steady idealized tropical divergence. J. Atmos. Sci. 45 (7), 1228–1251. doi:10.1175/1520-0469(1988)045<1228:TGOGRF>2.0.CO;2
Sasgen, I., Dobslaw, H., Martinec, Z., and Thomas, M. (2010). Satellite gravimetry observation of Antarctic snow accumulation related to ENSO. Earth Planet. Sci. Lett. 299 (3–4), 352–358. doi:10.1016/j.epsl.2010.09.015
Simmons, A. J., Wallace, J., and Branstator, G. W. (1983). Barotropic wave propagation and instability, and atmospheric teleconnection patterns. J. Atmos. Sci. 40 (6), 1363–1392. doi:10.1175/1520-0469(1983)040<1363:BWPAIA>2.0.CO;2
Turner, J., Hosking, J. S., Marshall, G. J., Phillips, T., and Bracegirdle, T. J. (2016). Antarctic sea ice increase consistent with intrinsic variability of the Amundsen Sea Low. Clim. Dyn. 46 (7), 2391–2402. doi:10.1007/s00382-015-2708-9
Wang, Y., Huang, G., Hu, K., Tao, W., Li, X., Gong, H., et al. (2022). Asymmetric impacts of El Niño and La niña on the pacific–south America teleconnection pattern. J. Clim. 35 (6), 1825–1838. doi:10.1175/JCLI-D-21-0285.1
Webster, P. J. (1982). Seasonality in the local and remote atmospheric response to sea surface temperature anomalies. J. Atmos. Sci. 39 (1), 41–52. doi:10.1175/1520-0469(1982)039<0041:SITLAR>2.0.CO;2
Wille, J. D., Favier, V., Dufour, A., Gorodetskaya, I. V., Turner, J., Agosta, C., et al. (2019). West Antarctic surface melt triggered by atmospheric rivers. Nat. Geosci. 12 (11), 911–916. doi:10.1038/s41561-019-0460-1
Yang, G. Y., and Hoskins, B. J. (1996). Propagation of Rossby waves of nonzero frequency. J. Atmos. Sci. 53 (16), 2365–2378. doi:10.1175/1520-0469(1996)053<2365:PORWON>2.0.CO;2
Yeh, S. W., Cai, W., Min, S. K., McPhaden, M. J., Dommenget, D., Dewitte, B., et al. (2018). ENSO atmospheric teleconnections and their response to greenhouse gas forcing. Rev. Geophys. 56 (1), 185–206. doi:10.1002/2017RG000568
Yiu, Y. Y. S., and Maycock, A. C. (2019). On the seasonality of the El Niño teleconnection to the Amundsen Sea region. J. Clim. 32 (15), 4829–4845. doi:10.1175/JCLI-D-18-0813.1
Yiu, Y. Y. S., and Maycock, A. C. (2020). The linearity of the El Niño teleconnection to the Amundsen Sea region. Quart. J. R. Meteorol. Soc. 146 (728), 1169–1183. doi:10.1002/qj.3731
Keywords: ENSO teleconnection, the Amundsen Sea low (ASL), delayed impact of the ENSO, rossby wave propagation, kinetic energy conversion
Citation: Lee H-J and Jin EK (2023) Understanding the delayed Amundsen Sea low response to ENSO. Front. Earth Sci. 11:1136025. doi: 10.3389/feart.2023.1136025
Received: 02 January 2023; Accepted: 17 February 2023;
Published: 24 February 2023.
Edited by:
Jian Rao, Nanjing University of Information Science and Technology, ChinaReviewed by:
Yanjie Li, Institute of Atmospheric Physics (CAS), ChinaYa Wang, Institute of Atmospheric Physics (CAS), China
Copyright © 2023 Lee and Jin. This is an open-access article distributed under the terms of the Creative Commons Attribution License (CC BY). The use, distribution or reproduction in other forums is permitted, provided the original author(s) and the copyright owner(s) are credited and that the original publication in this journal is cited, in accordance with accepted academic practice. No use, distribution or reproduction is permitted which does not comply with these terms.
*Correspondence: Emilia Kyung Jin, amluQGtvcHJpLnJlLmty
 Hyun-Ju Lee
 Emilia Kyung Jin