- 1Geohazards Research Center, King Abdulaziz University, Jeddah, Saudi Arabia
- 2Department of Petroleum Geology and Sedimentology, Faculty of Earth Sciences, King Abdulaziz University, Jeddah, Saudi Arabia
- 3Department of Earth and Environmental Sciences, Bahria University, Islamabad, Pakistan
It is necessary to develop and explore geothermal resources to achieve sustainable development and clean renewable energy around the Globe. Geothermal energy is crucial to the future energy supply to meet the environmentally friendly energy demand of the World. The Rahat Volcanic Field (Kingdom of Saudi Arabia) is the oldest and lengthiest Cenozoic Volcanic Field in the World. It is a dominantly a mature mafic Volcanic Field that holds three major geological events; the historic eruption (1256 C.E.), the five fingers (∼4500–1500 BP), and the seismic swarm (1999 C.E.). These incidents were studied by utilizing geological information and geophysical data sets. Geophysical and geostatistical research includes gravity and magnetic survey data, including different log curves and major elements, obtained from water samples as well as of volcanic rocks obtained by X-ray fluorescence (XRF). To gain an understanding of the subsurface thermal structure, these datasets were analyzed. The primary goal of this study is to identify the prominent potential geothermal resources with the help of an available data set. Findings suggest that beneath the historic eruption site along with the fissure eruption, on the western side, there is a geothermal anomaly with a surface footprint of about 35 km2. Analyzing gravity and magnetic data as well as density and magnetic susceptibility variations in rock samples led to the mapping of this anomaly. It has been inferred through integrated study that statistical analysis of major elements will be helpful to validate the results of the outcome.
1 Introduction
Over the past few years, the interest in finding productive geothermal reservoirs has increased. Geothermal energy is a good alternative to replace the hydrocarbon (HC)-based economy (Aboud et al., 2021). Although, these geothermal reservoir fields can be used to generate energy, the technologies used to make them suitable are still being developed, and significant improvements are needed in the research area of Harrat Rahat Field (Harrat is the Arabic name of Lava Fields) (Asfahani, 2018). Drilling through the high-temperature zones is an essential step before establishing any geothermal plant (Ashraf et al., 2021). These zones gather geothermal energy, which is transported through the subsurface level to the ground to generate electricity (Chandreasekharam et al., 2014).
As a result, drilling in these reservoir zones encounters serious geotechnical problems, such as the loss of circulation (Chandreasekharam et al., 2014). It has been observed based on previous studies that loss of circulation is a frequent issue in geothermal drilling operations. Many geothermal wells go to be abandoned due to lost circulation issues and increased overall cost of the project. This issue may arise in the present of fractured or formations with high permeability values. Loss of circulation is also occurred due to fractured rocks or layers. Drilling at great depths or in low-pressure, depleted reservoirs increases the risk of lost circulation (Behnoud far and Hosseini, 2017; Kiran and Salehi, 2020; Saleh et al., 2020). Research indicates that greater than 10% of the typical drilling expenses are accumulated from the lost circulation difficulties (Kiran and Salehi, 2020). Snyder et al. (2019) recommended that around 90% of the circulation is lost in well drilling described for the non-beneficial period in the extended segment of geothermal drilling.
Geothermal resources are useful and contain broad reserves with advantages such as their widespread, vast reserves, eco-friendliness, reduced emissions of carbon, and extreme consumption factors (Zhou et al., 2015). Geothermal energy is categorized as a renewable energy resource because it constantly generates thermal heat within the Earth. A variety of uses can be obtained from this source, including heating systems, industrial production, and electricity generation (Radwan et al., 2021). Although hydrocarbon resources are the main source of electricity production in Saudi Arabia with a greater percentage of electric power produced being used for cooling purposes, the potential use of envisioned geothermal energy is for producing electric power (Al-Amri et al., 2019).
It has been observed based on the literature survey that very limited research has been performed to assess Saudi Arabia’s geothermal energy resources and the ongoing work mainly focused on the western part of the kingdom where hot springs and Volcanic fields are located (Abdelwahed et al., 2016). In this study, the suspected geothermal field is in the Rahat Volcanic Field (RVF), south of the city of Madinah is shown in Figure 1A. Moreover, the geothermal resources database established for Saudi Arabia demonstrates that the most likely geothermal region is found near the western parts of the Red Sea (Aboud et al., 2016). Based on the previous research, it was concluded that geothermal resources like Volcanic fields and hot springs were not encountered in any phenomena related to geothermal features (Rehman, 2005; Rehman and Shash, 2005). Previous studies of geothermal features (e.g., hot springs and volcanic fields) within Saudi Arabia concluded that volcanoes with high heat flow content eruption size present a consistent potential for geothermal power production (Hussein et al., 2013; Chandreasekharam et al., 2014; Lashin et al., 2014). Known geological formations in Saudi Arabia might accommodate geothermal systems of up to 150°C and 300°C (Downs et al., 2018).
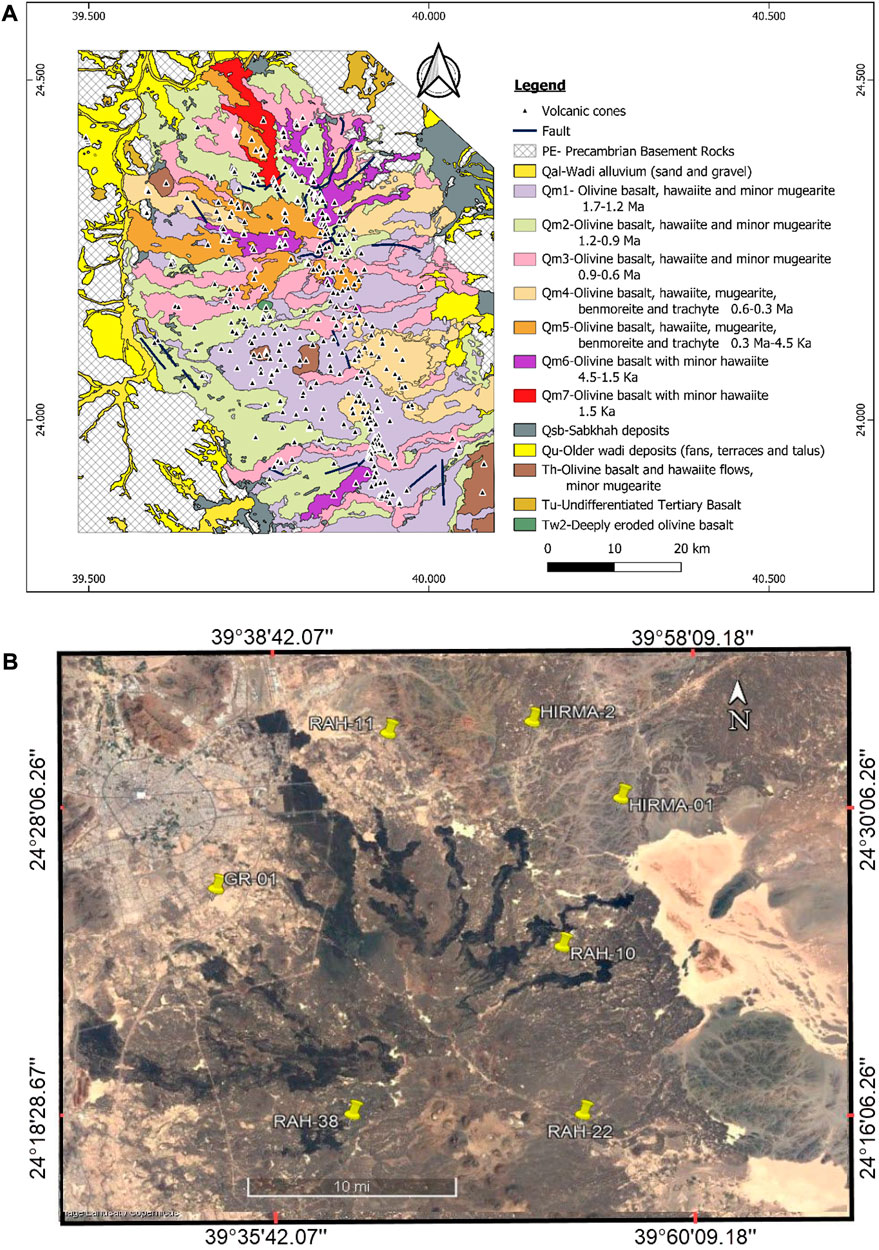
FIGURE 1. (A) Location and geologic map of the study area (Rahat Volcanic Field) (after Aboud et al., 2022; Downs et al., 2019). (B) Location map of the drilling wells within the study area based on Google Earth Satellite imagery.
In the classification of geological processes, the information about the temperature is considered one of the most important parameters (Norden and Forster, 2006). Earth temperature is an important factor in understanding geothermal systems. Heat production (HP), thermal conductivity (TC), thermal gradient (TG), and heat flow (HF) are all key parameters used to classify and evaluate geothermal resources. In cases where limited temperature data is available from wells, these parameters can be estimated using Earth temperature models and geophysical techniques (Förster, 2001; Ullah et al., 2022). Well-log data analysis can be used to determine the thermal conductivity (TC) of geological formations, which can vary laterally and vertically in sedimentary basins. Understanding the TC and its spatial variations can be helpful in studying geothermal resources and determining heat flow to quantify the subsurface temperature regime. TC can be determined using well logs data as a technique in the absence of measured TC values from core data (Fuchs and Förster, 2014).
Exploration geophysical techniques are mostly applied to identify the subsurface structure, as well as to detect and estimate the geothermal reservoirs at a depth of up to 200 m. Geophysical techniques play a critical role in geothermal energy exploration, helping to identify and characterize the geothermal reservoirs that are necessary for the development of geothermal energy resources (Ashraf et al., 2021). For example, magnetic and gravity techniques are used to map the variation of density and observed gravity at shallow and deep depths. Bouguer anomaly and magnetic susceptibility help to understand the geothermal reservoir and to identify the geothermal zones through the areas of interest marked on the map (Asfahani, 2018). This may reduce the number of wells planned to be drilled for classification and generate consistent interpretations (Ehsan et al., 2019; Ehsan and Gu, 2020).
The main objective of the current research is to estimate the potential of the geothermal resource in the Rahat Volcanic Field (RVF) by an integrated study that includes magnetic, gravity, major element analysis, and well logs data. The study aims to assess the geothermal potential of the Rahat Volcanic Field using gravity, well data, and magnetic techniques. These methods are important for geothermal exploration and can provide insights into the subsurface structure and potential energy resources. The finding of this study will be helpful for further exploration and development of renewable energy resources in the Kingdom of Saudi Arabia.
2 Materials and methods
2.1 Petrophysical analysis
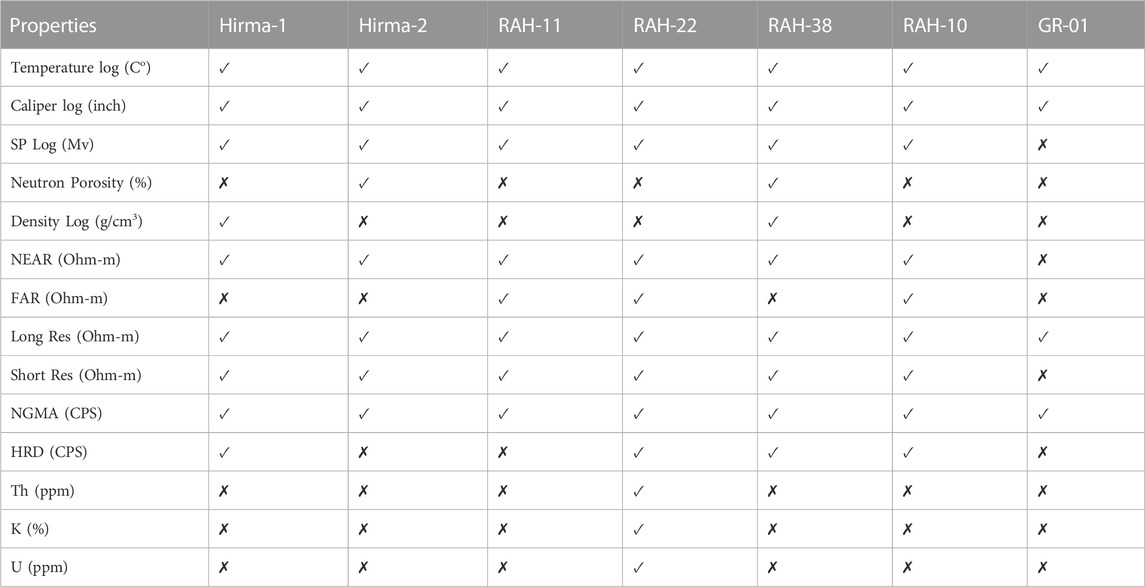
Petrophysics analysis is the study of the physical and chemical properties of rocks. In RVF, seven different well log data were available for geothermal analysis. The well GR-01, Hirma-1, Hirma-2, RAH-10, RAH-11, RAH-22, and RAH-38 were utilized for the given studies as shown in Figure 1B. The analysis was performed with help of a log curve on all seven wells. The well data of the Rahat Volcanic Field is shown in Table 1 and details of the log curve that is present in the well are shown in Table 2. The minimum variation of temperature is an encounter in all the wells because of their shallow depth. Table 3 demonstrate the statistical analysis of the well based on given log curve data.
The core samples were usually used for the calculation of heat production (HP) in the laboratory with the help of gamma ray spectrometry (He et al., 2008). Researchers used an NGR logging technique and airborne spectrometry GR method for the estimation of HP (Bücker and Rybach, 1996; Salem et al., 2005; Zhou et al., 2015). The calculation of HP at each depth is very helpful for GR (Asfahani and Abdul-Hadi, 2001). So, we used the natural gamma ray for the calculation of HP with the help of the following equation (Asfahani and Abdul-Hadi, 2001).
Where HP is heat production and its unit microwatt per cubic meter, and GR is gamma ray log whereas API stands for American Petroleum Institute.
Thermal energy flows from the earth’s interior to the surface. A well drilled in the subsurface shows a persistent rise in the temperature with depth due to geothermal gradient (GG) (Liu et al., 2016). The temperature rise usually represents in terms of a geothermal gradient and increases per kilometer of depth (Lashin et al., 2014). The subsurface temperature also increases eventually due to the presence of a radioactive element that increases the temperature without any influence of depth. The formula for calculating the geothermal gradient is as follows (Cooper and Cowan, 2006).
Whereas T˚ formation is a formation temperature and T˚surface is the temperature of a surface.
Thermal conductivity (TC) is typically estimated in the laboratory from core samples (drill cuttings) using various steady-state techniques (Si et al., 2014; Rezaei et al., 2015; Prol-Ledesma and Morán-Zenteno, 2019). Normally in worldwide, core data may not always be readily available in the targeted zone. In such cases, well logs can be used to estimate TC and obtain the well profile. To address this issue, a study by Radwan (2021) used petrophysical parameters derived from well log data to assess TC. This study used well log-derived petrophysical parameters to assess TC.
2.2 Hydrochemical characteristics of the geothermal fluids
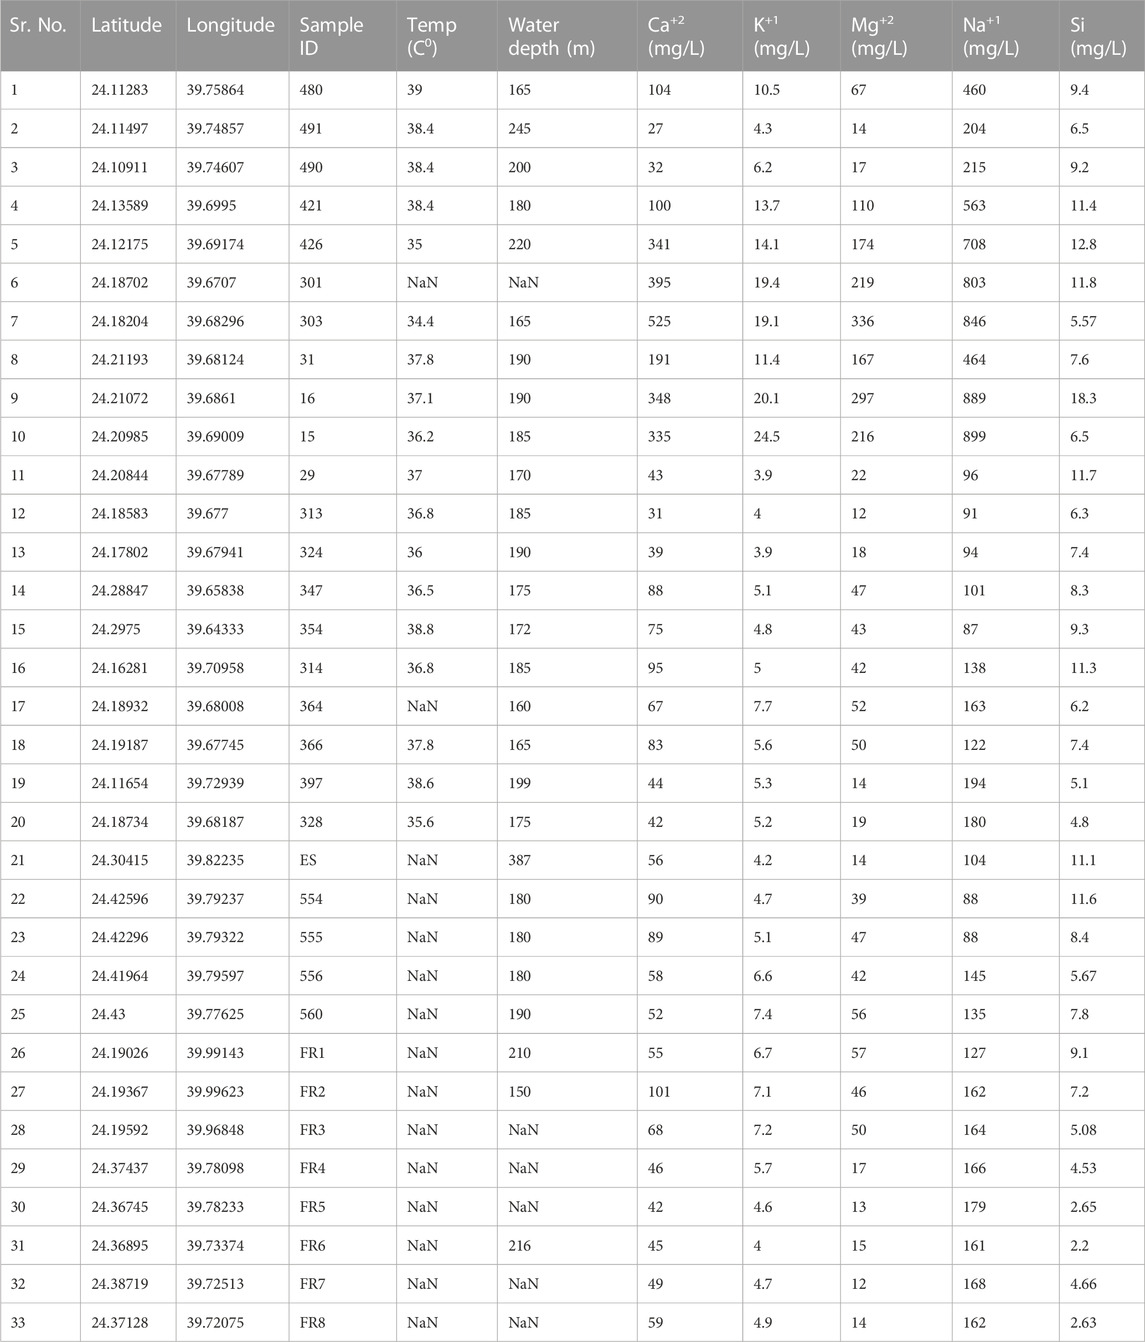
The study involved the collection of 33 water samples on 09 March 2022 from wells located in the Rahat Volcanic Field. These samples were gathered systematically and analyzed for their major elements. Table 4 presents the Sr. No., Latitude, Longitude, Sample ID, Temperature, Water Depth, and major elements (Ca+2, K+1, Mg+2, Na+1, Si) data for each water sample. By analyzing the chemical composition of geothermal fluids and monitoring changes in their properties over time, scientists and engineers can develop strategies for the sustainable use of geothermal resources and mitigate potential environmental impacts. The samples were analyzed at the Center of Excellence in Environmental Studies, King Abdulaziz University, Kingdom of Saudi Arabia, using inductively coupled plasma atomic emission spectroscopy (ICP-AES).
2.3 Major elements analysis of rock samples
The major elements data set consists of 691 rock samples and was obtained from the USGS. The major elements in each sample were analyzed at the GeoAnalytical Laboratory in Pullman, Washington, US through X-ray fluorescence (XRF) analysis (Downs, 2019; https://www.sciencebase.gov/catalog/item/5c01bcc7e4b0815414cc723a). Analysis of geothermal sources in water from several chemicals such as various oxides and elements as iron and calcium released from several anthropogenic sources is becoming a worldwide concern (Rapant et al., 2017). Analysis of geothermal resources with the help of a water sample gives a clue about geothermal reservoirs in the subsurface (Dai and Chen, 2008). The chemical contents of water including calcium, sodium, potassium, magnesium, and silicates, are measured based on an available data set.
2.4 Gravity and magnetic data
The United States Geological Survey (USGS) acquired the geological and geophysical data in the Northern Rahat Volcanic Field within the framework of their 1 to 75,000 scale geological mapping. The area that is covered in the data set is approximately 3600 km2. Gravity data was acquired using 300 gravity stations with the help of a gravimeter and differential GPS (Langenheim, 2018; https://www.sciencebase.gov/catalog/item/5b0d8c1ce4b0c39c934b04c1). The gravity survey was carried out with the help of fixed wing light and the data is recorded in the east-to-west direction, which covers both sides of the Precambrian basement outcrop. The distance between the base camp and to stations was approximately 1–1.5 km. Different types of data correction such as latitude, free air, Bouguer, and terrain correction are applied to the provided gravity data (Langenheim et al., 2019).
Moreover, magnetic surveys were acquired (1962–1983) by Arabian Geophysical and Surveying (ARGAS) company supervised by USGS (Langenheim, 2018). The data sets were accessible for the total field in the public domain. These acquired data were utilized to analyze and interpret the subsurface density and susceptibility maps. The reduction and corrections are applied to the gravity data for interpretation purposes (Aboud et al., 2015; 2018). It should be noted that changes in the density or susceptibility of rocks are related to heat or thermal change (Salem et al., 2005). At a temperature of 570°C (Curie temperature), certain magnetic materials undergo a sharp change in their magnetic properties, and above this temperature certain materials lose their permanent magnetic properties (Aboud et al., 2016).
3 Results and discussions
3.1 Petrophysical interpretation
Petrophysical and statistical analysis techniques were normally used to evaluate the geothermal reservoirs. For example, the temperature of the Earth is a valuable variable in the examination and characteristics of numerous essential geothermic estimations such as HP, TC, GG, and HF, when the observed well temperature data is not reliable (Gegenhuber, 2011). The statistical analysis of each well was performed with the help of Python language.
Natural Gamma Ray (NGR) log is extremely useful for understanding the lithology and facies, which are compulsory factors that help in the recognition of fundamental parameters of geothermal resources (Ashraf et al., 2021; Aboud et al., 2022). NGR log has been utilized to calculate the HP and was significantly employed in recognizing the thickness of the geological units (Asfahani and Abdul-Hadi, 2001; Asfahani, 2018). Thermal conductivity and geothermal gradients are important factors that can be applied to contact the flowing of a fluid region in the wells data (Haffen et al., 2013). The evaluation of tectonics can be decided by using the difference in HF, which can give the impression of frictional heating (Zheng et al., 2016). The Not a Number (NaN) is used where the data has not been recorded. Table 3 demonstrates the detailed statistical analysis of the log curve in which the name of the log curve is shown in column 1, the total number of values is counted in column 2, and the mean, standard deviation, and minimum value of all log curve are created in column 3,4 and 5 respectively. The maximum value is shown in column 9.
Temperature contrast can be produced by several factors such as time reaction, position, depth, and geology, as shown by the temperature logging curves, which exhibit an increasing alignment with the logging rates in depth. Due to differences in speed, temperature inclination, and duration, it is also possible to measure the temperature curve among many logs using the probe (Garcia-Gutierrez et al., 2002; Rezaei et al., 2015). Based on the well data available, the evaluation of the result is carried out on all the wells. The best result shows that the average temperature for well RAH-10 is 32.88°C. There is no temperature variation shown in the well. The estimated temperature does not represent the accurate temperature of the formation because of the substantial turbulences in the drillings. A low Gamma Ray (GR) log value, which typically ranges from 0 to 50 counts per second (CPS), indicates that there is less radioactive material present in the formation being measured. Gamma ray readings can vary depending on the lithology or rock type. Clay typically contains a high amount of clay minerals like illite, kaolinite, and smectite, which show a low gamma ray response. Basalt, on the other hand, is a volcanic rock composed of minerals such as plagioclase, pyroxene, and olivine, which have a high gamma ray response. Therefore, the gamma ray log values in basalt are generally higher than in clay. The gamma ray value is low in clay and higher in basalt (Rider, 1986). HP is calculated with the help of the GR log. HP logs the fluctuation in the overall log profile which demonstrates that there is a chance of a geothermal reservoir present in the subsurface. The geothermal gradient and heat flow show no variation all over the log, a constant value is observed in the log profile as shown in Figure 2. The result of GG and HF show no presence of geothermal resources in the subsurface. In the lithology section of the log curve, three lithologies are identified based on the behavior of the log curve: Clay, Basalt, and Weathered Basalt. We chose to display the results of RAH-10 (Figure 2) because this well is characterized by continuous recording and no missing data is observed during the measurement. Several parameters can indicate the potential for a geothermal reservoir, including high porosity values, variations in gamma ray values, high thermal conductivity values, and specific rock types such as granite or basalt. For example, studies have shown that high porosity values were a key factor in the development of the Longwangmiao geothermal reservoir in China, while variations in GR values were useful in identifying different lithologies in the Menengai geothermal field in Kenya. Additionally, high thermal conductivity values may suggest the presence of fluids transporting heat (Xiao et al., 2020; Nyakundi et al., 2021).
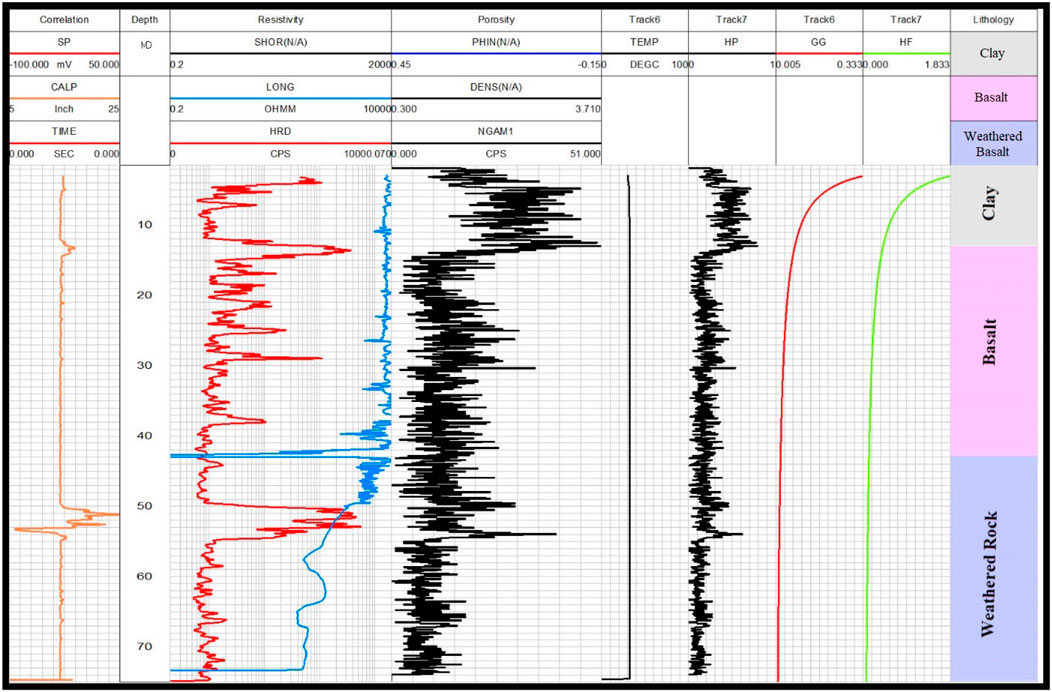
FIGURE 2. Detailed view of well log profile of RAH-10 well. Track 1 (correlation) shows the caliper log. Track 2 (resistivity) demonstrates the variation of the resistivity log. Track 3 showed the natural gamma ray log and density log the value of the density log is merged with the natural gamma ray log.
Based on the well log data of RAH-10, the depth interval between 12 m and 45 m shows potential for geothermal resources. The gamma ray and porosity logs for this particular interval indicate higher values. If the geothermal resources in this area have high heat productivity, it implies that they have the potential to produce significant amounts of thermal energy over an extended period.
Generally, geothermal gradient depends on a geological formation’s thermal conductivity (the productivity with which that formation transfer heat or in the case of the earth, permits loss of heat). Table 5 represents some ranges of thermal conductivity for typical lithology (Garcia-Gutierrez et al., 2002). The wells data interpretation of RVF indicates the lithology is mainly composed of clay, basalt, weathered basalt, and silty sand. As is well known, the thermal conductivity of basalt is high, and this strengthens the possibility that we considered it as one of the main geothermal energy resources in the study area.

TABLE 5. Ranges of thermal conductivity values for some typical lithology (Garcia-Gutierrez et al., 2002).
3.2 Hydrochemical characteristics of the geothermal fluids
The lowest and highest values for the most important ion (Ca2+, Na+, Mg2+, K+, Cl−, Si) statistical analysis results are given in Table 6. Na+ and Ca2+ cations dominate in geothermal fluids. The Na+ concentration of the geothermal fluids ranged from 87 to 889 mg/L and the highest Na+ concentration detected in the water is approximately 889 mg/L in water samples ES and 15. The highest Ca2+ concentration (525 mg/L) is observed from wells in the Harrat Rahat Field. Mg2+ with also high concentrations compared with other cations varied from 12 to 336 mg/L. The lowest concentration K+ value lies between (3.9–24.5 mg/L) which was observed in the water sample. The Si- concentrations of the water sample were found to range from 2.2 to 18.3 mg/L which is relatively low compared with other elements.
3.3 Major elements analysis of rock sample
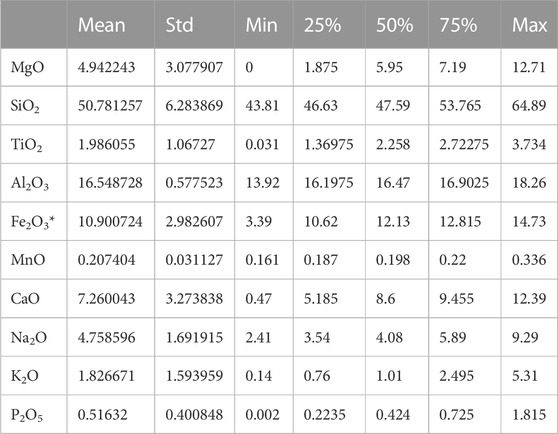
The major element (their oxides) being analyzed with XRF equipment has an average SiO2 content of 50.7812 wt.%. The data shows a trend of increasing cumulative Na2O + K2O with increasing SiO2 on the total alkali vs. silica (TAS) diagram, as seen in Figure 3A. The SiO2 vs. K2O diagram (Figure 3B) with fields of Na2O+ K2O, sub-alkalic, and low potassium sub-alkalic rocks (Middlemost, 1975) shows the Harrat Al-Madinah rock covering a broad variety of SiO2 and K2O and are unique in being alkali to sub-alkali basalts (Moufti et al., 2012). The rocks have an average value of MgO (4.94%), CaO (7.29 wt.%), and mean Fe2O3(10.90 wt.%). The Al2O3 contents mean is (16.54 wt.%) showing restricted variation, while TiO2 average value is 1.98 wt.%, with the highest values being in the basaltic trachyandesite, Trachyandesite Trachydacite. Trachydacite has the highest contents of Na2O, their average value is (4.75 wt.%) and K2O (1.82 wt.%). As a correlation among oxide elements using various Harker-diagrams and TAS diagrams, the variation of major elements (Figure 3C) shows good negative correlation (i.e., Total alkali silica (TAS) diagram), weak negative correlation (i.e., Al2O3), or positive correlation (i.e., CaO). Table 7 shows the details of statistical analysis of mineral oxides present in the study area.
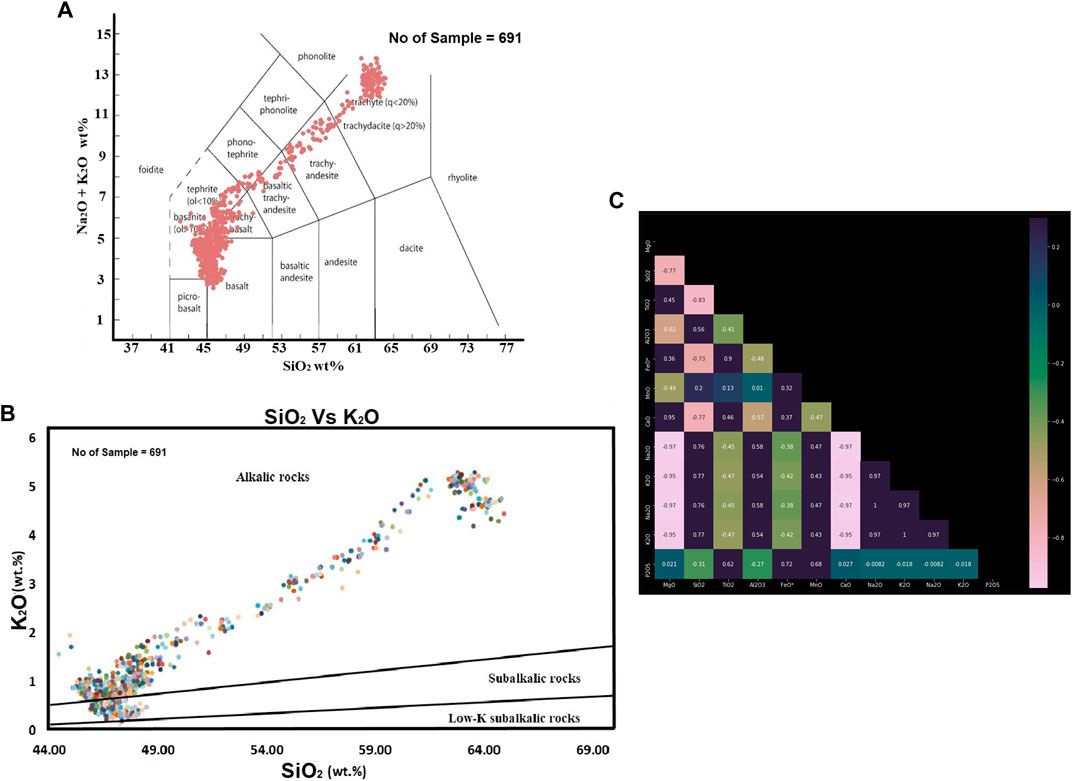
FIGURE 3. (A) Total-alkali silica (TAS) diagram showing the classification of Northern Harrat Rahat region lava based on approximately 691 data samples are used for this study. Source of data: (Downs, 2019). (B) Silicon Oxide vs. Potassium Oxide diagrams (Middlemost, 1975) showing the geochemical classification of the Northern Harrat Rahat region basalts as alkalic and alkalic–sub-alkalic basalts. Source of data: (Downs, 2019). (C) Heat map of the major oxide elements shows the correlation among different major oxides. Source of data: (Downs, 2019).
Heat maps are a useful tool for visualizing the distribution of a particular variable or the correlation between multiple variables. In the context of geothermal studies, a heat map could be used to display the major oxide elements present in a given area, revealing correlations among these elements and showing which combinations are typically found together or apart. This information is important for understanding the origin and evolution of rocks and minerals in the area, as well as the properties of the geothermal system itself. By highlighting patterns and relationships in the data, heat maps can reveal insights that may not be immediately apparent when looking at the raw data alone. In a heat map, darker colors indicate a higher frequency or intensity of the variable being measured, while lighter colors indicate a lower frequency. In geothermal studies, it is common to find rocks and minerals in the Earth’s crust that contain different major oxide elements.
Based on XRF studies of rock in the Rahat Volcanic Field, the trend of increasing Fe2O3 (average value=10.90) and TiO2 (average value=1.98) with decreasing MgO (average value=4.94) argues against significant fractionation of Fe–Ti oxides in the early stages of Silicic volcanic rock. P2O5 (average value = 0.51) also shows a good negative correlation with MgO in the silicic volcanic, consistent with apatite fractionation, which is further supported by the appearance of apatite in the silicic lavas. Moufti and Németh (2016) studies also indicates the presence of silicic volcanic.
3.4 Hydrochemical characteristics of rock samples
In the earth’s crust, the 6th abundant element is sodium and found in several minerals like rock salt (NaCl), sodalite, and feldspars. Most of the salts of Na are highly soluble in water in Harrat Volcanic Field. The concentration of sodium that exists in the water sample is in the range of 87–889 mg/L. According to the World Health Organization (WHO), 500 mg/L is considered good for human health as well as the environment (Bermudez et al., 2011). Based on the allowable limit of WHO the samples F4, F5, F6, F7, ES, and 15 exceeds the limit, which is the indication of a geothermal reservoir on the location at which the samples were taken shown in Figure 4A. Chloride is mostly found as a component of salt (Sodium Chloride) and in a few cases, it is present in combination with calcium (Ca+) and potassium (K+). The concentration of Calcium and Potassium is in the range (27–525 mg/L) and (3.9–24.5 mg/L), respectively, whereas the WHO limit is 250 mg/L, the samples F5, F6, F7, ES, and 15 exceed the limit as shown in Figure 4B. Magnesium concentration also exceeds in samples F4, F5, F6, F7, F8, ES, and 15 as shown in Figure 4C.
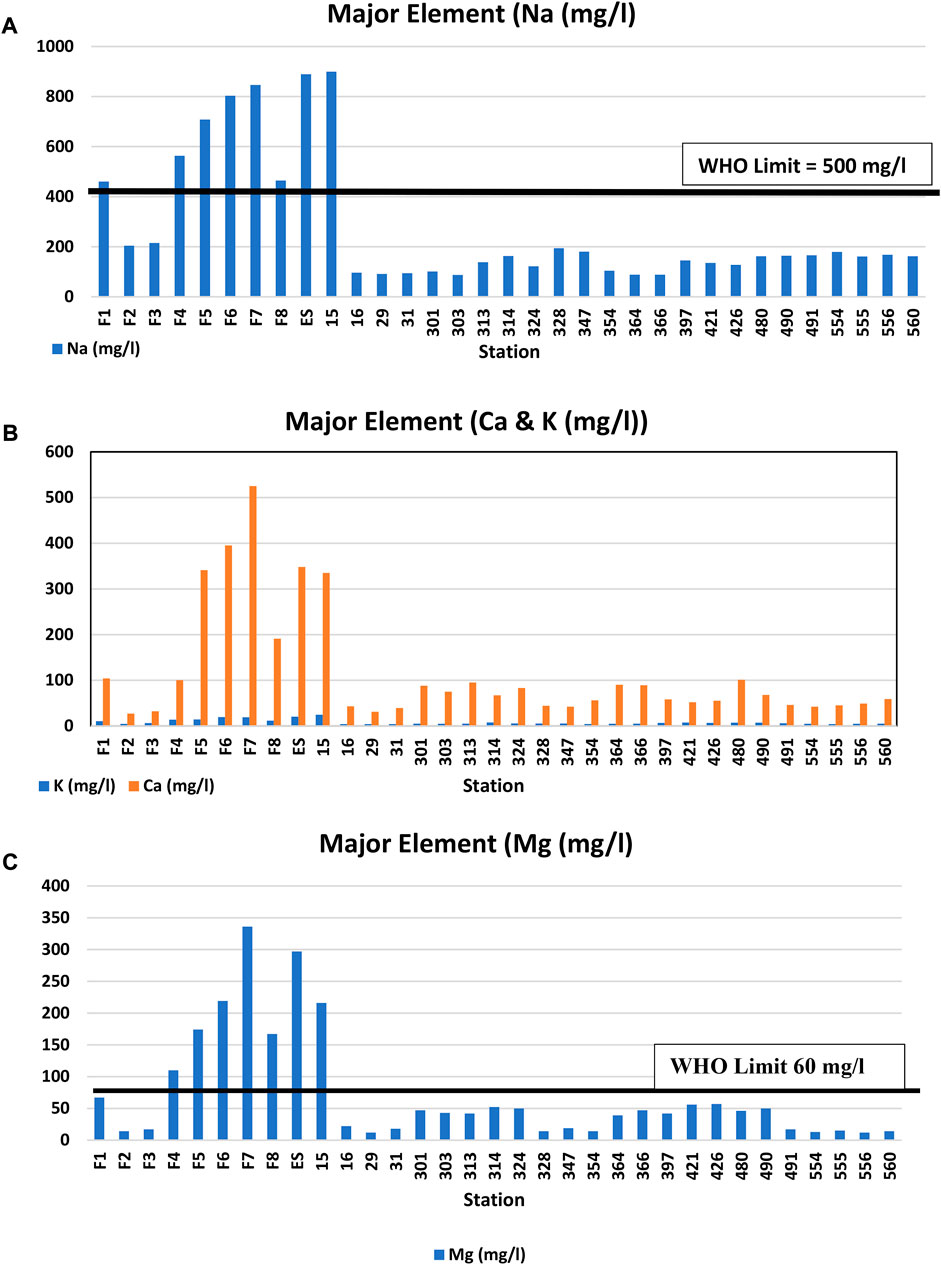
FIGURE 4. (A) Sodium concentration in a water sample with their WHO limit 500 mg/L. (B) Calcium and potassium concentrations in water sample of Rahat Volcanic Field. (C) Magnesium concentrations in water sample of Rahat Volcanic Field.
3.5 Gravity and magnetic study
The gravity studies in the Rahat region reveal shallow subsurface density variations that are linked to the volcano’s structural and magmatic history. The density variations are more significant near the surface compared to deeper depths. A connection exists between high and low gravity values in the volcanic anomaly, as demonstrated in Figure 5A, which shows the elevation map of the Harrat Volcanic Field between depths of 600–1100 m. The graph in Figure 5B was created using acquired gravity data obtained from USGS and shows observed gravity variations. As seen in the graph, the gravity values vary from station to station, indicating localized variations in density or mass distribution within the volcanic anomaly. The observed variation in gravity, as depicted in the Bouguer anomaly profile of the available station, is an inverted image of the elevation graph shown in Figure 5C. This means that regions with higher elevation and lower mass density can have negative Bouguer anomalies, while regions with lower elevation and higher mass density can have positive Bouguer anomalies. The reason for using these parameters profile is to understand the subsurface structure and variation along the acquired survey profile.
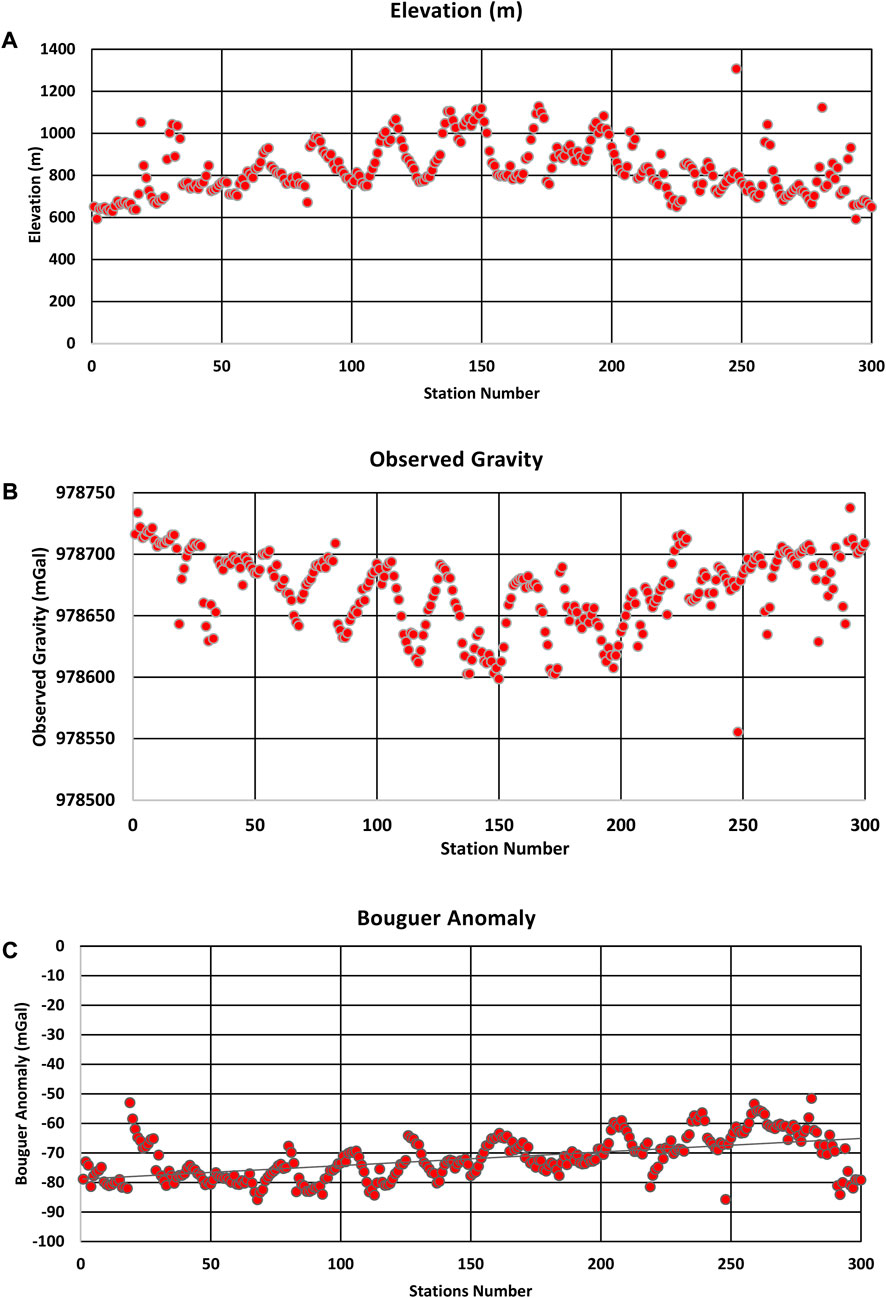
FIGURE 5. (A) Graph showing the general trend of elevation in the Rahat Volcanic Field. The elevation lies between the depth of 600–1100 m. (B) Graph demonstrates the overall variation of observed gravity in the Rahat Volcanic Field. The unit of observed gravity is usually in mGal. The result of observed gravity and Bouguer anomaly shown in Figure 5C demonstrates the inverse trend. (C) Graph represents the overall variation of Bouguer anomaly in the Rahat Volcanic Field. The Bouguer anomaly shows the trend that is present in the subsurface. The values of Bouguer anomalies are in the range of −85 to −50 mGal.
Understanding the subsurface structural system and how it relates to geothermal resources was accomplished using gravity data. The overall area is characterized by a basin-like structural system (Aboud et al., 2015). Three different types of maps based on gravity data are prepared to understand its behavior on Rahat volcanic field; elevation, observed gravity and Bouguer anomaly map have been generated. There is a correlation between elevation and gravity, whereby an increase in elevation leads to an increase in the distance between an object (such as geothermal bodies) and the Earth’s center. As a result, the force of gravity decreases slightly with higher elevation, causing the acceleration due to gravity to be slightly less than 9.81 m/s2 (Meiburg et al., 2015). Overall, the gravity values are reduced due to an increase in elevation as shown in Figure 6A. Figure 6B shows the observed gravity map of the Rahat Volcanic Field. It displays the low gravity anomalies beneath the historical sites (1256 AD) and the fissure eruptions (641 AD) (Langenheim et al., 2019). The low gravity anomalies are bounded by large gravity anomalies involving thermal variation.
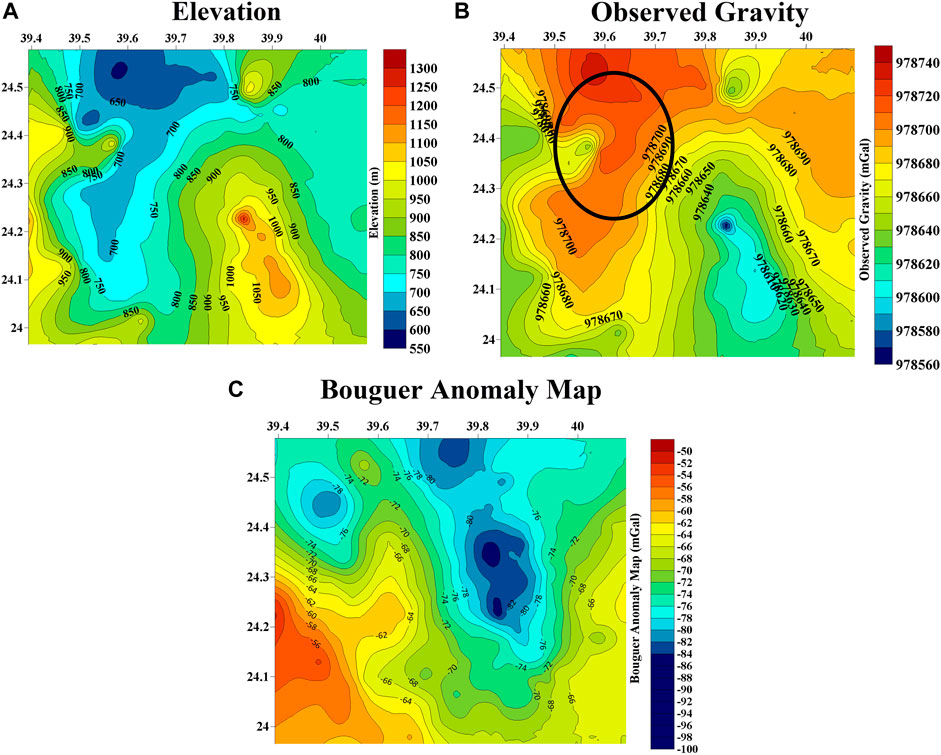
FIGURE 6. (A) shows an elevation contour map created using gravity data. The map reveals a variation in elevation from north to south, with higher elevations observed on the southern side. The map was created using elevation and coordinate data. The low elevation is observed on the northern side of the map. The average elevation obtained by the gravity data lies between 550 and 1100 m in depth. (B) Observed gravity map of the Rahat Volcanic Field shows the variation in gravity. The variation in gravity is increased from south to north. The zone of interest shown in ellipsoid black color usually demonstrates a higher value. (C) Bouguer anomaly map of Rahat Volcanic Field.
The gravity anomaly area refers to the area where the density of crustal material changes sharply along the horizontal direction, and this indicates the existence of a graben system (Langenheim et al., 2019). It is caused by an uneven distribution of underground rock mass and mineral density, or by the density difference between geological bodies surrounding rocks. The Bouguer gravity anomaly can identify or determine large fault structures arising from local or global tectonic activity, which accordingly indicates the occurrence a potential geothermal zone. The Bouguer gravity map is shown in Figure 6C.
The variation of magnetic anomalies that usually observed in the magnetic plots does not occur unsystematically; it mainly reflects a certain structural geological system. High magnetic values are often associated with rocks that have a high magnetic mineral content, such as basalts. However, the strength of the magnetic signal can vary widely and may be negligible or very weak. In a geothermal environment, there is generally an inverse relationship between magnetic susceptibility and high temperatures (Aboud et al., 2022). Figure 7A is displaying the generalized trend of susceptibility at each sample point. Figure 7B is displaying bulk density variation in the overall field.
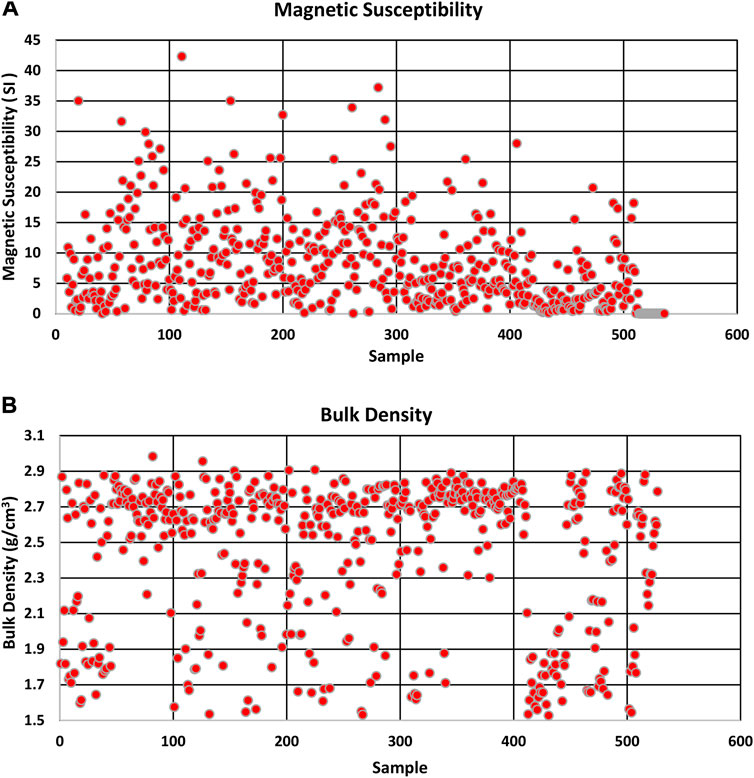
FIGURE 7. (A) Magnetic susceptibility variations are shown in samples as the range of magnetic susceptibility is from 0 to 45 SI. (B) Bulk density variation is the overall field the density range lies between 1.5 and 3.0 g/cm3. The highest density variation is shown in the range of 2.5–2.9 g/cm3, the sample from 0 to 400 mostly shows the higher values which are a clear indicator that in the subsurface some geothermal anomaly is present.
Magnetic susceptibility and density of rocks play an influential role in determining physical properties of rocks samples (Bérubé et al., 2018). An increase in density can lead to a decrease in thermal conductivity due to the inverse relationship between the two properties.
While magnetic anomalies are often used to infer the age and orientation of the Earth’s magnetic field, they are not a direct cause of geothermal or tectonic stress variations. These stresses are primarily driven by processes such as mantle convection, plate tectonics, and the Earth’s internal heat budget. However, the distribution of magnetic anomalies can provide insights into the history of these processes and the evolution of the Earth’s crust and mantle. A magnetic anomaly map can be used to create a model without requiring complicated modifications. In specific conditions, small magnetic anomalies are strictly correlated with each other. Active groundwater temperatures can weaken the magnetic properties of rocks through thermal alteration. Tectonic activity can also diminish the magnetic characteristics of rocks along the stress path and in the tectonic fracture zone, leading to weakened aero-magnetic properties. Figure 8A shows the overall variation of magnetic susceptibility, with the highest values observed on the northwest side. Figure 8B is a density map of the Rahat Volcanic Field, showing higher density values ranging from 1.5 to 2.9 g/cm3.
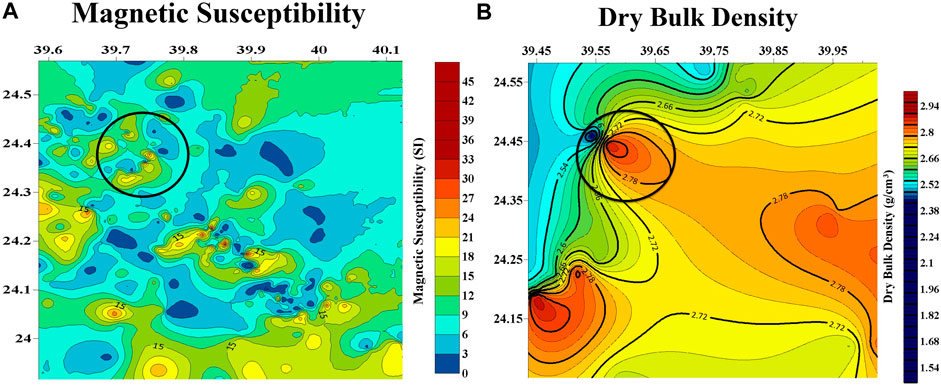
FIGURE 8. (A) Magnetic susceptibility map of Rahat Volcanic Field. (B) The change in density causes a direct impact on thermal conductivity. An increase in density can cause an increase in thermal conductivity to have a direct relation between them. The black circle represents the area of interest.
4 Conclusion
It has been concluded that no geothermal body is present in the subsurface surrounding all studied wells based on the analysis of the petrophysical data and the temperature log. The range of temperature in all well is between approximately 30o to 49°C. The calculated parameter like heat productivity is estimated based on a natural gamma ray log which also supports the conclusion of no geothermal body is present in the surrounding. The geothermal reservoir is also estimated with the help of radioactive rock and minerals. Major element analysis (XRF analysis) proves that the rocks present in the subsurface are mainly basalt. Previous studies based on geological information of the study area indicates that the flow of magma in past historical eruption provide a clue for the presence of geothermal resources. Major elements of water samples that are obtained from different regions of the Rahat Volcanic Field demonstrate that some samples show very high value exceeds the limits of WHO in hydrochemical analysis which is an indication of geothermal resources in the subsurface. Samples F5, F6, F7, ES, and 15 indicate the presence of a geothermal reservoir in the subsurface. The magnetic and gravity data variations in density and susceptibility maps can be examined (highest density and susceptibility zones) which represent the geothermal anomalies. Three different types of anomalies are situated beneath the historical eruption, fissure eruption, and north of the swarm area. Such superior density is suggested for high possible geothermal resources.
Data availability statement
Publicly available datasets were analyzed in this study. This data can be found here: https://www.sciencebase.gov/catalog/item/5b0d8c1ce4b0c39c934b04c1 and https://www.sciencebase.gov/catalog/item/5c01bcc7e4b0815414cc723a.
Author contributions
All authors listed have made a substantial, direct, and intellectual contribution to the work and approved it for publication.
Funding
This research work was funded by the Institutional Fund Projects under grant no IFPNC-001-145-2020.
Acknowledgments
The authors gratefully acknowledge the technical and financial support from the Ministry of Education and King Abdulaziz University, Jeddah, Saudi Arabia. We also say thanks to the academic staff of the Geohazards Research Center at King Abdulaziz University, Saudi Arabia for their help and support. We also thank Dr. Munir EL-Mahdy from Khalda Petroleum Company, Egypt for his support in this work.
Conflict of interest
The authors declare that the research was conducted in the absence of any commercial or financial relationships that could be construed as a potential conflict of interest.
Publisher’s note
All claims expressed in this article are solely those of the authors and do not necessarily represent those of their affiliated organizations, or those of the publisher, the editors and the reviewers. Any product that may be evaluated in this article, or claim that may be made by its manufacturer, is not guaranteed or endorsed by the publisher.
References
Abdelwahed, M. F., El-Masry, N., Moufti, M. R., Kenedi, C. L., Zhao, D., Zahran, H., et al. (2016). Imaging of magma intrusions beneath Harrat Al-madinah in Saudi Arabia. J. Asian Earth Sci. 120, 17–28. doi:10.1016/j.jseaes.2016.01.023
Aboud, E., Alotaibi, A. M., and Saud, R. (2016). Relationship between curie isotherm surface and moho discontinuity in the arabian shield, Saudi Arabia. J. Asian Earth Sci. 128, 42–53. doi:10.1016/j.jseaes.2016.07.025
Aboud, E., Alqahtani, F., Elmasry, N., Abdulfarraj, M., and Osman, H. (2022). Geothermal anomaly detection using potential field geophysical data in Raahat volcanic field, Madinah, Saudi Arabia. J. Geol. Geophys. 11 (4), 1026. doi:10.35248/2381-8719.22.11.1026
Aboud, E., El-Masry, N., Qaddah, A., Alqahtani, F., and Moufti, M. R. H. (2015). Magnetic and gravity data analysis of Rahat volcanic field, El-Madinah city, Saudi Arabia. NRIAG J. Astronomy Geophys. 4, 154–162. doi:10.1016/j.nrjag.2015.06.006
Aboud, E., Qaddah, A., Harbi, H., and Alqahtani, F. (2021). Geothermal resources database in Saudi Arabia (GRDiSA): GIS model and geothermal favorability map. Arabian J. Geosciences 14, 112–210. doi:10.1007/s12517-020-06426-z
Aboud, E., Wameyo, P., Alqahtani, F., and Moufti, M. R. (2018). Imaging subsurface northern Rahat volcanic field, madinah city, Saudi Arabia, using magnetotelluric study. J. Appl. Geophys. 159, 564–572. doi:10.1016/j.jappgeo.2018.10.005
Al-Amri, A., Mellors, R., Harris, D., Camp, V., and Abdelrahman, K. (2019). “Geothermal and volcanic evaluation of Harrat Rahat, northwestern arabian peninsula (Saudi Arabia),” in Petrogenesis and exploration of the earth’s interior. CAJG 2018. Advances in science, technology & innovation. Editors D. Doronzo, E. Schingaro, J. Armstrong-Altrin, and B. Zoheir (Cham: Springer), 25–27. doi:10.1007/978-3-030-01575-6_6
Asfahani, J., and Abdul-Hadi, A. (2001). Geophysical natural γ-ray well logging and spectrometric signatures of south AL-Abter phosphatic deposits in Syria. Appl. Radiat. Isotopes 54, 543–557. doi:10.1016/s0969-8043(00)00290-6
Asfahani, J. (2018). Multifractal approach for delineating uranium anomalies related to phosphatic deposits in Area-3, Northern Palmyrides, Syria. Appl. Radiat. Isotopes 137, 225–235. doi:10.1016/j.apradiso.2018.03.012
Ashraf, U., Zhang, H., Anees, A., Mangi, H. N., Ali, M., Zhang, X., et al. (2021). A core logging, machine learning and geostatistical modeling interactive approach for subsurface imaging of lenticular geobodies in a clastic depositional system, SE Pakistan. Nat. Resour. Res. 30, 2807–2830. doi:10.1007/s11053-021-09849-x
Behnoud far, P., and Hosseini, P. (2017). Estimation of lost circulation amount occurs during under balanced drilling using drilling data and neural network. Egypt. J. Petroleum 26 (3), 627–634. doi:10.1016/j.ejpe.2016.09.004
Bermudez, G. M. A., Jasan, R., Plá, R., and Pignata, M. L. (2011). Heavy metal and trace element concentrations in wheat grains: Assessment of potential non-carcinogenic health hazard through their consumption. J. Hazard. Mater. 193, 264–271. doi:10.1016/j.jhazmat.2011.07.058
Bérubé, C. L., Olivo, G. R., Chouteau, M., Perrouty, S., Shamsipour, P., Enkin, R. J., et al. (2018). Predicting rock type and detecting hydrothermal alteration using machine learning and petrophysical properties of the Canadian Malartic ore and host rocks, Pontiac Subprovince, Québec, Canada. Ore Geol. Rev. 96, 130–145. doi:10.1016/j.oregeorev.2018.04.011
Bücker, C., and Rybach, L. (1996). A simple method to determine heat production from gamma-ray logs. Mar. Petroleum Geol. 13, 373–375. doi:10.1016/0264-8172(95)00089-5
Chandreasekharam, D., Lashin, A., Al Arifi, N., and Singh, H. K. (2014). Meeting future energy demand of Saudi Arabia through high heat generating granites. Intern. J. Earth Sci. Engg 7, 1–4.
Cooper, G. R. J., and Cowan, D. R. (2006). Enhancing potential field data using filters based on the local phase. Comput. Geosciences 32, 1585–1591. doi:10.1016/j.cageo.2006.02.016
Dai, C., and Chen, Y. (2008). Classification of shallow and deep geothermal energy. GRC Trans. 32, 317–320.
Downs, D. T. (2019). Major- and trace-element chemical analyses of rocks from the northern Harrat Rahat volcanic field and surrounding area, kingdom of Saudi Arabia. U.S. Geological Survey. doi:10.5066/P91HL91C
Downs, D. T., Robinson, J. E., Stelten, M. E., Champion, D. E., Dietterich, H. R., Sisson, T. W., et al. (2019). Geologic map of the northern Harrat Rahat volcanic field, kingdom of Saudi Arabia: U.S. Geological survey scientific investigations map 3428 [also released as Saudi geological survey special report SGS–SP–2019–2]. Reston, VA: U.S. Geological Survey, 65. 4 sheets, scales 1:75,000, 1:25,000. doi:10.3133/sim3428
Downs, D. T., Stelten, M. E., Champion, D. E., Dietterich, H. R., Nawab, Z., Zahran, H., et al. (2018). Volcanic history of the northernmost part of the Harrat Rahat volcanic field, Saudi Arabia. Geosphere 14, 1253–1282. doi:10.1130/ges01625.1
Ehsan, M., Gu, H., Ahmad, Z., Akhtar, M. M., and Abbasi, S. S. (2019). A modified approach for volumetric evaluation of shaly sand formations from conventional well logs: A case study from the talhar shale, Pakistan. Arabian J. Sci. Eng. 44, 417–428. doi:10.1007/s13369-018-3476-8
Ehsan, M., and Gu, H. (2020). An integrated approach for the identification of lithofacies and clay mineralogy through Neuro-Fuzzy, cross plot, and statistical analyses, from well log data. J. Earth Syst. Sci. 129 (1), 101–113. doi:10.1007/s12040-020-1365-5
Förster, A. (2001). Analysis of borehole temperature data in the northeast German basin: Continuous logs versus bottom-hole temperatures. Pet. Geosci. 7, 241–254. doi:10.1144/petgeo.7.3.241
Fuchs, S., and Förster, A. (2014). Well-log based prediction of thermal conductivity of sedimentary successions: A case study from the north German basin. Geophys. J. Int. 196 (1), 291–311. doi:10.1093/gji/ggt382
Garcia-Gutierrez, A., Espinosa-Paredes, G., and Hernandez-Ramirez, I. a. (2002). Study on the flow production characteristics of deep geothermal wells. Geothermics 31, 141–167. doi:10.1016/s0375-6505(01)00032-3
Gegenhuber, N. (2011). An improved method to determine heat production from gamma-ray logs. European Association of Geoscientists & Engineers, 238. doi:10.3997/2214-4609.20149611
Haffen, S., Géraud, Y., Diraison, M., and Dezayes, C. (2013). Determination of fluid-flow zones in a geothermal sandstone reservoir using thermal conductivity and temperature logs. Geothermics 46, 32–41. doi:10.1016/j.geothermics.2012.11.001
He, L., Hu, S., Huang, S., Yang, W., Wang, J., Yuan, Y., et al. (2008). Heat flow study at the Chinese Continental Scientific Drilling site: Borehole temperature, thermal conductivity, and radiogenic heat production. J. Geophys. Res. Solid Earth 113, B02404. doi:10.1029/2007jb004958
Hussein, M. T., Lashin, A., Al Bassam, A., Al Arifi, N., and Al Zahrani, I. (2013). Geothermal power potential at the Western coastal part of Saudi Arabia. Renew. Sustain. Energy Rev. 26, 668–684. doi:10.1016/j.rser.2013.05.073
Kiran, R., and Salehi, S. (2020). “Assessing the relation between petrophysical and operational parameters in geothermal wells: A machine learning approach,” in 45th workshop on geothermal reservoir engineering (Stanford, CA, USA: Stanford University), 1–10.
Langenheim, V. E. (2018). Gravity and physical property data of the northern Harrat Rahat. Saudi Arabia: U.S. Geological Survey data release. doi:10.5066/P9THCSE8
Langenheim, V. E., Ritzinger, B. T., Zahran, H., Shareef, A., and Al-dahri, M. (2019). Crustal structure of the northern Harrat Rahat volcanic field (Saudi Arabia) from gravity and aeromagnetic data. Tectonophysics 750, 9–21. doi:10.1016/j.tecto.2018.11.005
Lashin, A., Chandrasekharam, D., Al Arifi, N., Al Bassam, A., and Varun, C. (2014). Geothermal energy resources of wadi Al-Lith, Saudi Arabia. J. Afr. Earth Sci. 97, 357–367. doi:10.1016/j.jafrearsci.2014.05.016
Liu, Q., Zhang, L., Zhang, C., and He, L. (2016). Lithospheric thermal structure of the North China Craton and its geodynamic implications. J. Geodyn. 102, 139–150. doi:10.1016/j.jog.2016.09.005
Meiburg, E., Radhakrishnan, S., and Nasr-Azadani, M. (2015). Modeling gravity and turbidity currents: Computational approaches and challenges. Appl. Mech. Rev. 67 (4), 1–23. doi:10.1115/1.4031040
Middlemost, E. A. K. (1975). The basalt clan. Earth-science Rev. 11, 337–364. doi:10.1016/0012-8252(75)90039-2
Moufti, M. R., Moghazi, A. M., and Ali, K. A. (2012). Geochemistry and Sr–Nd–Pb isotopic composition of the Harrat Al-madinah volcanic field, Saudi Arabia. Gondwana Res. 21 (2), 670–689. doi:10.1016/j.gr.2011.06.003
Moufti, M. R., and Németh, K. (2016). “Synthesis of the geoheritage values of the volcanic harrats of Saudi Arabia,” in Geoheritage of volcanic harrats in Saudi Arabia. Editors M. R. Moufti, and K. Németh (Springer International Publishing), 181–194. doi:10.1007/978-3-319-33015-0_5
Norden, B., and Forster, A. (2006). Thermal conductivity and radiogenic heat production of sedimentary and magmatic rocks in the Northeast German Basin. AAPG Bull. 90, 939–962. doi:10.1306/01250605100
Nyakundi, E. R., Gitonga, G. J., and K’Orowe, M. O. (2021). Simultaneous modelling of gravity and magnetic data in a measured heat flux area to characterize geothermal heat sources: A case for eburru geothermal complex, Kenya. J. Geoscience Environ. Prot. 9 (5), 40–54. doi:10.4236/gep.2021.95005
Prol-Ledesma, R. M., and Morán-Zenteno, D. J. (2019). Heat flow and geothermal provinces in Mexico. Geothermics 78, 183–200. doi:10.1016/j.geothermics.2018.12.009
Radwan, A. E. (2021). Modeling pore pressure and fracture pressure using integrated well logging, drilling based interpretations and reservoir data in the Giant El Morgan oil Field, Gulf of Suez, Egypt. J. Afr. Earth Sci. 178, 104165. doi:10.1016/j.jafrearsci.2021.104165
Radwan, A. E., Rohais, S., and Chiarella, D. (2021). Combined stratigraphic-structural play characterization in hydrocarbon exploration: A case study of middle miocene sandstones, gulf of suez basin, Egypt. J. Asian Earth Sci. 218, 104686. doi:10.1016/j.jseaes.2021.104686
Rapant, S., Cvečková, V., Fajčíková, K., Sedláková, D., and Stehlíková, B. (2017). Impact of calcium and magnesium in groundwater and drinking water on the health of inhabitants of the slovak republic. Int. J. Environ. Res. Public Health. 14 (3), 278. doi:10.3390/ijerph14030278
Rehman, S. (2005). Saudi Arabian geothermal energy resources—an update. Indonesia: International Geothermal Association Bali, 1–6.
Rehman, S., and Shash, A. (2005). “Geothermal resources of Saudi Arabia–country update report, ” in Proceedings World Geothermal Congress 2005, Antalya, Turkey, April 24–29, 2005, 24–29.
Rezaei, S., Lotfi, M., Afzal, P., Jafari, M. R., and Shamseddin Meigoony, M. (2015). Delineation of Cu prospects utilizing multifractal modeling and stepwise factor analysis in noubaran 1: 100,000 sheet, center of Iran. Arabian J. Geosciences 8, 7343–7357. doi:10.1007/s12517-014-1755-6
Saleh, F., Teodoriu, C., Salehi, S., and Ezeakacha, C. (2020). “Geothermal drilling: A review of drilling challenges with mud design and lost circulation problem,” in 45th workshop on geothermal reservoir engineering (Stanford, CA, USA: Stanford University), 1–8.
Salem, A., Ravat, D., Smith, R., and Ushijima, K. (2005). Interpretation of magnetic data using an enhanced local wavenumber (ELW) method. Geophysics 70, L7–L12. doi:10.1190/1.1884828
Si, J., Li, H., Kuo, L., Pei, J., Song, S., and Wang, H. (2014). Clay mineral anomalies in the Yingxiu–Beichuan fault zone from the WFSD-1 drilling core and its implication for the faulting mechanism during the 2008 Wenchuan earthquake (Mw 7.9). Tectonophysics 619, 171–178. doi:10.1016/j.tecto.2013.09.022
Snyder, N. K., Visser, C. F., Alfred, E., Baker, W., Tucker, J., Quick, R., et al. (2019). Geothermal drilling and completions: Petroleum practices technology transfer. Golden, CO (United States): National Renewable Energy Lab.
Ullah, J., Luo, M., Ashraf, U., Pan, H., Anees, A., Li, D., et al. (2022). Evaluation of the geothermal parameters to decipher the thermal structure of the upper crust of the Longmenshan fault zone derived from borehole data. Geothermics 98, 102268. doi:10.1016/j.geothermics.2021.102268
Xiao, D., Cao, J., Luo, B., Zhang, Y., Xie, C., Chen, S., et al. (2020). Mechanism of ultra-deep gas accumulation at thrust fronts in the Longmenshan Mountains, lower Permian Sichuan Basin, China. J. Nat. Gas Sci. Eng. 83, 103533. doi:10.1016/j.jngse.2020.103533
Zheng, Y., Li, H., and Gong, Z. (2016). Geothermal study at the Wenchuan earthquake Fault Scientific Drilling project-hole 1 (WFSD-1): Borehole temperature, thermal conductivity, and well log data. J. Asian Earth Sci. 117, 23–32. doi:10.1016/j.jseaes.2015.11.025
Keywords: clean energy, geothermal, magnetic, gravity, explosion, petrophysics, volcanic field
Citation: Alqahtani F, Ehsan M, Aboud E, Abdulfarraj M and El-Masry N (2023) Integrated approach using petrophysical, gravity, and magnetic data to evaluate the geothermal resources at the Rahat Volcanic Field, Saudi Arabia. Front. Earth Sci. 11:1135635. doi: 10.3389/feart.2023.1135635
Received: 01 January 2023; Accepted: 06 March 2023;
Published: 21 March 2023.
Edited by:
Nima Mohamadian, Islamic Azad University, IranReviewed by:
Karoly Nemeth, Institute of Earth Physics and Space Sciences, HungaryTareq Abdallatif, National Research Institute of Astronomy and Geophysics, Egypt
Souvik Sen, Halliburton Inc., United States
Shabbir Ahmad, China University of Geosciences Wuhan, China
Copyright © 2023 Alqahtani, Ehsan, Aboud, Abdulfarraj and El-Masry. This is an open-access article distributed under the terms of the Creative Commons Attribution License (CC BY). The use, distribution or reproduction in other forums is permitted, provided the original author(s) and the copyright owner(s) are credited and that the original publication in this journal is cited, in accordance with accepted academic practice. No use, distribution or reproduction is permitted which does not comply with these terms.
*Correspondence: Faisal Alqahtani, ZmFscWFodGFuaUBrYXUuZWR1LnNh
 Faisal Alqahtani
 Muhsan Ehsan
 Essam Aboud
 Murad Abdulfarraj1,2
 Nabil El-Masry
